 Chiara Mele1*
 Stefania Mai2
 Tiziana Cena1Loredana Pagano3
 Massimo Scacchi4,5
 Bernadette Biondi6
 Gianluca Aimaretti1
 Paolo Marzullo1,2
- 1Department of Translational Medicine, University of Piemonte Orientale, Novara, Italy
- 2Istituto Auxologico Italiano, IRCCS, Laboratory of Metabolic Research, S. Giuseppe Hospital, Piancavallo, Italy
- 3Division of Endocrinology, Diabetology and Metabolism, Department of Medical Sciences, University of Turin, Turin, Italy
- 4Istituto Auxologico Italiano, IRCCS, Division of General Medicine, S. Giuseppe Hospital, Piancavallo, Italy
- 5Department of Clinical Sciences and Community Health, University of Milan, Milan, Italy
- 6Department of Clinical Medicine and Surgery, University of Naples Federico II, Naples, Italy
Purpose: A multifold association relates the hypothalamo-pituitary-thyroid axis to body weight. The potential underlying mechanisms are incompletely understood. Further, the mild severity of obesity and the small proportion of individuals with obesity in so far published cohort studies provide little insights on metabolic correlates of thyroid function in obesity.
Methods: We retrospectively enrolled 5009 adults with obesity (F/M, 3448/1561; age range, 18-87 years; BMI range, 30.0-82.7 kg/m2), without known thyroid disease in a study on TSH and fT4 levels, lipid profile, glucose homeostasis and insulin resistance, anthropometric parameters including BIA-derived fat mass (%FM) and fat-free mass (FFM).
Results: The overall reference interval for TSH in our obese cohort was 0.58-5.07 mIU/L. As subgroups, females and non-smokers showed higher TSH levels as compared to their counterparts (p<0.0001 for both), while fT4 values were comparable between groups. There was a significant upward trend for TSH levels across incremental BMI classes in females, while the opposite trend was seen for fT4 levels in males (p<0.0001 for both). Expectedly, TSH was associated with %FM and FFM (p<0,0001 for both). TSH and fT4 showed correlations with several metabolic variables, and both declined with aging (TSH, p<0.0001; fT4, p<0.01). In a subgroup undergoing leptin measurement, leptin levels were positively associated with TSH levels (p<0.01). At the multivariable regression analysis, in the group as a whole, smoking habit emerged as the main independent predictor of TSH (β=-0.24, p<0.0001) and fT4 (β=-0.25, p<0.0001) levels. In non-smokers, %FM (β=0.08, p<0.0001) and age (β=-0.05, p<0.001) were the main significant predictors of TSH levels. In the subset of nonsmokers having leptin measured, leptin emerged as the strongest predictor of TSH levels (β=0.17, p<0.01).
Conclusions: Our study provides evidence of a gender- and smoking-dependent regulation of TSH levels in obesity.
Introduction
The relationship between obesity and thyroid function is complex and bidirectional. Thyroid dysfunctions can influence changes in body weight due to the well-known control exerted by thyroid hormones on thermogenesis and calorie ingestion (1, 2). In the last few decades, however, growing evidence accumulated on the ability of obesity to promote per se changes in circulating markers of thyroid function (3–14). Cross-sectional and longitudinal studies have shown that increasing bodyweight associates with subsequent increments in TSH within the normal range (3–14), with accumulation of visceral adipose tissue rather than metabolic impairment driving this association (8, 15, 16). It has been suggested that up to 25% of subjects with obesity can harbor moderately elevated TSH concentrations, usually below the threshold of 10 µIU/mL, devoid of underlying thyroid disease (13, 17). With regards to thyroid hormones, in obesity free triiodothyronine (fT3) levels tend to increase (17–19), while fT4 levels tend to decline with increasing body weight (13, 20, 21). Further, changes in thyroid function, even within the normal range, have been claimed to contribute per se to the onset of the metabolic syndrome, such that an association has been reported between circulating TSH and visceral obesity, dyslipidemia, insulin resistance, hypertension and non-alcoholic fatty liver disease (NAFLD) (22–25).
The process underlying this interaction is complex and involves the influence of adipose tissue on the hypothalamus-pituitary-thyroid (HPT) axis through a loop that is mediated by leptin and is critical for thyroid modulation of energy homeostasis (26). Leptin controls the TRH gene promoter in the hypothalamic paraventricular nucleus (27, 28) and acts directly and indirectly to increase the production of α-melanocyte stimulating hormone (α-MSH), the ligand of the melanocortin receptor-4 (MC4R) (29). Thus, in condition of positive energy balance, leptin intervenes to upregulate the HPT axis and stimulate the central activation of the melanocortin pathway to promote energy expenditure (30, 31). In humans, TSH has been repeatedly shown to correlate with circulating leptin (6, 12), with smoking playing a potential role in this association (32).
So far, cohort studies have included limited proportions of obese persons and with moderate degree of obesity, thus it remains difficult to draw definitive conclusions on global correlates of thyroid function parameters in all degrees of obesity. Further, lack of adjustment for important covariates limits the strength of the reported associations between thyroid and adiposity parameters (4, 11–13, 18, 33, 34).
The current retrospective study was primarily designed to investigate the pattern of TSH and FT4 levels across different BMI ranges in a large cohort of euthyroid patients with obesity. Secondary aims of the study were to explore the metabolic correlates of thyroid function, as well as the influence of covariates on thyroid function parameters. In a subgroup, we lastly aimed to assess the role of serum leptin on circulating TSH and FT4 levels.
Patients and methods
Patients
Of 6412 consecutive de novo patients admitted between 7 January 2014 and 30 September 2018 to our institution for workup and rehabilitation of obesity, 5009 euthyroid adults were included in the study (3448 females/1561 males; age, 50.0 ± 15.2 years; body mass index (BMI), 44.3 ± 7.4 kg/m2). Exclusion criteria were the presence of previously known or unknown thyroid dysfunction or Hashimoto’s thyroiditis; any morbidity potentially affecting thyroid function parameters including acute illnesses and/or acute inflammation and/or chronic conditions; any endocrine disorders; use of levothyroxine (LT4) or triiodothyronine (T3) or medications potentially interfering with thyroid function (such as amiodarone, steroids, or lithium carbonate therapy); pregnancy. In all patients, body weight was stable at least for three months or longer prior to study enrolment.
The investigation was approved by the local ethics committee, functioning according to the fourth edition of the Guidelines on the Practice of Ethics Committees in Medical Research With Human Participants on admission, and written consent was obtained from all patients.
Body measurements
Body measurements were conducted on fasting patients wearing light underwear. Weight and height were measured to the nearest 0.1 kg and 0.1 cm, respectively, and BMI was expressed as body mass (kg)/height (m2). The criterion for obesity was BMI ≥ 30 kg/m2.
Waist circumference (WC) was measured midway between the lowest rib and the top of the iliac crest after gentle expiration.
Bioimpedance analysis (BIA, 101/S Akern; Florence, Italy) allowed measurement of percent fat mass (%FM) and fat-free mass (FFM, kg). Methodology, variation coefficients, and exclusion criteria have been detailed previously (35).
Laboratory tests
Undiluted serum samples were assayed in duplicate for fT4 and TSH using an automated chemiluminescence assay system (Immulite 2000; DPC, Los Angeles, CA). The principle of the method is a two-site, solid-phase chemiluminescent immunometric assay or competitive immunoassay. Normal values for TSH are 0.27–4.20 mIU/L, and for fT4 9.0-17.0 pg/mL.
Routine laboratory data included glucose, total cholesterol (CHO), high-density (HDL) and low-density lipoprotein (LDL) cholesterol and triglycerides (TG) measured by enzymatic methods (Roche Diagnostics, Mannheim, Germany).
Insulin levels were measured using a Cobas Integra 800 Autoanalyzer (Roche Diagnostics, Indianapolis, IN, USA), and insulin resistance was expressed as homeostatic model assessment of insulin resistance (HOMA-IR) [insulin (mIU/L) x glucose (mmol/L)/22.5]. HOMA-IR cutoff for insulin resistance was 2.5 (36). Type 2 diabetes mellitus (T2DM) was ascertained by patients’ history and/or biochemistry analyses on admission according to current guidelines (37).
In a subgroup of 502 patients, we measured serum leptin levels by commercial Linco RIA kit (Linco, St. Louis, MO) having detection limit of 0.15 μg/liter, intraassay coefficients of variation (CVs) of 2.2% at 6 μg/liter, 2.7% at 25 μg/liter, and 5.9% at 62.8 μg/liter and interassay CVs of 4.3, 4, and 6.9% at the concentration of 5.1, 21, and 56.2 μg/liter, respectively.
Statistical analysis
Statistical analysis was performed using SPSS version 21 (Somers, NY, USA). Values are expressed as means ± standard deviation (SD) or percentage. Data points not normally distributed obtained by the Shapiro–Wilk test were log-transformed to improve the symmetry and homoscedasticity of the distribution. For comparative analysis, univariate ANOVA between groups were used. Repeated Measures ANOVA was used to evaluate comparison of TSH and fT4 levels within BMI stratification classes, and Hyun-Feldt correction was applied when the assumption of sphericity, tested using Mauchly’s test, was violated. Pearson’s correlation analysis and the Chi square were used to identify significant associations between variables of interest. Stepwise multivariable regression analysis was used to evaluate the independent association of TSH or fT4 levels with metabolic, anthropometric or biochemical parameters. The multilinear model included several combinations of independent variables encompassing age, gender, smoking habit, BMI, WC, WHR, lipid panel, body composition and leptin levels. β coefficients and related significance values obtained from the models are reported. P < 0.05 was considered as statistically significant.
Results
Clinical and biochemical characteristics of patients
The population characteristics are summarized in Table 1. Females accounted for 68.8% of the cohort (male-to-female ratio, 1:2.2). Overall, BMI was ≥40.0 kg/m2 in 71.3%, >35.0 to 39.9 kg/m2 in 21.1%, >30.0 to 34.9 kg/m2 in 7.6% of cases. Among those classified as severely obese (≥40.0 kg/m2), 25.9% had a BMI ≥50.0 kg/m2 (Figure 1).
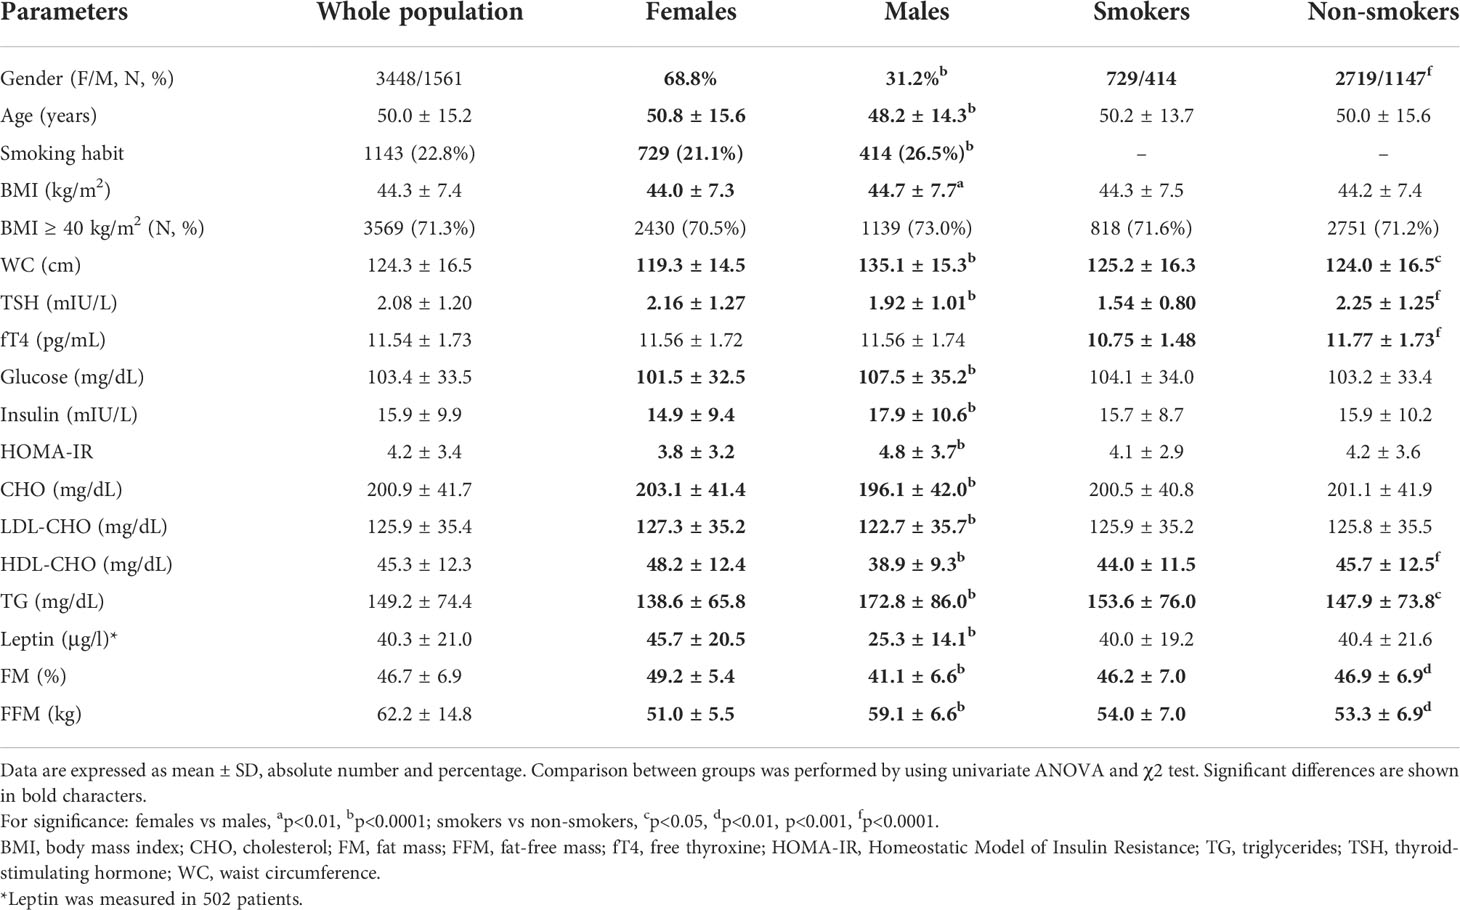
Table 1 Summary of anthropometric and metabolic variables in the population as a whole and subgrouped according to gender and smoking habit.
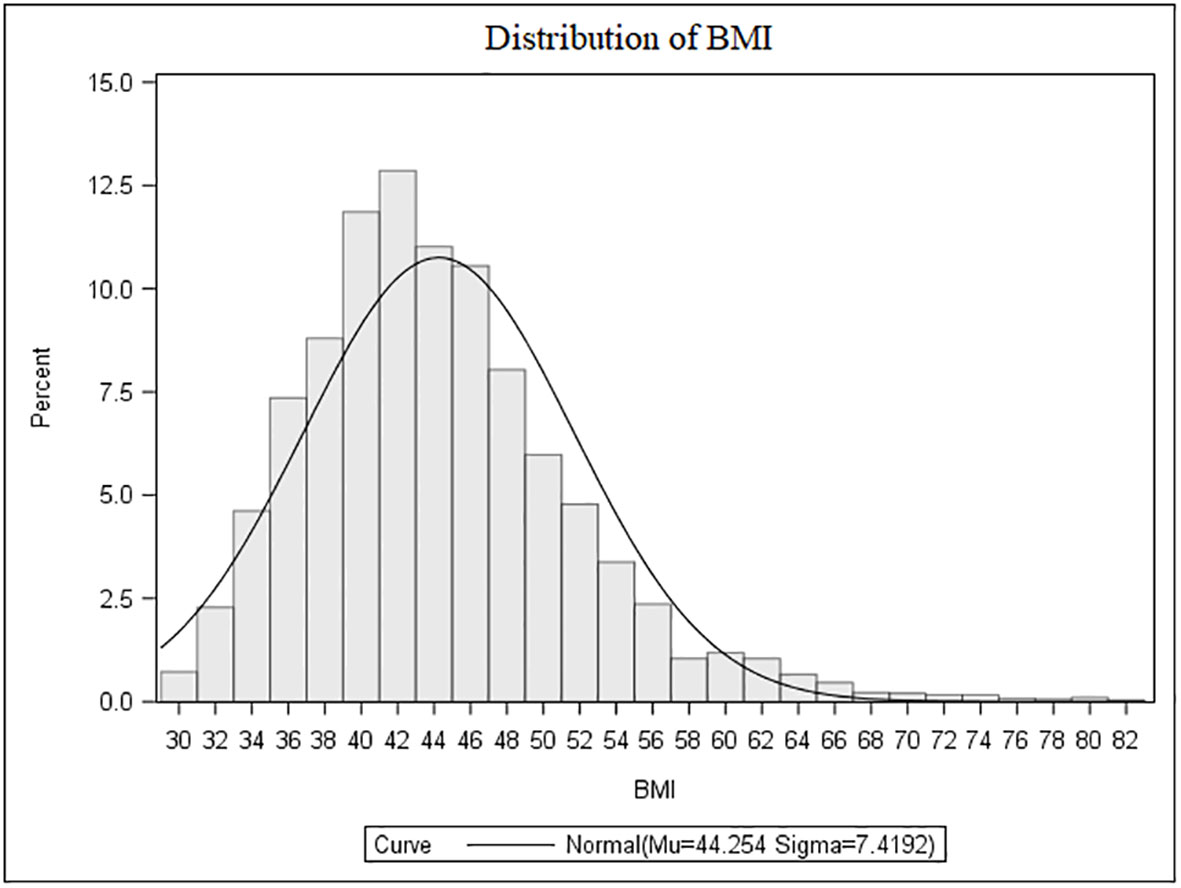
Figure 1 Distribution of BMI values in the whole population.
The distribution of TSH and fT4 levels in the entire population are shown in Figure 2. Mean TSH and fT4 levels were 2.08 ± 1.20 mIU/L and 11.54 ± 1.73 pg/mL, respectively. The 2.5th-97.5th percentile interval for TSH was 0.58-5.07 mIU/L, and 276 subjects (5.5%) had their TSH above the upper limit of the normal immunoassay range. In this subset, TSH values were 5.4 ± 1.1 mIU/L. In 264 subjects (5.3%), fT4 values were below the normal range (mean ± SD, 8.5 ± 0.4 pg/mL). All patients with low fT4 had their TSH in the normal immunoassay range and viceversa, and anti-thyroid antibodies were negative in all patients with altered TSH and fT4 concentrations. There were, as expected, metabolic differences according to gender as well as smoking habit. As subgroups, females had higher TSH levels than males (p<0.0001), and smokers had lower TSH and fT4 levels compared to their counterpart (p<0.0001 for both).
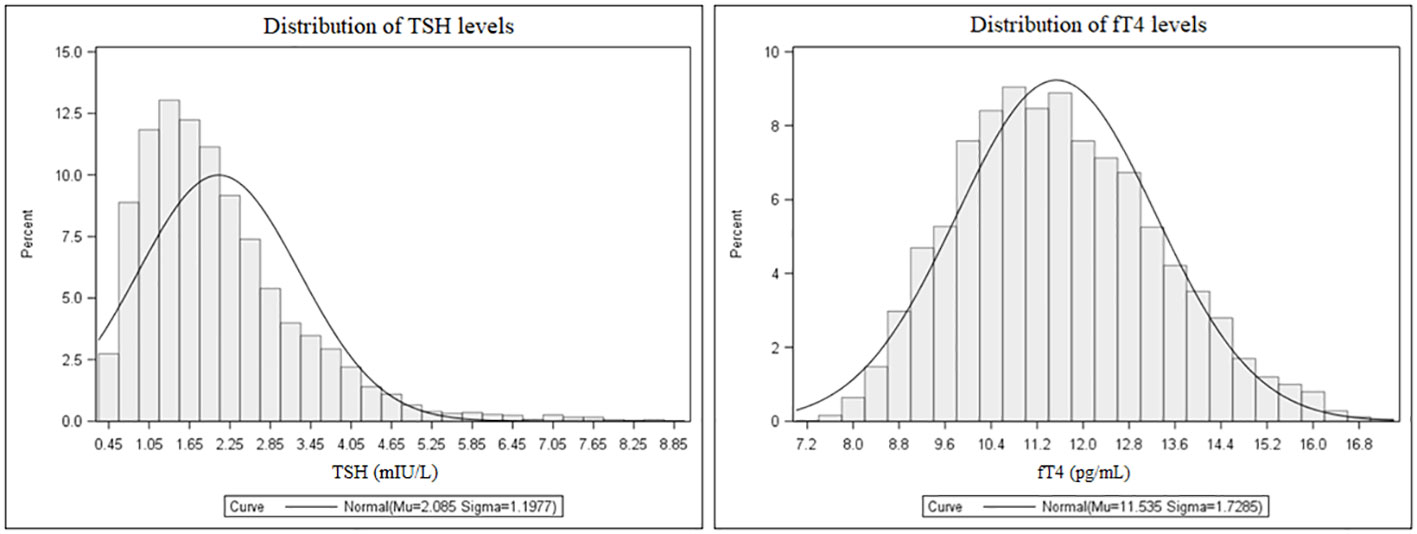
Figure 2 Distribution of TSH (left) and fT4 levels (right) in the whole population.
Stratification by BMI (Table 2 and Figure 3) revealed a significant upward trend for TSH (F=6.46, p<0.0001) and a significant downward trend for fT4 levels across five incremental BMI classes (F=5.53, p<0.0001). With BMI class 1 as reference, TSH increased by 0.03 mIU/L (p=0.43) in class 2, 0.15 mIU/L (p<0.05) in class 3, 0.29 mIU/L (p<0.001) in class 4, and 0.22 mIU/L (p<0.05) in class 5. In parallel, fT4 decreased by 0.21 pg/mL (p<0.05) in BMI class 2, 0.35 pg/mL (p<0.001) in class 3, 0.45 pg/mL (p<0.0001) in class 4, and 0.41 pg/mL (p<0.01) in class 5 compared to BMI class 1. In gender-based analysis (Figure 4), females exhibited a significant upward trend for TSH (F=5.09, p<0.0001), which approached statistical significance also in males (F=2.30, p=0.06). Contrariwise, a decrease in fT4 was only seen in males (F=13.50, p<0.0001) and not in females (F=0.62, p=0.65) across BMI classes.
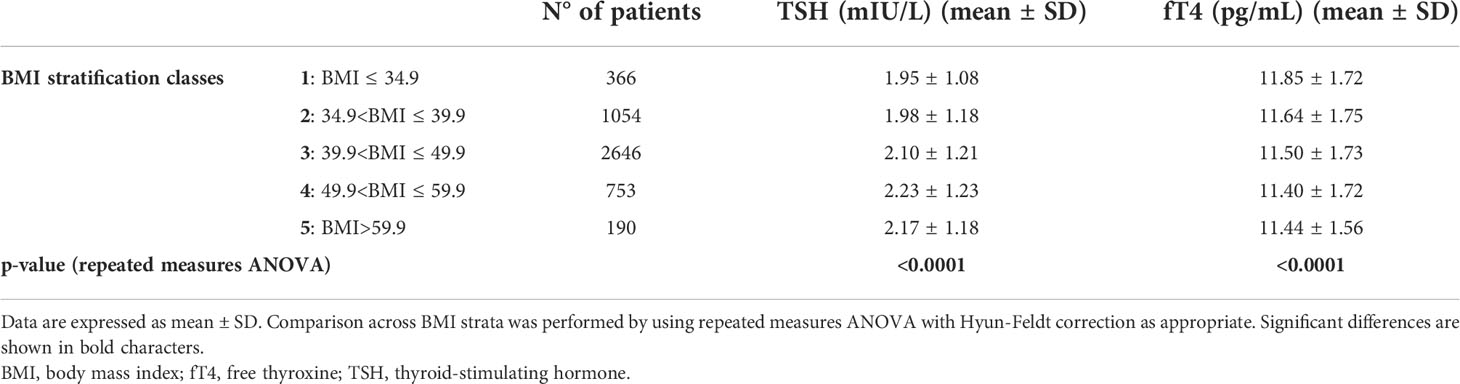
Table 2 TSH and fT4 levels in the study population according to BMI stratified in 5 classes.
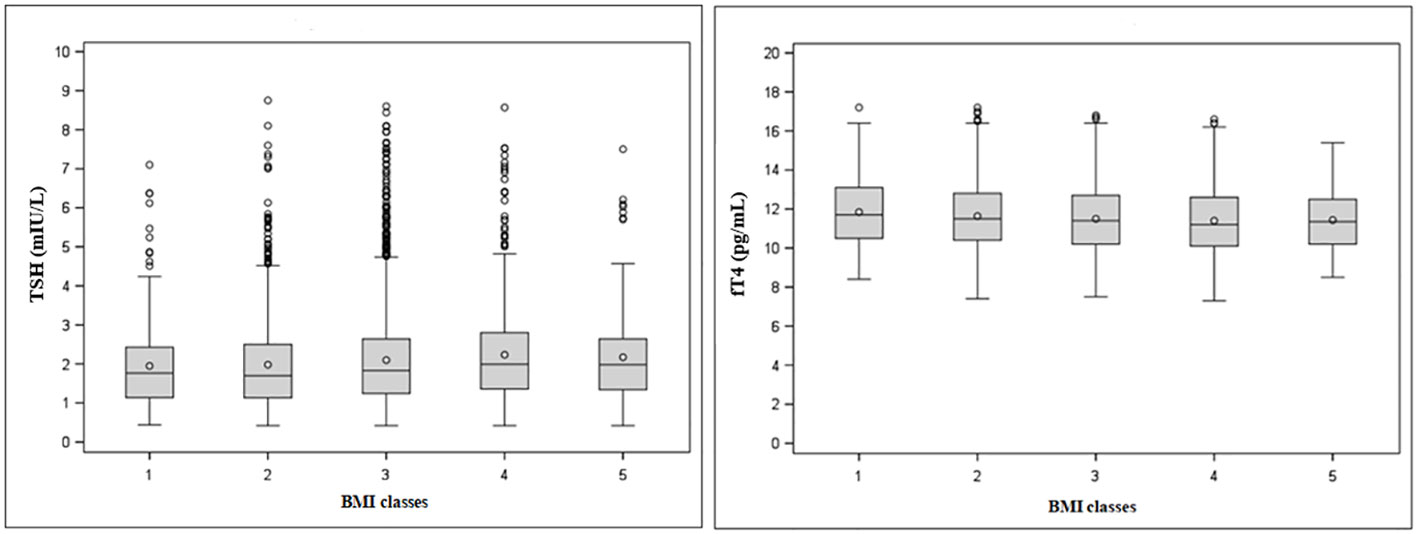
Figure 3 Tukey’s box-and-whisker plot of TSH (left) and fT4 levels (right) according to BMI classes. Outliers are plotted as individual points.
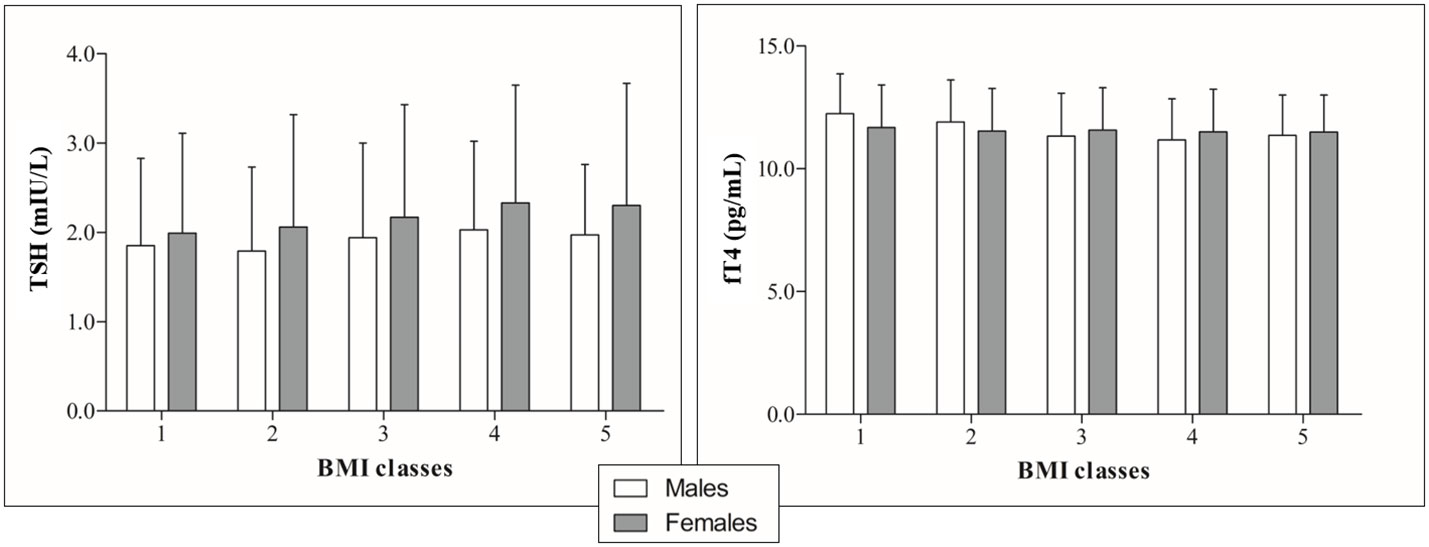
Figure 4 TSH (right) and fT4 profiles (left) by incremental BMI classes in the population subgrouped according to gender.
In restricting the analysis to patients with extreme obesity (BMI>50 kg/m2), which represented 18.4% of the entire population, TSH levels appeared to plateau as compared to the lower BMI class. In this BMI class, not only TSH levels differed between females and males (2.31 ± 1.33 vs. 2.01 ± 0.94 mIU/L, p<0.001), but the same occurred also for fT4 levels (11.51 ± 1.70 vs. 11.21 ± 1.65 pg/mL, p=0.02).
Correlation and regression analyses
TSH and fT4 levels were tested in relation to demographic, anthropometric and metabolic parameters (Table 3). TSH but not fT4 levels were significantly correlated to body measures, particularly %FM and FFM. Both thyroid parameters were related to several metabolic variables, but the strongest association was seen in relation to the smoking habit. After controlling for BMI, age, gender and smoking habit, these associations remained all significant except for that relating TSH to insulin and HDL levels, and between fT4 and WC.
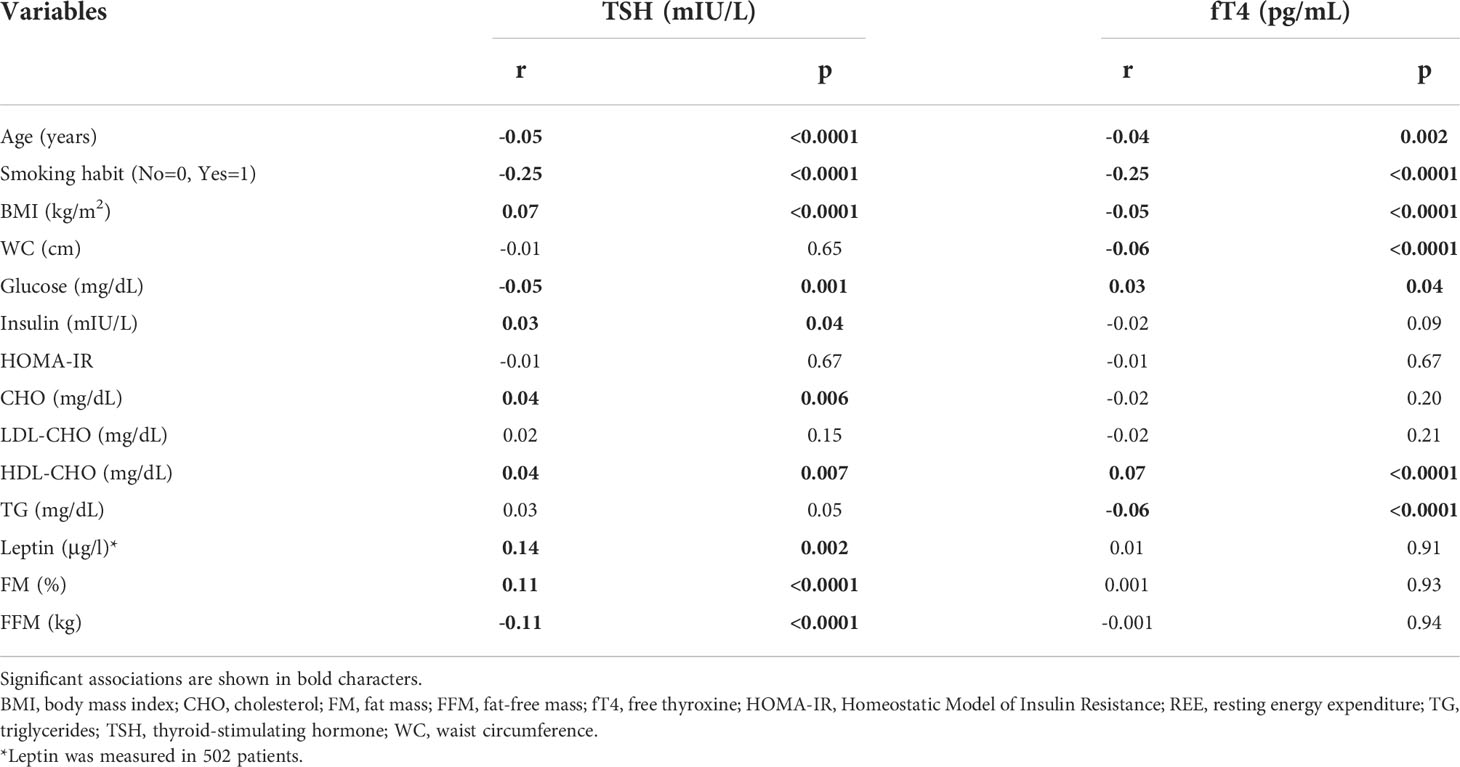
Table 3 Bivariate correlation analysis between serum TSH or fT4 levels and demographic, anthropometric, biochemical and metabolic variables.
Age was negatively associated both with TSH (r=-0.05, p<0.0001; Figure 5) and fT4 levels (r=-0.04, p<0.01), also after controlling for BMI, gender, smoking habit, %FM and FFM (TSH: r=-0.06, p<0.0001; fT4: r=-0.05, p<0.01).
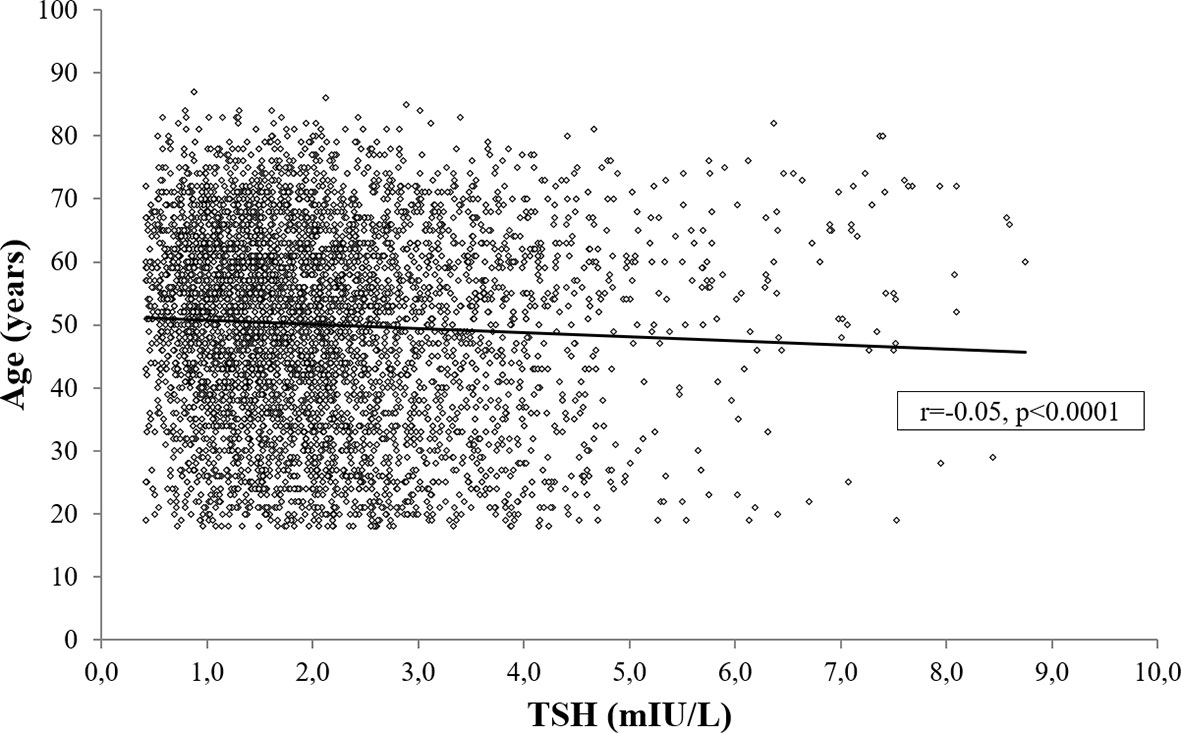
Figure 5 Bivariate correlation analysis between serum TSH and age.
In a subset of 502 subjects with age, gender and BMI distribution comparable to the study cohort (Age, 48.6 ± 14.8 years; Sex, M/F:133/369; BMI, 43.6 ± 7.4 kg/m2), we measured leptin levels and documented its positive association with TSH (r=0.14 p<0.01) (Figure 6), which was unchanged after controlling for BMI, age, gender and smoking habit (r=0.11, p=0.01).
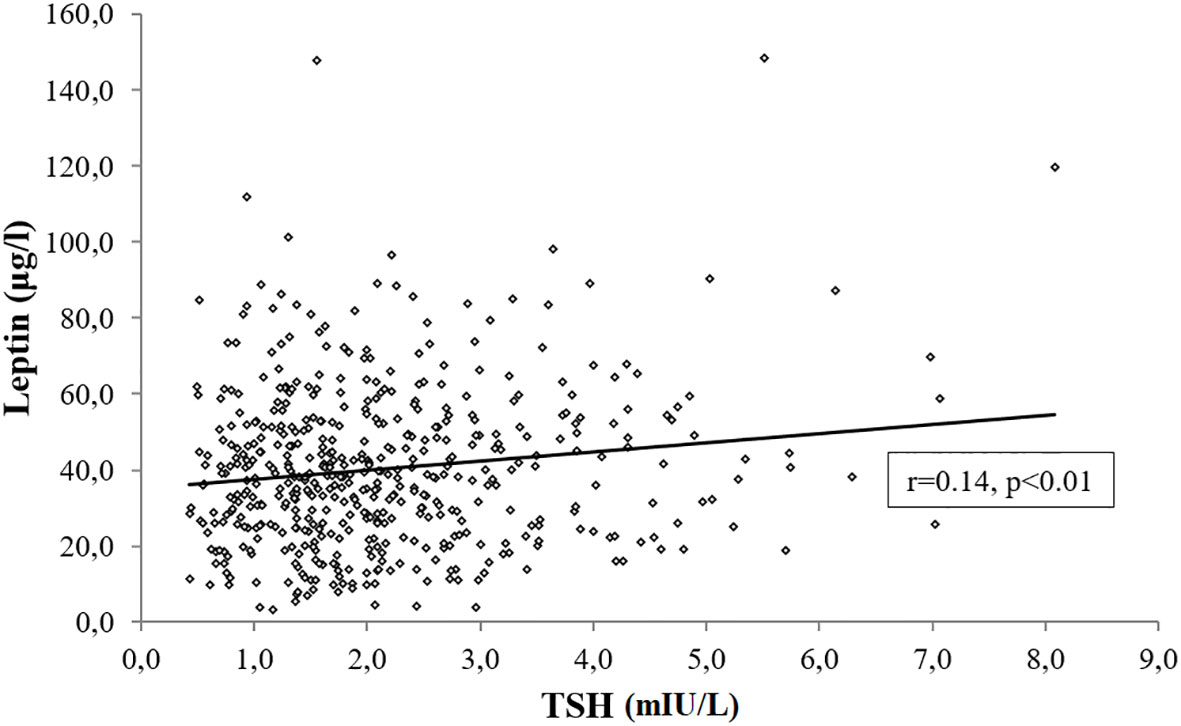
Figure 6 Bivariate correlation analysis between TSH and leptin levels in 502 subjects.
Multivariable linear regression models were built to identify the independent predictors of TSH and fT4 levels in the population as a whole. Due to the overlap between BMI and measures of body composition, these latter were used for the regression model based on the higher significance achieved at the bivariate correlation analysis. The model achieving the highest coefficient of determination (R2) included age, gender, smoking habit and FM as independent variables (Table 4). Smoking habit emerged as the main independent predictor of TSH (β=-0.24, p<0.0001) and fT4 (β=-0.25, p<0.0001) levels. Other independent predictors included age (TSH: β=-0.06, p<0.0001, fT4: β=-0.04, p<0.0001), FM (TSH: β=0.09, p<0.0001) and female gender (TSH: β=0.03, p<0.05).
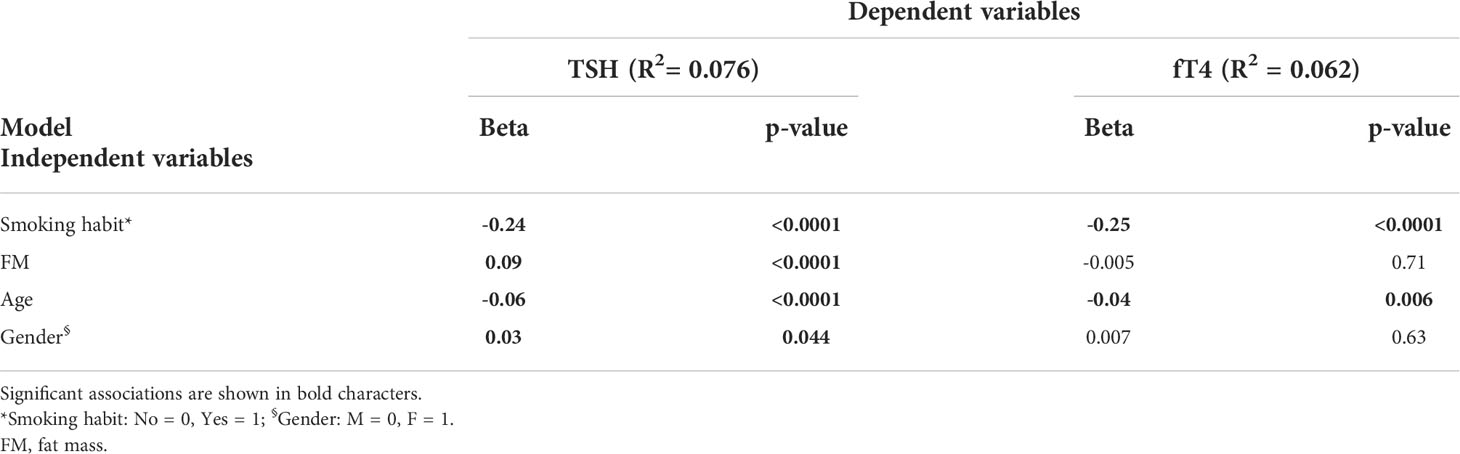
Table 4 Multivariable linear regression analysis showing independent predictors for TSH and fT4 levels.
Considering the impact of smoking, we further analyzed only non-smokers and documented that %FM (β=0.08, p<0.0001), age (β=-0.05, p<0.001) and female gender (β=0.06, p<0.01) were independent predictors of TSH, while age was the only predictor of fT4 levels (β=-0.04, p<0.05).
We lastly tested the subset of patients having the leptin levels measured and found that leptin (β=0.11, p<0.05) and smoking habit (β=-0.30, p<0.0001) were independent predictors of TSH levels (Table 5), while fT4 was predicted by age (β=0.10, p<0.05) and smoking status (β=-0.19, p<0.0001) (Table 5). In this subgroup, an analysis restricted to non-smokers showed that leptin was the only independent predictor of TSH levels (β=0.17, p<0.01).
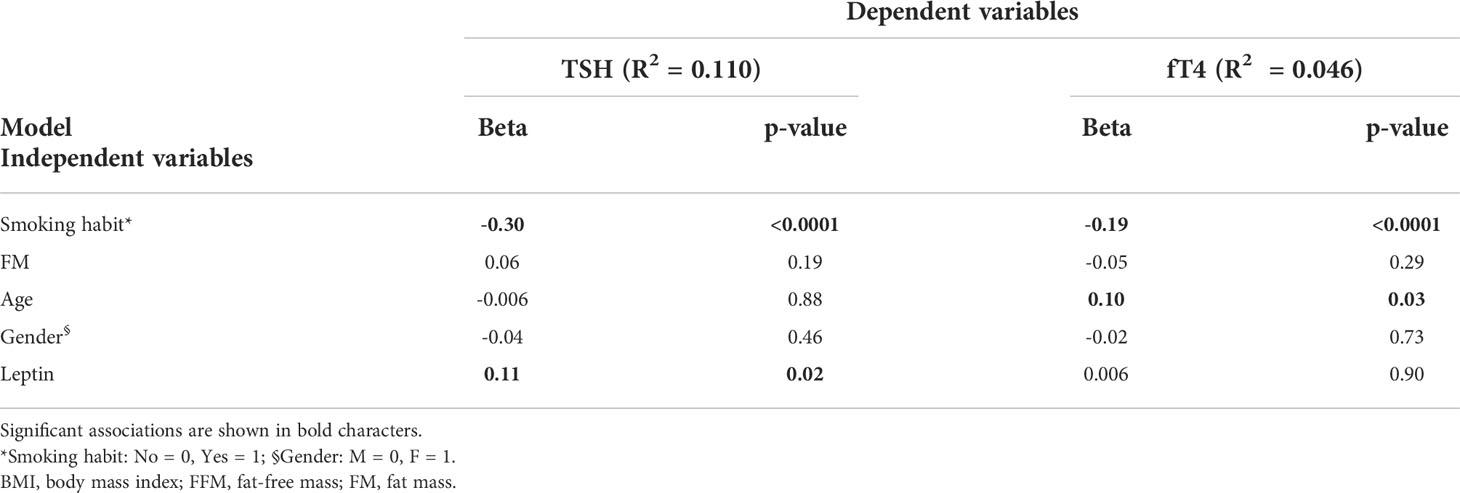
Table 5 Multivariable linear regression analysis showing independent predictors for TSH and fT4 levels in the subgroup of patients with leptin measured.
Discussion
The present study evaluated profiles and metabolic correlates of TSH and fT4 in the largest cohort of people with obesity spanning a very wide range of BMIs. Current data show an upward trend of TSH in females and a downward trend of fT4 levels in males across incremental BMI classes. A declining trend for TSH and fT4 was noticed with increasing age, and both correlated with metabolic variables. Smoking was a strongly associated with circulating TSH and fT4 levels. In non-smokers, %FM, age and gender were significant predictors of TSH. In a patient subset undergoing leptin measurement, leptin and %FM emerged as the strongest predictors of TSH levels.
Obesity is associated with changes in the secretion pattern of several hormones (38) and causes slight increments in TSH levels even above the TSH normalcy threshold devoid of underlying thyroid dysfunction (3, 4, 11–13, 18, 33, 34). A global analysis of the determinants of thyroid function parameters in this condition remains elusive due to generally limited study samples, underrepresentation of severe degrees of obesity, exclusion of subtle covariates such as age, smoking status, gender and leptin levels, as well as inclusion of individuals with thyroid disease.
In a large group of subjects with obesity apparently free of thyroid dysfunction, mean TSH levels were 2.08 mIU/L and the reference range was 0.58-5.07 mIU/L (2.5–97.5 centiles). Compared to general population data, such figures are clearly shifted to higher values. In the NHANES III study of 13,344 people considered free of thyroid disorders, median TSH levels were 1.39 mIU/L with a reference range of 0.45–4.12 mIU/L, and a relatively long tail towards higher values (39). Likewise, a German population study of 1,488 subjects without ultrasonographic evidence of thyroid disease obtained median TSH levels of 0.76 mIU/L and a reference interval of 0.25–2.12 mIU/L (40). Also, two Danish studies performed in areas with mild-moderate iodine deficiency reported reference TSH intervals of 0.40–3.6 mIU/L (41) and 0.58-4.07 mIU/L (42), while a study in 58,684 disease-free subjects from mainland China proved that ethnicity can influence TSH, with reference interval being 0.74-7.04 mIU/L and a long tail toward high TSH values (43). It is recognized that more sensitive TSH assays, more accurate thyroid antibody tests, and a more accurate selection of the reference population allowed a progressive reduction of the upper TSH reference limit over the last decade (44). This circumstance raised a debate on the opportunity to rank the upper normal TSH at 2.5 mIU/L (44–47), which would lead to classify 28% of our patients as TSH-abnormal against the 5.5% rate noticed here. The peculiarity of studying patients with extreme obesity also allowed us to realize that the direct correlation between TSH and BMI at high BMIs is not linear, i.e. above a very high BMI threshold the levels of TSH does not seem to increase further.
With regards to metabolic determinants, both TSH and fT4 levels were correlated with differing metabolic variables, yet an impact of body composition, insulin and total cholesterol levels appeared only significant for TSH. This confirms evidence obtained in the euthyroid general population, suggesting that TSH and fT4 concentrations are associated with divergent metabolic markers and the combined use of TSH and fT4 is a more convenient approach to evaluate the association between thyroid function and metabolic variables (48). Accumulation of fat mass is an intrinsic determinant of changes in thyroid hormones homeostasis (6, 8, 12, 16, 20). It has been suggested that TSH elevation could reflect an adaptive response of the thyrotropic axis to increase energy expenditure, thus reducing weight excess (34). However, if the increase in TSH levels was the primary event of this response, an increase in serum thyroid hormones would also be expected. On the contrary, our results showed normal fT4 levels in the vast majority of our cases. To explain this finding, it should be considered that the thyroxine turnover rate is proportional to body size. Thus, an increased rate of thyroid hormone disposal resulting from a large body size could potentially constitute the causative event promoting the activation of the thyrotropic axis aimed at maintaining serum thyroid hormones within the normal range (34). In addition, some studies reported a moderate increase in total T3 or fT3 in patients with obesity (17–19). Progressive central fat accumulation has been found to be associated with an increase in TSH and fT3 levels irrespective of insulin sensitivity and metabolic variables. This finding could suggest a high conversion of T4 in T3 caused by an increase in deiodinase activity as a compensatory mechanism for fat accumulation to improve energy expenditure (18).
In this cohort, women had higher TSH levels, as well as higher adiposity and leptin levels than men. Literature data show conflicting results on the relation between TSH and gender, and most studies reported overlapping TSH levels between genders (43, 49–52), while others described either lower (53) or higher TSH levels (54) in females compared to males. The mechanism underlying this gender-based difference in TSH remains unclear. Animal studies provided controversial results, since estradiol administration increased the number of pituitary TRH binding sites and reversed the inhibitory thyroxine effect on TSH response to TRH (55), but caused no change in pituitary TSH content and serum TSH levels in euthyroid and untreated hypothyroid rats (56). Because gender-dependent divergences in fat mass and leptin levels were seen and both associate positively with TSH levels, we hypothesize the potential intervention of leptin, which is recognized to be gender-dependent (57) and is able to stimulate the HPT axis and TSH secretion (58). Hyper-leptinaemia could explain the high TSH levels seen in obesity, while estradiol stimulation of leptin (59) could represent the biological basis for gender differences of TSH levels in this cohort.
Smoking status was an independent predictor of low TSH and fT4 levels. Smoking status is known to influence thyroid function parameters (60, 61), body weight (62) and the association between TSH and BMI (10, 14, 32, 60, 63, 64). Potential mediators of the effects of smoking on thyroid function involve: 1) the sympathetic stimulation of thyroid hormone synthesis and release (64); 2) the inhibition of sodium-iodide symporter mediated by thiocyanate, a cyanide-transformation product (65); 3) increased type 2 deiodinase activity (66). Our study suggests, however, that the influence of smoking on TSH does not interfere on TSH relationship with body weight. We thus hypothesize that even in obesity smoking promotes non-physiological changes in thyroid function, with potential metabolic consequences that remain to be investigated.
With regards to the negative relationship herein observed between thyroid function parameters and age, our finding contrasts with previous longitudinal studies showing that aging is associated with increasing serum TSH concentrations devoid of changes in fT4 levels (39, 67). While this latter evidence suggests the involvement of age-dependent alterations in TSH set-point and/or lower pituitary sensitivity to thyroid hormones and/or or reduced TSH bioactivity rather than occult thyroid disease (68), our findings agree with previous findings of declining TSH levels with aging documented in the general population (69–72). Some argued that, in case of insufficient or borderline-sufficient iodine intake, a decrease in serum TSH throughout life could reflect a late compensatory condition of thyroid autonomy (70). Others suggested that age modifies the pituitary set-point, based on the evidence that TSH secretion decreases in response to TRH in aging individuals and that TSH response to decreased thyroid hormone concentrations is impaired in older adults, thus implying some form of age-induced thyrotropic cell insensitivity (71, 72). Alternatively, based on aging effects on body composition and fat compartmentalization from subcutaneous to visceral sites (73), serum leptin levels and/or its pattern of secretion may change with age (57, 74–76) and hamper the central control of TRH and TSH secretion. In addition, some authors hypothesized a condition of leptin resistance associated with an increase of systemic inflammation that could contribute to alter the hypothalamus set-point (77). Finally, it is worth mentioning that an impairment of peripheral 5’-deiodinase and an increase in reverse 3,5,3’-triiodothyronine due to non-thyroidal illness are argued to intervene in the relationship between thyroid function and age (69).
Our study illustrates adiposity and metabolic determinants of TSH levels in a large cohort of patients with obesity. Given its retrospective nature, this study has a number of limitations that include the lack of fT3 measurement and the inability to assess mechanisms responsible for observed associations. Iodine status remains a major determinant of reference intervals for TSH, thus it remains to be established whether TSH elevation in obesity may result from impaired iodine intake or other nutritional causes since iodine deficiency, more than adequate or excess iodine, is a risk factor for hyperthyrotropinemia (78, 79).
In conclusion, our study in a large population with obesity established that TSH levels show an upward trend with increasing degree of obesity in females and leptin levels emerged as the main metabolic determinant of thyroid function parameters in obesity.
Data availability statement
The original contributions presented in the study are included in the article/supplementary material. Further inquiries can be directed to the corresponding author.
Ethics statement
The studies involving human participants were reviewed and approved by Ethics Committee of Istituto Auxologico Italiano. The patients/participants provided their written informed consent to participate in this study.
Author contributions
CM and PM designed the study and draft the manuscript; CM, PM, LP, and BB interpreted the results and contributed to the discussion; CM, SM, and TC collected and analyzed data; GA, MS, and BB contributed to analyze data and reviewed the manuscript; GA and PM reviewed and edited the manuscript. All authors contributed to the article and approved the submitted version.
Funding
Research founded by the Italian Ministry of Health (18C101_2011).
Conflict of interest
The authors declare that the research was conducted in the absence of any commercial or financial relationships that could be construed as a potential conflict of interest.
Publisher’s note
All claims expressed in this article are solely those of the authors and do not necessarily represent those of their affiliated organizations, or those of the publisher, the editors and the reviewers. Any product that may be evaluated in this article, or claim that may be made by its manufacturer, is not guaranteed or endorsed by the publisher.
References
1. Iwen KA, Oelkrug R, Brabant G. Effects of thyroid hormones on thermogenesis and energy partitioning. J Mol Endocrinol (2018) 60:R157–70. doi: 10.1530/JME-17-0319
2. Mullur R, Liu YY, Brent GA. Thyroid hormone regulation of metabolism. Physiol Rev (2014) 94:355–82. doi: 10.1152/physrev.00030.2013
3. Kitahara CM, Platz EA, Ladenson PW, Mondul AM, Menke A, Berrington de González A. Body fatness and markers of thyroid function among U.S. men and women. PloS One (2012) 7:e34979. doi: 10.1371/journal.pone.0034979
4. Knudsen N, Laurberg P, Rasmussen LB, Bülow I, Perrild H, Ovesen L, et al. Small differences in thyroid function may be important for body mass index and the occurrence of obesity in the population. J Clin Endocrinol Metab (2005) 90:4019–24. doi: 10.1210/jc.2004-2225
5. Pearce EN. Thyroid hormone and obesity. Curr Opin Endocrinol Diabetes Obes (2012) 19:408–13. doi: 10.1097/MED.0b013e328355cd6c
6. Bétry C, Challan-Belval MA, Bernard A, Charrié A, Drai J, Laville M, et al. Increased TSH in obesity: Evidence for a BMI-independent association with leptin. Diabetes Metab (2015) 41:248–51. doi: 10.1016/j.diabet.2014.11.009
7. Lambrinoudaki I, Armeni E, Rizos D, Georgiopoulos G, Athanasouli F, Triantafyllou N, et al. Indices of adiposity and thyroid hormones in euthyroid postmenopausal women. Eur J Endocrinol (2015) 173:237–45. doi: 10.1530/EJE-15-0141
8. Ren R, Jiang X, Zhang X, Guan Q, Yu C, Li Y, et al. Association between thyroid hormones and body fat in euthyroid subjects. Clin Endocrinol (Oxf) (2014) 80:585–90. doi: 10.1111/cen.12311
9. Asvold BO, Bjøro T, Vatten LJ. Association of serum TSH with high body mass differs between smokers and never-smokers. J Clin Endocrinol Metab (2009) 94:5023–27. doi: 10.1210/jc.2009-1180
10. Nyrnes A, Jorde R, Sundsfjord J. Serum TSH is positively associated with BMI. Int J Obes (Lond) (2006) 30:100–5. doi: 10.1038/sj.ijo.0803112
11. Díez JJ, Iglesias P. Relationship between thyrotropin and body mass index in euthyroid subjects. Exp Clin Endocrinol Diabetes (2011) 119:144–50. doi: 10.1055/s-0030-1265133
12. Iacobellis G, Ribaudo MC, Zappaterreno A, Iannucci CV, Leonetti F. Relationship of thyroid function with body mass index, leptin, insulin sensitivity and adiponectin in euthyroid obese women. Clin Endocrinol (Oxf) (2005) 62:487–91. doi: 10.1111/j.1365-2265.2005.02247.x
13. Rotondi M, Leporati P, La Manna A, Pirali B, Mondello T, Fonte R, et al. Raised serum TSH levels in patients with morbid obesity: Is it enough to diagnose subclinical hypothyroidism? Eur J Endocrinol (2009) 160:403–8. doi: 10.1530/EJE-08-0734
14. Makepeace AE, Bremner AP, O'Leary P, Leedman PJ, Feddema P, Michelangeli V, et al. Significant inverse relationship between serum free T4 concentration and body mass index in euthyroid subjects: Differences between smokers and nonsmokers. Clin Endocrinol (Oxf) (2008) 69:648–52. doi: 10.1111/j.1365-2265.2008.03239.x
15. Muscogiuri G, Sorice GP, Mezza T, Prioletta A, Lassandro AP, Pirronti T, et al. High-normal TSH values in obesity: Is it insulin resistance or adipose tissue's guilt? Obes (Silver Spring) (2013) 21:101–6. doi: 10.1002/oby.20240
16. Lips MA, Pijl H, van Klinken JB, de Groot GH, Janssen IM, Van Ramshorst B, et al. Roux-en-Y gastric bypass and calorie restriction induce comparable time-dependent effects on thyroid hormone function tests in obese female subjects. Eur J Endocrinol (2013) 169:339–47. doi: 10.1530/EJE-13-0339
17. Reinehr T, de Sousa G, Andler W. Hyperthyrotropinemia in obese children is reversible after weight loss and is not related to lipids. J Clin Endocrinol Metab (2006) 91:3088–91. doi: 10.1210/jc.2006-0095
18. De Pergola G, Ciampolillo A, Paolotti S, Trerotoli P, Giorgino R. Free triiodothyronine and thyroid stimulating hormone are directly associated with waist circumference, independently of insulin resistance, metabolic parameters and blood pressure in overweight and obese women. Clin Endocrinol (Oxf) (2007) 67:265–9. doi: 10.1111/j.1365-2265.2007.02874.x
19. Nannipieri M, Cecchetti F, Anselmino M, Camastra S, Niccolini P, Lamacchia M, et al. Expression of thyrotropin and thyroid hormone receptors in adipose tissue of patients with morbid obesity and/or type 2 diabetes: Effects of weight loss. Int J Obes (Lond) (2009) 33:1001–6. doi: 10.1038/ijo.2009.140
20. Marzullo P, Mele C, Mai S, Guzzaloni G, Soranna D, Tagliaferri MA, et al. The impact of the metabolic phenotype on thyroid function in obesity. Diabetol Metab Syndr (2016) 8:59. doi: 10.1186/s13098-016-0177-x
21. Shon HS, Jung ED, Kim SH, Lee JH. Free T4 is negatively correlated with body mass index in euthyroid women. Korean J Intern Med (2008) 23:53–7. doi: 10.3904/kjim.2008.23.2.53
22. Xu R, Huang F, Zhang S, Lv Y, Liu Q. Thyroid function, body mass index, and metabolic risk markers in euthyroid adults: A cohort study. BMC Endocr Disord (2019) 19:58. doi: 10.1186/s12902-019-0383-2
23. Roef GL, Rietzschel ER, Van Daele CM, Taes YE, De Buyzere ML, Gillebert TC, et al. Triiodothyronine and free thyroxine levels are differentially associated with metabolic profile and adiposity-related cardiovascular risk markers in euthyroid middle-aged subjects. Thyroid (2014) 24:223–31. doi: 10.1089/thy.2013.0314
24. Liu Y, Wang W, Yu X, Qi X. Thyroid function and risk of non-alcoholic fatty liver disease in euthyroid subjects. Ann Hepatol (2018) 17:779–88. doi: 10.5604/01.3001.0012.3136
25. Wolffenbuttel BHR, Wouters HJCM, Slagter SN, van Waateringe RP, Muller Kobold AC, van Vliet-Ostaptchouk JV, et al. Thyroid function and metabolic syndrome in the population-based LifeLines cohort study. BMC Endocr Disord (2017) 17:65. doi: 10.1186/s12902-017-0215-1
26. Seoane LM, Carro E, Tovar S, Casanueva FF, Dieguez C. Regulation of in vivo TSH secretion by leptin. Regul Pept (2000) 92:25–9. doi: 10.1016/S0167-0115(00)00145-2
27. Flier JS, Harris M, Hollenberg AN. Leptin, nutrition, and the thyroid: the why, the wherefore, and the wiring. J Clin Invest (2000) 105:859–61. doi: 10.1172/JCI9725
28. Nillni EA, Vaslet C, Harris M, Hollenberg A, Bjørbak C, Flier JS. Leptin regulates prothyrotropin-releasing hormone biosynthesis. evidence for direct and indirect pathways. J Biol Chem (2000) 275:36124–33. doi: 10.1074/jbc.M003549200
29. Harris M, Aschkenasi C, Elias CF, Chandrankunnel A, Nillni EA, Bjøorbaek C, et al. Transcriptional regulation of the thyrotropin-releasing hormone gene by leptin and melanocortin signaling. J Clin Invest (2001) 107:111–20. doi: 10.1172/JCI10741
30. Kim MS, Small CJ, Stanley SA, Morgan DG, Seal LJ, Kong WM, et al. The central melanocortin system affects the hypothalamo-pituitary thyroid axis and may mediate the effect of leptin. J Clin Invest (2000) 105:1005–11. doi: 10.1172/JCI8857
31. Perello M, Cakir I, Cyr NE, Romero A, Stuart RC, Chiappini F, et al. Maintenance of the thyroid axis during diet-induced obesity in rodents is controlled at the central level. Am J Physiol Endocrinol Metab (2010) 299:E976–89. doi: 10.1152/ajpendo.00448.2010
32. Lucas A, Granada ML, Olaizola I, Castell C, Julián MT, Pellitero S, et al. Leptin and thyrotropin relationship is modulated by smoking status in euthyroid subjects. Thyroid (2013) 23:964–70. doi: 10.1089/thy.2012.0506
33. Manji N, Boelaert K, Sheppard MC, Holder RL, Gough SC, Franklyn JA. Lack of association between serum TSH or free T4 and body mass index in euthyroid subjects. Clin Endocrinol (Oxf) (2006) 64:125–8. doi: 10.1111/j.1365-2265.2006.02433.x
34. Santini F, Marzullo P, Rotondi M, Ceccarini G, Pagano L, Ippolito S, et al. Mechanisms in endocrinology: the crosstalk between thyroid gland and adipose tissue: signal integration in health and disease. Eur J Endocrinol (2014) 171:R137–52. doi: 10.1530/EJE-14-0067
35. Marzullo P, Minocci A, Mele C, Fessehatsion R, Tagliaferri M, Pagano L, et al. The relationship between resting energy expenditure and thyroid hormones in response to short-term weight loss in severe obesity. PloS One (2018) 13:e0205293. doi: 10.1371/journal.pone.0205293
36. Muniyappa R, Lee S, Chen H, Quon MJ. Current approaches for assessing insulin sensitivity and resistance in vivo: advantages, limitations, and appropriate usage. Am J Physiol Endocrinol Metab (2008) 294:E15–26. doi: 10.1152/ajpendo.00645.2007
37. American Diabetes Association. 2. classification and diagnosis of diabetes: Standards of medical care in diabetes-2020. Diabetes Care (2020) 43:S14–31. doi: 10.2337/dc20-S002
38. Fontenelle LC, Feitosa MM, Severo JS, Freitas TE, Morais JB, Torres-Leal FL, et al. Thyroid function in human obesity: Underlying mechanisms. Horm Metab Res (2016) 48:787–94. doi: 10.1055/s-0042-121421
39. Hollowell JG, Staehling NW, Flanders WD, Hannon WH, Gunter EW, Spencer CA, et al. Serum TSH, T(4), and thyroid antibodies in the united states population (1988 to 1994): National health and nutrition examination survey (NHANES III). J Clin Endocrinol Metab (2002) 87:489–99. doi: 10.1210/jcem.87.2.8182
40. Völzke H, Lüdemann J, Robinson DM, Spieker KW, Schwahn C, Kramer A, et al. The prevalence of undiagnosed thyroid disorders in a previously iodine-deficient area. Thyroid (2003) 13:803–10. doi: 10.1089/105072503768499680
41. Knudsen N, Bülow I, Jørgensen T, Laurberg P, Ovesen L, Perrild H. Comparative study of thyroid function and types of thyroid dysfunction in two areas in Denmark with slightly different iodine status. Eur J Endocrinol (2000) 143:485–91. doi: 10.1530/eje.0.1430485
42. Jensen E, Hyltoft Petersen P, Blaabjerg O, Hansen PS, Brix TH, Kyvik KO, et al. Establishment of a serum thyroid stimulating hormone (TSH) reference interval in healthy adults. the importance of environmental factors, including thyroid antibodies. Clin Chem Lab Med (2004) 42:824–32. doi: 10.1515/CCLM.2004.136
43. Zhao L, Teng D, Shi X, Li Y, Ba J, Chen B, et al. The effect of increased iodine intake on serum thyrotropin: A cross-sectional, Chinese nationwide study. Thyroid (2020) 30:1810–9. doi: 10.1089/thy.2019.0842
44. Biondi B. The normal TSH reference range: what has changed in the last decade? J Clin Endocrinol Metab (2013) 98:3584–7. doi: 10.1210/jc.2013-2760
45. Wartofsky L, Dickey RA. The evidence for a narrower thyrotropin reference range is compelling. J Clin Endocrinol Metab (2005) 90:5483–8. doi: 10.1210/jc.2005-0455
46. Surks MI, Goswami G, Daniels GH. The thyrotropin reference range should remain unchanged. J Clin Endocrinol Metab (2005) 90:5489–96. doi: 10.1210/jc.2005-0170
47. Brabant G, Beck-Peccoz P, Jarzab B, Laurberg P, Orgiazzi J, Szabolcs I, et al. Is there a need to redefine the upper normal limit of TSH? Eur J Endocrinol (2006) 154:633–7. doi: 10.1530/eje.1.02136
48. Garduño-Garcia Jde J, Alvirde-Garcia U, López-Carrasco G, Padilla Mendoza ME, Mehta R, Arellano-Campos O, et al. TSH and free thyroxine concentrations are associated with differing metabolic markers in euthyroid subjects. Eur J Endocrinol (2010) 163:273–8. doi: 10.1530/EJE-10-0312
49. Iqbal A, Jorde R, Figenschau Y. Serum lipid levels in relation to serum thyroid-stimulating hormone and the effect of thyroxine treatment on serum lipid levels in subjects with subclinical hypothyroidism: the tromsø study. J Intern Med (2006) 260:53–61. doi: 10.1111/j.1365-2796.2006.01652.x
50. Schalin-Jäntti C, Tanner P, Välimäki MJ, Hämäläinen E. Serum TSH reference interval in healthy Finnish adults using the Abbott architect 2000i analyzer. Scand J Clin Lab Invest (2011) 71:344–9. doi: 10.3109/00365513.2011.568630
51. Ehrenkranz J, Bach PR, Snow GL, Schneider A, Lee JL, Ilstrup S, et al. Circadian and circannual rhythms in thyroid hormones: Determining the TSH and free T4 reference intervals based upon time of day, age, and sex. Thyroid (2015) 25:954–61. doi: 10.1089/thy.2014.0589
52. Raverot V, Bonjour M, Abeillon du Payrat J, Perrin P, Roucher-Boulez F, Lasolle H, et al. Age- and sex-specific TSH upper-limit reference intervals in the general French population: There is a need to adjust our actual practices. J Clin Med (2020) 9:792. doi: 10.3390/jcm9030792
53. Vadiveloo T, Donnan PT, Murphy MJ, Leese GP. Age- and gender-specific TSH reference intervals in people with no obvious thyroid disease in Tayside, Scotland: the thyroid epidemiology, audit, and research study (TEARS). J Clin Endocrinol Metab (2013) 98:1147–53. doi: 10.1210/jc.2012-3191
54. Lo Sasso B, Vidali M, Scazzone C, Agnello L, Ciaccio M. Reference interval by the indirect approach of serum thyrotropin (TSH) in a Mediterranean adult population and the association with age and gender. Clin Chem Lab Med (2019) 57:1587–94. doi: 10.1515/cclm-2018-0957
55. Léan AD, Ferland L, Drouin J, Kelly PA, Labrie F. Modulation of pituitary thyrotropin releasing hormone receptor levels by estrogens and thyroid hormones. Endocrinology (1977) 100:1496–504. doi: 10.1210/endo-100-6-1496
56. Franklyn JA, Wood DF, Balfour NJ, Ramsden DB, Docherty K, Sheppard MC. Modulation by oestrogen of thyroid hormone effects on thyrotrophin gene expression. J Endocrinol (1987) 115:53–9. doi: 10.1677/joe.0.1150053
57. Rosenbaum M, Nicolson M, Hirsch J, Heymsfield SB, Gallagher D, Chu F, et al. Effects of gender, body composition, and menopause on plasma concentrations of leptin. J Clin Endocrinol Metab (1996) 81:3424–7. doi: 10.1210/jcem.81.9.8784109
58. Ghamari-Langroudi M, Vella KR, Srisai D, Sugrue ML, Hollenberg AN, Cone RD. Regulation of thyrotropin-releasing hormone-expressing neurons in paraventricular nucleus of the hypothalamus by signals of adiposity. Mol Endocrinol (2010) 24:2366–81. doi: 10.1210/me.2010-0203
59. Casabiell X, Piñeiro V, Peino R, Lage M, Camiña J, Gallego R, et al. Gender differences in both spontaneous and stimulated leptin secretion by human omental adipose tissue in vitro: dexamethasone and estradiol stimulate leptin release in women, but not in men. J Clin Endocrinol Metab (1998) 83:2149–55. doi: 10.1210/jcem.83.6.4849
60. Belin RM, Astor BC, Powe NR, Ladenson PW. Smoke exposure is associated with a lower prevalence of serum thyroid autoantibodies and thyrotropin concentration elevation and a higher prevalence of mild thyrotropin concentration suppression in the third national health and nutrition examination survey (NHANES III). J Clin Endocrinol Metab (2004) 89:6077–86. doi: 10.1210/jc.2004-0431
61. Gruppen EG, Kootstra-Ros J, Kobold AM, Connelly MA, Touw D, Bos JHJ, et al. Cigarette smoking is associated with higher thyroid hormone and lower TSH levels: the PREVEND study. Endocrine (2020) 67:613–22. doi: 10.1007/s12020-019-02125-2
62. John U, Hanke M, Rumpf HJ, Thyrian JR. Smoking status, cigarettes per day, and their relationship to overweight and obesity among former and current smokers in a national adult general population sample. Int J Obes (Lond) (2005) 29:1289–94. doi: 10.1038/sj.ijo.0803028
63. Asvold BO, Bjøro T, Nilsen TI, Vatten LJ. Tobacco smoking and thyroid function: a population-based study. Arch Intern Med (2007) 167:1428–32. doi: 10.1001/archinte.167.13.1428
64. Wiersinga WM. Smoking and thyroid. Clin Endocrinol (Oxf) (2013) 79:145–51. doi: 10.1111/cen.12222
65. Pearce EN, Braverman LE. Environmental pollutants and the thyroid. Best Pract Res Clin Endocrinol Metab (2009) 23:801–13. doi: 10.1016/j.beem.2009.06.003
66. Gondou A, Toyoda N, Nishikawa M, Yonemoto T, Sakaguchi N, Tokoro T, et al. Effect of nicotine on type 2 deiodinase activity in cultured rat glial cells. Endocr J (1999) 46:107–12. doi: 10.1507/endocrj.46.107
67. Bremner AP, Feddema P, Leedman PJ, Brown SJ, Beilby JP, Lim EM, et al. Age-related changes in thyroid function: A longitudinal study of a community-based cohort. J Clin Endocrinol Metab (2012) 97:1554–62. doi: 10.1210/jc.2011-3020
68. Duntas LH. Thyroid function in aging: A discerning approach. Rejuvenation Res (2018) 21:22–8. doi: 10.1089/rej.2017.1991
69. Mariotti S. Thyroid function and aging: Do serum 3,5,3'-triiodothyronine and thyroid-stimulating hormone concentrations give the janus response? J Clin Endocrinol Metab (2005) 90:6735–7. doi: 10.1210/jc.2005-2214
70. Hoogendoorn EH, Hermus AR, de Vegt F, Ross HA, Verbeek AL, Kiemeney LA, et al. Thyroid function and prevalence of anti-thyroperoxidase antibodies in a population with borderline sufficient iodine intake: influences of age and sex. Clin Chem (2006) 52:104–11. doi: 10.1373/clinchem.2005.055194
71. Sell MA, Schott M, Tharandt L, Cissewski K, Scherbaum WA, Willenberg HS. Functional central hypothyroidism in the elderly. Aging Clin Exp Res (2008) 20:207–10. doi: 10.1007/BF03324770
72. Over R, Mannan S, Nsouli-Maktabi H, Burman KD, Jonklaas J. Age and the thyrotropin response to hypothyroxinemia. J Clin Endocrinol Metab (2010) 95:3675–83. doi: 10.1210/jc.2010-0281
73. Lamberts SW, van den Beld AW, van der Lely AJ. The endocrinology of aging. Science (1997) 278:419–24. doi: 10.1126/science.278.5337.419
74. Isidori AM, Strollo F, Morè M, Caprio M, Aversa A, Moretti C, et al. Leptin and aging: correlation with endocrine changes in male and female healthy adult populations of different body weights. J Clin Endocrinol Metab (2000) 85:1954–62. doi: 10.1210/jcem.85.5.6572
75. Ryan AS, Elahi D. The effects of acute hyperglycemia and hyperinsulinemia on plasma leptin levels: its relationships with body fat, visceral adiposity, and age in women. J Clin Endocrinol Metab (1996) 81:4433–8. doi: 10.1210/jcem.81.12.8954055
76. Ostlund RE Jr, Yang JW, Klein S, Gingerich R. Relation between plasma leptin concentration and body fat, gender, diet, age, and metabolic covariates. J Clin Endocrinol Metab (1996) 81:3909–13. doi: 10.1210/jcem.81.11.8923837
77. Obradovic M, Sudar-Milovanovic E, Soskic S, Essack M, Arya S, Stewart AJ, et al. Leptin and obesity: Role and clinical implication. Front Endocrinol (Lausanne) (2021) 12:585887. doi: 10.3389/fendo.2021.585887
78. Wang X, Li Y, Zhai X, Wang H, Zhang F, Gao X, et al. Reference intervals for serum thyroid-stimulating hormone based on a recent nationwide cross-sectional study and meta-analysis. Front Endocrinol (Lausanne) (2021) 12:660277. doi: 10.3389/fendo.2021.660277
Keywords: obesity, thyroid, metabolism, body composition, leptin
Citation: Mele C, Mai S, Cena T, Pagano L, Scacchi M, Biondi B, Aimaretti G and Marzullo P (2022) The pattern of TSH and fT4 levels across different BMI ranges in a large cohort of euthyroid patients with obesity. Front. Endocrinol. 13:1029376. doi: 10.3389/fendo.2022.1029376
Received: 27 August 2022; Accepted: 26 September 2022;
Published: 13 October 2022.
Edited by:
Angelo Cignarelli, University of Bari Aldo Moro, ItalyReviewed by:
Luigi Barrea, Pegaso University, ItalyArturo Hernandez, Maine Medical Center, United States
Copyright © 2022 Mele, Mai, Cena, Pagano, Scacchi, Biondi, Aimaretti and Marzullo. This is an open-access article distributed under the terms of the Creative Commons Attribution License (CC BY). The use, distribution or reproduction in other forums is permitted, provided the original author(s) and the copyright owner(s) are credited and that the original publication in this journal is cited, in accordance with accepted academic practice. No use, distribution or reproduction is permitted which does not comply with these terms.
*Correspondence: Chiara Mele, Y2hpYXJhLm1lbGUxOTg5QGdtYWlsLmNvbQ==