 David Lopez-Rodriguez1
 Antoine Rohrbach1†Marc Lanzillo2†
 Manon Gervais2
 Sophie Croizier2‡
 Fanny Langlet1*‡
- 1Department of Biomedical Sciences, Faculty of Biology and Medicine, University of Lausanne, Lausanne, Switzerland
- 2Center for Integrative Genomics, Faculty of Biology and Medicine, University of Lausanne, Lausanne, Switzerland
Introduction: During hypothalamic development, the germinative neuroepithelium gives birth to diverse neural cells that regulate numerous physiological functions in adulthood.
Methods: Here, we studied the ontogeny of ependymal cells in the mouse mediobasal hypothalamus using the BrdU approach and publicly available single-cell RNAseq datasets.
Results: We observed that while typical ependymal cells are mainly produced at E13, tanycyte birth depends on time and subtypes and lasts up to P8. Typical ependymocytes and β tanycytes are the first to arise at the top and bottom of the dorsoventral axis around E13, whereas α tanycytes emerge later in development, generating an outside-in dorsoventral gradient along the third ventricle. Additionally, α tanycyte generation displayed a rostral-to-caudal pattern. Finally, tanycytes mature progressively until they reach transcriptional maturity between P4 and P14.
Discussion: Altogether, this data shows that ependyma generation differs in time and distribution, highlighting the heterogeneity of the third ventricle.
Introduction
The mediobasal hypothalamus controls different physiological processes and behaviors essential for life, ranging from feeding (1) to reproduction (2, 3).
Organized around the third ventricle (3V), the mediobasal hypothalamus developed from the germinative neuroepithelium during embryonic development (4). The embryonic ventricular zone is mainly composed of radial glial cells. These neural stem cells are bipolar progenitors producing neurons and glia and serving as scaffolds for newborn neural cells to reach their final destination within the brain parenchyma (5, 6). Classically, the mantle layer forms upon three consecutive waves of neurogenesis, leading first to lateral, then medial, and finally periventricular zones, as illustrated by the genesis of melanin-concentrating hormone (MCH) neurons in the lateral hypothalamus (LHA) (7, 8) or other neurons in the ventromedial nucleus (VMH) (9, 10). Later, the ventricular zone evolves to give the ependymal layer (11).
Along the 3V in the mediobasal hypothalamus, the ependymal layer is characterized by the presence of heterogeneous ependymal cells. First, ciliated and cuboidal cells −typical in diverse brain regions− line the upper part of the 3V and participate in circulating cerebrospinal fluid (12). A second cell type, characterized by a long process and the presence of only one or two cilia, lines the lateral wall and the bottom of the 3V. These peculiar ependymal cells called tanycytes are considered reminiscent radial glial cells within the brain and are currently subdivided into four different subtypes, α1, α2, β1, and β2 (13, 14). Restricted to circumventricular organs in mammals (15), tanycytes play a role in numerous neuroendocrine functions such as glucose homeostasis, energy balance, and reproduction (16–18).
While hypothalamic neurogenesis from the mantle layer is well documented in rodents (19, 20), the ontogeny of the ependyma within the mediobasal hypothalamus is still limited (13, 19, 21–23). Here, we used BrdU incorporation to provide a spatiotemporal characterization of the mouse gliogenesis along the ependymal layer. In addition, neuron birthdate was analyzed in the arcuate (ARH), the ventromedial (VMH), and the dorsomedial (DMH) nuclei of the hypothalamus for a comparative perspective. We first confirmed that the ependyma is mainly generated once the neighboring neurons are produced. However, this generation is highly heterogeneous regarding the cell subtypes. Indeed, we determined different spatiotemporal gradients for the generation of the ependyma on the rostrocaudal and dorsoventral axis. Using publicly available scRNAseq datasets, we finally highlighted the transcriptional pseudotime developmental trajectories giving rise to mature tanycyte and typical ependymal cell populations.
Materials and methods
Animals
C57Bl/6J mice (initially obtained from Charles River) were used in this study. Male and female mice were put together around 5 pm, and the presence of a vaginal plug was checked on the following day (before 9 am). In this case, the time of conception was documented and considered as embryonic day 0 (E0). The day of birth was regarded as postnatal day 0 (P0). All animal procedures were performed at the University of Lausanne and were reviewed and approved by the Veterinary Office of Canton de Vaud.
Bromodeoxyuridine injections
BrdU crystals (5-Bromo-2-deoxyuridine, BrdU, Roche Applied Science, # 10280879001) were dissolved in 0.07 M NaOH solution warmed to 65°C. Pregnant mice (from gestational day 9 to 18) and male pups (from P0 to P8) were given a single i.p. injection around 10 a.m. (50mg/kg).
Tissue preparation. 21 to 23 days after birth (P21-P23), BrdU-injected male mice were anesthetized with isoflurane and perfused transcardially with a 0.9% NaCl solution, followed by an ice-cold solution of 4% paraformaldehyde in 0.1 M phosphate buffer, pH 7.4. Brains were quickly removed, postfixed in the same fixative for two hours at 4°C, and immersed in 20% sucrose in 0.1M phosphate-buffered saline (PBS) at 4°C overnight. Brains were finally either embedded in ice-cold OCT medium (optimal cutting temperature embedding medium, Tissue Tek, Sakura) and frozen in liquid nitrogen-cooled isopentane (most of the postnatally injected animals) or directly frozen in crushed dry ice without OCT (all prenatally injected animals). The different groups (n=3 to 7 per group) were then called “E9”, “E10”, “P1”, …: these developmental time points correspond to the day of the single i.p. BrdU injection.
Immunohistochemistry
Brains were cut using a cryostat into 25-μm-thick coronal sections and processed for immunohistochemistry as described previously (24). Briefly, the slide-mounted sections were 1) incubated in a boiling 10 mM Citrate Buffer solution, pH 6.0, for 12 minutes; 2) blocked for 1 hour using a solution containing 2% normal goat serum and 0.3% Triton X-100; 3) incubated overnight at 4°C with primary antibodies (Table S1) followed by two hours at room temperature with a cocktail of secondary Alexa Fluor-conjugated antibodies (1:500, Molecular Probes, Invitrogen, San Diego, CA) (Table S2); 4) mounted with DAPI Fluoromount-G (Southern Biotech; REF: 0100-20).
Antibody characterization
All primary and secondary antibodies used are listed in Supplementary Tables S1, S2. The rabbit polyclonal antibody to BrdU (Bio-rad Cat#AHP2405, RRID: AB_2922993) recognizes the synthetic thymidine analog bromodeoxyuridine (BrdU). The chicken polyclonal antibody to VIM (Vimentin) (Millipore Cat# AB5733, RRID: AB_11212377) produced a pattern of staining associated with tanycytes, ependymal cells, and endothelial cells, similar to that described elsewhere in the literature (25). The mouse monoclonal antibody to NeuN (Neuron-specific nuclear protein) (Millipore Cat# MAB377, RRID: AB_2298772) produced a pattern of staining associated with neuronal cells, similar to that described elsewhere in the literature (26).
Microscopic imaging
Pictures were acquired using a ZEISS Axio Imager.M2 microscope, equipped with ApoTome.2 and a Camera Axiocam 702 mono (Zeiss, Germany). Specific filter cubes were used for the visualization of green (Filter set 38 HE eGFP shift free (E) EX BP 470/40, BS FT 495, EM BP 525/50), red (Filter set 43 HE Cy 3 shift free (E) EX BP 550/25, BS FT 570, EM BP 605/70), and blue (Filter set 49 DAPI (E) EX G 365, BS FT 395, EM BP 445/50) fluorescence. Different magnifications were selected using a Zeiss x20 objective (Objective Plan-Apochromat 20x/0.8 M27 (FWD=0.55mm)) and a 63× oil immersion objective (Objective C Plan-Apochromat 63x/1.4 Oil DIC M27 (FWD=0.14mm)). To create photomontages, images were acquired using ZEN 2.3 pro software using Z-Stack and Tiles/Positions ZEN modules for each fluorophore sequentially. Quintuple-ApoTome frames were collected stepwise over a defined z-focus range corresponding to all visible fluorescence within the section. Multiple-plane frames were collected at a step of 0.3 µm while using the x63 objective (between 43 and 60 frames per image) and 1 µm while using the x20 objective (between 11 and 18 frames per image). Weak deconvolution was finally applied to images following the acquisition. All images were saved in.czi, processed to get maximal intensity projections, and finally exported in.tiff. for the processing steps (i.e., adjust brightness and contrast and merge channels) using Adobe Photoshop (Adobe Systems, San Jose, CA)).
Data analysis
BrdU quantifications were performed using the AxioImager D1 microscope. Two investigators determined ependymocyte birthdate by counting the number of BrdU-positive and vimentin-positive cells. Tanycytes were differentiated from typical ependymal cells by their vimentin-positive basal process. One investigator quantified the neurogenesis by counting the number of BrdU-positive and NeuN-positive cells. The regions of interest (i.e., the ventricular layer, the ARH, the VMH, and the DMH) were identified based on DAPI staining. For the ventrodorsal analysis, the ventricle was divided into seven subregions corresponding to the area where tanycyte processes are sent (i.e., the medial median eminence, the lateral median eminence, the ventromedial ARH, the dorsomedial ARH, the VMH, and the DMH) and the layer composed of typical ependymal cells (Figure 1). For the rostrocaudal axes, the region was divided into four subregions, corresponding to zone 1 (from bregma -1.2 to -1.5mm), zone 2 (from bregma -1.6 to -1.75 mm), zone 3 (from bregma -1.8 to -2.1 mm), and zone 4 (from bregma -2.15 to -2.5 mm) (Figure 1). From a neuroanatomical point of view, these subdivisions were defined based on the shape of the ventricle and the presence/absence of hypothalamic nuclei along the 3V. These subdivisions were already described and used in former studies (27, 28).
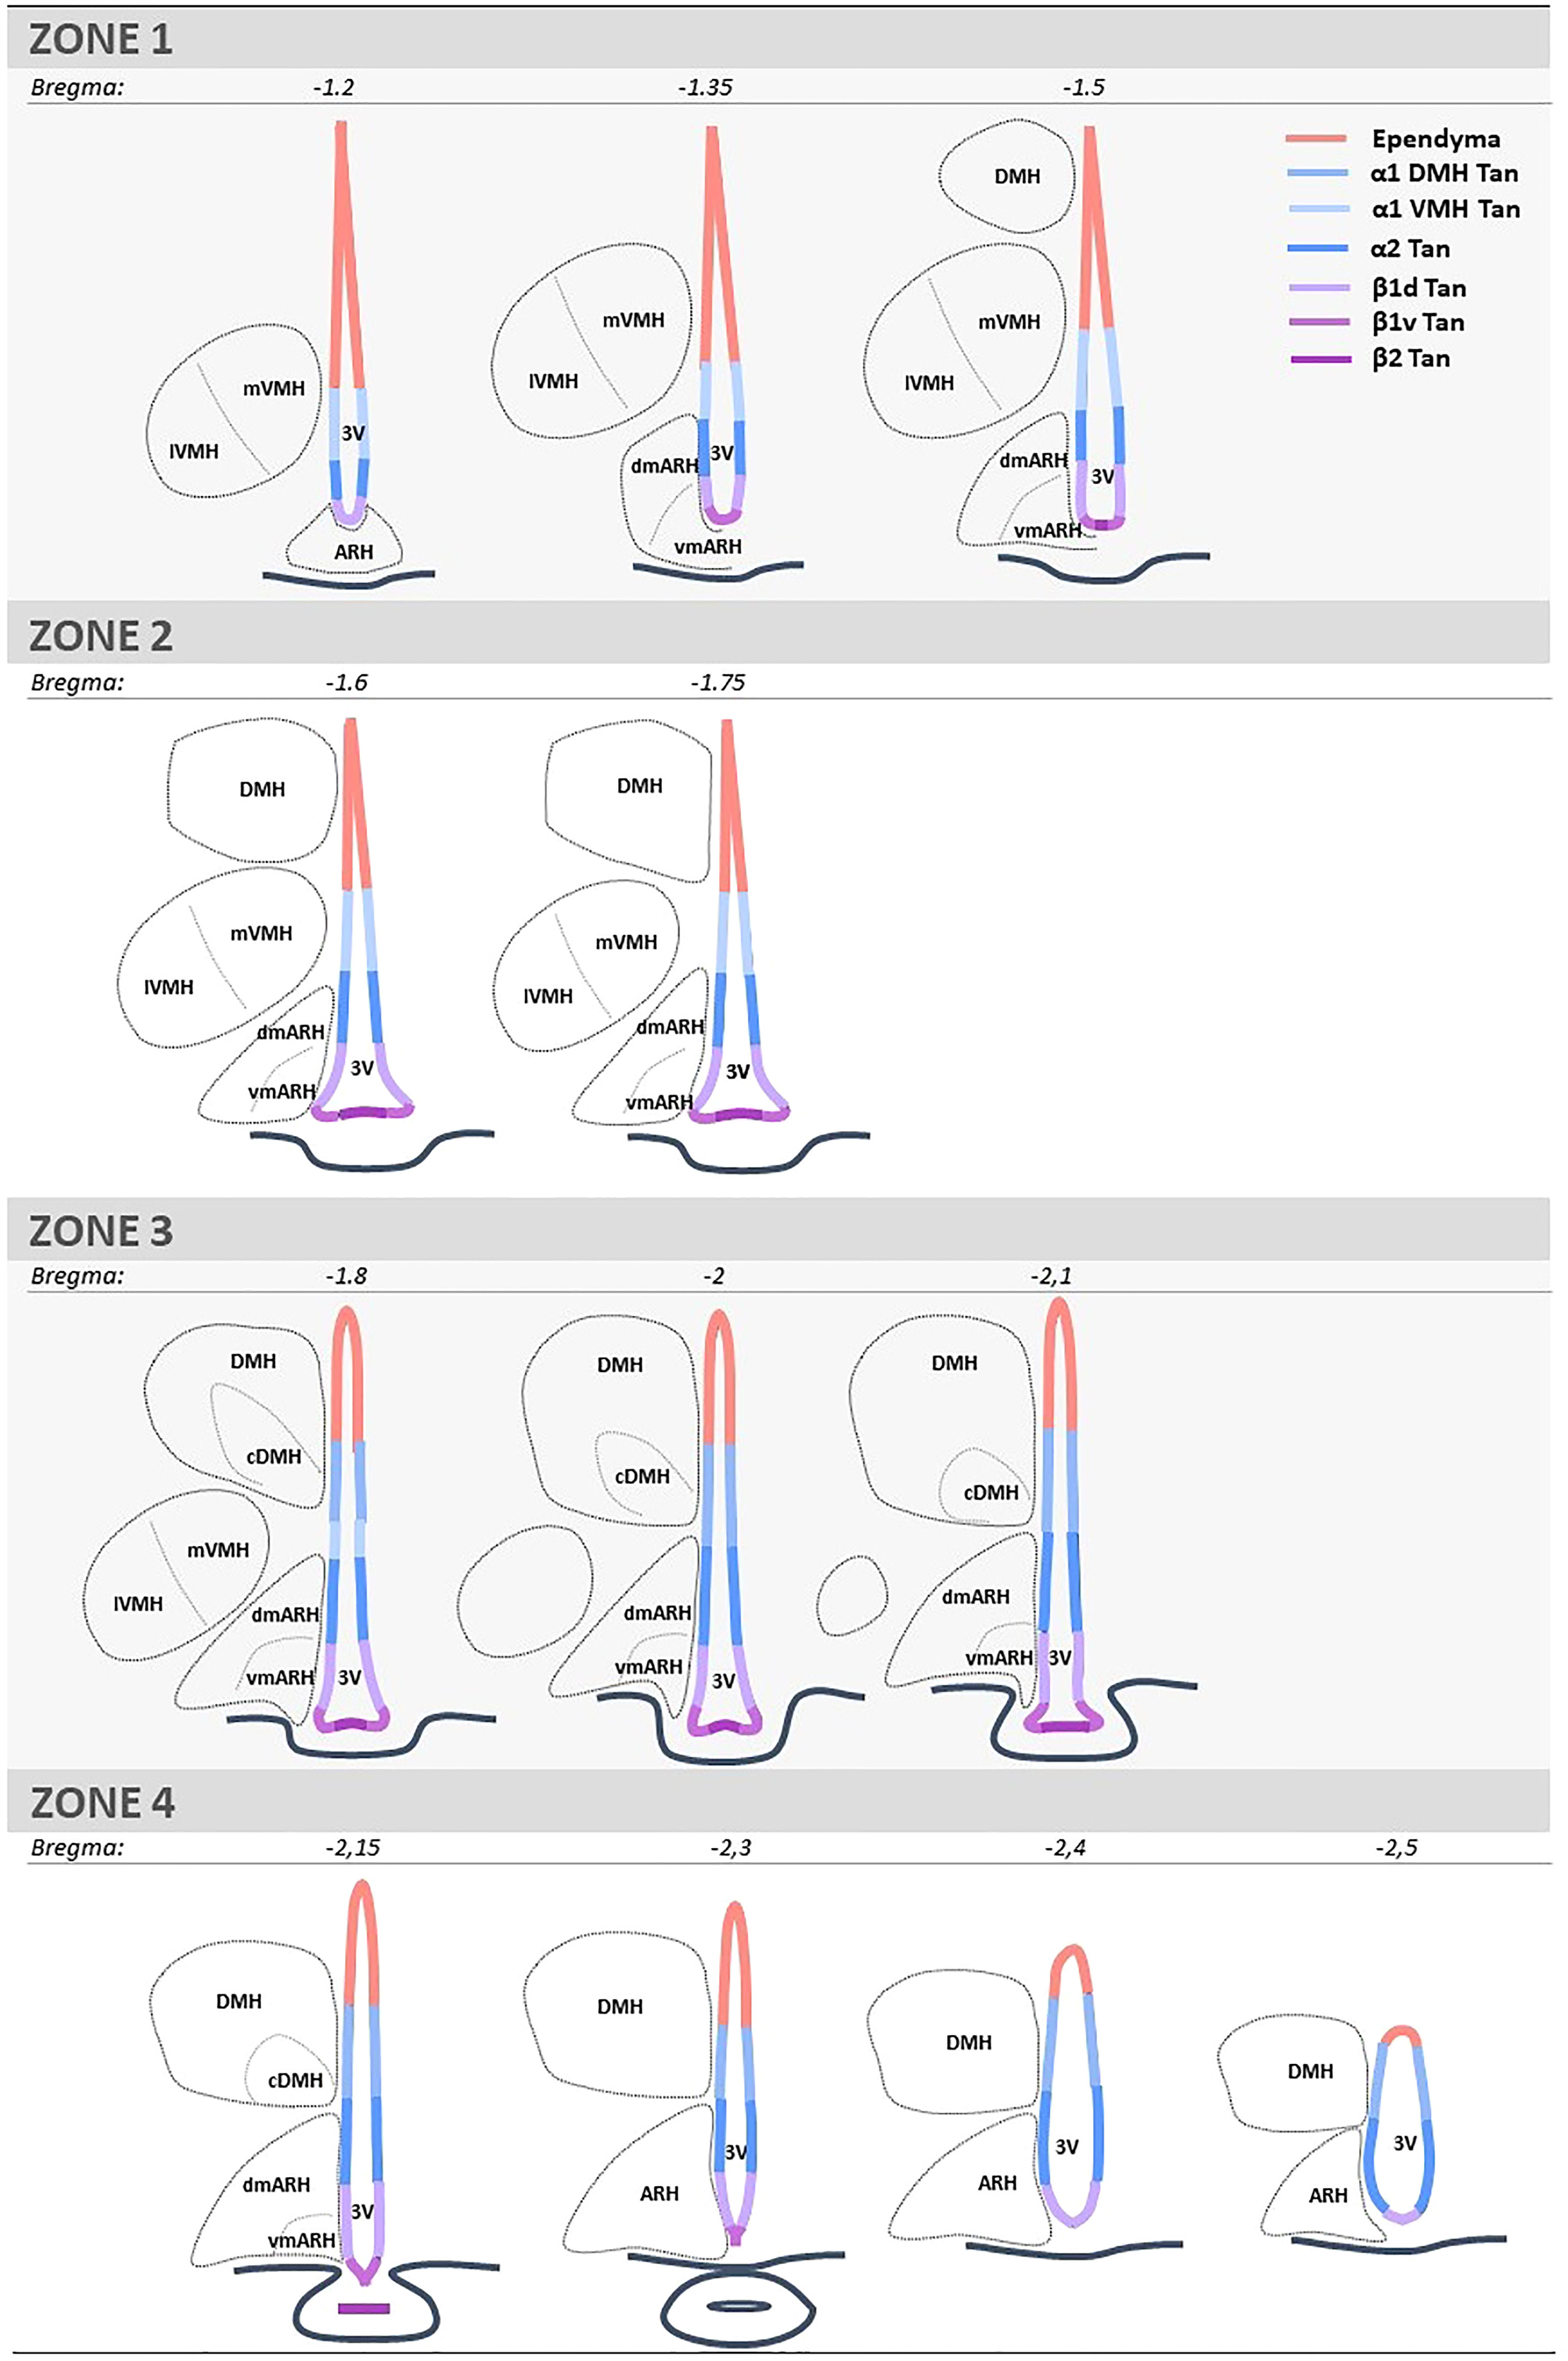
Figure 1 Schematic representation and coordinates of the four consecutive rostrocaudal zones used to analyze the mediobasal hypothalamus. Zone 1 corresponds to the anterior part of the ARH and the ME, where tanycyte processes are mainly found in the ARH and a few in the VMH. Zone 2 corresponds to the medial part of ME, where the bottom of the ventricle is more considerable, and tanycyte processes are found in both the ARH and VMH. Zone 3 corresponds to the medial-posterior part of the ME, where the VMH is lateral, and tanycyte processes are now observed in the DMH. Zone 4 corresponds to the posterior part of the ME and the presence of the infundibular stalk, where tanycyte processes are sent in the ARH and DMH. ARH is subdivided into vmARH and dmARH. VMH is subdivided into mVMH and lVMH. DMH is subdivided into cDMH. The ependyma is subdivided into 7 subregions: the ependymal layer facing the medial ME for beta-2 tanycytes (β2 Tan), the lateral ME for ventral beta-1 tanycytes (β1v Tan), the vmARH for dorsal beta-1 tanycytes (β1d Tan), the dmARH for alpha-2 tanycytes (α2 Tan), the VMH for rostral alpha-1 tanycytes (α1 VMH Tan), the cDMH for caudal alpha-1 tanycytes (α1 DMH Tan), and the dorsal part of the DMH for typical ependymal cells. 3V, third ventricle; ARH, arcuate nucleus of the hypothalamus; cDMH, compact dorsomedial nucleus of the hypothalamus; dmARH, dorsomedial arcuate nucleus of the hypothalamus; DMH, dorsomedial nucleus of the hypothalamus; lVMH, lateral ventromedial nucleus of the hypothalamus; ME, median eminence; mVMH, medial ventromedial nucleus of the hypothalamus; vmARH, ventromedial arcuate nucleus of the hypothalamus.
Quantifications were performed on 3 to 7 animals per time point, on 5 to 12 sections per brain (1 to 3 sections per zone on average), and on both hemispheres. The total number of BrdU-positive cells was then calculated per zone and normalized by the number of analyzed sections (Table S3). The BrdU labeling pattern displayed low variability between animals injected at the same age.
Single-cell RNAseq data analysis
Publicly available scRNAseq datasets were analyzed as described in their original papers with few modifications (26, 29). Developmental time points (E10-E16, E18, P4, P14, and P45) scRNAseq datasets from Kim et al. (26) (GSE132355) were independently analyzed using Seurat 4.1.1 to identify the developmental age at which tanycyte-like cells can be found as an independent cluster. After generating a SeuratObject from raw data and splitting the matrix by developmental time points (“orig.ident”), we filtered cells to contain at least 200 features, and all datasets were normalized and scaled using scTransform (30). Following UMAP dimensional reduction (maintaining the first 50 PCA variables), we clustered cells using a resolution of 1.7 to maximize cluster separation. Furthermore, we used differential gene expression (DGE) analysis between clusters to identify major hypothalamic cell types using known cell marker genes from the original publication. Gene ontology analysis was performed using ShinyGO (v0.76) to obtain enriched GO terms using features expressed in tanycyte clusters at every developmental time point analyzed. ShinyGO was set to get the biological processes ordered by the false discovery rate (FDR) with a threshold of 0.05.
To identify the ependyma developmental trajectory, hypothalamic datasets from E11 to P45 (except P8) from Kim et al. (26) were integrated using Harmony (31). Normalization, dimensional reduction, and clustering were performed as described above. Following cell type identification, clusters containing progenitor cells (NPCs), ependyma, and tanycytes were subset in Seurat. The resulting Seurat object was then converted to CellDataSet to calculate the pseudotime trajectory from NPCs to the ependyma and tanycyte populations using Monocle3. A differentially expressed gene analysis across a single-cell trajectory from NPCs to ependyma and tanycyte populations was performed using the graph_test function.
To identify tanycyte subtypes across developmental time points, we analyzed the Yoo et al. (29) (GSE160378) scRNAseq dataset using Seurat. The original dataset was subset to contain the developmental time points P8 from wild-type mice exclusively. Data normalization, dimensional reduction, and cell-type identification were performed as described above. All analyses were performed in RStudio (v1.4.1103) using 4.1.1. version.
Results
To analyze the birth of ependymal cells and neurons within the periventricular zone in the mediobasal hypothalamus, pregnant dams (from E9 to E18) and male pups (from P0 to P8) were given a single i.p. injection of BrdU, and its labeling was then performed on coronal brain sections from 21- to 23-day-old male mice. Vimentin (Figures 2A–C) and NeuN (Figures 2D–F) were co-stained to visualize ependymal cells and neurons, respectively. We first observed a differential pattern of BrdU labeling along the ventricle (Figures 2A, C). Indeed, at a younger age, BrdU is incorporated along the ventricle, but its labeling does not fill out the entire nucleus of the cell (Figure 2C, double arrowhead), suggesting additional cell divisions afterward and highlighting a high generative capacity. Alternatively, BrdU staining filled out the entire cell nucleus (Figure 2C, arrowheads), indicating no additional cell divisions and, consequently, the birth of the cell. For the analysis, we focused on full BrdU-staining in ependymal cells (Figures 2A–C) and neuronal cells (Figures 2D–F). The ependymal cells were further subdivided into typical cuboid ependymal cells versus tanycytes based on the presence of a basal vimentin-positive process (Figures 2A, B).
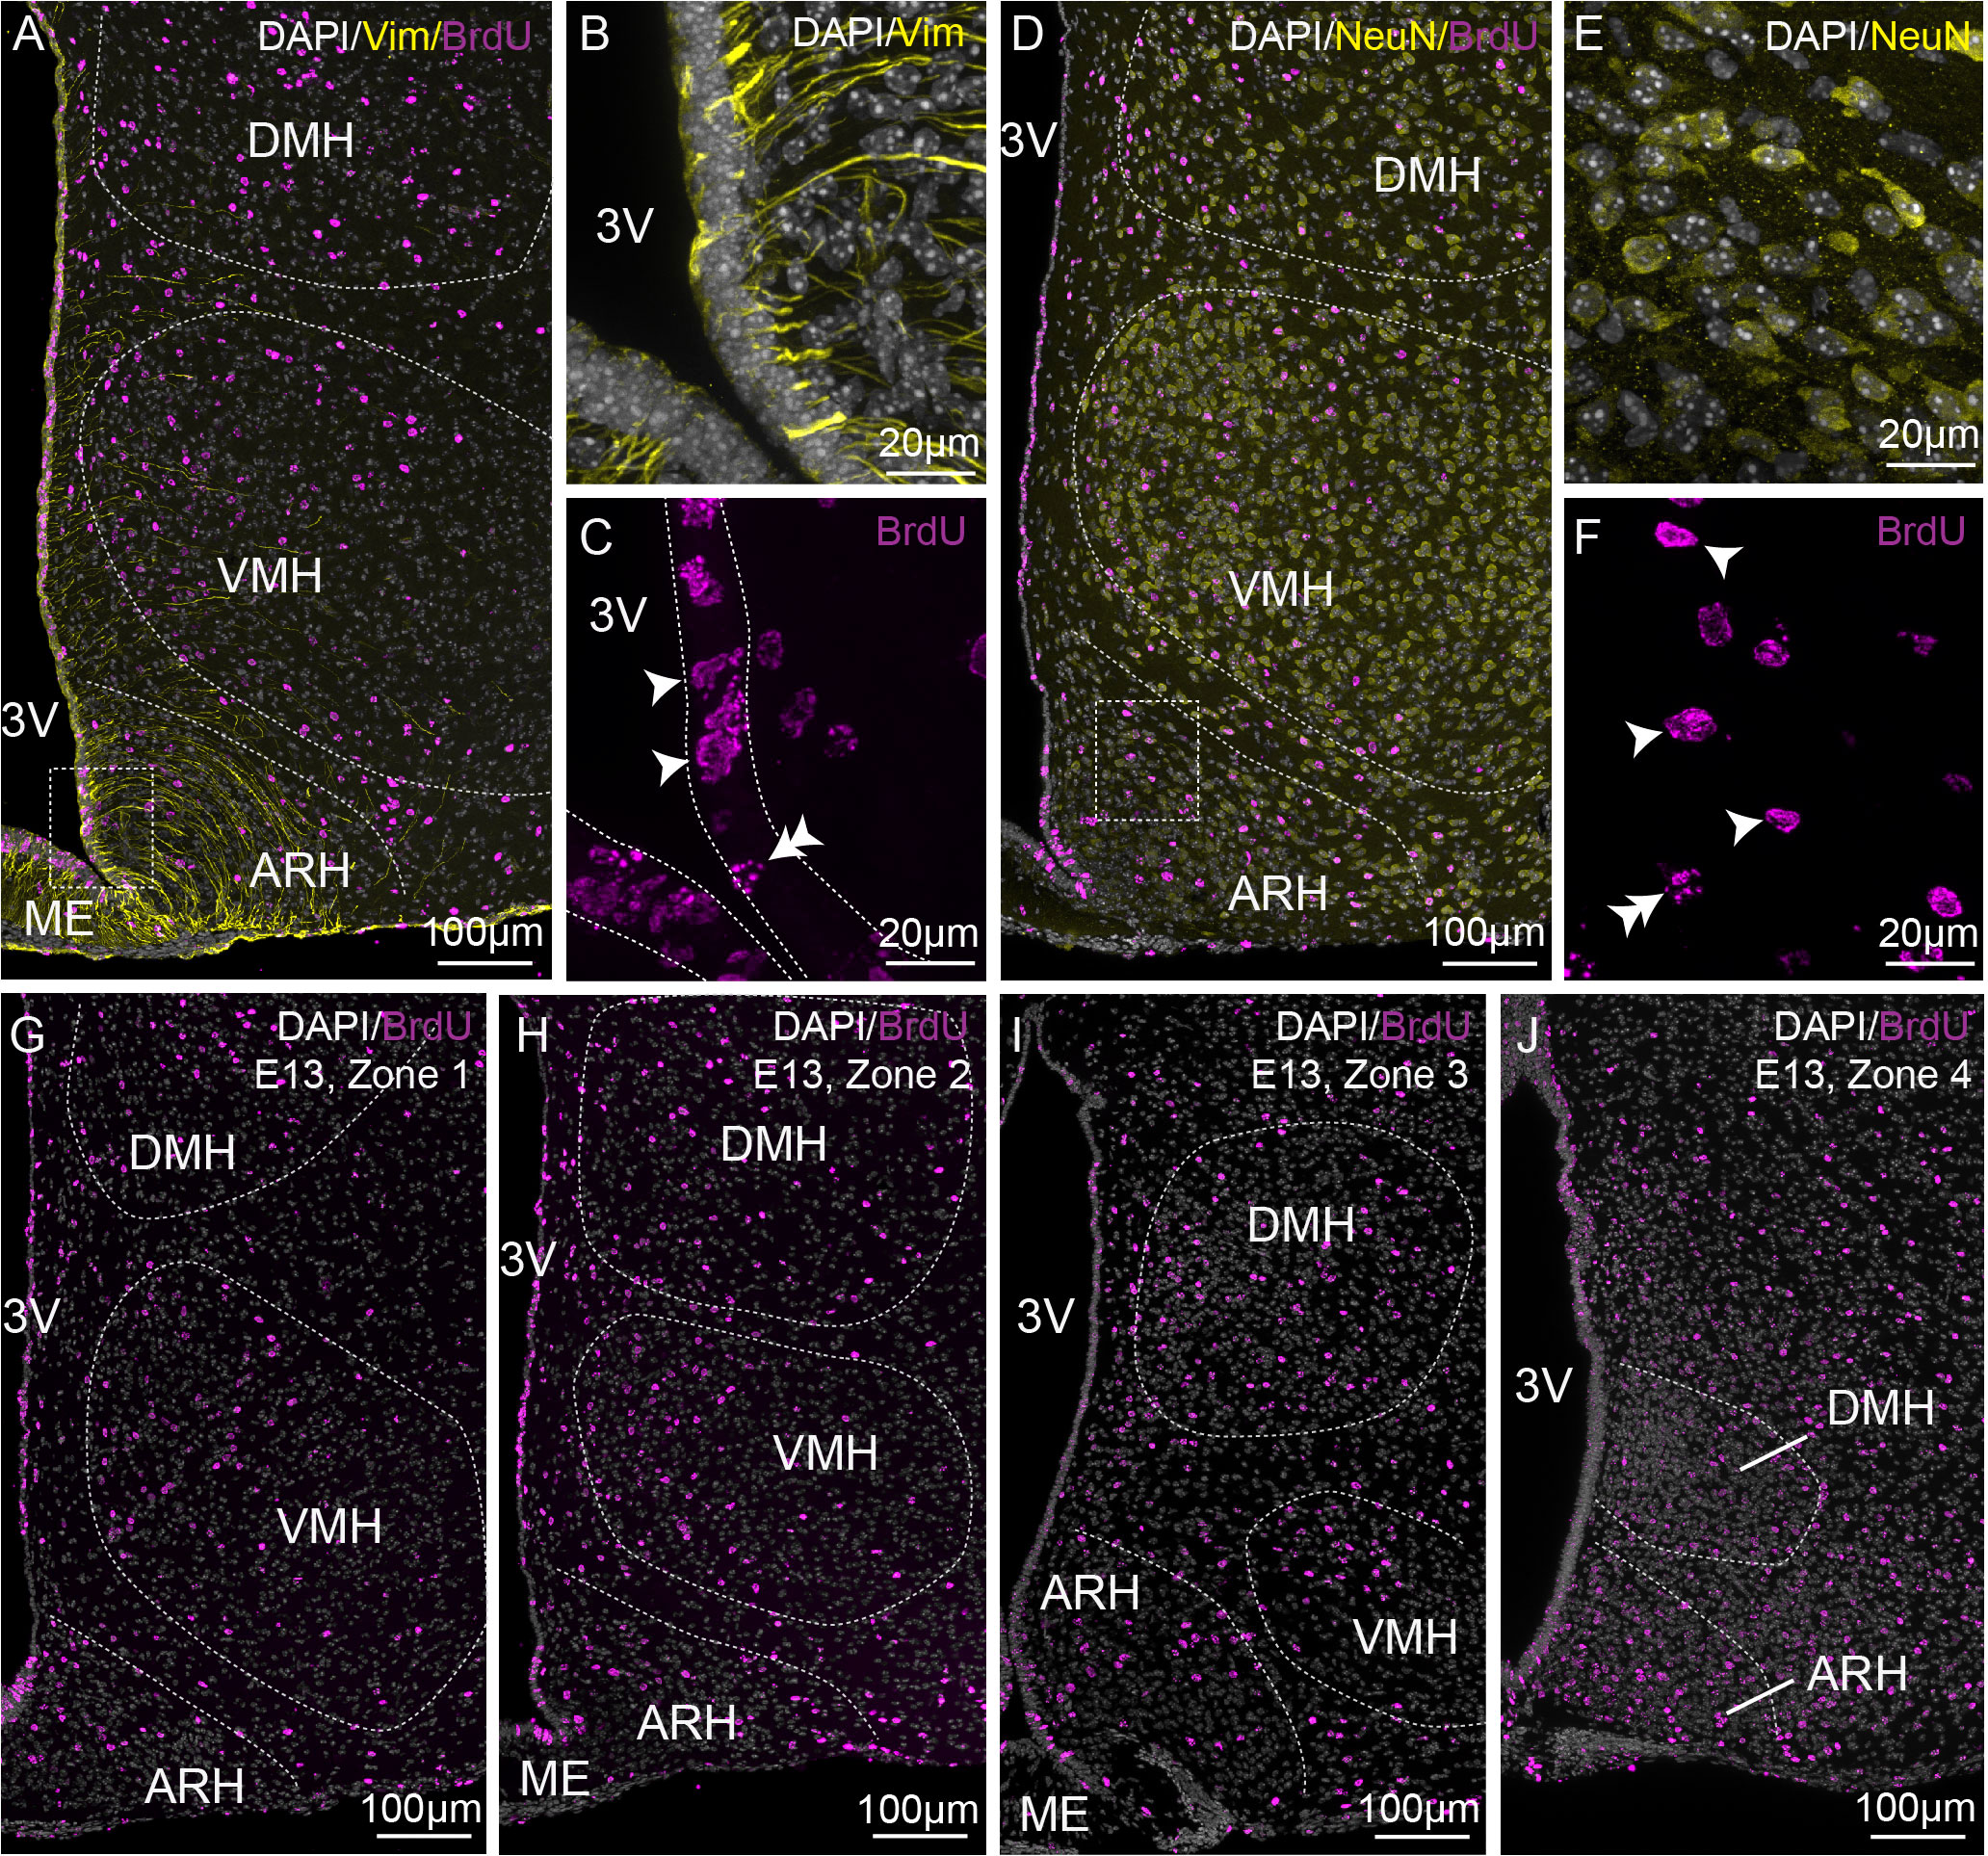
Figure 2 Characterization of BrdU-positive cells on the rostrocaudal axis. (A–C) Low- (x20, A) and high- (x63, B-C) magnification z-stack images showing the colocalization of vimentin immunoreactivity (yellow) and BrdU (pink) in zone 2 with Dapi counterstaining (white) in a coronal section from P21 male pups after BrdU injection to pregnant dams at E13. (D–F) Low- (x20, D) and high- (x63, E-F) magnification z-stack images showing the colocalization of NeuN immunoreactivity (yellow) and BrdU (pink) with Dapi counterstaining (white) in a coronal section at E13 in zone 2. (G–J) Low-magnification z-stack images (20x) showing the distribution of BrdU immunoreactivity (pink) with Dapi counterstaining (white) in coronal sections at E13 in zone 1 (G), zone 2 (H), zone 3 (I), and zone 4 (J). “E13” indicates the BrdU injection time point. Single arrowheads point out a BrdU labeling filling out the entire cell nucleus, whereas the double arrowheads point out a labeling that does not. ARH, arcuate nucleus of the hypothalamus; DMH, dorsomedial nucleus of the hypothalamus; ME, median eminence; VMH, ventromedial nucleus of the hypothalamus; 3V, third ventricle.
To adequately evaluate the heterogeneity of ependymoglial cell and neuronal birthdate along the 3V, a methodical analysis was performed on the ventrodorsal and rostrocaudal axes (Figures 1, 2G–J). The 3V was first divided into seven subregions on the ventrodorsal axis: the ependymal layer facing the medial median eminence for β2 tanycytes, the lateral median eminence for ventral β1 tanycytes, the ventromedial ARH (vmARH) for dorsal β1 tanycytes, the dorsomedial ARH (dmARH) for α2 tanycytes, the VMH for rostral α1 tanycytes, the compact part of the DMH (cDMH) for caudal α1 tanycytes, and the dorsal part of the DMH for typical ependymal cells (Figure 1). Additionally, the region was divided into four subregions along the rostrocaudal axis, corresponding to zone 1 (from bregma -1.2 to -1.5 mm), zone 2 (from bregma -1.6 to -1.75 mm), zone 3 (from bregma -1.8 to -2.1 mm) and zone 4 (from bregma -2.15 to -2.5 mm) (Figures 1, 2G–J). Finally, the analysis of newborn neural cells was based on a single BrdU injection performed at different time points from E9 to P8 to infer temporal gradients in BrdU labeling patterns (Figure 3 and File S1). Thus, “E12” brains (i.e., brains harvested from P21-22 male pups whose mothers received a single BrdU injection during pregnancy at E12) revealed a high generation of neurons and a low rate for ependymal cells at this time point (Figure 3A). In contrast, the ependyma mainly arises from E13 (Figures 3B–D) at different generation rhythms according to the ependymal subpopulations (File S1). Indeed, typical ependymal cells, α2 and α1 tanycytes display a higher generation at E13, E14 and E15, respectively (Figures 3B–D, brackets).
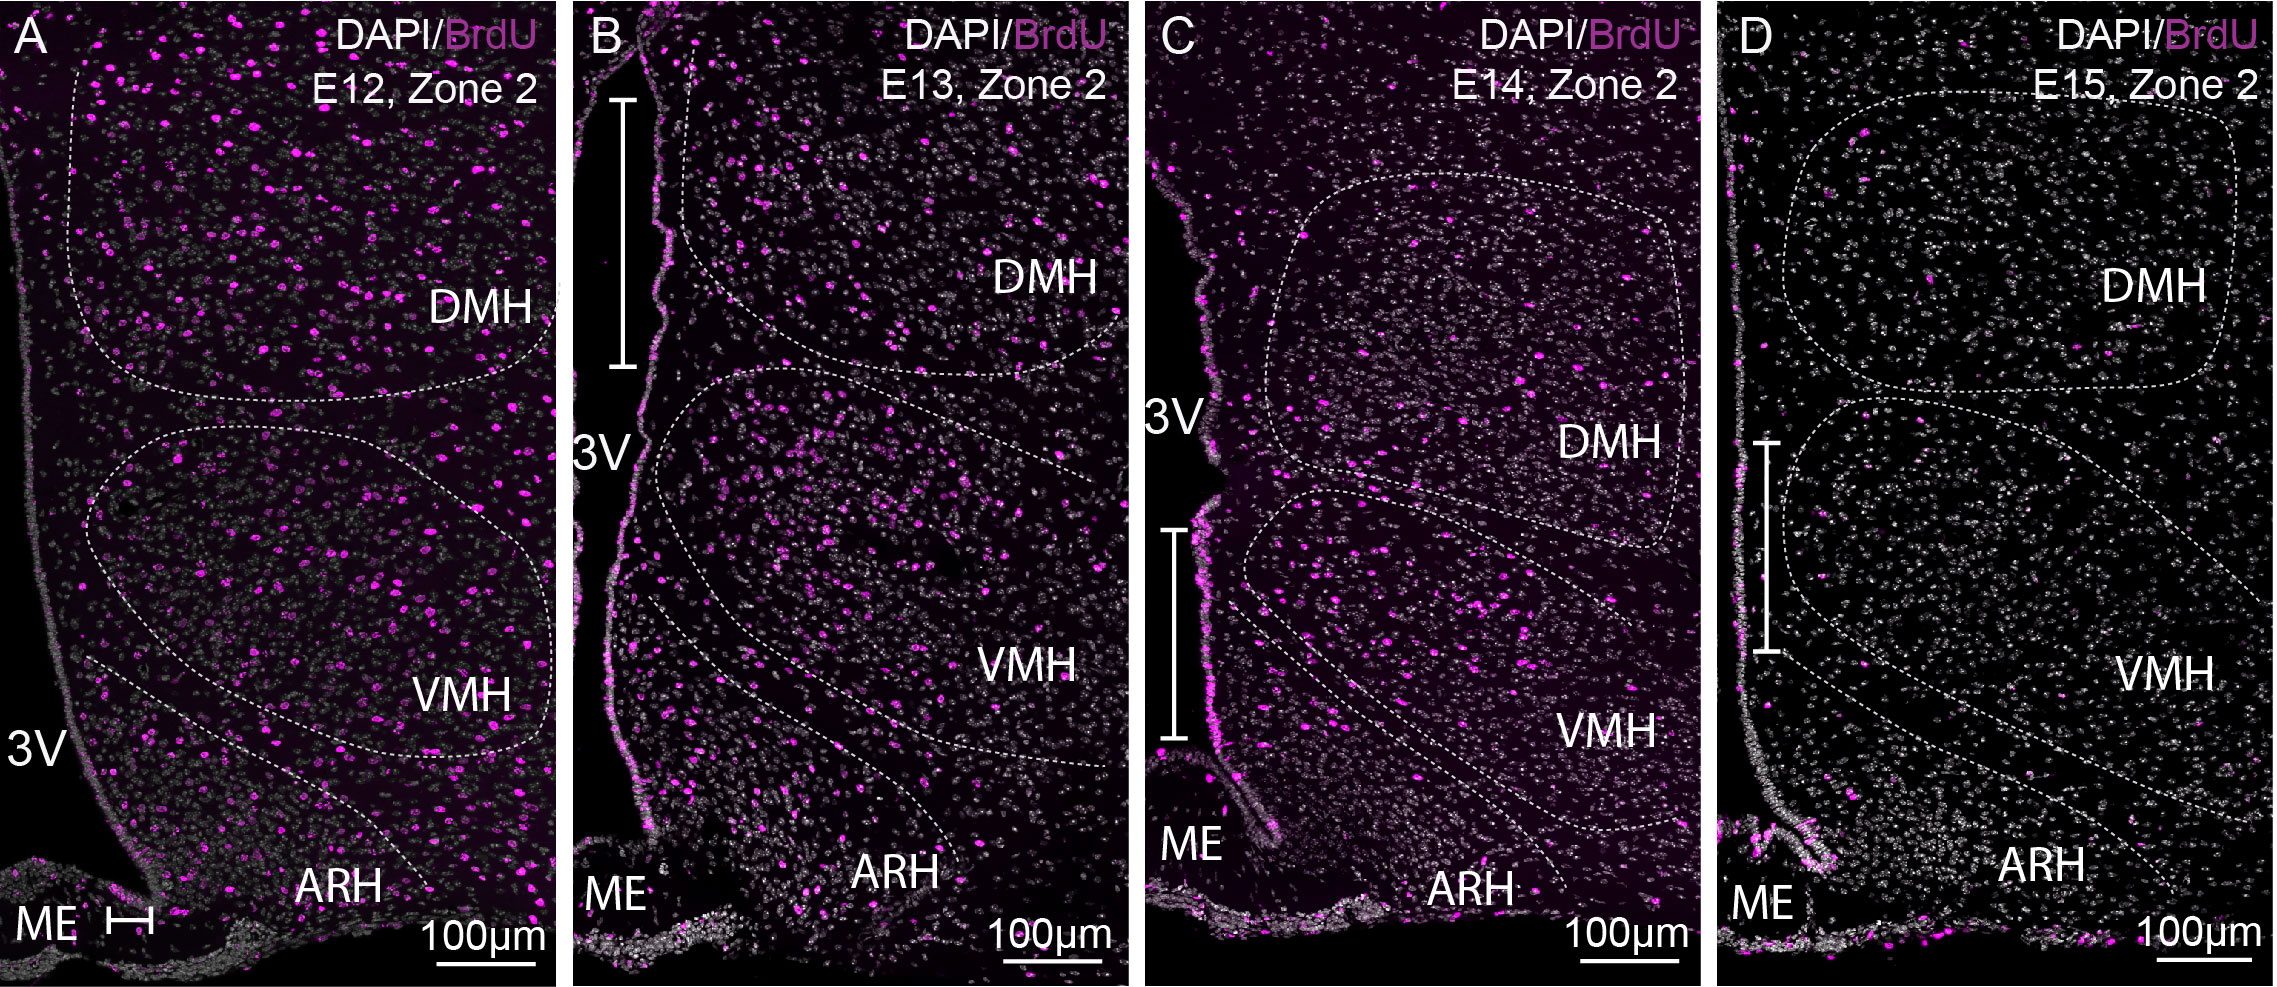
Figure 3 Characterization of BrdU-positive cells in time. (A–D) Low-magnification z-stack images (20x) showing the distribution of BrdU immunoreactivity (pink) in zone 2 (bregma -1.8) with Dapi counterstaining (white) in coronal sections from P21 male pups after BrdU injection to pregnant dams at E12 (A), E13 (B), E14 (C), and E15 (D) (labeled “E12”, “E13”, “E14”, and “E15” on the pictures, respectively). The white bars point out the peaks of genesis along the third ventricle. ARH, arcuate nucleus of the hypothalamus; DMH, dorsomedial nucleus of the hypothalamus; ME, median eminence; VMH, ventromedial nucleus of the hypothalamus; 3V, third ventricle.
Neuron birthdate in the mediobasal zone mostly occurs between E11 and E13 in mice
In the periventricular (i.e., ARH and DMH) and medial nuclei (i.e., VMH), BrdU/NeuN-positive neurons were found in animals injected between E9 and E18 (Figure 4A and Table S3). No postnatal neurogenesis was observed. Thus, the neurogenic generative peak mainly occurs between E11 and E13, concentrating 75.6% of the total number of cells generated over the entire period (Figure 4A). However, BrdU/NeuN labeling patterns revealed regional differences (Figures 4A, B). First, most BrdU/NeuN cells were found in the dmARH, the DMH, the mVMH, and the lVMH with 24.0%, 22.7%, 20.9%, and 15.9% of generated cells over the entire developmental window (i.e., from E9 to P8), respectively (Figures 4A, B and Table S3). Lower generation levels were observed in the vmARH (8.2%) and the cDMH (8.3%) (Figures 4A, B and Table S3). Secondly, BrdU/NeuN labeling patterns confirmed a lateral-to-medial gradient in the generation of the VMH (9, 10). Indeed, most of the observed newborn neurons in the lateral VMH were generated at E11, whereas those within the medial VMH arose a day later at E12 (Figure 4B and Figure S1). Then, the neuronal generative peak in the periventricular nuclei (i.e., ARH and DMH regions) was concentrated within a few days between E12 and E13 without a lateral-to-medial gradient (Figures 4B, S1). Third, some nuclei additionally display a rostrocaudal gradient in their neuronal generation (Figures 4C–H). Specifically, the generation of newborn neurons in the vmARH, which mainly arises between E11 and E13 (Figures 4B, S1), actually starts in the rostral zone 1 at E10 and ends in the caudal region zone 4 by E13 (Figure 4C). In the dmARH, most neurons were born from E11 to E14 (Figure 4B), starting in the rostral zone 1 at E10 and ending in the caudal region zone 4 by E16 (Figure 4D). In contrast, VMH neurons were generated between E11 and E12 (Figure 4B) without a rostrocaudal gradient (Figures 4E, F). DMH neurons were generated between E11 and E14, with the first peak of genesis in zones 2 and 3 and a second in caudal zone 4 (Figure 4G). However, neuronal generation starts first and lasts longer in zone 3 and 4 (Figure 4G). In the cDMH, most neurons were generated in zone 3 at E13 (Figure 4H). To summarize, these different patterns of neurogenesis revealed a lateral-to-medial gradient for the VMH and a slight rostral-to-caudal direction for the periventricular ARH and DMH nuclei.
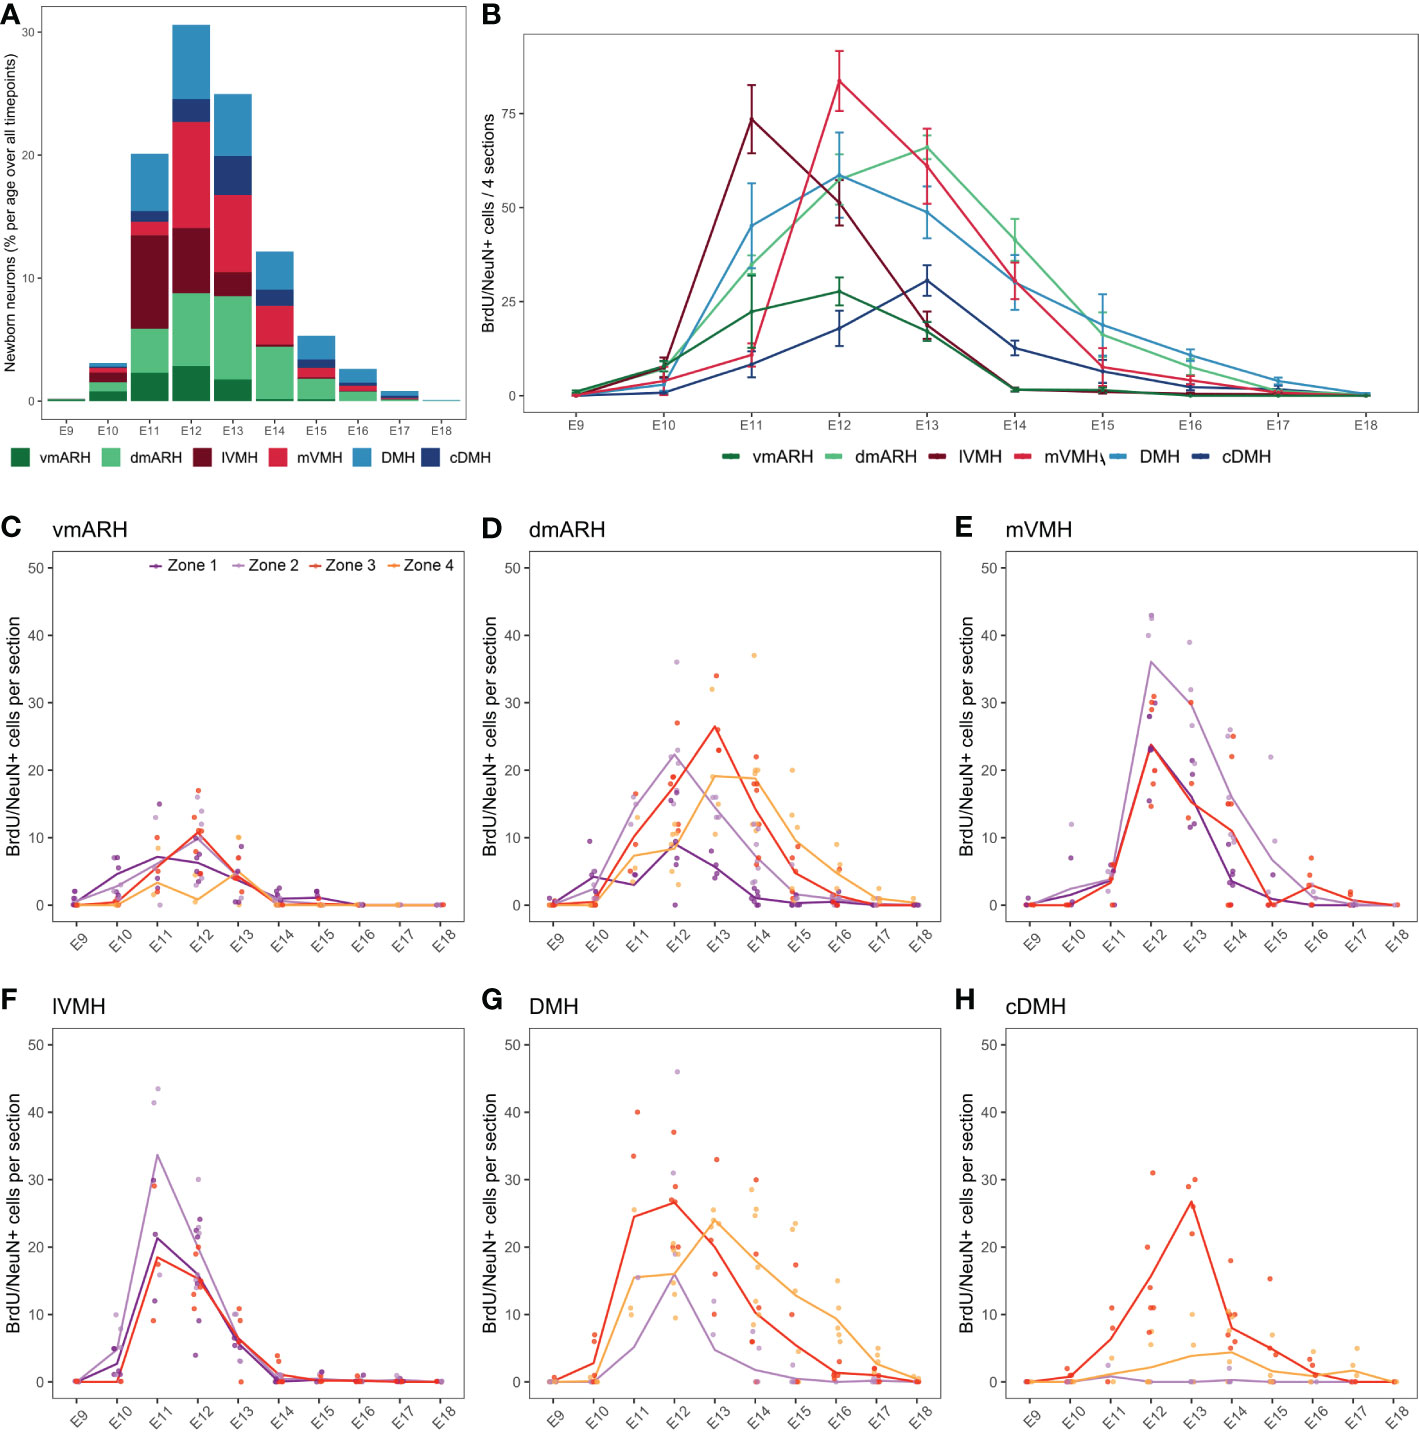
Figure 4 Developmental hypothalamic BrdU incorporation in NeuN-positive cells. (A) Stacked graph displaying the proportion of newborn BrdU/NeuN-positive cells in the hypothalamic regions vmARH, dmARH, lVMH, mVMH, cDMH, and DMH per age over all analyzed brains from P21-22 animals having received a single BrdU injection from E9 to P8 (e.g., “E9” brains were harvested from P21-22 male pups whose mothers received a single BrdU injection during pregnancy at E9; “E10” brains were harvested from P21-22 male pups whose mothers received a single BrdU injection during pregnancy at E10…). The bars represent the percentage of cells per age over the whole analyzed period. Within a single age, the colors represent the percentage of cells per nucleus over the entire analyzed region. (B) Number (mean ± SEM) of BrdU/NeuN-positive cells per nucleus and per age over 4 hypothalamic sections (one in each rostrocaudal zone). (C–H) Number (average -line- and individual values -dots-) of BrdU/NeuN-positive cells per rostrocaudal zones (1 to 4) and per age in each hypothalamic region. n=3 to 7 animals per group. vmARH, ventromedial arcuate nucleus of the hypothalamus; dmARH, dorsomedial arcuate nucleus of the hypothalamus; lVMH, lateral ventromedial nucleus of the hypothalamus; mVMH, medial ventromedial nucleus of the hypothalamus; cDMH, compact dorsomedial nucleus of the hypothalamus; DMH, dorsomedial nucleus of the hypothalamus. See Figure S1.
The typical ependymal cell generation peaks at E13, whereas tanycytes are generated over an extended time window
Ependymal cell generation (i.e., typical ependymal cells and tanycytes) occurred over an extended time window and appeared highly heterogeneous (Figures 5, 6 and Table S3). The distribution of full BrdU-positive cells along the 3V displayed different temporal, dorsoventral, and rostrocaudal gradients (Figure 5 and File S1).
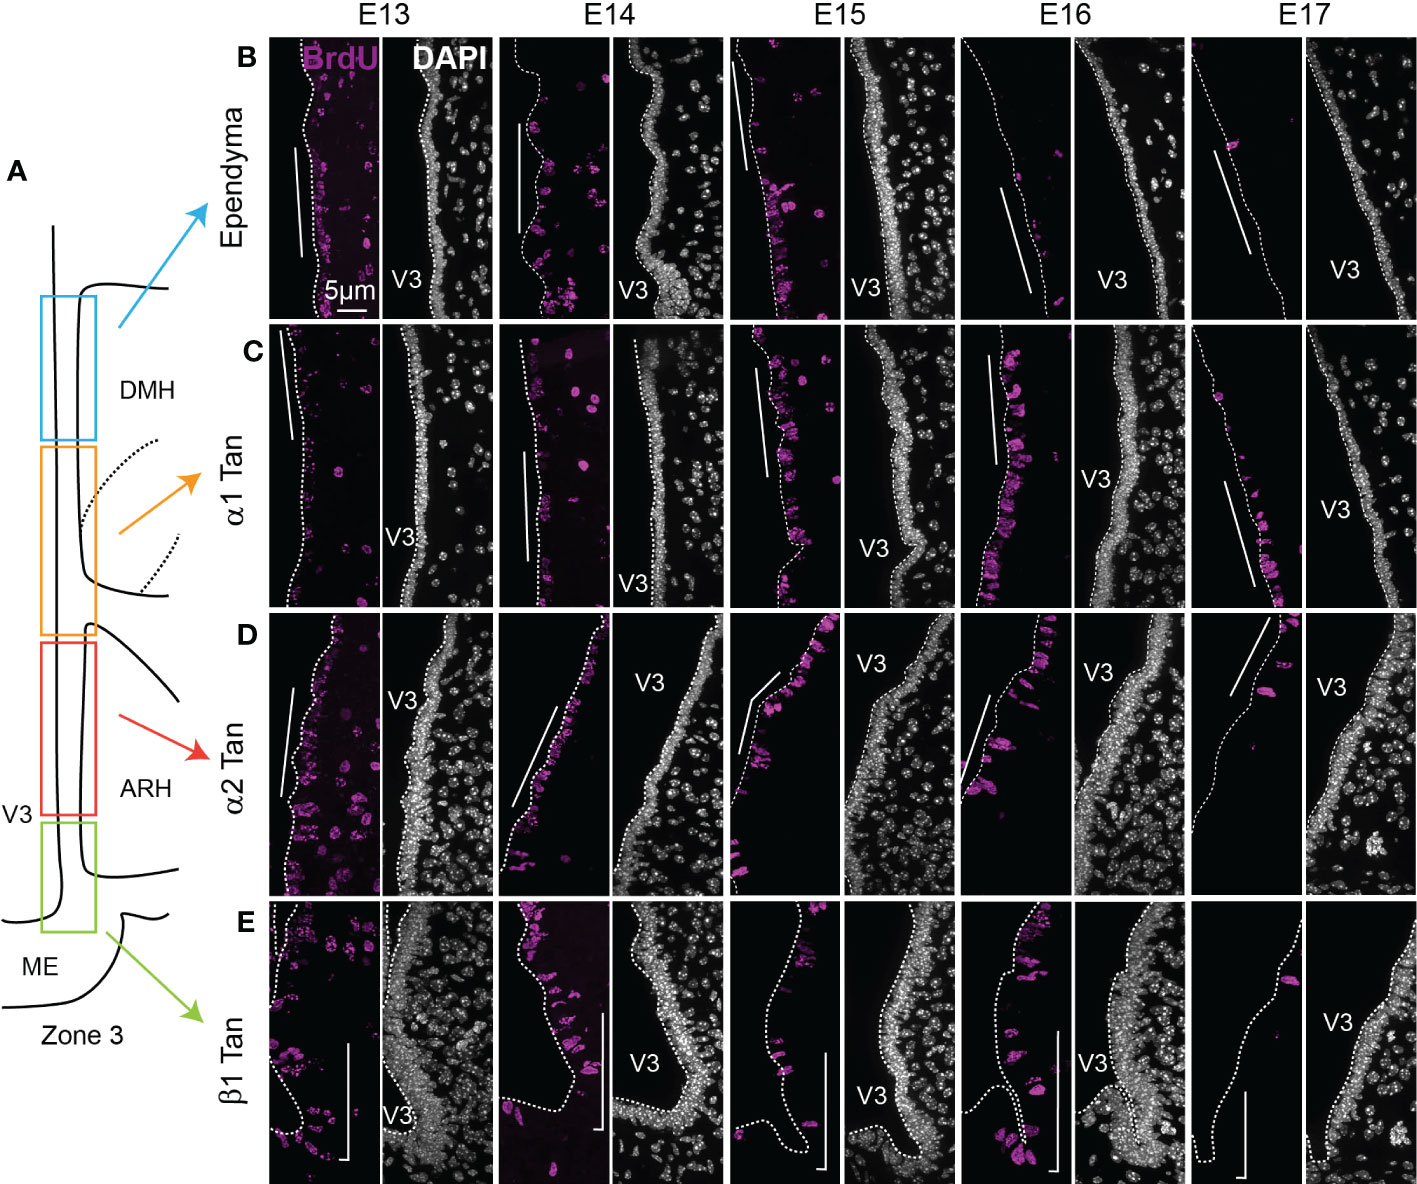
Figure 5 Characterization of BrdU-positive ependymoglial cells along the ventricular wall. (A) Schematic representation of zone 3 in the mediobasal hypothalamus. Rectangles display the different ependymal regions used for the analysis: beta-1 tanycytes facing the lateral ME and the vmARH (β1 Tan), alpha-2 tanycytes facing the dmARH (α2 Tan), alpha-1 tanycytes facing the cDMH (α1 Tan), and typical ependymal cells facing the dorsal part of the DMH. (B–E) High-magnification z-stack (63x) illustrative coronal images showing the distribution of BrdU immunoreactivity (pink) in the typical ependymal cells (B), α1 (C), α2 (D), and β1 (E) from the developmental timepoint E13 to E17. DAPI counterstaining is represented in white. The white bars point out the respective cells of interest along the third ventricle. ARH, arcuate nucleus of the hypothalamus; DMH, dorsomedial nucleus of the hypothalamus; ME, median eminence; V3, third ventricle. The scale bar is shown in the figure. See File S1.
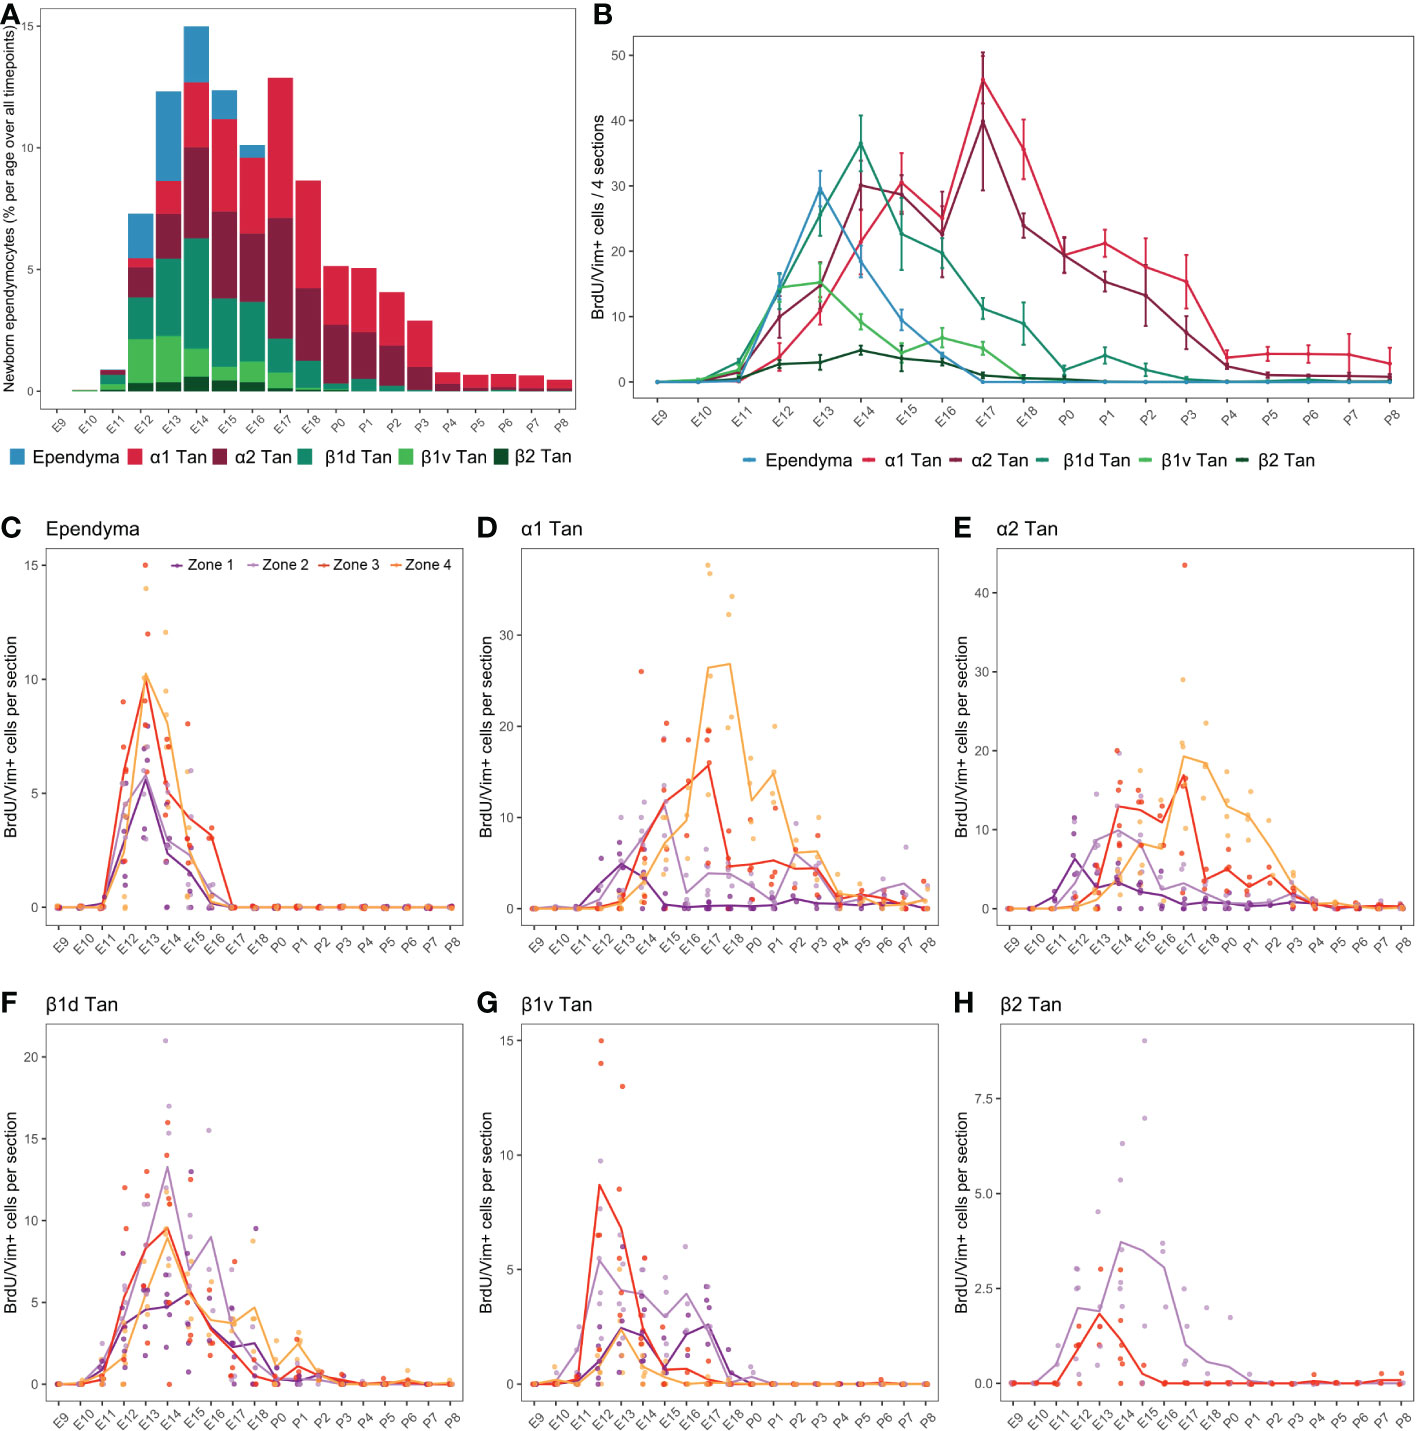
Figure 6 Developmental hypothalamic BrdU incorporation in vimentin (Vim)-positive cells. (A) Stacked graph displaying the proportion of newborn BrdU/Vim-positive cells in typical ependymal and tanycyte populations per age over all analyzed brains from P21-22 animals having received a single BrdU injection from E9 to P8 (e.g., “E9” brains were harvested from P21-22 male pups whose mothers received a single BrdU injection during pregnancy at E9; “E10” brains were harvested from P21-22 male pups whose mothers received a single BrdU injection during pregnancy at E10…). The bars represent the percentage of cells per age over the whole analyzed period. Within a single age, the colors represent the percentage of cells per ependymal subpopulation over the whole analyzed region. (B) Number (mean ± SEM) of BrdU/Vim-positive cells per ependymal subpopulations and per age over 4 hypothalamic sections (one in each rostrocaudal zone). (C–H) Number (average -line- and individual values -dots-) of BrdU/Vim-positive cells per rostrocaudal zones (1 to 4) and per age in each ependymal subpopulation. n=3 to 7 animals per group. α1 Tan, alpha-1 tanycytes; α2 Tan, alpha-2 tanycytes; β1v Tan, ventral beta-1 tanycytes; β1d Tan, dorsal beta-1 tanycytes; β2 Tan, beta-2 tanycytes. See Figure S2.
First, as observed for neurons (Figure 4), BrdU incorporation differed along the 3V (Figure 6A). While α tanycytes displayed high levels of generation, representing 62.0% (α1 = 33.0%, α2 = 29.0%) of newborn ependymal cells within the whole period (i.e., from E9 to P8), typical ependymal cells, β1, and especially β2 tanycytes, had low levels of generation, representing 9.5%, 26% (β1ventral = 7.3%, β1dorsal = 18.7%), and 2.5% of generated ependymal cells, respectively (Figures 6A, B and Table S3). Consequently, no clear generation peak was observed for β2 tanycytes, instead displaying a low generation between E11 and E18 (Figure 6B).
Across development, typical ependymal cells were generated in a short time window between E12 and E16, peaking at E13 with 38.5% of cell generation over the whole period (i.e., from E9 to P8) (Figures 6A, B and Table S3). In contrast, tanycytes were generated over an extended time window from E10 to P8 (Figures 6A, B). Specifically, we first found BrdU incorporation in β1 tanycytes occurring mostly between E11 and E18, with a peak at E12-13 for ventral β1 tanycytes and E14 for dorsal β1 tanycytes (Figure 6B). Next, α1 and α2 tanycytes arose with a more extended distribution throughout development, mainly between E12 and P3 (Figure 6A), with two generation peaks at E14-15 and E17 (Figure 6B). α2 tanycytes start to be generated one day before α1 tanycytes (Figure 6B). Therefore, these results show an “outside-in” generation pattern along the dorsoventral axis of the 3V. Indeed, cells were first generated in typical ependymal cells and β tanycytes in the dorsal and ventral regions between E12 and E14 and then in α tanycytes located in the central region between E14 and P3 (Figure 6B).
To further understand the extended time windows and the multiple peaks for the ependyma generation, we next analyzed BrdU incorporation along the rostrocaudal axis (Figures 6C–H; S2), revealing additional differences according to ependymal subpopulations. Ependymal cells were generated mainly at E13 in every zone without a rostrocaudal gradient (Figure 6C). Regarding α tanycytes, we observed a strong developmental rostral-to-caudal gradient in their generation. Indeed, α1 and α2 tanycytes are first generated in the rostral zones 1 and 2, followed by 3 and 4 later in development in a more prominent way (Figures 6D, E). This strong gradient explains the two peaks of generation observed at E14 and E17 when the rostrocaudal axis is not considered (Figure 6B). In contrast, β1 tanycytes facing the vmARH (β1d) did not display a clear rostrocaudal gradient of generation (Figure 6F). Interestingly, the generation of ventral β1 tanycytes (β1v) was more extended in zones 1 and 2 −from E11 to E18−, whereas it peaks at E12-13 in zones 3 and 4 (Figure 6G), suggesting a slight caudal-to-rostral gradient. Similarly, for β2 tanycytes, although we observed low BrdU incorporation in this cell subtype, the generation pattern suggests a slight caudal-to-rostral gradient with an extended generation up to P1 in zone 2 versus an earlier and shorter window in zone 3 (Figure 6H).
To summarize, our results demonstrated that typical ependymal cells (E13) and β tanycytes (E12-14) are the first generated shortly after the peak of neuron birthdate (E11-13) (Figure 7A). However, this time difference is less clear when considering the rostrocaudal gradient observed for neuronal generation (Figure 7B). Indeed, neurons are born before ependymal cells and β tanycytes in the rostral zone, but they arise concomitantly in the caudal region (Figure 7B). In contrast, there is little or no overlap between neuron and α tanycyte birthdate. Specifically, at the timing of the peak of neuron birth between E11 and E13, only a small proportion of α2 tanycytes is generated. α tanycytes arise later with a robust rostral-to-caudal gradient (Figure 7B).
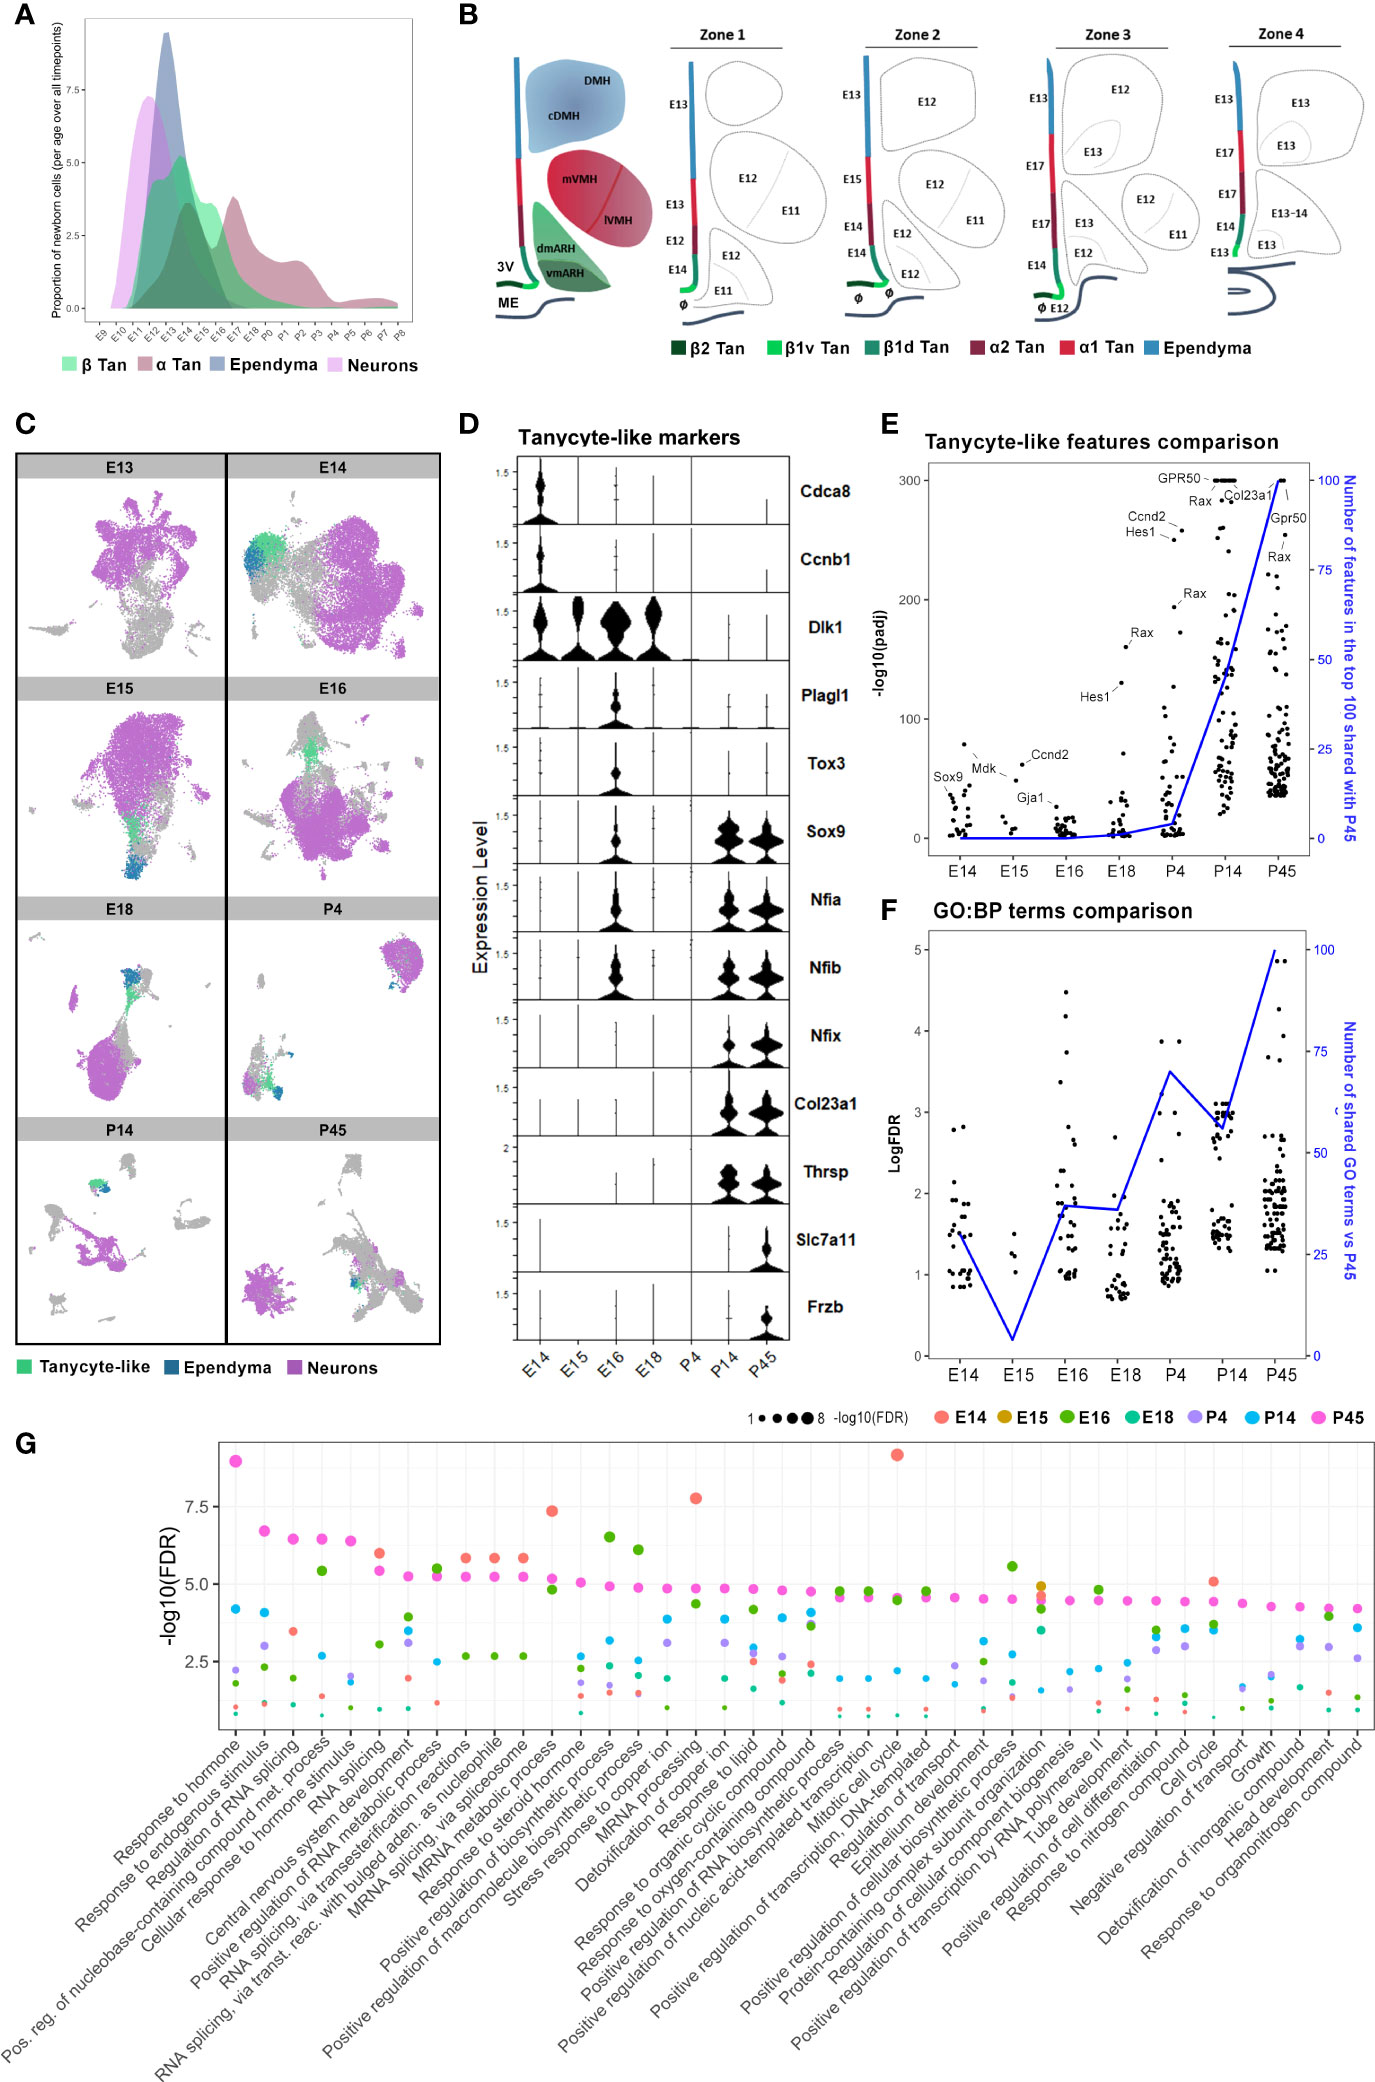
Figure 7 Cellular and molecular hypothalamic generation of mature tanycytes. (A) Representative plot illustrating the patterns of neuron, ependymal, and tanycyte generation across embryonic and early postnatal development extrapolated from our quantifications. (B) Rostrocaudal neuroanatomical representations of the developmental peaks of BrdU integration along the ventricular wall and hypothalamic nuclei. The ages indicate the peaks of genesis. The symbol ø indicates no clear peak of genesis (i.e., either multiple peaks or a continuous generation). (C) UMAP plots showing neuron (pink), ependymal (blue), and tanycyte-like (green) clusters in diencephalic and hypothalamic scRNAseq datasets (26), from E13 to P45, per developmental time point. (D) Violin plot showing specific features in tanycyte-like clusters across developmental time points from E14 to P45. (E) Comparison between the expression of the top 100 features of tanycyte-like cells at P45 versus those of tanycyte-like cells from every other developmental time point. The black dots represent features regarding their -log10(pAdj) significance. The blue line displays the number of features in the top 100 at each timepoint shared with the top 100 at P45. (F) Plot showing the comparison between the 100 more enriched GO terms from tanycyte-like cells at P45 (based on FDR) versus GO terms found in tanycyte-like cells from every other developmental time point. The black dots represent GO terms regarding their -log(FDR) significance. The blue line represents the number of GO terms shared in tanycyte-like clusters compared to P45. (G) Plot showing the -log10(FDR) of the top 40 more enriched GO terms in tanycyte-like cells at P45 compared to all time points. See Figure S3.
Tanycyte-like cells emerge as an independent cell population at E14 but are considered mature between P4 and P14
Our analysis revealed that neuron birthdate mainly peaks at E11-E13, ependymal cells at E13, and β and α tanycytes have a more widely distributed generation with multiple generative peaks between E12 and E18 (Figure 7A). To explore the developmental differences in the pattern of ependymal cell birthdate, we analyzed publicly available developmental hypothalamic scRNAseq datasets (26, 29). By using whole diencephalic or hypothalamic explants across embryonic and postnatal time points, Kim et al. (26) identified tanycytes to form an independent cluster starting at P4. Furthermore, they demonstrated that tanycytes diverge in trajectory from ependymal cells at E13 when they begin to express tanycyte and ependymal cell-specific markers, such as Rax and Foxj1, respectively (Figure S3A).
In agreement with their results, the analysis of the developmental scRNAseq datasets at each time point separately demonstrated that a population of tanycyte-like (Rax-positive) cells can be identified as an independent cluster starting from E14 (Figure 7C). Still, tanycyte-like cells do not share the same transcriptional profile across the different developmental time points. Indeed, DGE analysis of tanycyte-like cells at each developmental time point first showed that features commonly found in mature tanycytes, such as Col23a1, Frzb, Slc7a11, and Thrsp, are only observed in the P14 and P45 datasets (Figure 7D and Table S4). In contrast, genes involved in cell division, such as Cdca8 and Ccnb1, are expressed specifically at E14 (Figure 7D). Similarly, tanycyte-like cells from embryonic time points express Dlk1 and Cdk4 up to E18 (Figure 7D and Table S4), consistent with their proliferative capacity during early development (6, 32). The cyclin-dependent kinase Cdk4 is a master regulator of mitosis involved in cell proliferation (32), suggesting that these generating cells are likely radial glia. Interestingly, the genes Sox9, Tox3, Plag1, and several features from the NFI family of transcription factors (Nfia, Nifb), known to be involved in the negative regulation of neurogenesis (29) and the control of the onset of gliogenesis (33–35), are expressed at E16 (Figure 7D), corresponding to the end of neurogenesis peak and the burst in α tanycyte generation (Figures 4, 6). Consistently, Sox9 appears to be involved in the neurogenic-to-gliogenic fate switch (36). Secondly, we performed a comparative analysis of differentially expressed features in tanycyte-like clusters across development. Specifically, the 100 more significantly expressed genes in tanycyte-like cells at P45 were compared to tanycyte-like cell markers from the other developmental time points: most P14 and partially P4 tanycyte-like cells shared the same features compared to mature tanycytes at P45 (Figure 7E), highlighting the beginning of tanycyte maturation around P4. Indeed, we observed high levels of expression of the mature tanycyte markers Col23a1, Gpr50, and Ccnd2. Additionally, Hes1, a gene associated with the GO terms radial glia and neuroendocrine cell differentiation, shows an increase in expression levels starting from E18 (Figure 7E). Third, to further explore the immature versus mature state of tanycyte-like cells across developmental time points, we performed a gene ontology analysis focusing on biological process terms in tanycyte-like cells at P45 (Figure 7F) and compared the first 50 more significant GO terms to the other developmental time points (Figures 7F, G). Consistent with the known tanycyte functions (16–18), P45 GO terms comprise the response to hormones, endogenous stimulus, or lipids, and transport regulation (Figure 7G). As reported above, P4 and P14 tanycyte-like clusters shared the most GO terms compared to the older postnatal dataset (Figure 7F, blue line). Interestingly, many GO terms related to RNA processing and splicing are shared between E14 and P45 tanycyte-like clusters (Figure 7G). To summarize, these results suggest that while tanycytes-like cells are identified starting E14, these cells are not fully mature until early postnatal development, likely between P4 and P14.
Finally, to confirm the tanycyte maturity during postnatal development, we explored the occurrence of the different subtype specialization (i.e., α1, α2, β1, and β2 tanycytes) (Figures S3B, C). Due to the high heterogeneity of cell types found in the hypothalamic dataset of Kim et al. (26) and the relatively low number of tanycytes identified per age, tanycyte subtypes are not distinguishable at any time point. To overcome this issue, we analyzed a scRNAseq dataset of Rax+ hypothalamic cells in wild-type mice at P8 (29). In agreement with the original article, our analysis allowed the identification of the tanycyte α1, α2, β1, and β2 cell populations (Figures S3B, C), suggesting that tanycyte subtypes are already present during early postnatal development.
Transcriptional switch from gliogenesis to tanycyte maturation
To explore the tanycyte maturation process, we finally performed an integrative analysis of the hypothalamic developmental dataset of Kim et al. (26), focusing on the developmental trajectory of tanycytes from undifferentiated cells. Following cell type identification, we subset the progenitor (NPCs), tanycytes, and ependymal cell populations (Figures 8A, B) and perform pseudotime trajectory analysis (Figure 8C). The pseudotime analysis allowed us to visualize the transitional state and the timing of the developing trajectory from NPCs to tanycytes versus typical ependymal cells, respectively (Figure 8C). Developmental trajectories for the tanycyte population identified an age around E16 at which there is a first switch in cell fate towards glia differentiation (Figures 8D–F). From E11 to E16, the genes Tubb2b and Rlp10 involved in neurogenesis are highly expressed in the NPC clusters and rapidly decrease afterward (Figure 8F). At this time point (E16), the expression of genes involved in glial cell proliferation and differentiation (i.e., Dbi, Ptn, Nfix) and the negative regulation of neurogenesis (i.e., Mt3) increases (Figure 8F). Furthermore, we observed starting at E16 but more clearly around P4-P14 that a second switch towards tanycyte maturation characterized by an increased expression tanycyte specific markers (i.e., Col23a1) and genes involved in the negative regulation of astrocyte differentiation (i.e., Gpr37l1, Mt2) (Figure 8F and Table S5). Finally, similar maturation patterns were found in the ependyma trajectory (Figure S4 and Table S5). Specifically, starting from E16-18 and more clearly during the postnatal time points, ependyma begins to express specific markers such as Foxj1, Cdhr4, Pltp, Tm4sf1, Pcp4l1, Tmem212, Stoml3 and Hdc (Figure S4 and Table S5). These markers were associated with the GO terms glycolipid transport, positive regulation of cholesterol efflux, cilium, and negative regulation of mitotic cell cycle. In contrast, before E16 and along the trajectory from NPCs, we observed the expression of the immature markers Taf10, Kldhc2, Tead2, Nusap1, and Gap43, associated with cell division, radial glial cell differentiation, and embryonic development. Altogether, these results demonstrate that tanycyte-like cells originate from NPCs early during development and mature starting E16.
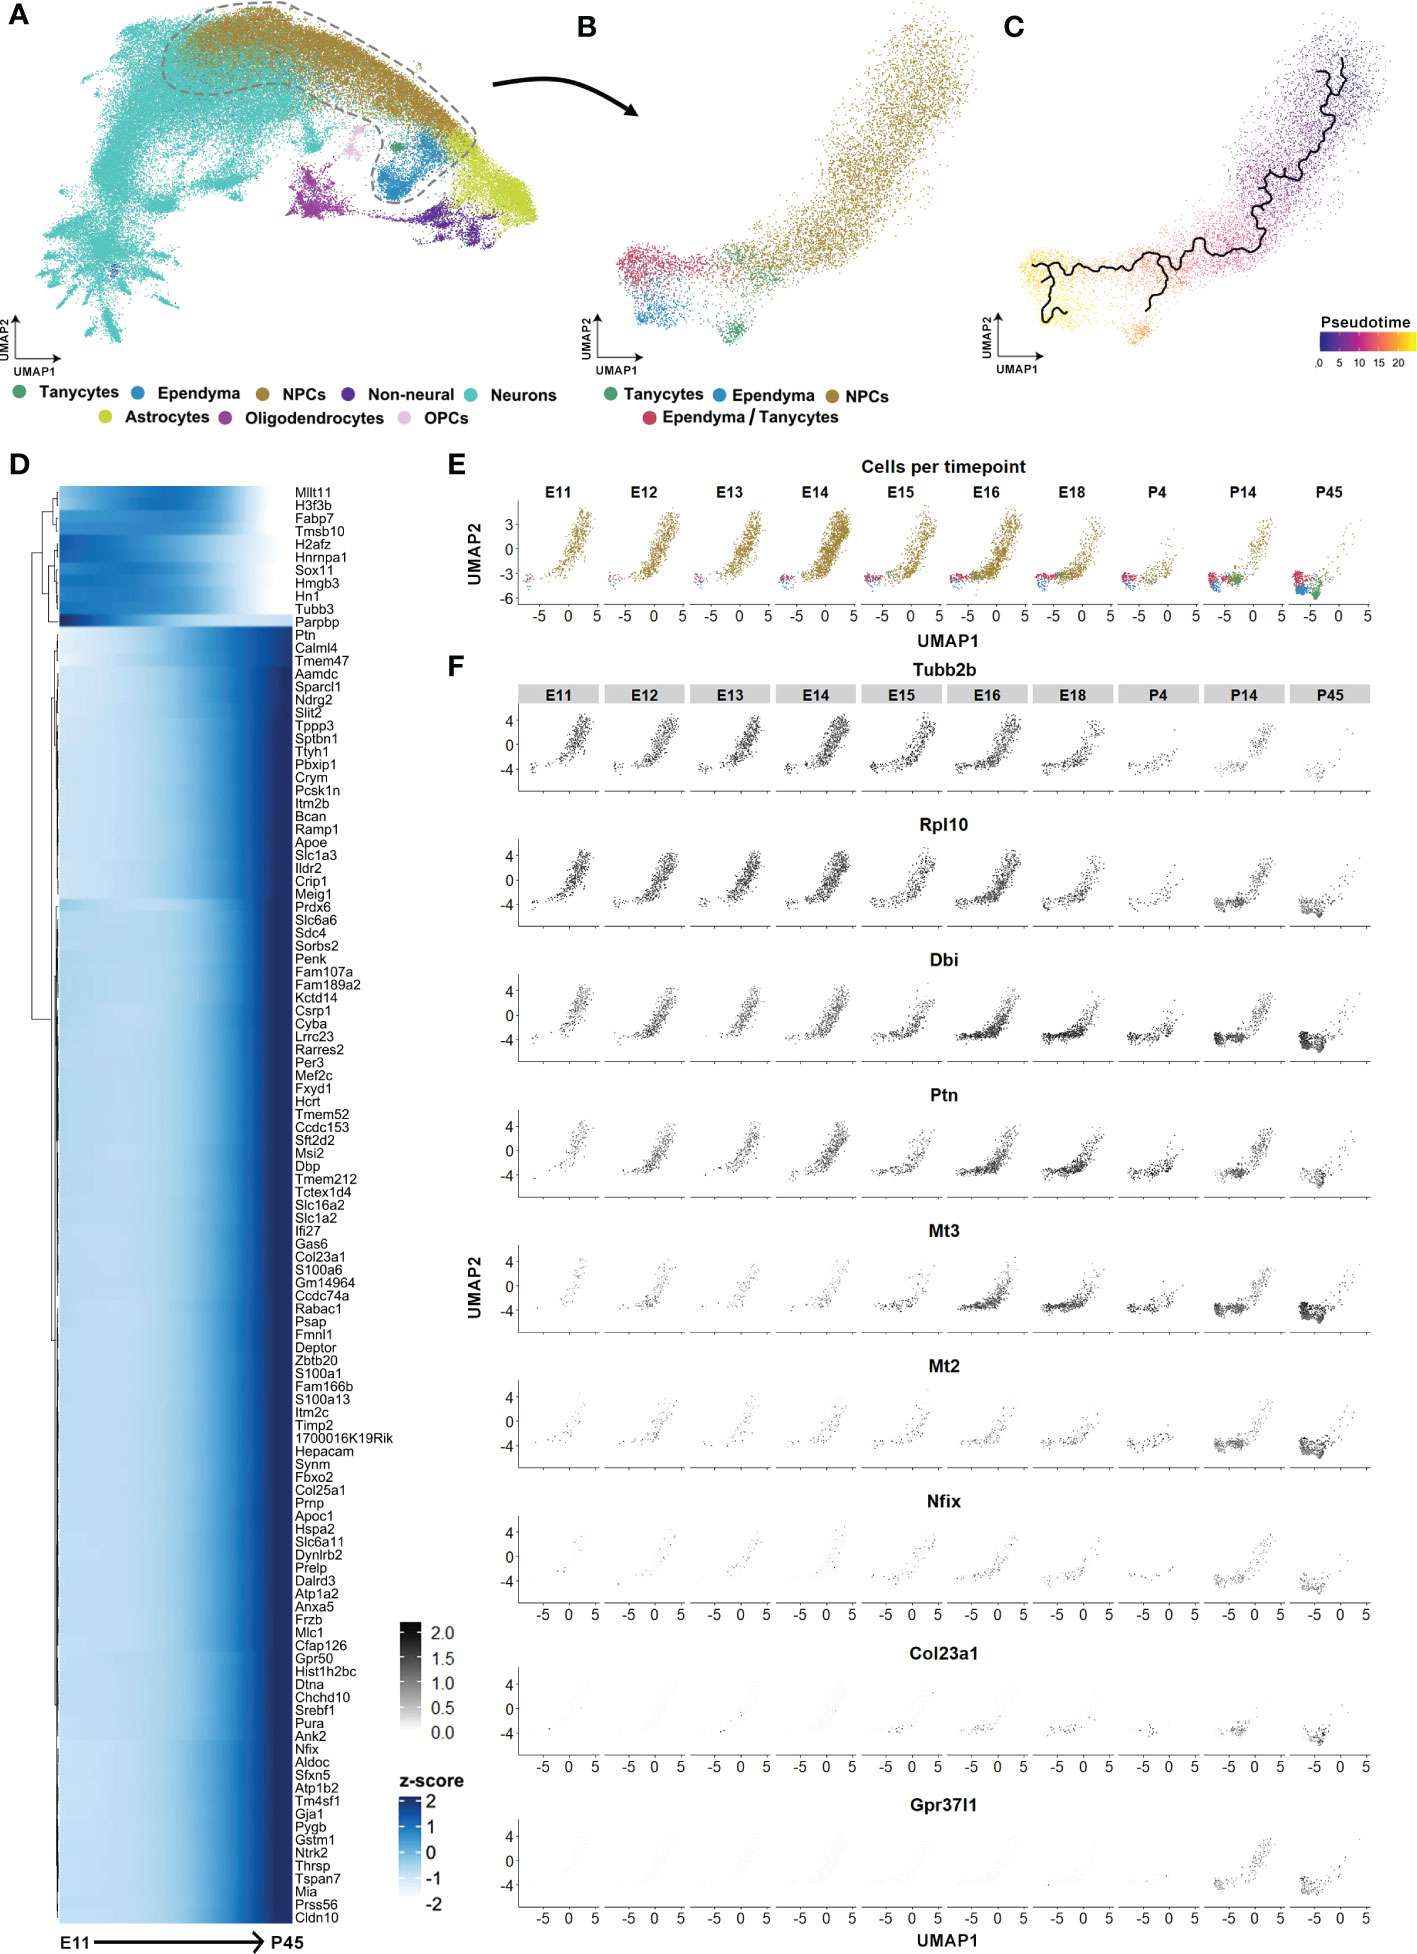
Figure 8 Tanycyte and ependyma developmental trajectories. (A) UMAP showing the integrated developmental scRNAseq datasets from hypothalamic and diencephalic explants between E11 and P45 (excluding E10 and P8 datasets) from Kim et al. (26). (B) UMAP showing the subclustering of progenitor cells (NPCs), tanycytes, ependyma, and tanycyte/ependymal cell populations. (C) UMAP plot displaying the pseudotime ependymal and tanycyte trajectories originating from NPCs. (D) Heatmap displaying the first 100 genes expressed in the pseudotime NPC to tanycyte trajectory. (E) UMAP displaying the development of tanycytes and ependymal cells split by age from E11 to P45. (F) UMAP showing features expressed across the developmental trajectory from NPCs to the tanycyte population. See Figure S4.
Discussion
This study shows that neurons, typical ependymal cells, and tanycytes arise at different generation rhythms during embryonic development. Neurons mainly arise at E11-13, typical ependymal cells at E13, and tanycytes display a wider developmental generation from E12-P3 without a clear peak when the different subtypes are not considered. Neuron birthdates differ in time and space in the mediobasal hypothalamus, defining a lateral-to-medial gradient for the VMH and a slight rostral-to-caudal gradient for the ARH and DMH. Furthermore, the ependyma arises with an outside-in dorsoventral gradient (i.e., typical ependymal cells and β tanycytes are generated before α tanycytes), as well as a marked rostral-to-caudal gradient for α1 et α2 tanycyte populations.
During embryonic development, neural cells originate from radial glial cells (37, 38), which display numerous cell functions such as (1) neurogenic (13, 37, 39) and gliogenic (40–42) competences, (2) helping migration of newborn neurons, and (3) monitoring gyrification of the cerebral cortex (43). First, in agreement with our results, it has been largely described that neurogenesis occurs from E10 to E16 in rodents, peaking between E12 and E14 in the mediobasal hypothalamic regions (8, 19, 24, 44, 45). Basically, it is usually established that hypothalamic neurogenesis peaks at E12-14 in mice and E13-15 in rats (46). Additionally, numerous studies −using the BrdU approach or others− observed a lateral-to-medial gradient in neuron generation that first occurs in the lateral hypothalamus around E11 and finish in the medial hypothalamic nucleus at E13 (8, 44, 45), although some did not find any variations in the timing and the neuroanatomical distribution (47). Here, we confirmed a lateral-to-medial gradient in the generation of the VMH. Additionally, our results showed a slight rostral-to-caudal gradient for neuronal generation in the ARH and DMH. In agreement with these results, such a gradient has already been described (19, 45). Notably, a study demonstrated that neuron birthdate first occurs at E11 in mid-rostral and ventral regions, followed by caudal regions at E14 (20). The authors found that mid-rostral neurons were mainly growth-releasing hormone (GRH)-neurons in the ARH region in rats. Such neuroanatomical generative gradients participate in hypothalamic regionalization and functions (26). Finally, our study does not reveal postnatal neurogenesis while it was already reported in the mediobasal hypothalamus (4). The difference is likely due to the approach we used (i.e., single BrdU injection) that does not allow the visualization of low-rate neurogenesis.
In mice and rats, typical ependymal cells and tanycytes also originate from radial glial cells (13, 43). In the rat, typical ependymal cells are mainly generated from E16 to E18, whereas tanycytes are generated from the last two days of gestation and during the first postnatal week (19). Besides, ependymal cell birthdate precedes tanycyte generation (19, 21, 22), and α2 tanycytes precede α1 tanycyte development (13). Similar developmental birthdates were found in primates where tanycyte differentiation occurs mid-gestation (23). Our results demonstrate a similar chronology with the generation of ependymal cells, followed by β tanycytes and α tanycytes. However, the ependyma generation appears early in mice, starting at E12. Additionally, our data reveal a robust rostral-to-caudal developmental gradient for α tanycytes, with more prominent activity in the caudal region. Altman and Bayer also defined the latest tanycyte generation in the caudal region, extending up to P8 in rats (19). These developmental gradients are also consistent with the fact that, among tanycyte subpopulations, the most dorsal α tanycytes are the last to reach maturity (48). Alternatively, it is worth noticing that a slight caudal-to-rostral gradient is present in the generation of β2 and ventral β1 tanycytes, suggesting a different developmental pattern in the median eminence, but without additional clues in the literature. Finally, comparing tanycyte subtype generative activity over the whole period revealed that α tanycyte generation is more prominent than β subpopulations. Interestingly, α tanycytes are the main subtype maintaining neurogenic competence in the postnatal brain (4, 29) and adulthood (49, 50). Therefore, BrdU incorporation in this subpopulation up to P8 may indirectly be linked to their stem cell properties in postnatal brains. Finally, we propose here the existence of a developmental “outside-in” dorsoventral gradient of generation, by which cells situated in the top (i.e., typical ependymal cells) and bottom of the ventricle (i.e., β tanycytes) generate the first together, followed by cells in the central regions (i.e., α tanycytes). Nothing to our knowledge was previously described in the literature regarding such an unusual dorsoventral gradient along the third ventricle. However, it may also rely on the limited area we analyzed (i.e., the mediobasal hypothalamus) and the way we cut the brain tissue (i.e., 2d coronal sections). Further studies are needed to reconstruct the genesis of the whole third ventricle and obtain a tridimensional picture of ependymal generation gradients.
To understand the temporal and spatial heterogeneity in the generation of the mediobasal 3V ependyma, we used a publicly available molecular atlas of the developing mouse hypothalamus, generated using diencephalic and hypothalamic explants across embryonic and postnatal time points (26). In this study, the authors identified the transcriptional divergence between tanycytes and typical ependymal cells at E13, with the differential expression of cell-type-specific markers such as Rax and Foxj1, respectively. Consistently, our BrdU analysis highlighted the peak of typical ependymal cell generation at E13. Using the same scRNAseq dataset, we also identified the appearance of tanycyte-like (Rax-positive) clusters starting at E14: however, a mature transcriptional profile is more clearly observed during the postnatal developmental time points P4-14, as reported by others (4). Indeed, between P4 and P14, tanycytes increase the expression of numerous markers described in adult cells, such as glucose (i.e., Slc2a1, Slc2a2) and glutamatergic transporters (i.e., Slc1a2, Slc1a3) (51–53) and growth factor receptors (i.e., Fgfr1, Igf1) (54–59). These observations suggest that tanycytes are mature enough between P4 and P14 to respond to variations in energy availability. Using a different approach, Mirzadeh et al. (60) estimated the maturation of tanycytes later by examining the postnatal expression of Nestin, a marker for radial glia (61), and GFAP. Over the first ten days postnatally, the authors observed a decrease in nestin expression and an increase in GFAP expression (60), suggesting that tanycyte maturation continues up to P10. Consistently, morphological and histological studies in the rat and mice have demonstrated that tanycytes begin to fully mature during the first month of life (19, 48, 62). Further studies integrating additional time points during postnatal development would be helpful to expand our knowledge about tanycytes maturation.
The molecular atlas of the developing mouse hypothalamus generated by Kim et al. also allowed us to infer the transcriptional trajectory of ependymal cells during development. Within the tanycyte developmental pseudotime trajectory, we identified E16 as another critical time point for the differentiation of tanycytes. At this point, the expression of specific genes increases, particularly Nfia, Nfib, and Nfix, known as negative regulators of neurogenesis in tanycyte populations (4). Indeed, a study showed recently that tanycyte-specific disruption of the NFI family of transcription factors robustly stimulates tanycyte dedifferentiation, proliferation, and neurogenesis (29). Interestingly, regarding our BrdU analysis, this increased expression of negative regulators of neurogenesis at E16 is concomitant with the end of the neuronal birth and the burst of α tanycytes generation in the mediobasal hypothalamus. Other transcription factors (i.e., Hes1, Notch2, Egr1, Id4) and genes (i.e., Apoe, Cd63, Cnih2, Arxes2) have also been identified during tanycyte differentiation (starting E16) and maturation (starting P4), and constitute excellent candidates for controlling the specification of these peculiar hypothalamic cell types. Interestingly, the helix-loop-helix gene Hes1, together with Notch1, responds to Rax to promote Muller glia cell differentiation (63). Further exploration of these candidates is needed to understand their role in tanycyte development better.
In conclusion, the ontogeny of ependymoglial cells diverges according to cell type, time, and neuroanatomical distribution. Our original cellular and molecular approach allowed us to demonstrate that tanycytes originate around E13, start to differentiate as early as E16, and reach full maturation during early postnatal development (P4-14). Globally, our data allowed us to generate a comprehensive spatiotemporal atlas of tanycyte birth and development and identify molecular candidates involved in the development of tanycytes.
Data availability statement
The datasets presented in this study can be found in online repositories. The names of the repository/repositories and accession number(s) can be found in the article/Supplementary Material.
Ethics statement
The animal study was reviewed and approved by Veterinary Office of Canton de Vaud & University of Lausanne.
Author contributions
DL-R contributed to data analysis, performed the bioinformatic analysis and wrote the manuscript. AR, ML and MG performed the experiments and participated in data analysis. SC and FL contributed to conception and design of the study, performed experiments, participated in data analysis and wrote the manuscript. All authors contributed to the article and approved the submitted version.
Funding
SC was supported by the Swiss National Science Foundation (PZ00P3_167934/1), the Professor Dr Max Cloëtta Foundation, and the Novartis Foundation for Medical-Biological Research (19B145). FL was supported by the Swiss National Science Foundation (PZ00P3_174120, PCEFP3_194551), the European Research Council Starting Grant (TANGO, No. 948196), Novartis Foundation for medical-biological research, the Department of Biomedical Sciences and the Faculty of Biology and Medicine at University of Lausanne. DL-R was supported by the Wallonie-Bruxelles Federation and the Leon Fredericq Foundation.
Conflict of interest
The authors declare that the research was conducted in the absence of any commercial or financial relationships that could be construed as a potential conflict of interest.
Publisher’s note
All claims expressed in this article are solely those of the authors and do not necessarily represent those of their affiliated organizations, or those of the publisher, the editors and the reviewers. Any product that may be evaluated in this article, or claim that may be made by its manufacturer, is not guaranteed or endorsed by the publisher.
Supplementary material
The Supplementary Material for this article can be found online at: https://www.frontiersin.org/articles/10.3389/fendo.2022.1073759/full#supplementary-material
References
1. García-Cáceres C, Balland E, Prevot V, Luquet S, Woods SC, Koch M, et al. Role of astrocytes, microglia, and tanycytes in brain control of systemic metabolism. Nat Neurosci (2019) 22(1):7–14. doi: 10.1038/s41593-018-0286-y
2. George JT, Seminara SB. Kisspeptin and the hypothalamic control of reproduction: Lessons from the human. Endocrinology (2012) 153(11):5130–6. doi: 10.1210/en.2012-1429
3. Lechan RM, Toni R. “Functional anatomy of the hypothalamus and pituitary.,” In: Feingold KR, Anawalt B, Boyce A, Chrousos G, de Herder WW, Dhatariya K, Dungan K, Hershman JM, Hofland J, Kalra S, et al., editors. Endotext. South Dartmouth (MA): MDText.com, Inc. (2000). Available at: http://www.ncbi.nlm.nih.gov/books/NBK279126/.
4. Yoo S, Blackshaw S. Regulation and function of neurogenesis in the adult mammalian hypothalamus. Prog Neurobiol (2018) 170:53–66. doi: 10.1016/j.pneurobio.2018.04.001
5. Kriegstein A, Alvarez-Buylla A. The glial nature of embryonic and adult neural stem cells. Annu Rev Neurosci (2009) 32:149–84. doi: 10.1146/annurev.neuro.051508.135600
6. Noctor SC, Flint AC, Weissman TA, Wong WS, Clinton BK, Kriegstein AR. Dividing precursor cells of the embryonic cortical ventricular zone have morphological and molecular characteristics of radial glia. J Neurosci (2002) 22(8):3161–73. doi: 10.1523/JNEUROSCI.22-08-03161.2002
7. Brischoux F, Fellmann D, Risold PY. Ontogenetic development of the diencephalic MCH neurons: A hypothalamic "MCH area" hypothesis. Eur J Neurosci (2001) 13(9):1733–44. doi: 10.1046/j.0953-816x.2001.01552.x
8. Croizier S, Franchi-Bernard G, Colard C, Poncet F, La Roche A, Risold P-Y. A comparative analysis shows morphofunctional differences between the rat and mouse melanin-concentrating hormone systems. PLoS One (2010) 5(11):e15471. doi: 10.1371/journal.pone.0015471
9. Díaz C, Morales-Delgado N, Puelles L. Ontogenesis of peptidergic neurons within the genoarchitectonic map of the mouse hypothalamus. Front Neuroanat (2014) 8:162. doi: 10.3389/fnana.2014.00162
10. McClellan KM, Parker KL, Tobet S. Development of the ventromedial nucleus of the hypothalamus. Front Neuroendocrinol (2006) 27(2):193–209. doi: 10.1016/j.yfrne.2006.02.002
11. Redmond SA, Figueres-Oñate M, Obernier K, Nascimento MA, Parraguez JI, López-Mascaraque L, et al. Development of ependymal and postnatal neural stem cells and their origin from a common embryonic progenitor. Cell Rep (2019) 27(2):429–41.e3. doi: 10.1016/j.celrep.2019.01.088
12. Jiménez AJ, Domínguez-Pinos M-D, Guerra MM, Fernández-Llebrez P, Pérez-Fígares J-M. Structure and function of the ependymal barrier and diseases associated with ependyma disruption. Tissue Barriers (2014) 2:e28426–6. doi: 10.4161/tisb.28426
13. Rodríguez EM, Blázquez JL, Pastor FE, Peláez B, Peña P, Peruzzo B, et al. Hypothalamic tanycytes: a key component of brain-endocrine interaction. Int Rev Cytology (2005) 247:89–164. doi: 10.1016/S0074-7696(05)47003-5
14. Rodríguez E, Guerra M, Peruzzo B, Blázquez JL. Tanycytes: A rich morphological history to underpin future molecular and physiological investigations. J Neuroendocrinol (2019) 31(3):e12690. doi: 10.1111/jne.12690
15. Langlet F, Mullier A, Bouret SG, Prevot V, Dehouck B. Tanycyte-like cells form a blood-cerebrospinal fluid barrier in the circumventricular organs of the mouse brain. J Comp Neurol (2013) 521(15):3389–405. doi: 10.1002/cne.23355
16. Bolborea M, Langlet F. What is the physiological role of hypothalamic tanycytes in metabolism? Am J Physiol Regulatory Integr Comp Physiol (2021) 320(6):R994–R1003. doi: 10.1152/ajpregu.00296.2020
17. Clasadonte J, Prevot V. The special relationship: glia-neuron interactions in the neuroendocrine hypothalamus. Nat Rev Endocrinol (2018) 14(1):25–44. doi: 10.1038/nrendo.2017.124
18. Langlet F. Tanycyte gene expression dynamics in the regulation of energy homeostasis. Front Endocrinol (2019) 10:286. doi: 10.3389/fendo.2019.00286
19. Altman J, Bayer SA. Development of the diencephalon in the rat. III. ontogeny of the specialized ventricular linings of the hypothalamic third ventricle. J Comp Neurol (1978) 182(4 Pt 2):995–1015. doi: 10.1002/cne.901820513
20. Markakis EA, Swanson LW. Spatiotemporal patterns of secretomotor neuron generation in the parvicellular neuroendocrine system. Brain Res Brain Res Rev (1997) 24(2–3):255–91. doi: 10.1016/s0165-0173(97)00006-4
21. Das GD. Gliogenesis and ependymogenesis during embryonic development of the rat: An autoradiographic study. J Neurological Sci (1979) 43(2):193–204. doi: 10.1016/0022-510X(79)90115-1
22. Korr H. Proliferation of different cell types in the brain. Advances in anatomy. Embryology Cell Biol (1980) 61:1–72. doi: 10.1007/978-3-642-67577-5
23. Scott DE, Pepe GJ. The fetal baboon median eminence as a circumventricular organ: I. transmission electron microscopy. Brain Res Bull (1987) 19(1):87–94. doi: 10.1016/0361-9230(87)90170-5
24. Ishii Y, Bouret SG. Embryonic birthdate of hypothalamic leptin-activated neurons in mice. Endocrinology (2012) 153(8):3657–67. doi: 10.1210/en.2012-1328
25. Chauvet N, Prieto M, Alonso G. Tanycytes present in the adult rat mediobasal hypothalamus support the regeneration of monoaminergic axons. Exp Neurol (1998) 151(1):1–13. doi: 10.1006/exnr.1998.6784
26. Kim DW, Washington PW, Wang ZQ, Lin SH, Sun C, Ismail BT, et al. The cellular and molecular landscape of hypothalamic patterning and differentiation from embryonic to late postnatal development. Nat Commun (2020) 11(1):4360. doi: 10.1038/s41467-020-18231-z
27. Pasquettaz R, Kolotuev I, Rohrbach A, Gouelle C, Pellerin L, Langlet F. Peculiar protrusions along tanycyte processes face diverse neural and nonneural cell types in the hypothalamic parenchyma. J Comp Neurol (2021) 529(3):553–75. doi: 10.1002/cne.24965
28. Rohrbach A, Caron E, Dali R, Brunner M, Pasquettaz R, Kolotuev I, et al. Ablation of glucokinase-expressing tanycytes impacts energy balance and increases adiposity in mice. Mol Metab (2021) 53:101311. doi: 10.1016/j.molmet.2021.101311
29. Yoo S, Kim J, Lyu P, Hoang T, Ma A, Trinh V, et al. Control of neurogenic competence in mammalian hypothalamic tanycytes. Sci Adv (2021) 7(22):eabg3777. doi: 10.1126/sciadv.abg3777
30. Choudhary S, Satija R. Comparison and evaluation of statistical error models for scRNA-seq. Genome Biol (2022) 23(1):27. doi: 10.1186/s13059-021-02584-9
31. Korsunsky I, Millard N, Fan J, Slowikowski K, Zhang F, Wei K, et al. Fast, sensitive and accurate integration of single-cell data with harmony. Nat Methods (2019) 16(12):1289–96. doi: 10.1038/s41592-019-0619-0
32. Malumbres M, Barbacid M. Mammalian cyclin-dependent kinases. Trends Biochem Sci (2005) 30(11):630–41. doi: 10.1016/j.tibs.2005.09.005
33. Clark BS, Stein-O'Brien GL, Shiau F, Cannon GH, Davis-Marcisak E, Sherman T, et al. Single-cell RNA-seq analysis of retinal development identifies NFI factors as regulating mitotic exit and late-born cell specification. Neuron (2019) 102(6):1111–26.e5. doi: 10.1016/j.neuron.2019.04.010
34. Glasgow SM, Zhu W, Stolt CC, Huang T-W, Chen F, LoTurco JJ, et al. Mutual antagonism between Sox10 and NFIA regulates diversification of glial lineages and glioma subtypes. Nat Neurosci (2014) 17(10):1322–9. doi: 10.1038/nn.3790
35. Matuzelski E, Bunt J, Harkins D, Lim JWC, Gronostajski RM, Richards LJ, et al. Transcriptional regulation of nfix by NFIB drives astrocytic maturation within the developing spinal cord. Dev Biol (2017) 432(2):286–97. doi: 10.1016/j.ydbio.2017.10.019
36. Kang P, Lee HK, Glasgow SM, Finley M, Donti T, Gaber ZB, et al. Sox9 and NFIA coordinate a transcriptional regulatory cascade during the initiation of gliogenesis. Neuron (2012) 74(1):79–94. doi: 10.1016/j.neuron.2012.01.024
37. Malatesta P, Hartfuss E, Götz M. Isolation of radial glial cells by fluorescent-activated cell sorting reveals a neuronal lineage. Dev (Cambridge England) (2000) 127(24):5253–63. doi: 10.1242/dev.127.24.5253
38. Malatesta P, Hack MA, Hartfuss E, Kettenmann H, Klinkert W, Kirchhoff F, et al. Neuronal or glial progeny: regional differences in radial glia fate. Neuron (2003) 37(5):751–64. doi: 10.1016/s0896-6273(03)00116-8
39. Alvarez-Buylla A, García-Verdugo JM, Tramontin AD. A unified hypothesis on the lineage of neural stem cells. Nat Rev Neurosci (2001) 2, Issue 4:287–93. doi: 10.1038/35067582
40. Levitt P, Cooper ML, Rakic P. Early divergence and changing proportions of neuronal and glial precursor cells in the primate cerebral ventricular zone. Dev Biol (1983) 96(2):472–84. doi: 10.1016/0012-1606(83)90184-7
41. Merkle D, Manuel G-VJ, Arturo A-B. Radial glia give rise to adult neural stem cells in the subventricular zone. Proc Natl Acad Sci (2004) 101(50):17528–32. doi: 10.1073/pnas.0407893101
42. Tramontin AD, García-Verdugo JM, Lim DA, Alvarez-Buylla A. Postnatal development of radial glia and the ventricular zone (VZ): a continuum of the neural stem cell compartment. Cereb Cortex (New York N.Y: 1991) (2003) 13(6):580–7. doi: 10.1093/cercor/13.6.580
43. Goodman T, Hajihosseini MK. Hypothalamic tanycytes–masters and servants of metabolic, neuroendocrine, and neurogenic functions. Front Neurosci (2015) 9:387. doi: 10.3389/fnins.2015.00387
44. Byerly MS, Blackshaw S. Vertebrate retina and hypothalamus development. Wiley Interdiscip Rev Syst Biol Med (2009) 1(3):380–9. doi: 10.1002/wsbm.22
45. Shimada M, Nakamura T. Time of neuron origin in mouse hypothalamic nuclei. Exp Neurol (1973) 41(1):163–73. doi: 10.1016/0014-4886(73)90187-8
46. Zhou X, Zhong S, Peng H, Liu J, Ding W, Sun L, et al. Cellular and molecular properties of neural progenitors in the developing mammalian hypothalamus. Nat Commun (2020) 11(1):4063. doi: 10.1038/s41467-020-17890-2
47. Bedont JL, Newman EA, Blackshaw S. Patterning, specification, and differentiation in the developing hypothalamus. Wiley Interdiscip Rev Dev Biol (2015) 4(5):445–68. doi: 10.1002/wdev.187
48. Walsh RJ, Brawer JR, Lin PL. Early postnatal development of ependyma in the third ventricle of male and female rats. Am J Anat (1978) 151(3):377–407. doi: 10.1002/aja.1001510305
49. Robins SC, Stewart I, McNay DE, Taylor V, Giachino C, Goetz M, et al. α-tanycytes of the adult hypothalamic third ventricle include distinct populations of FGF-responsive neural progenitors. Nat Commun (2013) 4:2049. doi: 10.1038/ncomms3049
50. Chaker Z, George C, Petrovska M, Caron JB, Lacube P, Caillé I, et al. Hypothalamic neurogenesis persists in the aging brain and is controlled by energy-sensing IGF-I pathway. Neurobiol Aging (2016) 41:64–72. doi: 10.1016/j.neurobiolaging.2016.02.008
51. Berger UV, Hediger MA. Differential distribution of the glutamate transporters GLT-1 and GLAST in tanycytes of the third ventricle. J Comp Neurol (2001) 433(1):101–14. doi: 10.1002/cne.1128
52. García MA, Millán C, Balmaceda-Aguilera C, Castro T, Pastor P, Montecinos H, et al. Hypothalamic ependymal-glial cells express the glucose transporter GLUT2, a protein involved in glucose sensing. J Neurochem (2003) 86(3):709–24. doi: 10.1046/j.1471-4159.2003.01892.x
53. Peruzzo B, Pastor FE, Blázquez JL, Amat P, Rodríguez EM. Polarized endocytosis and transcytosis in the hypothalamic tanycytes of the rat. Cell Tissue Res (2004) 317(2):147–64. doi: 10.1007/s00441-004-0899-1
54. Cardona-Gómez GP, DonCarlos L, Garcia-Segura LM. Insulin-like growth factor I receptors and estrogen receptors colocalize in female rat brain. Neuroscience (2000) 99(4):751–60. doi: 10.1016/s0306-4522(00)00228-1
55. De Seranno S, d’Anglemont de Tassigny X, Estrella C, Loyens A, Kasparov S, Leroy D, et al. Role of estradiol in the dynamic control of tanycyte plasticity mediated by vascular endothelial cells in the median eminence. Endocrinology (2010) 151(4):1760–72. doi: 10.1210/en.2009-0870
56. Everitt BJ, Meister B, Hökfelt T, Melander T, Terenius L, Rökaeus A, et al. The hypothalamic arcuate nucleus-median eminence complex: Immunohistochemistry of transmitters, peptides and DARPP-32 with special reference to coexistence in dopamine neurons. Brain Res (1986) 396(2):97–155. doi: 10.1016/s0006-8993(86)80192-5
57. Fekete C, Mihály E, Herscovici S, Salas J, Tu H, Larsen PR, et al. DARPP-32 and CREB are present in type 2 iodothyronine deiodinase-producing tanycytes: implications for the regulation of type 2 deiodinase activity. Brain Res (2000) 862(1–2):154–61. doi: 10.1016/s0006-8993(00)02105-3
58. Lerant A, Freeman ME. Ovarian steroids differentially regulate the expression of PRL-r in neuroendocrine dopaminergic neuron populations: a double label confocal microscopic study. Brain Res (1998) 802(1–2):141–54. doi: 10.1016/s0006-8993(98)00583-6
59. Matsuo A, Tooyama I, Isobe S, Oomura Y, Akiguchi I, Hanai K, et al. Immunohistochemical localization in the rat brain of an epitope corresponding to the fibroblast growth factor receptor-1. Neuroscience (1994) 60(1):49–66. doi: 10.1016/0306-4522(94)90203-8
60. Mirzadeh Z, Kusne Y, Duran-Moreno M, Cabrales E, Gil-Perotin S, Ortiz C, et al. Bi- and uniciliated ependymal cells define continuous floor-plate-derived tanycytic territories. Nat Commun (2017) 8(1):13759. doi: 10.1038/ncomms13759
61. Park D, Xiang AP, Zhang L, Mao FF, Walton NM, Choi SS, et al. The radial glia antibody RC2 recognizes a protein encoded by nestin. Biochem Biophys Res Commun (2009) 382(3):588–92. doi: 10.1016/j.bbrc.2009.03.074
62. Monroe BG, Paull WK. Ultrastructural changes in the hypothalamus during development and hypothalamic activity: the median eminence. In: Swaab DF, Schadé BR, editors. Integrative hypothalamic activity, (Amsterdam: The Netherlands) vol. 41 . Elsevier (1974). p. 185–208. J. P. B. T.-P. doi: 10.1016/S0079-6123(08)61907-X
Keywords: third ventricle, tanycytes, ependymal cells, hypothalamic development, scRNAseq, BrdU
Citation: Lopez-Rodriguez D, Rohrbach A, Lanzillo M, Gervais M, Croizier S and Langlet F (2023) Ontogeny of ependymoglial cells lining the third ventricle in mice. Front. Endocrinol. 13:1073759. doi: 10.3389/fendo.2022.1073759
Received: 18 October 2022; Accepted: 02 December 2022;
Published: 05 January 2023.
Edited by:
Alexandre Benani, Centre National de la Recherche Scientifique (CNRS), FranceReviewed by:
Karine Rizzoti, Francis Crick Institute, United KingdomShannon William Davis, University of South Carolina, United States
Copyright © 2023 Lopez-Rodriguez, Rohrbach, Lanzillo, Gervais, Croizier and Langlet. This is an open-access article distributed under the terms of the Creative Commons Attribution License (CC BY). The use, distribution or reproduction in other forums is permitted, provided the original author(s) and the copyright owner(s) are credited and that the original publication in this journal is cited, in accordance with accepted academic practice. No use, distribution or reproduction is permitted which does not comply with these terms.
*Correspondence: Fanny Langlet, ZmFubnkubGFuZ2xldEB1bmlsLmNo
†These authors share second authorship
‡These authors share last authorship