Abstract
Objective:
Invasive pituitary adenomas (IPAs) are common tumors of the nervous system tumors for which invasive growth can lead to difficult total resection and a high recurrence rate. The basement membrane (BM) is a special type of extracellular matrix and plays an important role in the invasion of pituitary adenomas (PAs). The aim of this study was to develop a risk model for predicting the invasiveness of PAs by analyzing the correlation between the expression of BM genes and immune infiltration.
Methods:
Four datasets, featuring samples IPAs and non-invasive pituitary adenomas (NIPAs), were obtained from the Gene Expression Omnibus database (GEO). R software was then used to identify differentially expressed genes (DEGs) and analyze their functional enrichment. Protein-protein interaction (PPI) network was used to screen BM genes, which were analyzed for immune infiltration; this led to the generation of a risk model based on the correlation between the expression of BM genes and immunity. A calibration curve and receiver operating characteristic (ROC) curve were used to evaluate and validate the model. Subsequently, the differential expression levels of BM genes between IPA and NIPA samples collected in surgery were verified by Quantitative Polymerase Chain Reaction (qPCR) and the prediction model was further evaluated. Finally, based on our analysis, we recommend potential drug targets for the treatment of IPAs.
Results:
The merged dataset identified 248 DEGs that were mainly enriching in signal transduction, the extracellular matrix and channel activity. The PPI network identified 11 BM genes from the DEGs: SPARCL1, GPC3, LAMA1, SDC4, GPC4, ADAMTS8, LAMA2, LAMC3, SMOC1, LUM and THBS2. Based on the complex correlation between these 11 genes and immune infiltration, a risk model was established to predict PAs invasiveness. Calibration curve and ROC curve analysis (area under the curve [AUC]: 0.7886194) confirmed the good predictive ability of the model. The consistency between the qPCR results and the bioinformatics results confirmed the reliability of data mining.
Conclusion:
Using a variety of bioinformatics methods, we developed a novel risk model to predict the probability of PAs invasion based on the correlation between 11 BM genes and immune infiltration. These findings may facilitate closer surveillance and early diagnosis to prevent or treat IPAs in patients and improve the clinical awareness of patients at high risk of IPAs.
Introduction
Pituitary adenomas (PAs) are common neuroendocrine tumors that account for 10–15% of all primary tumors of the central nervous system (1). Most PAs are non-invasive, follow a slow growth pattern and remain in the intra sella (2). However, 25–55% of PAs may exhibit invasive features (Knosp grade III and IV), including invasion of the cavernous and sphenoidal sinuses and local or extensive bone erosion; these tumors are considered as invasive pituitary adenomas (IPAs) (3). Compared with non-invasive pituitary adenomas (NIPAs), IPAs are characterized by large volume, rapid proliferation, a high recurrence rate and a poor prognosis; moreover, these tumors are difficult to completely remove by surgery. Collectively, these factors can lead to serious damage being incurred by adjacent structures (3, 4). Despite numerous studies and advances in classification and prognosis, there are still no pathological marker that can be used to reliably predict the behavior of IPAs (5). Therefore, it is vital that we identify early diagnostic biomarkers for the clinicopathological behavior of IPAs and investigate the molecular mechanisms underlying the invasiveness of this condition.
An increasing number of studies have shown that the tumor microenvironment (TME) plays a crucial role in tumor progression and treatment (6). Therapeutic strategies targeting the TME have become a promising approach for the treatment of tumors (7). The TME consists of various types of immune cells, activated fibroblasts, basement membranes, capillaries and the extracellular matrix (8). Recent studies have characterized different subsets of immune and stromal cells in the TME of PAs, as well as cytokines, growth factors and stromal remodeling enzymes (9). The basement membrane (BM) is a key element of the TME and is widely distributed in the extracellular matrix of metazoan tissues (10). The function of the BM is to resist mechanical stress, determine tissue shape and create diffusion barriers (11). The BM can also provide signals that guide cell polarity, differentiation, migration and survival (12). Because the mechanistic actions of the BM can affect morphological changes in tissues, it follows that the BM can also affect the proliferation, invasion and metastasis of tumor cells (13). The structure and properties of the BM are encoded and regulated by a specific suite of BM genes; variations in the expression of BM genes are considered to be the basis of many human diseases. In addition, proteins in the BM are the selective targets of autoantibodies in immune diseases (14, 15). Therefore, the combined study of BM genes and immune infiltration in IPAs may provide new clues for the clinical prevention, diagnosis, and treatment of this disease.
A recent study developed and defined a comprehensive network of more than 200 genes and proteins in the BM (16). On this basis, we used several bioinformatics methods to investigate the mechanisms underlying the specific action of BM genes in IPAs. Four datasets containing IPA and NIPA samples were downloaded from the Gene Expression Omnibus database (GEO) to obtain expression data from genes in the BM. Then, we developed a protein-protein interaction network (PPI) that specifically related to genes in the BM. Next, we analyzed the correlation between the expression of BM genes and immune infiltration to develop a risk model to predict the invasiveness of PAs. Finally, we validated our findings by performing qPCR on samples acquired from surgery and recommended 10 possible drugs.
Materials and methods
Data acquisition and processing
Figure 1 shows a flowchart of the study process. First, we downloaded four IPA- related datasets (Table 1) from the Gene Expression Omnibus (GEO) database of the National Center for Biotechnology Information (NCBI): GSE51618, GSE26966, GSE169498, and GSE22812. These datasets were then merged with the “limma” package in R software (version 4.2.1); the “sva” package was used to remove lot-to-batch differences and other unwanted variations (17).
Figure 1

Flowchart showing the study process.
Table 1
| Accession numbers | Platform | Non-invasive PA | Invasive PA | Species |
|---|---|---|---|---|
| GSE51618 | GPL6480 | 4 | 3 | Homo sapiens |
| GSE26966 | GPL570 | 7 | 7 | Homo sapiens |
| GSE169498 | GPL22120 | 24 | 49 | Homo sapiens |
| GSE22812 | GPL2895 | 5 | 8 | Homo sapiens |
Information relating to the four microarray datasets.
Identification of differentially expressed genes
Differentially expressed genes (DEGs) were identified by comparing expression levels between IPA samples and NIPA samples in the merged dataset using the “limma” package (18); the screening criteria were a P < 0.05 and |log2FC| > 1. “Heatmap” and “ggplot2” packages were used to create heatmaps and volcano plots to visualize DEGs (19).
DEGs enrichment analysis
To investigate the enrichment pathways and functions of DEGs, we performed the gene ontology (GO) and Kyoto Encyclopedia of Genes and Genomes (KEGG) enrichment analyses to explore biological significance and key approaches. For this, we used the “cluster Profiler”, “ggplot2”, “org.Hs.eg.db” and “enrichplot” packages of R software; P < 0.05 was considered as significant enrichment (20, 21).
Acquisition of BM genes and construction of a PPI network
We identified genes in the BM with differential expression by identifying intersecting DEGs. Next, we used the STRING database (https://string-db.org) to construct a PPI network (with a confidence score of 0.4) for the identified genes; irrelevant genes were removed according to the degree of the connection and a cluster composed of interconnecting BM genes was obtained for subsequent analyses and risk model construction.
Recognition of transcription factors and miRNAs
Transcription factors (TFs) are proteins that attach to specific genes and control the rate of DNA transcription. TFs recognize specific DNA sequences to control chromatin and transcription and form a complex system that directs genomic expression and underlies many different aspects of human physiology, disease, and variation (22). Topologically trusted TFs that often bind to genes were identified using the JASPAR database in NetworkAnalyst (23), an online platform for analyzing gene expression data and gaining insight into biological mechanisms, roles, and interpretations. In addition, miRNAs can be used to track target gene interactions that result in binding to gene transcripts that are detrimental to protein expression; in the present study, we used Tarbase as an experimental validity database of miRNAs-genes interactions (24, 25). Using this database, we extracted miRNAs interacting with genes in the PPI network and performed topological analysis to explore their biological functions and characteristics.
Analysis of immune infiltration
Next, we used several packages in R (“ggpubr”, “GSVA”, “GSEABase” and “reshape2”) to analyze immune infiltration and correlations in samples and to analyze differences in the infiltration of immune cells and immune functions between IPA samples and NIPA samples. These results were presented as heatmaps and correlation matrix maps.
Correlation analysis of BM genes and immunity
The ssGSEA algorithm was used to quantify the relative infiltration levels of immune cells and immune functions in the merged dataset (26). Next, we performed Spearman’s correlation analysis of immune cells and determined their relative functions in the BM gene cluster. Then, “psych” and “ggcorrplot” packages in R were used to visualize rectangular correlation plots.
Risk model construction and verification
A risk prediction model for IPA was constructed by considering the correlations between the expression of BM genes and immune infiltration; this model was visualized by a nomogram. A calibration curve and receiver operating characteristic (ROC) curve were then used to evaluate and validate the model.
Sample selection and qPCR validation
To validate our bioinformatics results, we used qPCR to verify the expression levels of the top three genes contributing to the risk model (THBS2, SDC4 and LUM). The samples of PA tissues collected in this study were acquired from PA patients who underwent endoscopic transsphenoidal pituitary surgery in the Neurosurgery Department of The First Affiliated Hospital of Xiamen University between December 2021 and August 2022. All tissue samples were frozen in liquid nitrogen immediately after surgical resection and stored in a -80°C refrigerator to await further analysis; five IPA tissue samples and five NIPA tissue samples were acquired. All of the selected samples were confirmed by preoperative imaging, intraoperative endoscopic observation and postoperative pathology. IPAs were defined according to Knosp classification grades III-IV (27). All participants and their families provided signed and informed consent and the study was approved by the ethics committee of hospital.
Total RNA was extracted from samples using TRIzol reagent (Servicebio, Wuhan, China) for reverse transcription and SYBR Green qPCR Master Mix (None ROX) for qPCR in accordance with the manufacturer’s instructions. We used the GAPDH gene as an internal reference and the primer sequences are summarized in Supplementary Table S1. Each sample was repeated at least three times. The relative expression levels of THBS2, SDC4 and LUM were calculated using the 2-△△CT method. Differences in expression were analyzed by GraphPad prism (version 8.0.1) and the student’s t-test was used to determine the significance of the differences between groups. P < 0.05 was considered statistically significant.
Drug recommendation
The DSigDB is a global database for identifying gene-related targeted drugs (28) and was used as a drug signature database to identify drug molecules. Potential drugs were identified by using the cluster of BM genes in the risk prediction model and the ‘diseases/drugs’ function in the online web tool Enrichr (https://maayanlab.cloud/Enrichr/ ).
Statistical analysis
All data processing and analysis were performed in R software (version 4.2.1) and GraphPad prism (version 8.0.1). To compare continuous variables between the two groups, the statistical significance of normally distributed variables was calculated by the independent student’s t-test. Differences between non-normally distributed variables were calculated by the Wilcoxon rank-sum test. Chi-squared tests or Fisher’s exact test were performed to determine statistical significance of categorical variables between the two groups. Correlation coefficients between different genes were determined by Pearson correlation analysis. All statistical p-values were two-sided and P < 0.05 was considered statistically significant.
Results
Data processing and the identification of DEGs
After removing the batch effect and merging the four datasets, 248 DEGs were identified between the IPA and NIPA samples after screening the merged dataset using P < 0.05 and |log2FC| > 1 as criteria. This included 91 up-regulated genes and 157 down-regulated genes; these were visualized as a heatmap (Figure 2A) and a volcano plot (Figure 2B).
Figure 2

The identification of DEGs between IPA and NIPA samples in the merged dataset. (A) Heatmap, red rectangles represent high expression while blue rectangles represent low expression. (B) Volcano plot, red dots represent up-regulated genes, blue dots represent down-regulated genes, and black dots represent genes with no significant difference.
DEG enrichment analysis
GO enrichment analysis showed that for biological processes, the DEGs were significantly enriched in the modulation of chemical synaptic transmission, the regulation of transsynaptic signaling and the regulation of hormone levels. For cellular components, DEGs were enriched in the collagen-containing extracellular matrix, glutamatergic synapses and the transmembrane transporter complex. For molecular functions, the DEGs were enriched in channel activity, passive transmembrane transporter activity and ion channel activity (Figure 3A). KEGG enrichment analysis showed that DEGs were mainly enriched in neuroactive ligand-receptor interaction, cAMP signaling pathways, ECM-receptor interaction and other related pathways (Figure 3B). Further details are provided in Supplementary Table S2, S3.
Figure 3

DEG enrichment results. (A) Bubble chart for GO analysis showing the top five GO terms for biological process (BP), cellular component (CC) and molecular function (MF). (B) Bubble chart for KEGG pathway analysis showing the top six enriched KEGG pathways in DEGs.
Identification of BM genes and construction of a PPI network
In total, 13 BM genes and their expression levels were extracted for the selected DEGs (Figure 4A). These were input into the STRING database to construct a PPI network with a confidence score of 0.4. A cluster of 11 BM genes was then obtained for subsequent analysis after removing irrelevant genes (UNC5D and FREM1): SPARCL1, GPC3, LAMA1, SDC4, GPC4, ADAMTS8, LAMA2, LAMC3, SMOC1, LUM and THBS2 (Figure 4B). Further details of the 224 BM genes and 248 DEGs are provided in Supplementary Table S4.
Figure 4

Venn diagram and PPI network. (A) Venn diagram of BM genes and DEGs; the intersection in the middle represents the identification of BM genes from DEGs. (B) PPI network; the cluster on the left shows how the 11 BM genes were connected with each other; the two genes on the right were irrelevant genes.
Identification of TFs and miRNAs
To identify substantial changes occurring at the transcriptional level and gain insight into the molecules that regulate these 11 BM genes, we employed a network-based approach to decode regulatory TFs and miRNAs. Then, we used NeworkAnalyst to generate a BM genes-TFs interaction network (Figure 5A) and a BM genes-miRNAs interaction network (Figure 5B). It was evident that both TFs and miRNAs were closely related to the 11 BM genes, thus indicating that their characteristic features were regulated by more than one BM gene; furthermore, there was evidence of strong levels of interaction between the 11 BM genes.
Figure 5
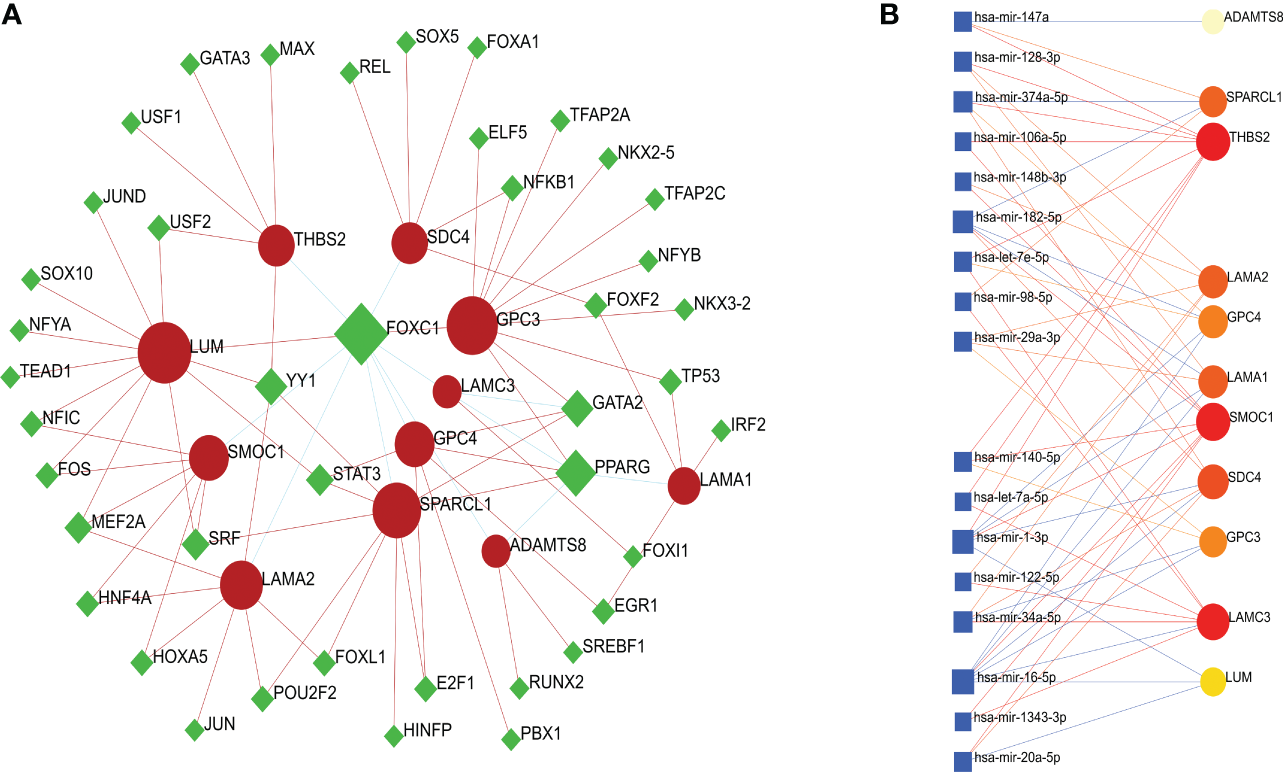
(A) A cohesive and regulatory BM genes–TFs interaction network; the rhombic nodes are TFs and interactions between gene symbols and TFs are shown as circle nodes. (B) An interconnected regulatory BM genes–miRNAs interaction network; the circle nodes indicate miRNAs and interactions between gene symbols and miRNAs are shown as squares.
Analysis of immune infiltration
Immune infiltration analysis showed that immune cells and immune functions differed with respect to their correlations (Figure 6A). Immune cells showed different degrees of positive and negative correlation (Figure 6B); the most significant correlation was between tumor infiltrating lymphocytes (TILs) and macrophages for which immune function consistently showed positive correlation (Figure 6C). Furthermore, several types of immune cells, including DCs, B cells, Neutrophils, Tfh and Th1 cells (Figure 6D) and immune functions such as APC co-inhibition, check point, and type I IFN response (Figure 6E) differed significantly between the IPA and NIPA samples.
Figure 6

Analysis of immune infiltration. (A) Immune-related heatmap. (B) Rectangular diagram of immune cells. (C) Rectangular diagram of immune function. (D) Differences of immune cells when compared between IPA samples and NIPA samples. (E) Differences in immune function when compared between IPA samples and NIPA samples. * indicates P < 0.05, * indicates P < 0.01, ns indicates no significance.
Correlation analysis of BM genes and immunity
According to the analysis of the expression levels of 11 BM genes and immune infiltration, we constructed a correlation rectangle diagram (Figure 7) which showed that the 11 BM genes identified had different degrees of correlation with immune cells and immune function. The most significant positive correlation was between SDC4 and DCs. LAMA2 exhibited the most significant negative correlation with Tfh (r=-0.61). THBS2 was correlated with the highest number of immune cells and immune function items; all were positively correlated except for Tfh.
Figure 7

Correlation rectangle diagram for 11 BM genes and immunity showing correlations between the 11 BM genes and immunity including immune cells and immune functions; red indicates a positive correlation, purple indicates a negative correlation and the number in the box is the correlation coefficient.
Construction and verification of a risk prediction model
Next, a risk model for IPAs was constructed based on the results arising from complex correlation between the 11 BM genes and immunity; the model was presented as a nomogram (Figure 8A) which was able to generate individual probabilities of clinical events by integrating different variables, thus meeting the need for biological and integrated models and achieving the promotion of personalized medicine (29). All 11 genes contributed to the model although THBS2 contributed the most and accounted for the highest score. Calibration curves were used to visualize the performance of the nomogram, thus confirming the performance of the evaluation model (Figure 8B). The effectiveness of the model to predict the invasiveness of PAs was verified by ROC analysis (AUC: 0.7886194), thus proving that the model exhibited good evaluation value (Figure 8C).
Figure 8

Model establishment and verification (A) Nomogram; ‘high’ and ‘low’ represent gene expression levels. (B) Calibration curves; the dashed diagonal line in grey represents the ideal prediction by a perfect model. The closer the bias-corrected calibration curve (red line) is to the diagonal line, the higher the prediction accuracy of the model. (C) ROC curve; the area under the red curve represents the AUC.
qPCR validation
The ten clinical samples used for qPCR were obtained from five patients with NIPAs (Figure 9A) and five patients with IPAs (Figure 9B); analysis showed that the expression levels of THBS2 (P = 0.0196), SDC4 (P = 0.016) and LUM (P = 0.0284) in IPA tissues were significantly lower than those in NIPA tissues (Figure 9C–E). These findings were consistent with those arising from DEGs analysis, thus indicating that the data mining was reliable and the model has potential research value.
Figure 9

qPCR detection. (A) Preoperative MRI scans from five patients with NIPAs. (B) Preoperative MRI scans from five patients with IPAs. (C–E) Expression levels of THBS2, SDC4 and LUM in IPA and NIPA tissues along with statistical results arising from unpaired t-tests, * indicates P < 0.05.
Drug recommendations
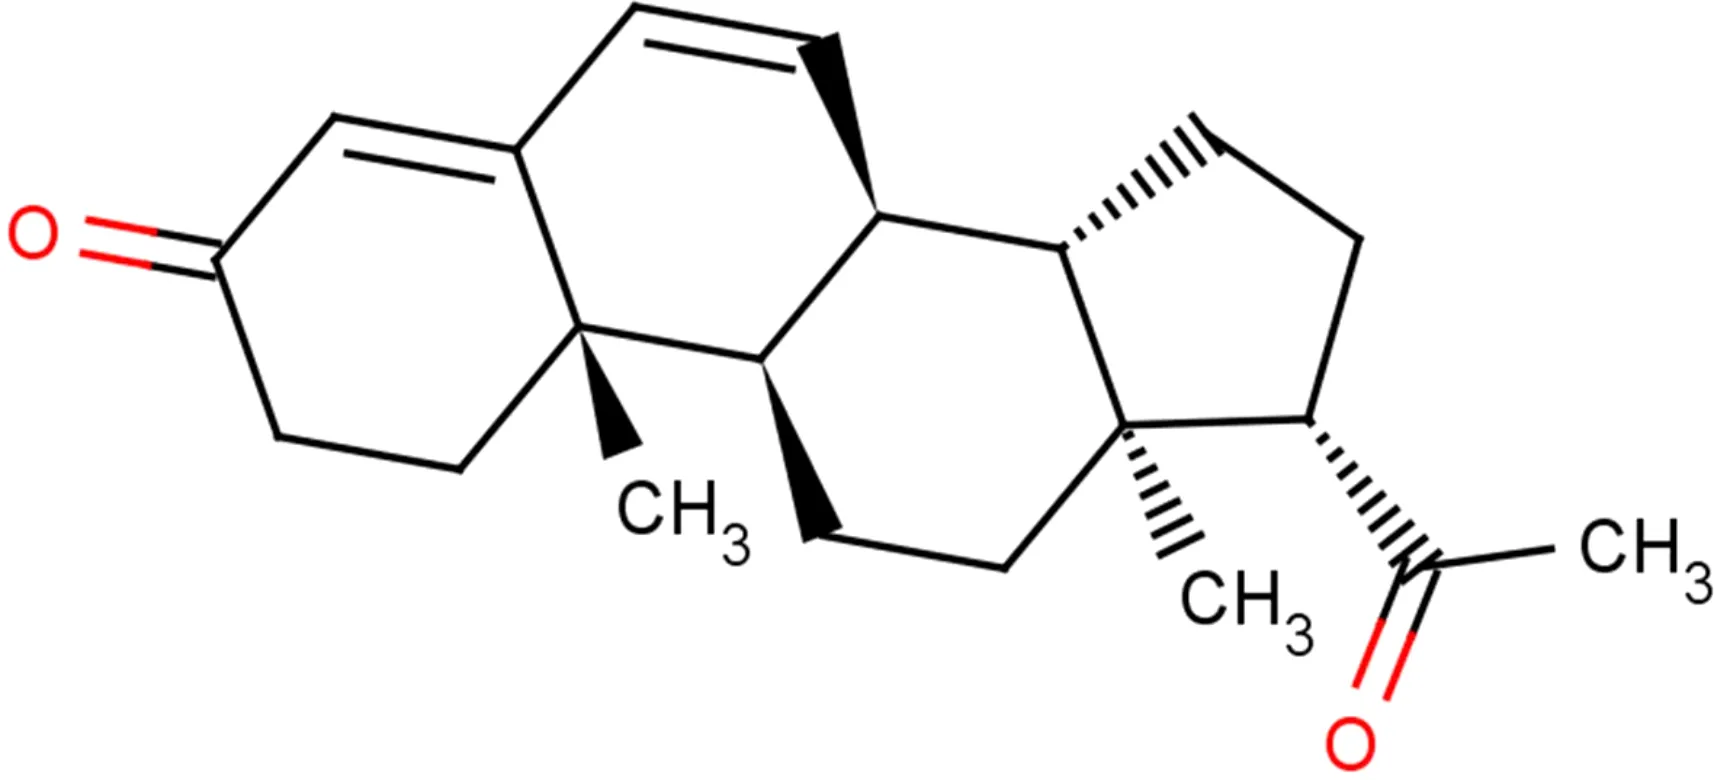
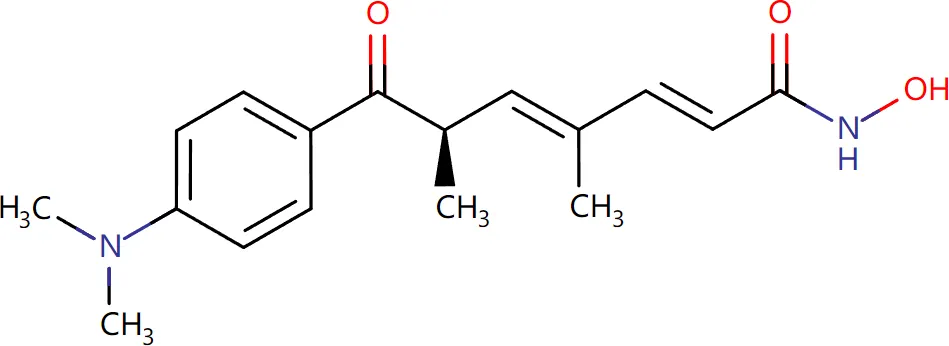
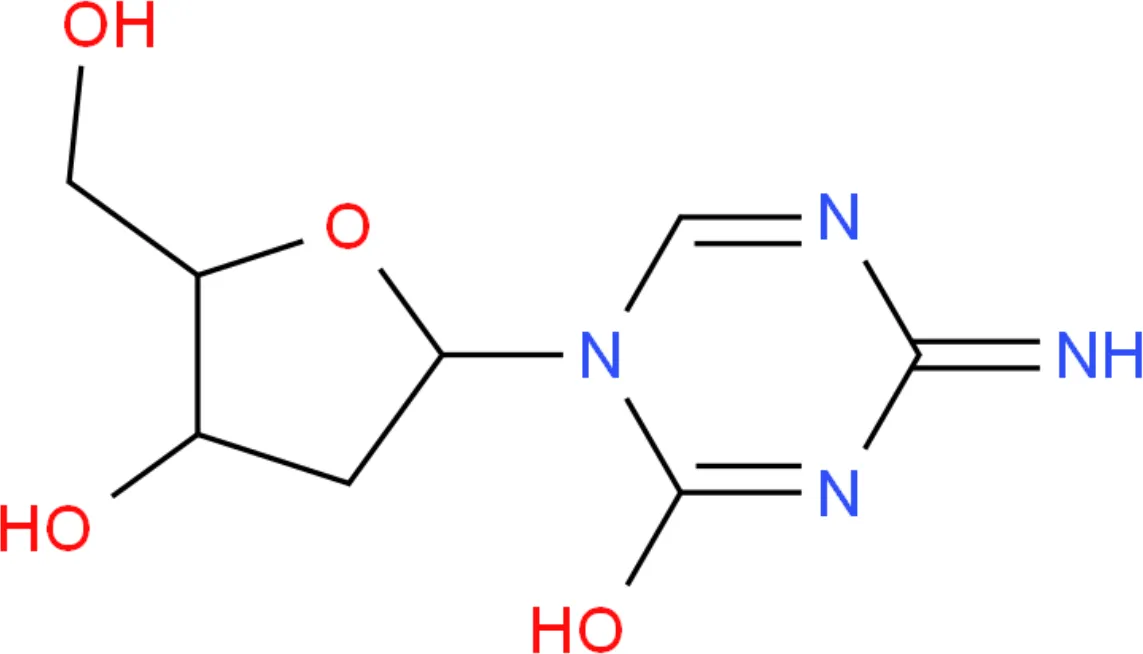
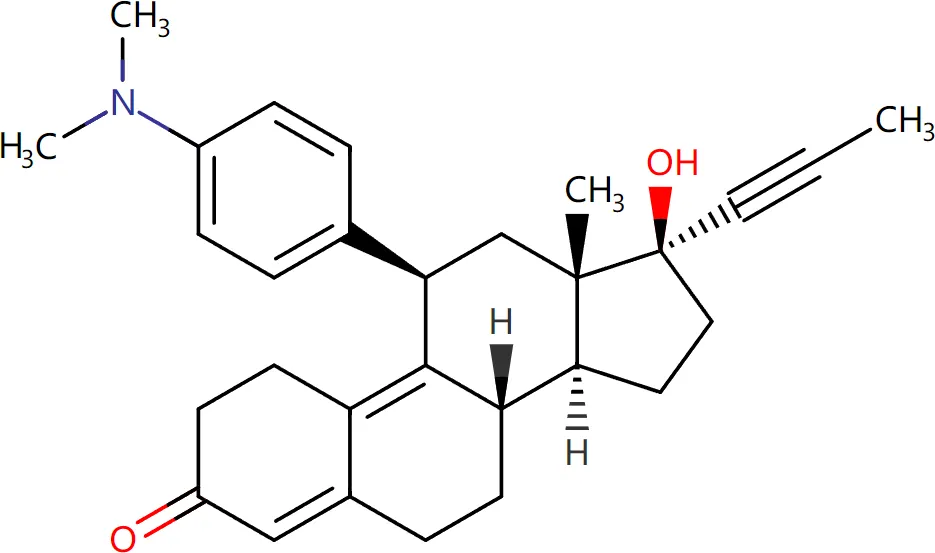
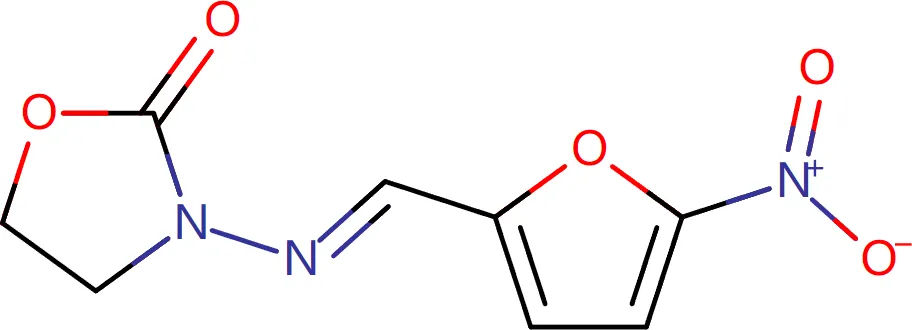
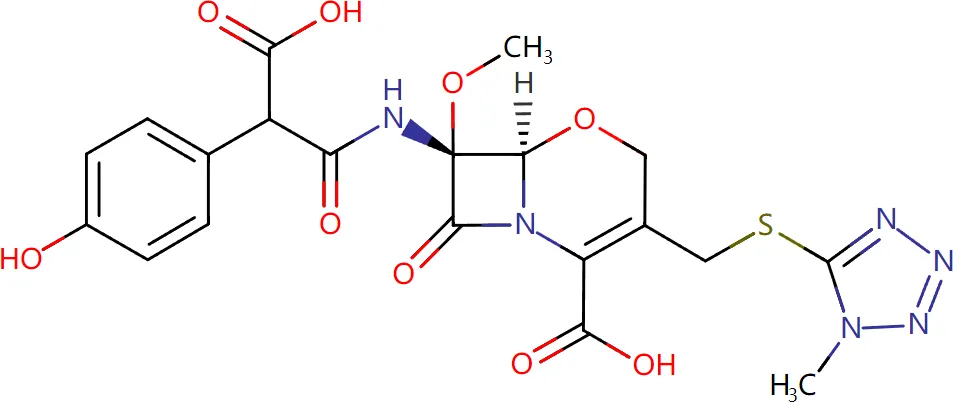
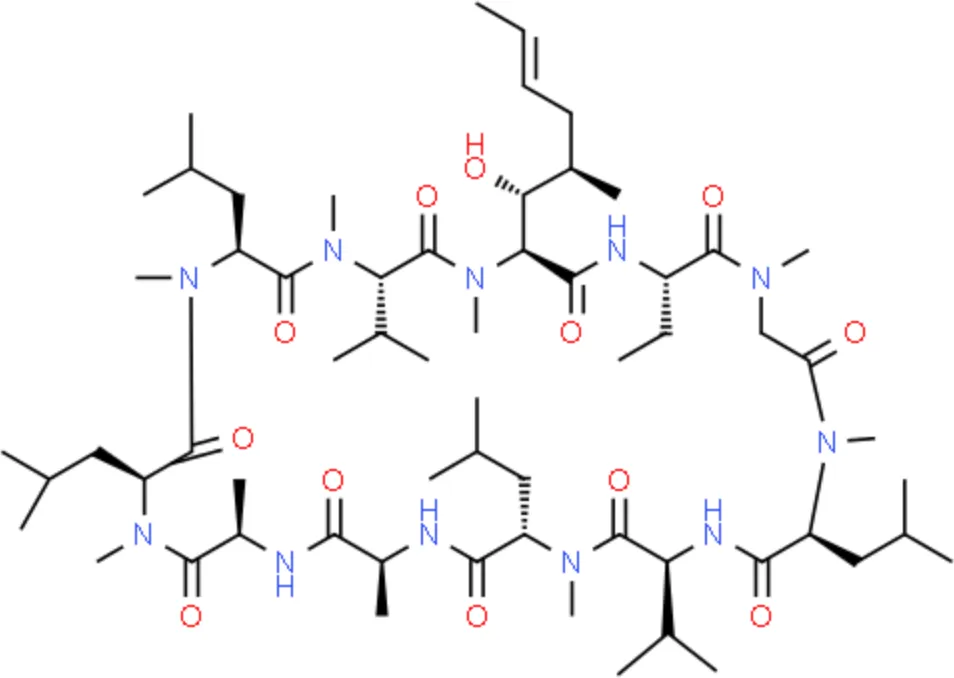
Target-drug interaction analysis can reveal interactions between drugs and targets that are critical if we are to understand the structural features necessary for receptor sensitivity (30). The 11 BM genes featuring in the model were used as drug targets to extract the top 10 drugs from the DSigDB database according to P-value. Then, we obtained the chemical and structural formulae for each drug from the Drugbank database (Table 2).
Table 2
| Name | P-value | Chemical Formula | Structure |
|---|---|---|---|
| Dasatinib CTD 00004330 |
0.00224428 | C22H26ClN7O2S |

|
| Progesterone CTD 00006624 |
0.002262266 | C21H30O2 |
|
| Retinoic acid CTD 00006918 |
0.002879104 | C20H28O2 |

|
| Trichostatin A CTD 00000660 |
0.006687154 | C17H22N2O3 |
|
| Arbutin CTD 00005438 |
0.010086441 | C12H16O7 |

|
| Decitabine CTD 00000750 |
0.012900927 | C8H12N4O4 |
|
| Mifepristone CTD 00007083 |
0.013922574 | C29H35NO2 |
|
| Furazolidone HL60 DOWN |
0.020167647 | C8H7N3O5 |
|
| Latamoxef HL60 UP |
0.024508037 | C20H20N6O9S |
|
| Cyclosporin A CTD 00007121 |
0.029019386 | C62H111N11O12 |
|
The top 10 recommended drugs.
Discussion
IPAs are common and intractable intracranial epithelial-derived tumors with multiple causes, processes and outcomes (31). Recent advances in the field of molecular medicine have shown that molecular changes at the levels of the genome, transcriptome, proteome, and metabolome are all involved in the potential invasion of PAs (32). In addition, the altered expression of some genes and the presence of mutations are also associated with the invasiveness of PAs (33). However, the mechanism underlying invasion and proliferation have yet to be fully elucidated. The BM is a special type of extracellular matrix that is present in epithelial-derived tumors. Tumor cells must repeatedly destroy and overcome this barrier to invade adjacent structures or metastasize (34, 35). Once integrity is lost, forces from overlying differentiated tumor cells may mechanically drive the invasion of tumor progenitor cells at stromal boundaries (36). Previous studies have shown that the TME is essential for tumor growth, invasion and metastasis (37) and the interaction between tumor cells and associated stroma also represents a powerful relationship that might affect disease initiation, progression and prognosis (38). As an important component of the TME and an indispensable extracellular matrix of PAs, the BM not only affects immune infiltration, but also affects tumor invasiveness. Since the structure and properties of the BM are encoded and regulated by specific genes expressed in the BM, we specifically investigated the mechanistic action of BM genes in IPAs.
Four datasets, featuring IPAs and NIPAs, were downloaded from the GEO database, merged, and then screened for DEGs. Enrichment analysis of the DEGs suggested that GO terms were mainly enriched in signal transduction, extracellular matrix, and channel activity. KEGG analysis revealed enrichment in neuroactive ligand-receptor interaction, the cAMP signaling pathway and ECM-receptor interaction. Signal transduction and channel activity play an important role in the endocrine function of the pituitary gland (39). As a key element of the TME, ECM degradation affects the proliferation, invasion and metastasis of tumor cells (40). These pathways may be involved in the disease progression of IPAs under the regulation of the DEGs identified.
In order to further investigate the roles and mechanistic actions of BM genes in IPAs, we extracted 13 BM genes from the DEGs. After removing the irrelevant genes by PPI network analysis, a cluster composed of 11 closely connected BM genes was obtained, including SPARCL1, GPC3, LAMA1, SDC4, GPC4, ADAMTS8, LAMA2, LAMC3, SMOC1, LUM and THBS2. Most of the genes were expressed at low levels and may contribute to the reduction or degradation of BM stiffness to promote tumor invasion; similar results were reported previously (36). Next, we used the 11 BM genes to generate a BM genes-TFs interaction network and a BM genes-miRNAs interaction network to identify transcriptional and post-transcriptional regulators. Of the identified TFs, FOXC1 is known to inhibit the migration and invasion of pituitary tumor cells under the regulation of has-mir-133; furthermore, members of the FOXC1 family are already known as drug targets for cancer (41, 42). PPARG has been found to directly regulate pituitary function in mice (43). YY1, as a transcriptional repressor, has been found to be related to the sequence of hypersensitive site V in the control region of the human growth hormone gene locus (44). The expression of GATA2 in PAs can be detected by immunochemistry and used to identify gonadotropic PAs; furthermore, the interaction between GATA2 and Pit-1 can lead to gene-specific action and the differentiation of TSH-secreting PAs (45, 46). Previous studies have shown that miRNA markers are promising biomarkers for the treatment of different types of PAs (47). For example, has-mir-34c-3p, has-mir-34B-5p, has-mir-378 and has-mir-338-5p were all significantly down-regulated in in prolactin PAs, while the down-regulation of has-mir-493-5p and the up-regulation of has-mir-181b-5p has been detected in NFPAs (48). Furthermore, the expression of has-mir-184 was found to be significantly up-regulated while the expression of has-mir-124-3p was down-regulated in GH-secreting PAs (48). Furthermore, has-mir-143 has been shown to inhibit cell proliferation and promote cell apoptosis by targeting K-Ras (49). In a previous study, Vicchio et al. found that the downregulation of has-mir-26b-5p and has-mir-30a-5p was negatively associated with ki-67, atypical morphological features, and invasion of the cavernous sinus (50). Of these interrelated miRNAs, hsa-mir-128-3p, hsa-let-7e-5p, hsa-mir-98-5p, hsa-mir-29a-3p, hsa-mir-140-5p, hsa-mir-34a-5p, and hsa-mir-20a-5p have all been related to the occurrence and development of tumors (51). Investigating the underlying mechanisms of TFs and miRNAs may be important for understanding the invasiveness of IPAs and may help us to discover new potential biomarkers and yield innovative therapies.
Next, we compared immune infiltration between IPA tissues and NIPA tissues. We identified significant differences between the two groups with regards to DCs, B cells, neutrophils, Th1 cells and Thf cells. DCs have been shown to be present in the pituitary gland and play an important role in immune activation of the hypothalamic-pituitary-adrenal (HPA) axis; the maturation and migration of DCs to lymphatic tissue is key to developing an immune response or maintaining tolerance (52). B cells have been shown to exhibit higher levels of infiltration in aggressive GH-secreting PAs; this was related to overactivation of the JAK-STAT pathway (53). In addition, the expression of IL-10 by tumor cells and macrophages has been shown to promote the survival of B cells and lymphomas by producing TNF family member B cell activators and IL-10, thus suppressing the adaptive immune response; this mechanism is thought to facilitate the evasion of immune surveillance (54). Neutrophils, Th1 cells and Thf cells are important immune cells in the TME. Research has shown that neutrophils may determine tumor proliferation and angiogenesis while the polarization of immune response in Th1 cells can stimulate anti-tumor immunity and inhibit the progression of PAs. The IL-21 produced by Thf cells has been shown to be necessary for the inhibition of tumor and CD8 cell function (55–57). In the present study, the immune cells and immune functions in the two groups of samples were found to be interrelated; the strongest correlation among immune cells was between macrophages and TILs. The lactic acid secreted by IPAs can promote M2 polarization in macrophages, thus contributing to angiogenesis and the inhibition of immune response; this process can also cause the release of CCL17 to enhance the invasion of PAs via the CCL17/CCR4/mTORC1 axis (58, 59). TILs were found to be positively related to macrophages and is currently being used as an emerging immunotherapy for solid tumors; in addition, TILs have been successfully applied for the treatment of some tumors (60). These results are consistent with the positive correlation between various co-inhibition and co-stimulation in the correlation analysis of immune function in the samples. Moreover, we identified many important immune correlations; these correlations and targets may provide new concepts for the treatment of IPAs. On this basis, we performed correlation analysis between the 11 BM genes and immunity and found that the 11 genes were all correlated with immunity to differing degrees; THBS2, LUM, SDC4, SMOC1 and ADAMTS8 exhibited the most immune-related items or higher correlation coefficients. THBS2 had the largest number of association items; most of these were positively correlated. Moreover, the value of THBS2 in tumor immunity and diagnosis has been confirmed in several previous studies (61–64); however, the value of THBS2 in IPAs has not been reported previously. LUM, a member of the small leucine-rich proteoglycans (SLRP) family, is a component of the extracellular matrix (65). Low expression levels of LUM at the tumor margin in malignant melanoma may promote the proliferation of melanoma cells; however, whether LUM acts as a tumor suppressor or oncogenic gene depends on the cellular environment and thus related to the TME (66). Analysis showed that SDC4 and SMOC1 had similar immune-related performance and both exhibited strong positive correlations with DCs; other genes exhibited negative correlations. SDC4 is a transmembrane proteoglycan that binds to the ECM and soluble factors via extracellular glycosaminoglycan chains. In a previous study, Horiguchi et al. demonstrated that SDC4 mediated the formation of stress fibers in the anterior pituitary hair follicle cells of rats, thus resulting in key morphological changes (67). SMOC1 was first discovered in 2002, is widely distributed in the basement membrane ECM of many tissues (68), and is known to be upregulated in oligodendrocytoma and astrocytic tumors and can inhibit the migration of glioma U87 cells induced by tenascin C (69). As a therapeutic target for T cell-associated immune responses, ADAMTS8 was negatively correlated with most of the immune responses in the result. The only immune cell that was positively correlated with ADAMTS8 was Tfh; this association helped to develop or support the recruitment sites of CD8+T cells, NK cells, and macrophages, while supporting the anti-tumor antibody response of B cells (70, 71). LAMA2, GPC4 and SPARCL1 have been found to be associated with NFPAs in recent studies; the expression and methylation status of LAMA2 are known to be related to the invasiveness of NFPAs (72). Furthermore, a previous study identified significant differences in the expression levels of GPC4 when compared between normal pituitary glands and invasive NFPAs (73). Thus, SPARCL1 can be used as a potential diagnostic or prognostic marker in patients with NFPAs and also represents a potential therapeutic target (74). LAMC3 (75), LAMA1 (76) and GPC3 (77) also play important roles in the progression of malignant tumors and immunotherapy.
Although associations between IPAs and genetic or clinical variables have been reported previously, it is rare to include multiple variables in the assessment of invasiveness. In this study, a risk model for IPAs was established based on the immune infiltration results of 11 BM genes that exhibited complex associations with IPAs. The low expression levels of THBS2, SDC4, LUM, SPARCL1, LAMA2, LAMC3, and ADAMTS8 could increase the risk of PA invasiveness, especially low expression levels of THBS2, SDC4 and LUM, as verified by qPCR. Furthermore, the high expression levels of GPC4, SMOC1, LAMA1 and GPC3 could increase the risk of PAs invasiveness. Collectively, the expression levels of each gene in the model collectively correspond to the risk coefficient of IPAs. The predictive value of the model was evaluated by calibration curve and ROC analysis; these analyses proved that the accuracy of the model for predicting the invasiveness of PA was satisfactory (AUC=0.7886194), thus providing a reference for clinical diagnosis and individualized treatment planning. Finally, 10 possible drugs were recommended for the 11 BM genes included in the model, which may provide the possibility of drug treatment for IPAs and facilitate researchers interested in this field to conduct further research from the perspective of genes and drugs.
To the best of our knowledge, this is the first comprehensive study to predict the invasiveness of PAs based on the correlations between BM genes and immunity. Our findings may provide new possibilities for the prevention, diagnosis and treatment of IPAs. However, this study still has some limitations that need to be considered. Firstly, this study involved a comprehensive prediction model based on multiple types of PAs from multiple centers; thus, the model may show bias when predicting the invasiveness of a specific type of PA. Additional validation, incorporating more accurate and extensive clinical data is now needed to improve the accuracy of the model. Secondly, although qPCR showed that the expression levels of BM genes were consistent with the results of bioinformatics, the specific role and biological mechanisms underlying the action of BM genes in the invasiveness of PAs need to be investigated further. Furthermore, our findings, and the potential mechanisms involved in the correlations between the 11 BM genes and immune infiltration also need to be verified and explored by complex molecular biology experiments or flow cytometry analysis in future research.
Conclusion
We used a variety of bioinformatics methods to develop a nomogram model to predict the invasiveness of PAs based on the correlations between 11 selected BM genes and immune infiltration. These findings may facilitate closer surveillance and early diagnosis to prevent or treat IPAs in patients. our findings may also improve the awareness of clinicians with regards to patients at high risk of IPAs.
Statements
Data availability statement
The datasets presented in this study can be found in online repositories. The names of the repository/repositories and accession number(s) can be found in the article/Supplementary Material.
Ethics statement
The studies involving human participants were reviewed and approved by The First Affiliated Hospital of Xiamen University. The patients/participants provided their written informed consent to participate in this study. Written informed consent was obtained from the individual(s) for the publication of any potentially identifiable images or data included in this article.
Author contributions
Conception and design: ZC. Writing and review of the manuscript: ZC and HZ. Data analysis and interpretation: ZC and XS. Samples collection and processing: ZC, YK, HZ and XL. Experiment performance and analysis: JZ and FJ. All authors contributed to the article and approved the submitted version.
Funding
This work was supported by the Natural Science Foundation of Fujian Province (No. 2019J01567).
Acknowledgments
This work has benefited from GEO, we are grateful to the researchers who built the public database and shared an enormous amount of research data.
Conflict of interest
The authors declare that the research was conducted in the absence of any commercial or financial relationships that could be construed as a potential conflict of interest.
Publisher’s note
All claims expressed in this article are solely those of the authors and do not necessarily represent those of their affiliated organizations, or those of the publisher, the editors and the reviewers. Any product that may be evaluated in this article, or claim that may be made by its manufacturer, is not guaranteed or endorsed by the publisher.
Supplementary material
The Supplementary Material for this article can be found online at: https://www.frontiersin.org/articles/10.3389/fendo.2022.1079777/full#supplementary-material
References
1
Melmed S . Pituitary-tumor endocrinopathies. N Engl J Med (2020) 382(10):937–50. doi: 10.1056/NEJMra1810772
2
Molitch ME . Diagnosis and treatment of pituitary adenomas: A review. Jama (2017) 317(5):516–24. doi: 10.1001/jama.2016.19699
3
Di Ieva A Rotondo F Syro LV Cusimano MD Kovacs K . Aggressive pituitary adenomas–diagnosis and emerging treatments. Nat Rev Endocrinol (2014) 10(7):423–35. doi: 10.1038/nrendo.2014.64
4
Raverot G Dantony E Beauvy J Vasiljevic A Mikolasek S Borson-Chazot F et al . Risk of recurrence in pituitary neuroendocrine tumors: A prospective study using a five-tiered classification. J Clin Endocrinol Metab (2017) 102(9):3368–74. doi: 10.1210/jc.2017-00773
5
Saeger W Petersenn S Schöfl C Knappe UJ Theodoropoulou M Buslei R et al . Emerging histopathological and genetic parameters of pituitary adenomas: Clinical impact and recommendation for future WHO classification. Endocr Pathol (2016) 27(2):115–22. doi: 10.1007/s12022-016-9419-6
6
Bian X Xiao YT Wu T Yao M Du L Ren S et al . Microvesicles and chemokines in tumor microenvironment: mediators of intercellular communications in tumor progression. Mol Cancer (2019) 18(1):50. doi: 10.1186/s12943-019-0973-7
7
Bejarano L Jordāo MJC Joyce JA . Therapeutic targeting of the tumor microenvironment. Cancer Discovery (2021) 11(4):933–59. doi: 10.1158/2159-8290.Cd-20-1808
8
Jiang J Mei J Yi S Feng C Ma Y Liu Y et al . Tumor associated macrophage and microbe: The potential targets of tumor vaccine delivery. Adv Drug Delivery Rev (2022) 180:114046. doi: 10.1016/j.addr.2021.114046
9
Marques P Grossman AB Korbonits M . The tumour microenvironment of pituitary neuroendocrine tumours. Front Neuroendocrinol (2020) 58:100852. doi: 10.1016/j.yfrne.2020.100852
10
Pozzi A Yurchenco PD Iozzo RV . The nature and biology of basement membranes. Matrix Biol (2017) 57-58:1–11. doi: 10.1016/j.matbio.2016.12.009
11
Jayadev R Chi Q Keeley DP Hastie EL Kelley LC Sherwood DR . α-integrins dictate distinct modes of type IV collagen recruitment to basement membranes. J Cell Biol (2019) 218(9):3098–116. doi: 10.1083/jcb.201903124
12
Sherwood DR . Basement membrane remodeling guides cell migration and cell morphogenesis during development. Curr Opin Cell Biol (2021) 72:19–27. doi: 10.1016/j.ceb.2021.04.003
13
Kelley LC Chi Q Cáceres R Hastie E Schindler AJ Jiang Y et al . Adaptive f-actin polymerization and localized ATP production drive basement membrane invasion in the absence of MMPs. Dev Cell (2019) 48(3):313–328.e8. doi: 10.1016/j.devcel.2018.12.018
14
Nyström A Bornert O Kühl T . Cell therapy for basement membrane-linked diseases. Matrix Biol (2017) 57-58:124–39. doi: 10.1016/j.matbio.2016.07.012
15
Foster MH . Basement membranes and autoimmune diseases. Matrix Biol (2017) 57-58:149–68. doi: 10.1016/j.matbio.2016.07.008
16
Jayadev R Morais M Ellingford JM Srinivasan S Naylor RW Lawless C et al . A basement membrane discovery pipeline uncovers network complexity, regulators, and human disease associations. Sci Adv (2022) 8(20):eabn2265. doi: 10.1126/sciadv.abn2265
17
Parker HS Leek JT Favorov AV Considine M Xia X Chavan S et al . Preserving biological heterogeneity with a permuted surrogate variable analysis for genomics batch correction. Bioinformatics (2014) 30(19):2757–63. doi: 10.1093/bioinformatics/btu375
18
Ritchie ME Phipson B Wu D Hu Y Law CW Shi W et al . Limma powers differential expression analyses for RNA-sequencing and microarray studies. Nucleic Acids Res (2015) 43(7):e47. doi: 10.1093/nar/gkv007
19
Gu Z Eils R Schlesner M . Complex heatmaps reveal patterns and correlations in multidimensional genomic data. Bioinformatics (2016) 32(18):2847–9. doi: 10.1093/bioinformatics/btw313
20
Yu G Wang LG Han Y He QY . clusterProfiler: an r package for comparing biological themes among gene clusters. Omics (2012) 16(5):284–7. doi: 10.1089/omi.2011.0118
21
Walter W Sánchez-Cabo F Ricote M . GOplot: an r package for visually combining expression data with functional analysis. Bioinformatics (2015) 31(17):2912–4. doi: 10.1093/bioinformatics/btv300
22
Lambert SA Jolma A Campitelli LF Das PK Yin Y Albu M et al . The human transcription factors. Cell (2018) 172(4):650–65. doi: 10.1016/j.cell.2018.01.029
23
Xia J Gill EE Hancock RE . NetworkAnalyst for statistical, visual and network-based meta-analysis of gene expression data. Nat Protoc (2015) 10(6):823–44. doi: 10.1038/nprot.2015.052
24
Hsu SD Lin FM Wu WY Liang C Huang WC Chan WL et al . miRTarBase: a database curates experimentally validated microRNA-target interactions. Nucleic Acids Res (2011) 39(Database issue):D163–9. doi: 10.1093/nar/gkq1107
25
Sethupathy P Corda B Hatzigeorgiou AG . TarBase: A comprehensive database of experimentally supported animal microRNA targets. Rna (2006) 12(2):192–7. doi: 10.1261/rna.2239606
26
Bindea G Mlecnik B Tosolini M Kirilovsky A Waldner M Obenauf AC et al . Spatiotemporal dynamics of intratumoral immune cells reveal the immune landscape in human cancer. Immunity (2013) 39(4):782–95. doi: 10.1016/j.immuni.2013.10.003
27
Micko AS Wöhrer A Wolfsberger S Knosp E . Invasion of the cavernous sinus space in pituitary adenomas: endoscopic verification and its correlation with an MRI-based classification. J Neurosurg (2015) 122(4):803–11. doi: 10.3171/2014.12.Jns141083
28
Yoo M Shin J Kim J Ryall KA Lee K Lee S et al . DSigDB: drug signatures database for gene set analysis. Bioinformatics (2015) 31(18):3069–71. doi: 10.1093/bioinformatics/btv313
29
Balachandran VP Gonen M Smith JJ DeMatteo RP . Nomograms in oncology: more than meets the eye. Lancet Oncol (2015) 16(4):e173–80. doi: 10.1016/s1470-2045(14)71116-7
30
Mahmud SMH Chen W Meng H Jahan H Liu Y Hasan SMM . Prediction of drug-target interaction based on protein features using undersampling and feature selection techniques with boosting. Anal Biochem (2020) 589:113507. doi: 10.1016/j.ab.2019.113507
31
Zhan X Desiderio DM . Editorial: Molecular network study of pituitary adenomas. Front Endocrinol (Lausanne) (2020) 11:26. doi: 10.3389/fendo.2020.00026
32
Yang Q Li X . Molecular network basis of invasive pituitary adenoma: A review. Front Endocrinol (Lausanne) (2019) 10:7. doi: 10.3389/fendo.2019.00007
33
Chen Y Chuan HL Yu SY Li CZ Wu ZB Li GL et al . A novel invasive-related biomarker in three subtypes of nonfunctioning pituitary adenomas. World Neurosurg (2017) 100:514–21. doi: 10.1016/j.wneu.2017.01.010
34
Reuten R Zendehroud S Nicolau M Fleischhauer L Laitala A Kiderlen S et al . Basement membrane stiffness determines metastases formation. Nat Mater (2021) 20(6):892–903. doi: 10.1038/s41563-020-00894-0
35
Lambert AW Pattabiraman DR Weinberg RA . Emerging biological principles of metastasis. Cell (2017) 168(4):670–91. doi: 10.1016/j.cell.2016.11.037
36
Fiore VF Krajnc M Quiroz FG Levorse J Pasolli HA Shvartsman SY et al . Mechanics of a multilayer epithelium instruct tumour architecture and function. Nature (2020) 585(7825):433–9. doi: 10.1038/s41586-020-2695-9
37
Quail DF Joyce JA . Microenvironmental regulation of tumor progression and metastasis. Nat Med (2013) 19(11):1423–37. doi: 10.1038/nm.3394
38
Joyce JA Pollard JW . Microenvironmental regulation of metastasis. Nat Rev Cancer (2009) 9(4):239–52. doi: 10.1038/nrc2618
39
Stojilkovic SS Tabak J Bertram R . Ion channels and signaling in the pituitary gland. Endocr Rev (2010) 31(6):845–915. doi: 10.1210/er.2010-0005
40
Cao H Eppinga RD Razidlo GL Krueger EW Chen J Qiang L et al . Stromal fibroblasts facilitate cancer cell invasion by a novel invadopodia-independent matrix degradation process. Oncogene (2016) 35(9):1099–110. doi: 10.1038/onc.2015.163
41
Wang DS Zhang HQ Zhang B Yuan ZB Yu ZK Yang T et al . miR-133 inhibits pituitary tumor cell migration and invasion via down-regulating FOXC1 expression. Genet Mol Res (2016) 15(1):7453. doi: 10.4238/gmr.15017453
42
Wang J Li W Zhao Y Kang D Fu W Zheng X et al . Members of FOX family could be drug targets of cancers. Pharmacol Ther (2018) 181:183–96. doi: 10.1016/j.pharmthera.2017.08.003
43
Sharma S Sharma PM Mistry DS Chang RJ Olefsky JM Mellon PL et al . PPARG regulates gonadotropin-releasing hormone signaling in LbetaT2 cells in vitro and pituitary gonadotroph function in vivo in mice. Biol Reprod (2011) 84(3):466–75. doi: 10.1095/biolreprod.110.088005
44
Jin Y Oomah K Cattini PA . Enhancer-blocking activity is associated with hypersensitive site V sequences in the human growth hormone locus control region. DNA Cell Biol (2011) 30(12):995–1005. doi: 10.1089/dna.2011.1268
45
Even-Zohar N Greenman Y . Current medical treatment and perspective in gonadotroph tumors. Best Pract Res Clin Endocrinol Metab (2022) 36(6):101685. doi: 10.1016/j.beem.2022.101685
46
Gergics P Christian HC Choo MS Ajmal A Camper SA . Gene expression in mouse thyrotrope adenoma: Transcription elongation factor stimulates proliferation. Endocrinology (2016) 157(9):3631–46. doi: 10.1210/en.2016-1183
47
Wu W Cao L Jia Y Xiao Y Zhang X Gui S . Emerging roles of miRNA, lncRNA, circRNA, and their cross-talk in pituitary adenoma. Cells (2022) 11(18):2920. doi: 10.3390/cells11182920
48
Amaral FC Torres N Saggioro F Neder L Machado HR Silva WA Jr. et al . MicroRNAs differentially expressed in ACTH-secreting pituitary tumors. J Clin Endocrinol Metab (2009) 94(1):320–3. doi: 10.1210/jc.2008-1451
49
Su WJ Wang JS Ye MD Chen WL Liao CX . Expression and clinical significance of miR-193a-3p in invasive pituitary adenomas. Eur Rev Med Pharmacol Sci (2020) 24(14):7673–80. doi: 10.26355/eurrev_202007_22268
50
Butz H Likó I Czirják S Igaz P Khan MM Zivkovic V et al . Down-regulation of Wee1 kinase by a specific subset of microRNA in human sporadic pituitary adenomas. J Clin Endocrinol Metab (2010) 95(10):E181–91. doi: 10.1210/jc.2010-0581
51
Xing Y Ruan G Ni H Qin H Chen S Gu X et al . Tumor immune microenvironment and its related miRNAs in tumor progression. Front Immunol (2021) 12:624725. doi: 10.3389/fimmu.2021.624725
52
Glennon E Kaunzner UW Gagnidze K McEwen BS Bulloch K . Pituitary dendritic cells communicate immune pathogenic signals. Brain Behav Immun (2015) 50:232–40. doi: 10.1016/j.bbi.2015.07.007
53
Zhou W Zhang C Zhang D Peng J Ma S Wang X et al . Comprehensive analysis of the immunological landscape of pituitary adenomas: implications of immunotherapy for pituitary adenomas. J Neurooncol (2020) 149(3):473–87. doi: 10.1007/s11060-020-03636-z
54
Mocellin S Marincola FM Young HA . Interleukin-10 and the immune response against cancer: a counterpoint. J Leukoc Biol (2005) 78(5):1043–51. doi: 10.1189/jlb.0705358
55
Marques P Barry S Carlsen E Collier D Ronaldson A Awad S et al . Chemokines modulate the tumour microenvironment in pituitary neuroendocrine tumours. Acta Neuropathol Commun (2019) 7(1):172. doi: 10.1186/s40478-019-0830-3
56
Sui D Ma L Li M Shao W Du H Li K et al . Mucin 1 and poly I:C activates dendritic cells and effectively eradicates pituitary tumors as a prophylactic vaccine. Mol Med Rep (2016) 13(4):3675–83. doi: 10.3892/mmr.2016.4964
57
Cui C Wang J Fagerberg E Chen PM Connolly KA Damo M et al . Neoantigen-driven b cell and CD4 T follicular helper cell collaboration promotes anti-tumor CD8 T cell responses. Cell (2021) 184(25):6101–6118.e13. doi: 10.1016/j.cell.2021.11.007
58
Qian BZ Pollard JW . Macrophage diversity enhances tumor progression and metastasis. Cell (2010) 141(1):39–51. doi: 10.1016/j.cell.2010.03.014
59
Zhang A Xu Y Xu H Ren J Meng T Ni Y et al . Lactate-induced M2 polarization of tumor-associated macrophages promotes the invasion of pituitary adenoma by secreting CCL17. Theranostics (2021) 11(8):3839–52. doi: 10.7150/thno.53749
60
Wang S Sun J Chen K Ma P Lei Q Xing S et al . Perspectives of tumor-infiltrating lymphocyte treatment in solid tumors. BMC Med (2021) 19(1):140. doi: 10.1186/s12916-021-02006-4
61
Zhang S Yang H Xiang X Liu L Huang H Tang G . THBS2 is closely related to the poor prognosis and immune cell infiltration of gastric cancer. Front Genet (2022) 13:803460. doi: 10.3389/fgene.2022.803460
62
Kozumi K Kodama T Murai H Sakane S Govaere O Cockell S et al . Transcriptomics identify thrombospondin-2 as a biomarker for NASH and advanced liver fibrosis. Hepatology (2021) 74(5):2452–66. doi: 10.1002/hep.31995
63
Liao X Wang W Yu B Tan S . Thrombospondin-2 acts as a bridge between tumor extracellular matrix and immune infiltration in pancreatic and stomach adenocarcinomas: an integrative pan-cancer analysis. Cancer Cell Int (2022) 22(1):213. doi: 10.1186/s12935-022-02622-x
64
Yang H Sun B Fan L Ma W Xu K Hall SRR et al . Multi-scale integrative analyses identify THBS2(+) cancer-associated fibroblasts as a key orchestrator promoting aggressiveness in early-stage lung adenocarcinoma. Theranostics (2022) 12(7):3104–30. doi: 10.7150/thno.69590
65
Nikitovic D Katonis P Tsatsakis A Karamanos NK Tzanakakis GN . Lumican, a small leucine-rich proteoglycan. IUBMB Life (2008) 60(12):818–23. doi: 10.1002/iub.131
66
Brézillon S Venteo L Ramont L D'Onofrio MF Perreau C Pluot M et al . Expression of lumican, a small leucine-rich proteoglycan with antitumour activity, in human malignant melanoma. Clin Exp Dermatol (2007) 32(4):405–16. doi: 10.1111/j.1365-2230.2007.02437.x
67
Horiguchi K Kouki T Fujiwara K Tsukada T Ly F Kikuchi M et al . Expression of the proteoglycan syndecan-4 and the mechanism by which it mediates stress fiber formation in folliculostellate cells in the rat anterior pituitary gland. J Endocrinol (2012) 214(2):199–206. doi: 10.1530/joe-12-0156
68
Vannahme C Smyth N Miosge N Gösling S Frie C Paulsson M et al . Characterization of SMOC-1, a novel modular calcium-binding protein in basement membranes. J Biol Chem (2002) 277(41):37977–86. doi: 10.1074/jbc.M203830200
69
Brellier F Ruggiero S Zwolanek D Martina E Hess D Brown-Luedi M et al . SMOC1 is a tenascin-c interacting protein over-expressed in brain tumors. Matrix Biol (2011) 30(3):225–33. doi: 10.1016/j.matbio.2011.02.001
70
Crotty S . T Follicular helper cell biology: A decade of discovery and diseases. Immunity (2019) 50(5):1132–48. doi: 10.1016/j.immuni.2019.04.011
71
Tokunaga R Naseem M Lo JH Battaglin F Soni S Puccini A et al . B cell and b cell-related pathways for novel cancer treatments. Cancer Treat Rev (2019) 73:10–9. doi: 10.1016/j.ctrv.2018.12.001
72
Wang RQ Lan YL Lou JC Lyu YZ Hao YC Su QF et al . Expression and methylation status of LAMA2 are associated with the invasiveness of nonfunctioning PitNET. Ther Adv Endocrinol Metab (2019) 10:2042018818821296. doi: 10.1177/2042018818821296
73
Joshi H Vastrad B Vastrad C . Identification of important invasion-related genes in non-functional pituitary adenomas. J Mol Neurosci (2019) 68(4):565–89. doi: 10.1007/s12031-019-01318-8
74
Liu D Li J Li N Lu M Wen S Zhan X . Integration of quantitative phosphoproteomics and transcriptomics revealed phosphorylation-mediated molecular events as useful tools for a potential patient stratification and personalized treatment of human nonfunctional pituitary adenomas. Epma J (2020) 11(3):419–67. doi: 10.1007/s13167-020-00215-0
75
Lesseur C Diergaarde B Olshan AF Wünsch-Filho V Ness AR Liu G et al . Genome-wide association analyses identify new susceptibility loci for oral cavity and pharyngeal cancer. Nat Genet (2016) 48(12):1544–50. doi: 10.1038/ng.3685
76
Zhou PL Wu Z Zhang W Xu M Ren J Zhang Q et al . Circular RNA hsa_circ_0000277 sequesters miR-4766-5p to upregulate LAMA1 and promote esophageal carcinoma progression. Cell Death Dis (2021) 12(7):676. doi: 10.1038/s41419-021-03911-5
77
Huang SL Wang YM Wang QY Feng GG Wu FQ Yang LM et al . Mechanisms and clinical trials of hepatocellular carcinoma immunotherapy. Front Genet (2021) 12:691391. doi: 10.3389/fgene.2021.691391
Summary
Keywords
invasive pituitary adenomas, basement membrane genes, bioinformatics, PPI, GEO, tumor microenvironment, immune infiltration
Citation
Chen Z, Sun X, Kang Y, Zhang J, Jia F, Liu X and Zhu H (2023) A novel risk model based on the correlation between the expression of basement membrane genes and immune infiltration to predict the invasiveness of pituitary adenomas. Front. Endocrinol. 13:1079777. doi: 10.3389/fendo.2022.1079777
Received
25 October 2022
Accepted
14 December 2022
Published
04 January 2023
Volume
13 - 2022
Edited by
Wang Haijun, The First Affiliated Hospital of Sun Yat-sen University, China
Reviewed by
Sergei I Bannykh, Cedars Sinai Medical Center, United States; Jinxiu Yu, The Second Affiliated Hospital of Guangzhou Medical University, China; Peng Zhao, Department of Neurosurgery, Capital Medical University, China
Updates
Copyright
© 2023 Chen, Sun, Kang, Zhang, Jia, Liu and Zhu.
This is an open-access article distributed under the terms of the Creative Commons Attribution License (CC BY). The use, distribution or reproduction in other forums is permitted, provided the original author(s) and the copyright owner(s) are credited and that the original publication in this journal is cited, in accordance with accepted academic practice. No use, distribution or reproduction is permitted which does not comply with these terms.
*Correspondence: Hongwei Zhu, futurecx330@126.com
This article was submitted to Pituitary Endocrinology, a section of the journal Frontiers in Endocrinology
Disclaimer
All claims expressed in this article are solely those of the authors and do not necessarily represent those of their affiliated organizations, or those of the publisher, the editors and the reviewers. Any product that may be evaluated in this article or claim that may be made by its manufacturer is not guaranteed or endorsed by the publisher.