 Kai Jiang1†
 Rongpeng Gong
- 1Department of Cardiovascular Medicine, The Bozhou Hospital Affiliated to Anhui Medical University, Bozhou, China
- 2Department of Cardiovascular Medicine, People’s Hospital of Ningxia Hui Autonomous Region, YinChuan, China
- 3Medical College of Qinghai University, Xining, China
- 4College of Traditional Chinese Medicine, Shandong University of Traditional Chinese Medicine, Jinan, China
Background: Visceral obesity index (VAI) is an empirical mathematical model used to evaluate the distribution and function of fat. Some studies have shown that VAI may be associated with the development of insulin resistance. In view of the differences in insulin resistance among different ethnic groups, this study attempts to analyze the special relationship between VAI and insulin resistance in American adults.
Methods: We conducted a cross-sectional study through NHANES database. A total of 27309 patients over the age of 18 from the United States took part in the survey. It was divided into two groups: the IR-positive group and the IR-negative group. The association of VAI with IR was evaluated by logistic regression analyses mainly, including univariate analysis, multivariate regression analysis, curve fitting analysis and subgroup analysis.
Results: The results showed that in the full-adjusted model, there is a strong positive association between VAI level and insulin resistance (OR: 1.28 (1.2~1.37), P<0.001) and there is a threshold effect.
Conclusions: This study suggests that higher VAI levels are associated with insulin resistance. VAI index may be used as a predictor of insulin resistance.
Background
Insulin resistance (IR) is a pathological condition caused by genetic and environmental factors, in which insulin promotes the decrease of glucose uptake and utilization rate, as well as the body’s decreased responsiveness and sensitivity to the physiological action of insulin (1, 2). It is the pathological basis of type 2 diabetes (2–6). Recently, the prevalence of diabetes has risen rapidly in all developing and developed countries (7), and type2 diabetes is the most common type of diabetes, accounting for approximately 90% of all people with diabetes (8, 9). It is estimated that by 2030, the number of people with type 2 diabetes will reach 439 million (10). Current studies have demonstrated that understanding IR is important for developing prevention measures and determining optimal treatment. Unfortunately, the methods available to determine IR (such as pancreatic suppression tests, high insulin-normal blood sugar tuse and glucose digestion and the minimum model of metabolism) are complex and expensive, so they apply only to small-scale studies (11–13). In view of these characteristics, it is necessary to find alternative parameters that are low-cost and convenient. Visceral obesity index (VAI) is a gender-specific mathematical index that has been proposed to assess fat distribution and function. VAI is estimated with the use of simple anthropometric [body mass index (BMI) and waist circumference (WC) and biochemical triglycerides (TG) and high-density lipoprotein cholesterol (HDL-C)] parameters (14). VAI is generally considered a as a marker of adipose tissue dysfunction. As a simple technique, the index has been widely accepted for epidemiological or clinical research. Some recent studies have indicated that visceral obesity index was also correlated with IR (15–19). Homeostasis model assessment of high insulin-normal glucose (HIEG) forcers and IR (HOMA-IR), which is the gold standard and common method for IR assessment. Given the small sample size of previous studies, the ethnic specificity of IR, and the unexplored relationship between VAI and IR in these studies, it is necessary to conduct new, large-sample studies to understand VAI and IR.
Visceral obesity index (VAI) is an empirical mathematical model that has been proposed to assess fat distribution and function. It is a sex-specific index based on simple anthropometry (BMI and WC) and metabolic parameters (TG and HDL-C). Interesting results have been produced by the application of VAI in populations of patients with endocrine diseases with varying degrees of cardiometabolic risk, such as acromegaly, polycystic ovary syndrome, type 2 diabetes, and prolactinoma (20–24). This has led to the hypothesis that VAI can be regarded as a marker of adipose tissue dysfunction. Some recent studies have indicated that the VAI can be successfully used to detect the distribution and function of visceral fat, IR and increased cardiometabolic risk (25, 26). In a study conducted by Jablonowska-Lietz et al. (18) VAI index was also significantly correlated with glucose, insulin, HOMA-IR, and visceral adipose tissue predicted by bioimpedance analysis. Stepien et al. also suggested a positive correlation between IR and VAI in obese patients (15). In another study, Borruel et al. (19) reported that VAI levels were more strongly correlated with serum insulin levels and HOMA-IR than WC and BMI levels. Because of its simple technique, the index has been widely accepted for epidemiological or clinical research. Given the small sample size of previous studies, the ethnic specificity of IR, and the unexplored relationship between VAI and IR in these studies, it is necessary to conduct new, large-sample studies to understand VAI and IR.
Therefore, we explored the relationship between VAI index and IR in a larger and more representative sample of various ethnic groups in the United States.
Methods
Data Sources
It was a large cross-sectional study using data from the National Institutes of Health National Health and Nutrition Examination Survey (NHANES) database for 11 cycles (1999-2020). The NHANES program is a multiagency collaboration aimed at improving the health of Americans, with a focus on diet, detailed elsewhere (27). NHANES used a multi-stage stratified probability design in a sample population to obtain a nationally representative sample of non-institutionalized civilians in the United States. Data from these samples consisted of demographic informatics data, dietary data, body measurement data, laboratory data and questionnaire data. In this study, data from 11 cycles were standardized and combined with fasting weights as recommended by the National Center for Health Statistics (NCHS).
Study Design and Participants
This study was designed to be cross-sectional. The target independent variable was the participant’s VAI at the time of testing, and the target dependent variable was whether the participant was diagnosed with IR at the time of testing. Simultaneously, the occurrence of IR was divided into two groups, including 11936 patients in the positive group of IR and 15373 patients in the negative group of IR.
A total of 116,876 participants were included in NHANES 1999-2020, and 27,309 were included in the final analysis. Other participants were excluded for the following reasons: 1. Participants younger than 18 years old (n= 47979); 2. Participants who did not undergo insulin test (n= 39465); 3. Participants who were taking insulin drugs or insulin related drugs affecting metabolism (n=855); 4. Participants lack VAI data detection (n= 1268) (Figure 1).
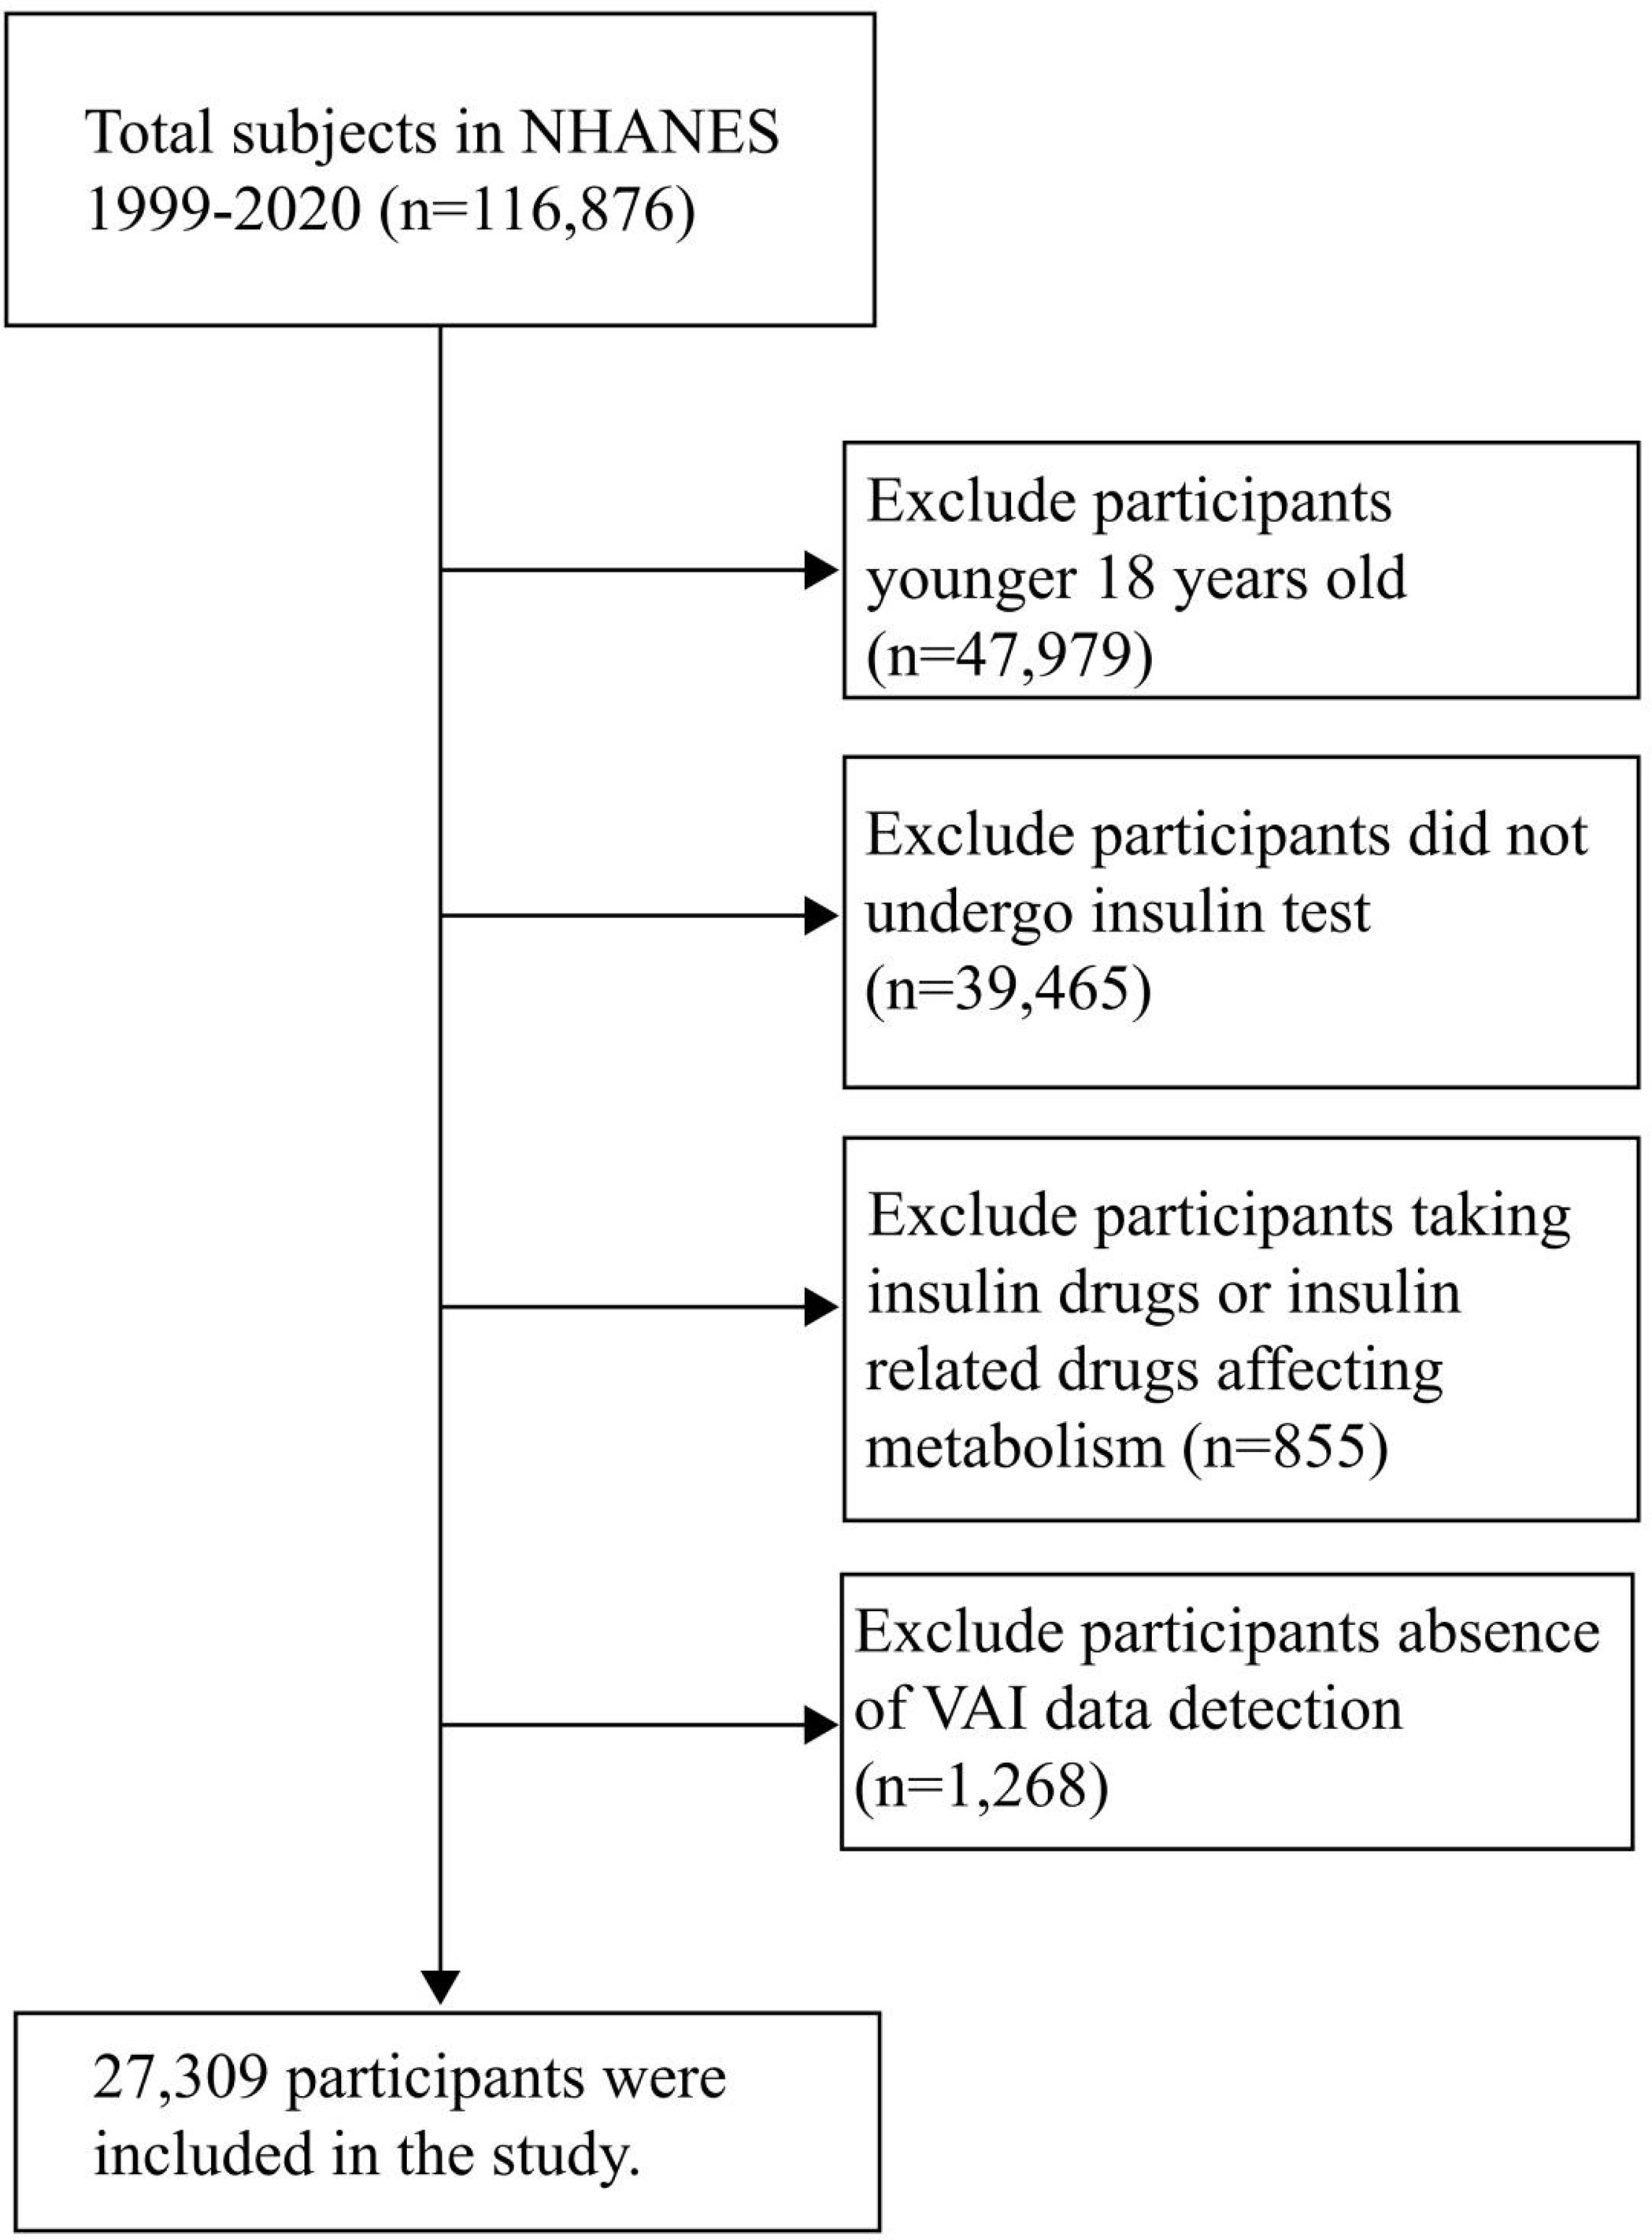
Figure 1 Flowchart of patient selection.
Data Collection
All data were collected and recorded by uniformly trained investigators. The data used in this study included demographics (age, sex, race, education level, etc.), anthropometry (WC, BMI, etc.), health-related behaviors (smoking, drinking, etc.), and biochemical indicators (TG, VAI, etc.). Basic information was immediately collated by investigators, and biochemical samples were stored and managed scientifically before being sent to the University of Minnesota laboratory and the University of Missouri-Columbia for testing and analysis.
Measurement of VAI
VAI is a simple clinical index that integrates anthropometric data and metabolic parameters, and can better assess visceral fat. It was calculated as follows: Man = [WC(cm)/39.68 + (1.88 ×BMI)]×(TG(mmol/L)/1.03)×(1.31/HDL(mmol/L)); Women = [WC (cm)/36.58 + 1.89 × (BMI)] × (TG (mmol/L)/0.81) × (1.52/HDL (mmol/L)). BMI is calculated based on height and weight. Height was measured using electronic Sports Measurements (Seca Ltd, Medical Scales and Measurement Systems, Birmingham, UK) with an accuracy of millimetres. Weight was measured by researchers using a digital Scale (Toledo Scale; Mettler-toledo, LLC, Columbus,OH, USA) and convert pounds to kilograms when the measurement is complete. The formula is BMI =weight (kg)/height (m2). WC was measured using electronic Sports Measurements (Seca Ltd, Medical Scales and Measurement Systems, Birmingham, UK) with an accuracy of millimetres. HDL was measured by the Magnesium sulfate/glucan method and TG was measured based on the Wahlefeld method. Both HDL and TG were measured in the University of Minnesota laboratory. Please refer to the official NHANES website for more detailed information.
Measurement of Insulin Resistance
HOMA-IR is recognized by many experts as a good indicator of IR. The formula was fasting blood glucose (FPG, mmol/L) × fasting insulin (FINS, μU/mL)/22.5 (Figure 2). We followed previous studies that defined homA-IR index ≥ 2.73 as positive insulin resistance, and < 2.73 as negative insulin resistance. Fasting blood glucose was measured by hexokinase (HK) method, and fasting insulin was measured by insulin radioimmunoassay. Both blood sugar and insulin measurements were tested at the University of Missouri-Columbia. Enter the official NHANES website for more detailed information.
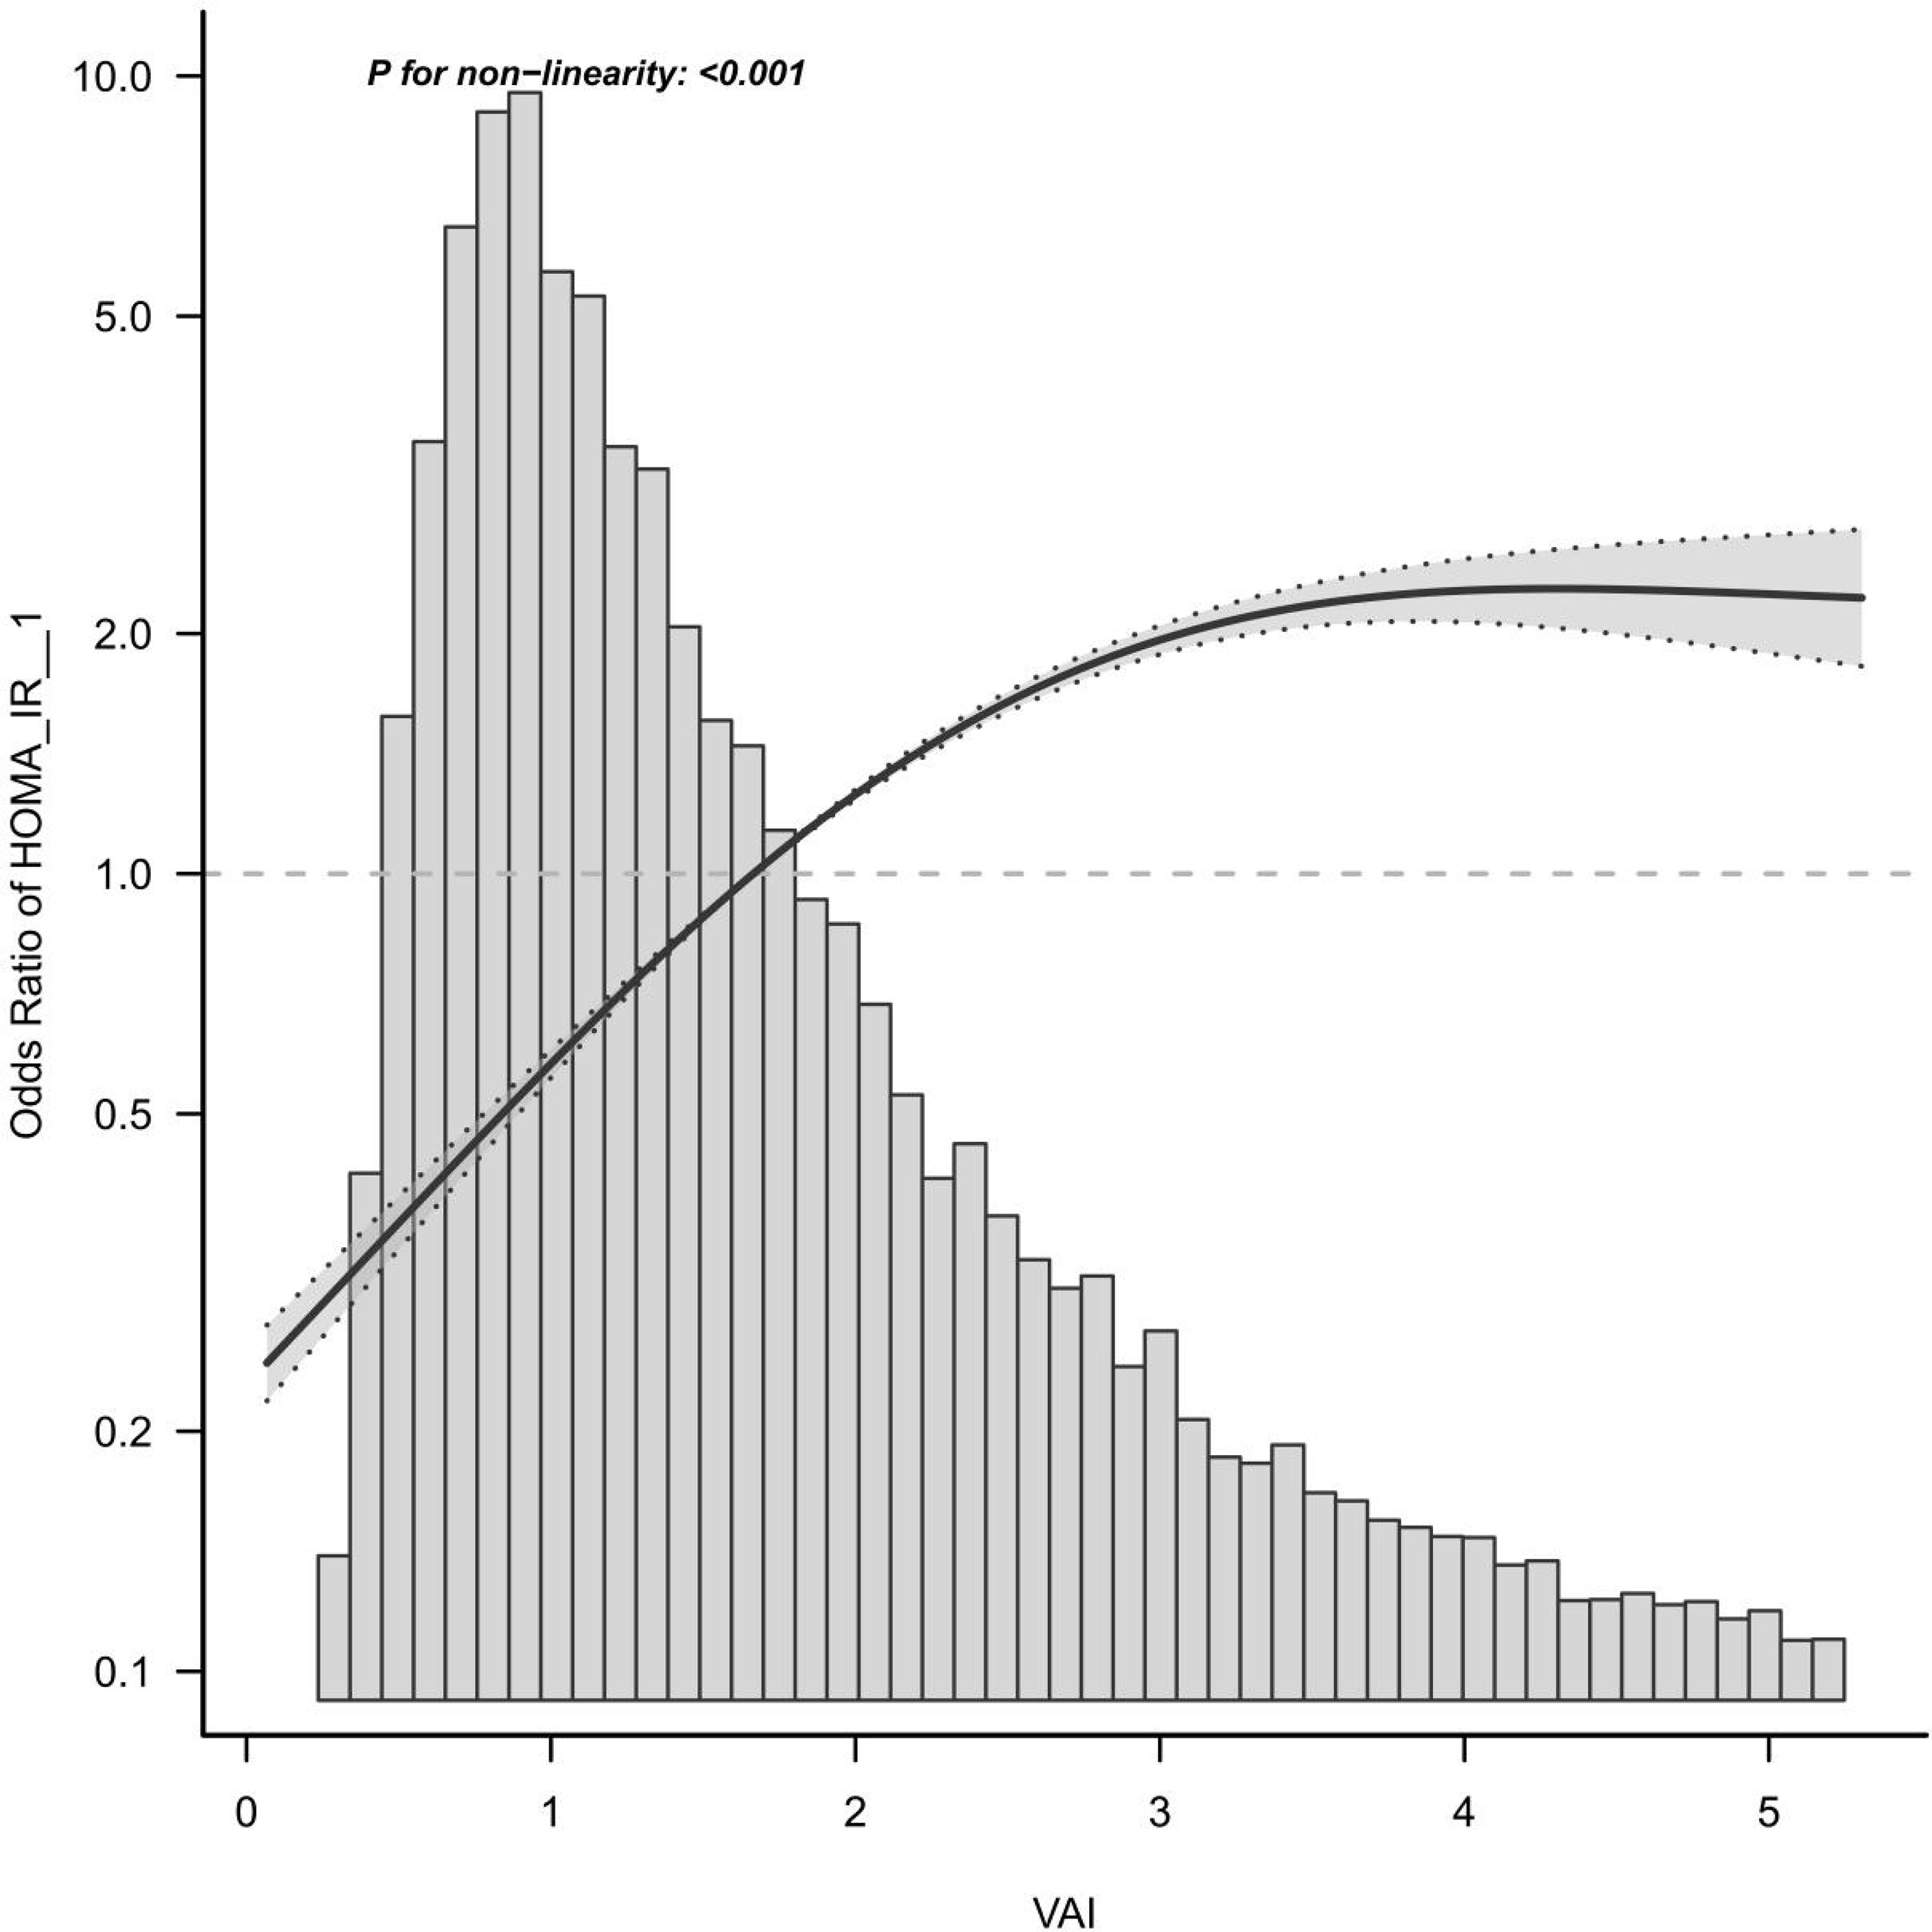
Figure 2 Curve fitting analysis of VIA and IR.
Definitions of Other Variables
Age: Adults 18 and older in the United States.
Sex: man, woman.
Race: Includes Mexican Americans, non-Hispanic whites, non-Hispanic Blacks, other Hispanics, and other races.
Education: not graduated from high school, high school, graduate and above.
Smoking: current smokers, former smokers and never smokers. Participants were considered current smokers if they had smoked 100 or more cigarettes in the past and reported smoking several days or daily at the time of the interview. Participants who had smoked fewer than 100 cigarettes in the past but did not currently smoke were considered former smokers. Participants who had fewer than 100 cigarettes in their past were considered nonsmokers. Alcohol consumption: Includes both drinkers and non-drinkers.
Alcohol consumption (minus 1 point for alcoholics) is defined as more than one drink per day for women and more than two drinks per day for men, according to the US Department of Health and Human Services/US Department of Agriculture Dietary Guidelines for Americans 2015-2020.
Hypertension: Including those with hypertension and normal blood pressure, the diagnostic criteria are SBP higher than 140mmHg and/or DBP higher than 90mmHg.
Diabetes: Including diabetic patients and people with normal blood glucose.Diabetes is diagnosed if one of the following conditions is met: (1) fasting blood glucose ≥ 7.0mmol/L, (2) OGTT ≥ 11.1mmol/L, (3) doctor’s diagnosis, (4) self-report diabetes or taking diabetes drugs.
Laboratory Quality Control
NHANES Quality Control and Quality Assurance Protocols (QA/QC) meet the requirements of the Clinical Laboratory Improvement Act 1988. Detailed QA/QC instructions are discussed in the NHANES LPM.
Statistical Methods
All data were analyzed using version R 4.1.2, with continuous variables represented by a detailed sample description, an average confidence interval of 95%, and categorical variables represented by counting and weighted percentages. The normal distribution is described by median and standard deviation, and the skewness distribution is based on median and quartiles. Continuous variables were compared between groups using mann-Whitney U test or Student T test based on distribution normality. P < 0.05 (bilateral) was considered statistically significant. The choice of the covariate was based on the previous literature, international standards and related clinical experience of synthetically considering may influence factors of IR and visceral fat index, including sex, age, race, smoking, drinking, education degree, diabetes, hypertension. In order to maximize statistical efficiency and minimize bias, multiple imputation was used to fill in covariates within the range of missing and extreme values. In addition, sensitivity analysis was performed to observe if the new complete data were significantly varied from the original data. However, these studies revealed that there was no significant difference between the data after multiple interpolation and the original data (P > 0.05). Therefore, all the results of our multivariate analysis are based on the data set after multiple interpolation according to Rubin’s criterion. In this study, four multivariable logistics regression models were established to analyze the relationship between VAI and IR in U.S. adults. In order to verify whether the results are inapplicable to the current population, we divided the results into groups according to sex, age, race, smoking, alcohol consumption, BMI, education level, diabetes, hypertension, etc., to observe whether the results are stable in each subgroup. Additionally, trend test was carried out to transform the VAI from continuous variable to categorical variable, and a smooth fitting curve and threshold effect model were constructed to ensure the stability of results.
Results
Description of Basic Information About Participants
A total of 27309 participants were included in this study, including 11936 insulin resistance positive and 15373 insulin resistance negatives. The mean age and standard deviation of insulin resistance positive participants (49.0 ± 18.4) were higher than those of insulin resistance negative participants (45.9 ± 19.1), and the difference was significant (p < 0.001). There were 6,012 men (50.4%) slightly higher than 5,924 women (49.6%). In the racial distribution of the United States, non-Hispanic whites taken up the highest proportion of 4,555 cases (38.2%), while non-Hispanic blacks accounted for the lowest proportion of 1,145 cases (9.6%). BMI (32.2 vs 25.9), WC (106.9cm vs 90.7cm), TG (1.5mmol/L vs 1.0mmol/L), alanine transaminase (ALT) (23.0mmol/L vs 18.0mmol/L), γ-glutamyl transpeptadase (GGT) (24.0mmol/L vs 17.0mmol/L), blood urea nitrogen (BUN) (4.6mmol/L vs 4.3mmol/L), VAI (2.0 vs 1.1) were higher than those in the insulin resistance negative group. Compared to insulin resistance negative group, insulin resistance positive group have higher BMI (32.2 vs 25.9), WC (106.9cm vs 90.7cm), TG (1.5mmol/L vs 1.0mmol/L), alanine transaminase (ALT) (23.0mmol/L vs 18.0mmol/L), γ-glutamyl transpeptidase (GGT) (24.0mmol/L vs 17.0mmol/L), blood urea nitrogen (BUN) (4.6mmol/L vs 4.3mmol/L), VAI (2.0 vs 1.1). The difference was significant (P < 0.001). In contrast, HDL (1.4mmol/L vs 1.2mmol/L) and totalbilirubin (TBIL) (12.0mmol/L vs 10.3mmol/L) in the insulin resistance negative group were higher than those in the insulin resistance positive group, and the difference was significantly (P < 0.001). In addition, there were differences in education level, smoking, alcohol consumption, hypertension and diabetes between the two groups (all P < 0.001) (Table 1).
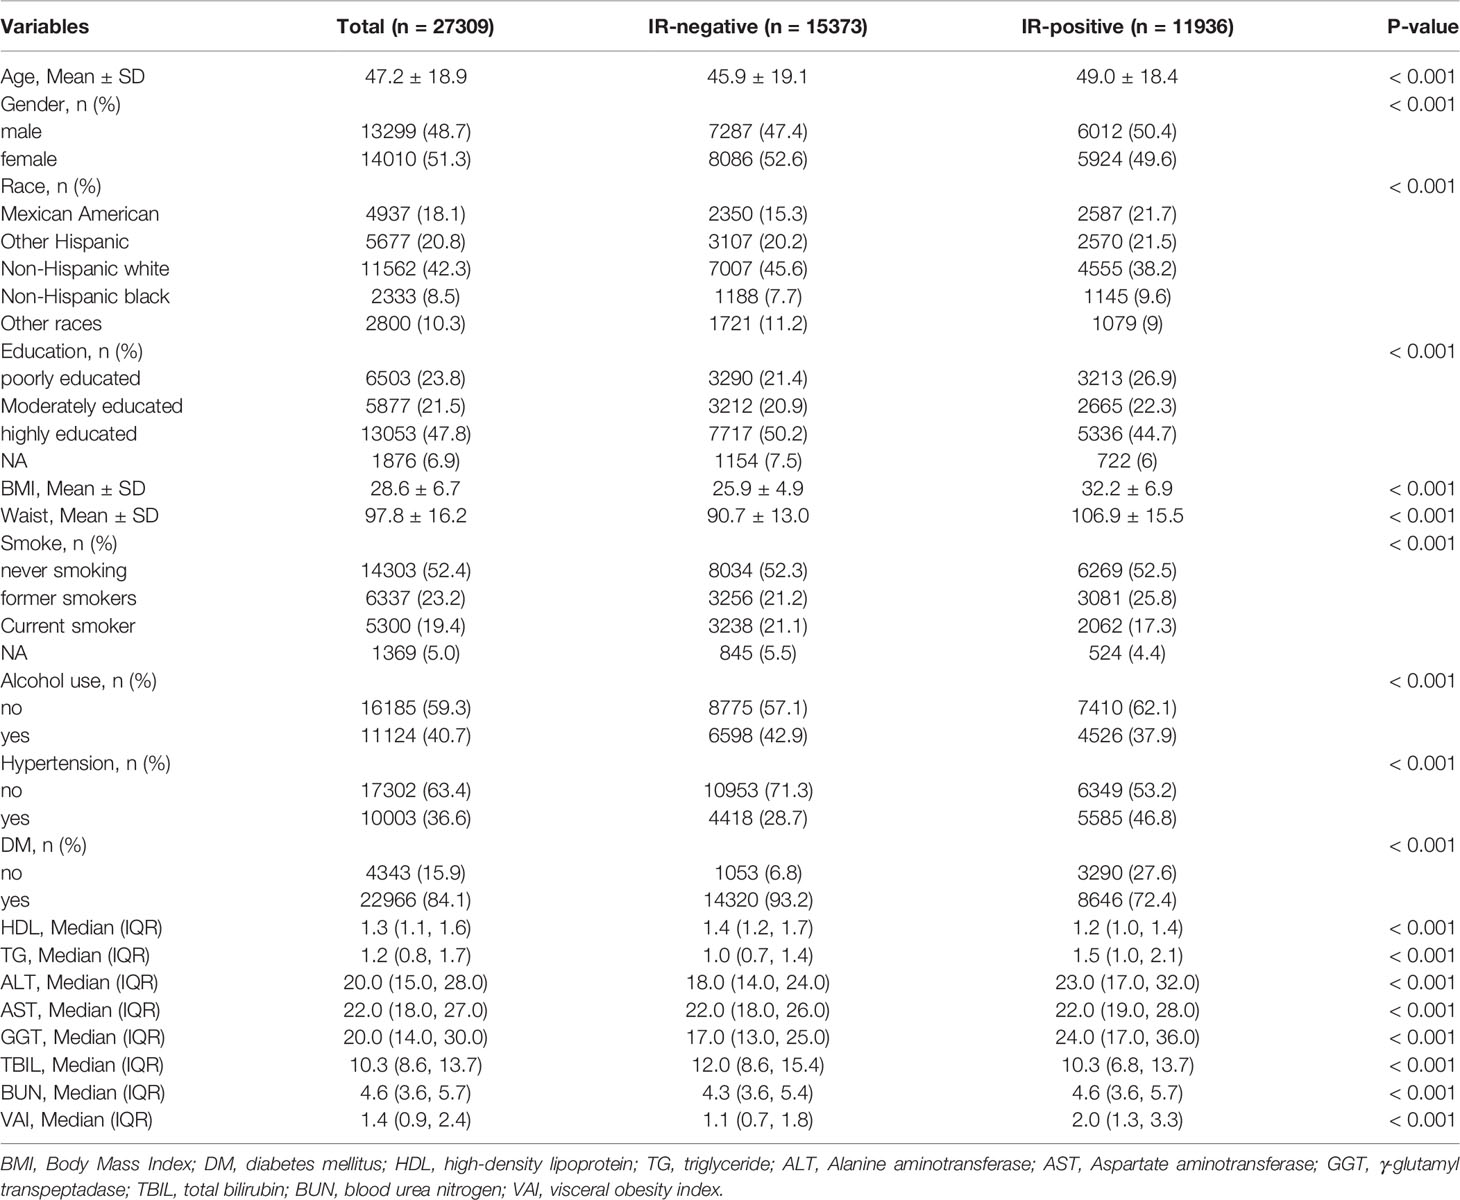
Table 1 Basic crowd information description.
Univariate Analysis
We analyzed correlations between age, sex, race, education, BMI, WC, smoking, alcohol consumption, and several biochemical markers and IR in the U.S. population. We found that age was positively correlated with IR, and the effect value OR and 95% confidence interval were 1.01 (1.01, 1.02), respectively. Compared with men, women had a lower risk of IR, with an effect value and 95%CI of 0.76 (0.65, 0.90), respectively. Among ethnic groups, non-Hispanic whites had a lower incidence of IR, with an effect value of 0.57 (95%CI, 0.42, 0.76). The incidence of IR was lower in those with higher education than in those with lower education and secondary education, and the effect value and 95%CI were 0.68 (0.54, 0.85), respectively. Compared with non-smokers, former smokers had a higher risk of IR, with an effect value and 95%CI of 1.24 (1.02, 1.51), respectively. Current smokers had a low incidence of IR, with an effect value and 95%CI of 0.81 (0.65, 1.00), respectively. Compared with non-drinkers, drinkers had a lower risk of IR, with an effect value and 95%CI of 0.75 (0.63, 0.89), respectively. Meanwhile, we found that BMI, WC and some biochemical indicators were positively correlated with the occurrence of IR, including TG, ALT, GGT and VAI (Table 2).
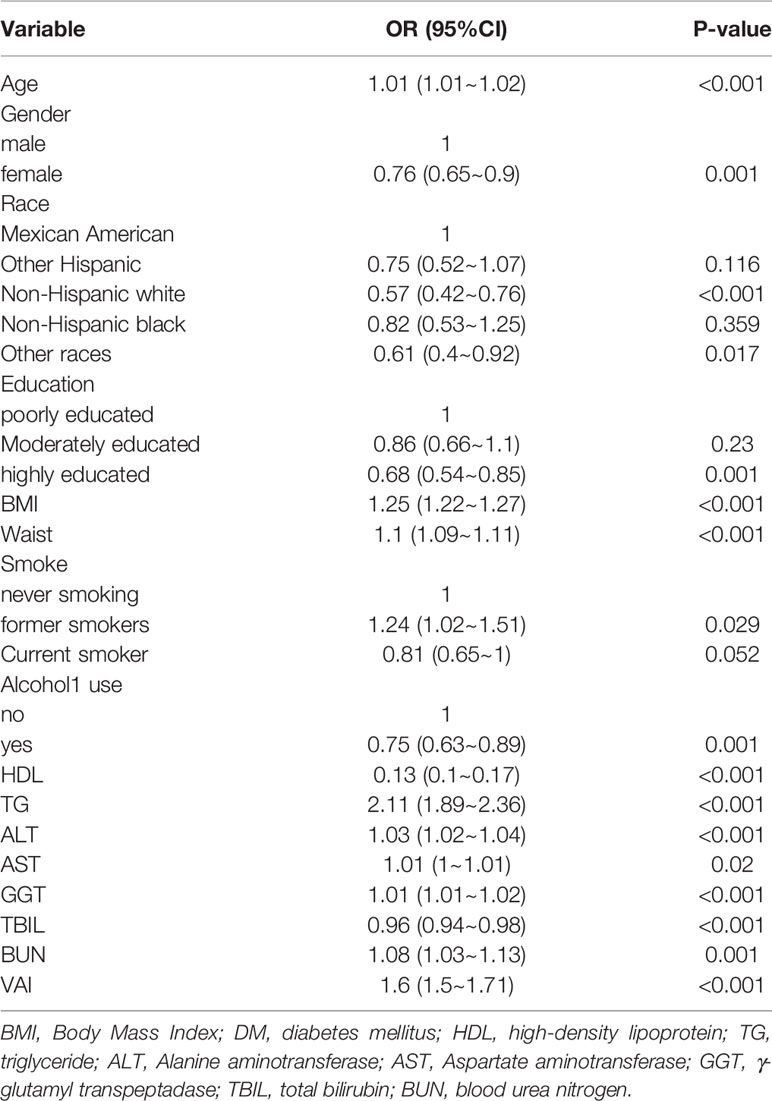
Table 2 Univariate analysis for IR. (weight).
Multi-Factor Analysis
We established four logistic regression models to analyze the relationship between VAI and IR, the effect value of the model can be interpreted as with the increase of VAI, the probability of IR increases correspondingly. For example, in model 1 (Unadjusted model), the incidence of IR increased by 60% with each increase of variance of VAI, and the effect value OR and 95%CI were 1.60 (1.50, 1.71), respectively. Model 2 was adjusted according to population characteristics (age, gender and race), and its effect value OR and 95%CI were 1.62 (1.51, 1.73), respectively. The effect value OR and 95%CI of model 3 were 1.29 (1.20, 1.38), respectively. The effect value OR and 95%CI of model 4 were 1.28 (1.20, 1.37), respectively. The results of model 3 and model 4 were similar, indicating that the adjustment strategy of model 4 was sufficient. Collectively, VAI is independently positively correlated with the occurrence of IR, which can be used as a predictor of IR. Further, in order to ensure the stability of the results, the trend test was carried out in this study. The VAI was transformed from continuous variable to categorical variable and grouped into four levels according to the quartiles of VAI. Q1 was taken as the reference, the incidence of VAI and IR represented a monotonically increasing trend in all models (All P for trend < 0.001). This suggests that VAI is positively correlated with the occurrence of IR and the results are stable (Table 3).
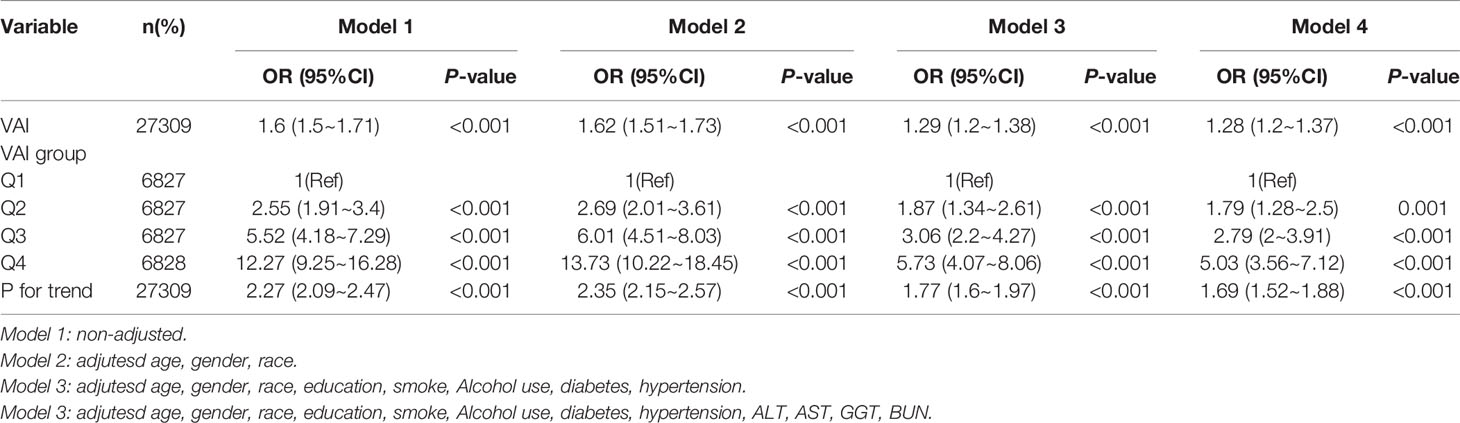
Table 3 The association between VAI and IR in a multiple logistics regression model.
Subgroup Analysis
We did a subgroup analysis by age, education, BMI, and so on to observe if the results were not applicable to the current population. As shown in Figure 3, the relationship between VAI and insulin resistance remained stable across all subgroups, including age, education, BMI, diabetes, race, and sex.
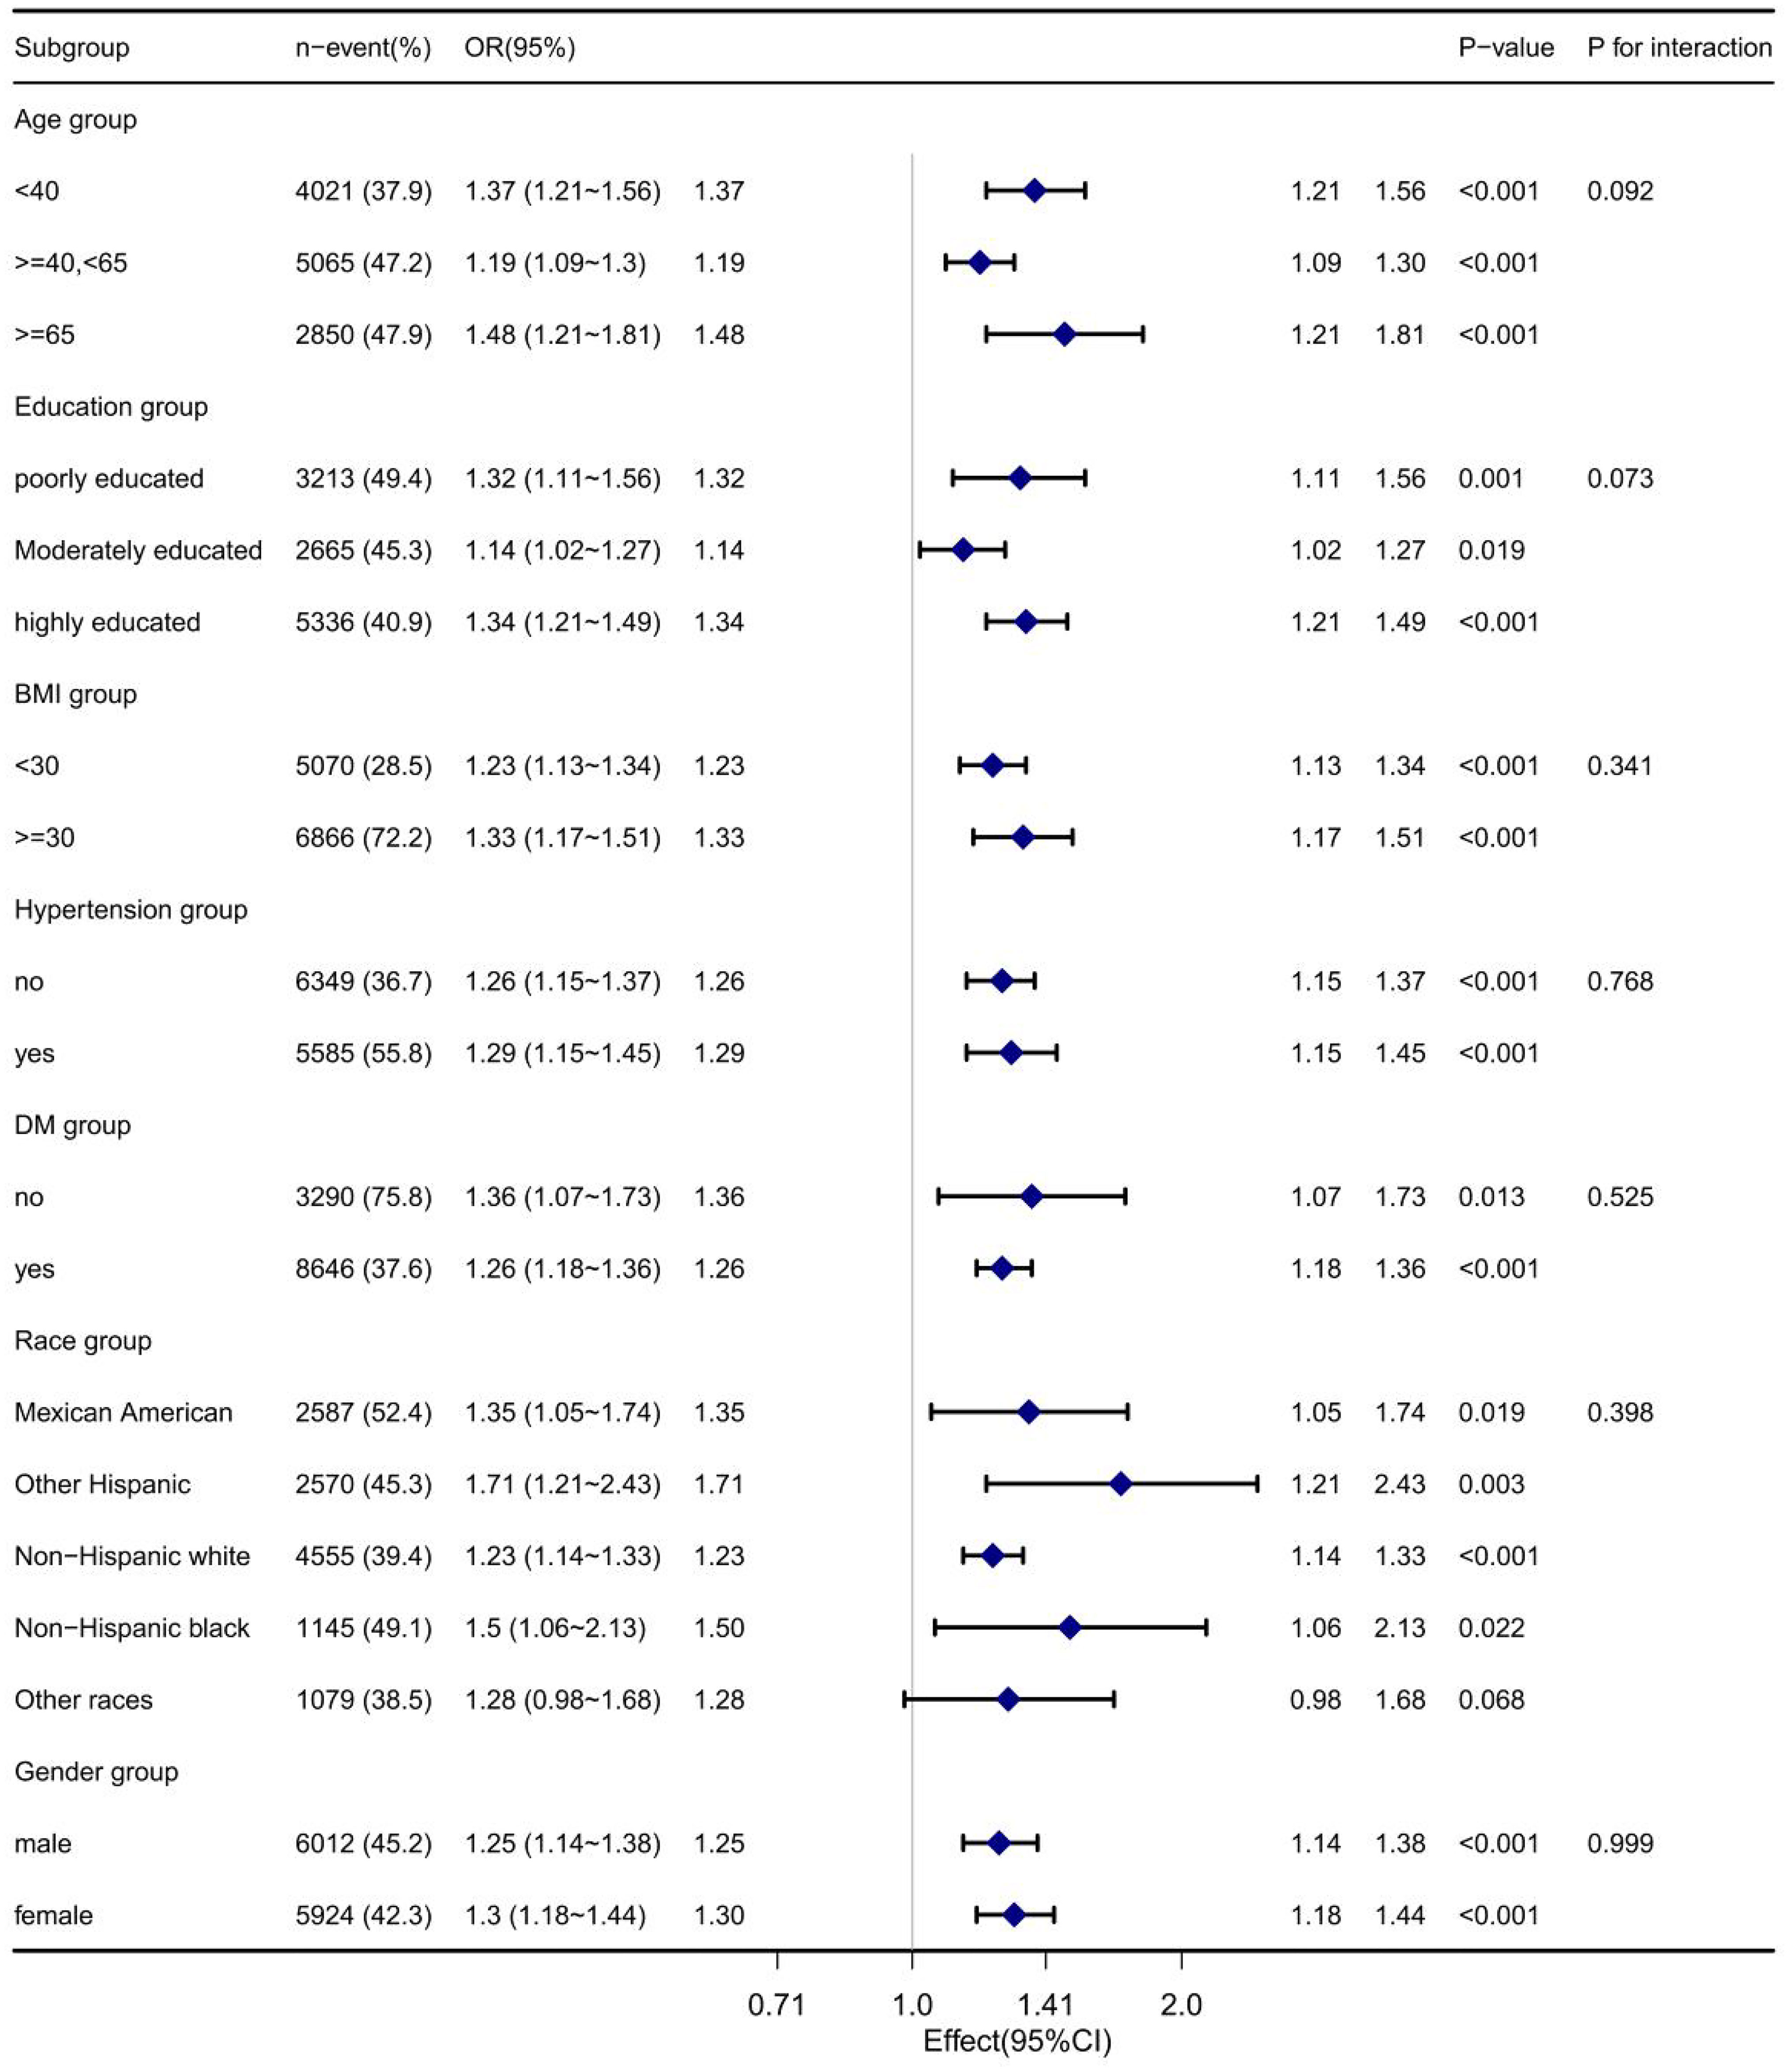
Figure 3 Subgroup analyses of the association between VIA and IR.
Curve Fitting and Threshold Effect Analysis
Here, a smooth curve fitting diagram was drawn to visually describe the relationship between VAI and IR, and the linear relationship was tested. As shown in Figure 3, the correlation between VAI and insulin resistance is sloping, and P for non-linearity < 0.001, which indicates that the correlation between VAI and IR cannot be assessed by a single logistics regression equation. Therefore, the threshold effect is analyzed. As shown in Table 4, there was a threshold effect between VAI and insulin resistance, with an inflection point of 1.92. After adjustment according to model 4, the effect value OR and 95%CI on the left side of inflection point were 2.647 (2.406, 2.913), respectively. The OR and 95%CI on the right side of inflection point were 1.327 (1.245, 1.414), respectively. Moreover, the effect values on the left and right sides of the inflection point are different, and P for Likelihood Ratio test is less than 0.001.
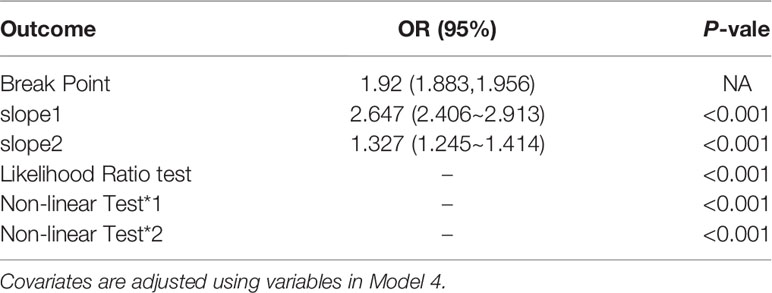
Table 4 Threshold effect analysis.
Discussion
This is a large cross-sectional study using 11 cycles of data from the NHANES database to investigate the association between VAI index and IR in America adults. The results revealed that VAI was independently positively correlated with the incidence of IR among all ethnic groups in the United States. and could be used as one of the predictors of IR.
In current clinical practice, heterogeneity in insulin measurement between laboratories in various countries is ubiquitous, which clearly raise the cost and accuracy of determining IR. Therefore, a simple and convenient IR determination system is extremely vital for clinical purposes. VAI determined by WC, BMI, fasting TG, and HDL-C has been established and is considered a more comprehensive IR indicator. VAI exhibit simple, accessible, cheap and at the forefront of glucose and insulin, unlike gold standard HIEG forceps and other IR replacement markers which are complex, time-consuming and costly and dependent on glucose and insulin. The study confirmed a significant association between VAI and HIEG clamps and insulin resistance (16, 17), indicating the great potential of VAI as a useful indicator of accurate IR levels.
In a previous study on the relationship between VAI and IR, Randria Arisoa et al. (28)reported that VAI was positively correlated with HOMA-IR in non-diabetic Germans (β = 0.42, P < 0.0001). A prospective cohort study conducted by Ji et al. (29) also found that very high VAI was the main risk factor for the rise of HOMA-IR in Chinese adults. Similarly, Stepien et al. (15) also revealed a positive correlation between IR and VAI levels in obese patients. In another study, Borruel et al. (19) suggested that VAI levels were more strongly correlated with serum insulin levels and HOMA-IR than WC and BMI levels. In the Framingham Heart Study, Preis et al. (30) reported that visceral adipose tissue and abdominal subcutaneous adipose tissue were positively correlated with IR, and that visceral adipose tissue was more strongly correlated with IR than abdominal subcutaneous adipose tissue.
The possible mechanism of the relationship between VAI and insulin resistance is as follows:Visceral adipocytes secrete adipose-specific cytokines, such as leptin and adiponectin, as well as inflammatory cytokines (tumor necrosis factor-α and interleukin 6), which increase IR (31, 32). Macrophages accumulate in visceral adipose tissue and release these inflammatory cytokines, including tumor necrosis factor-α and interleukin-6, which impair insulin sensitivity (33). Excess adipose tissue can promote inflammation by increasing the level of resistin or tumor necrosis factor-α, thus increasing IR (34, 35). Reduced adiponectin levels associated with excess adipose tissue can exacerbate metabolic disorders and IR (36).
Several limitations of this study should be mentioned. (1) The time span is long, and there are differences in the methods used to determine IR. However, more samples are allowed to be included according to our current approach, and the detection method is very clear. Considering that all samples are tested by professional testing institutions, this effect can be ignored. (2) Certain deviations are inevitable in cross-sectional studies. We will conduct cohort studies in the future when conditions permit. (3) This study assessed IR using HOMA-IR index. The “gold standard” method (e.g., hyperinsulin-normal glucose clamp and hyperglycemic clamp tests) is more accurate than the HOMA index in measuring IR. Although HOMA indices are not “gold standard” methods, they may be more suitable in large epidemiological studies (37). Because of the limited sample size, we can’t analyze special populations and other ethnic groups. Therefore, whether this result is applicable to special populations and populations in other countries needs further research. We will collect these samples for analysis in future studies to cover the deficiencies of this study.
Despite these limitations, there are some significant advantages. (1) The data used is large and generalized. (2) NHANES is an internationally recognized high-quality database exhibit comprehensive and reliable, which greatly enriches research data. (3) Our study used curve fitting and threshold effect analysis to further analyze the relationship between VAI and IR. (4) A more advanced multiple interpolation method was adopted to deal with missing data, and the sensitivity of interpolation data was analyzed. The results indicated that the interpolated data not much differed from the original data, which makes our results more convincing.
Conclusion
This study explored the relationship between VAI and IR in depth. The association between VAI and IR was a threshold effect after adjustment for potential confounders. At the right of the inflection point, the association between VAI and IR was weakened, which has great significance for the further development of predictive models of IR in the U.S. population. However, the causal relationship between VAI and IR cannot be determined owing to the cross-sectional nature of this study, and a large number of prospective studies are still needed to investigate.
Data Availability Statement
Publicly available datasets were analyzed in this study. This data can be found here: https://www.cdc.gov/nchs/nhanes/.
Author Contributions
RG and KJ conceived the idea. RG, KJ, and MW wrote the manuscript. RG read through and corrected the manuscript. KJ is the first author. RG and JY are the corresponding authors of this paper. All authors contributed to the article and approved the submitted version.
Funding
This study was Supported by the Young Teachers Research Fund of Anhui University of Science and Technology (QN2018128).
Conflict of Interest
The authors declare that the research was conducted in the absence of any commercial or financial relationships that could be construed as a potential conflict of interest.
Publisher’s Note
All claims expressed in this article are solely those of the authors and do not necessarily represent those of their affiliated organizations, or those of the publisher, the editors and the reviewers. Any product that may be evaluated in this article, or claim that may be made by its manufacturer, is not guaranteed or endorsed by the publisher.
Abbreviations
VAI, visceral obesity index; WC, waist circumference; TG, triglyceride; HDL-C, density lipoprotein cholesterol; ALT, alanine transaminase; GGT, γ-glutamyl transpeptadase.
References
1. Xu Z, Gong R, Luo G, Wang M, Li D, Chen Y, et al. Association Between Vitamin D3 Levels and Insulin Resistance: A Large Sample Cross-Sectional Study. Sci Rep (2022) 12(1):119.
2. Liu K, Jin X, Zhang X, Lian H, Ye J. The Mechanisms of Nucleotide Actions in Insulin Resistance. J Genet Genomics (2022) 49(4):299–307.
3. Xing H, Lu J, Yoong SQ, Tan YQ, Kusuyama J, Wu XV, et al. Effect of Aerobic and Resistant Exercise Intervention on Inflammaging of Type 2 Diabetes Mellitus in Middle-Aged and Older Adults: A Systematic Review and Meta-Analysis. J Am Med Dir Assoc (2022) 23(5):823–830.e13.
4. Gong R, Tang X, Jiang Z, Luo G, Dong C, Han X, et al. Serum 25(Oh)D Levels Modify the Association Between Triglyceride and IR: A Cross-Sectional Study. Int J Endocrinol (2022) 2022:5457087.
5. Liu Y, Gong R, Luo G, Li J, Li Q, Yang L, et al. Associations of Triglycerides/High-Density Lipoprotein Cholesterol Ratio With Insulin Resistance, Impaired Glucose Tolerance, and Diabetes in American Adults at Different Vitamin D3 Levels. Front Endocrinol (Lausanne) (2021) 12:735736.
6. Gong R, Liu Y, Luo G, Yang L. Dietary Magnesium Intake Affects the Vitamin D Effects on HOMA-β and Risk of Pancreatic β-Cell Dysfunction: A Cross-Sectional Study. Front Nutr (2022) 9:849747.
7. Gong R, Xu Z, Wei X. The Association Between Vitamin D3 and Diabetes in Both Hyperuricemia and non-Hyperuricemia Populations. Endocrine (2021) 74(1):90–9.
8. Gong R, Liu Y, Luo G, Liu W, Jin Z, Xu Z, et al. Associations of TG/HDL Ratio With the Risk of Prediabetes and Diabetes in Chinese Adults: A Chinese Population Cohort Study Based on Open Data. Int J Endocrinol (2021) 2021:9949579.
9. Neuenschwander M, Ballon A, Weber KS, Norat T, Aune D, Schwingshackl L, et al. Role of Diet in Type 2 Diabetes Incidence: Umbrella Review of Meta-Analyses of Prospective Observational Studies. Bmj (2019) 366:l2368.
10. Wu Y, Ding Y, Tanaka Y, Zhang W. Risk Factors Contributing to Type 2 Diabetes and Recent Advances in the Treatment and Prevention. Int J Med Sci (2014) 11(11):1185–200.
11. De Fronzo RA, Tobin JD, Andres R. Glucose Clamp Technique: A Method for Quantifying Insulin Secretion and Resistance. Am J Physiol (1979) 237(3):E214–23.
12. Bergman RN, Prager R, Volund A, Olefsky JM. Equivalence of the Insulin Sensitivity Index in Man Derived by the Minimal Model Method and the Euglycemic Glucose Clamp. J Clin Invest (1987) 79(3):790–800.
13. Greenfield MS, Doberne L, Kraemer F, Tobey T, Reaven G. Assessment of Insulin Resistance With the Insulin Suppression Test and the Euglycemic Clamp. Diabetes (1981) 30(5):387–92.
14. Amato MC, Giordano C, Galia M, Criscimanna A, Vitabile S, Midiri M, et al. Visceral Adiposity Index: A Reliable Indicator of Visceral Fat Function Associated With Cardiometabolic Risk. Diabetes Care (2010) 33(4):920–2.
15. Stepien M, Stepien A, Wlazel RN, Paradowski M, Rizzo M, Banach M, et al. Predictors of Insulin Resistance in Patients With Obesity: A Pilot Study. Angiology (2014) 65(1):22–30.
16. Fiorentino TV, Marini MA, Succurro E, Andreozzi F, Sesti G. Relationships of Surrogate Indexes of Insulin Resistance With Insulin Sensitivity Assessed by Euglycemic Hyperinsulinemic Clamp and Subclinical Vascular Damage. BMJ Open Diabetes Res Care (2019) 7(1):e000911.
17. Lee J, Kim B, Kim W, Ahn C, Choi HY, Kim JG, et al. Lipid Indices as Simple and Clinically Useful Surrogate Markers for Insulin Resistance in the U.S. Population. Sci Rep (2021) 11(1):2366.
18. Jabłonowska-Lietz B, Wrzosek M, Włodarczyk M, Nowicka G. New Indexes of Body Fat Distribution, Visceral Adiposity Index, Body Adiposity Index, Waist-to-Height Ratio, and Metabolic Disturbances in the Obese. Kardiol Pol (2017) 75(11):1185–91.
19. Borruel S, Moltó JF, Alpañés M, Fernández-Durán E, Álvarez-Blasco F, Luque-Ramírez M, et al. Surrogate Markers of Visceral Adiposity in Young Adults: Waist Circumference and Body Mass Index are More Accurate Than Waist Hip Ratio, Model of Adipose Distribution and Visceral Adiposity Index. PloS One (2014) 9(12):e114112.
20. Ciresi A, Amato MC, Pizzolanti G, Galluzzo Giordano C. Visceral Adiposity Index is Associated With Insulin Sensitivity and Adipocytokine Levels in Newly Diagnosed Acromegalic Patients. J Clin Endocrinol Metab (2012) 97(8):2907–15.
21. Ciresi A, Amato MC, Pivonello R, Nazzari E, Grasso LF, Minuto F, et al. The Metabolic Profile in Active Acromegaly is Gender-Specific. J Clin Endocrinol Metab (2013) 98(1):E51–9.
22. Amato MC, Verghi M, Galluzzo A, Giordano C. The Oligomenorrhoic Phenotypes of Polycystic Ovary Syndrome are Characterized by a High Visceral Adiposity Index: A Likely Condition of Cardiometabolic Risk. Hum Reprod (2011) 26(6):1486–94.
23. Bozorgmanesh M, Hadaegh F, Azizi F. Predictive Performance of the Visceral Adiposity Index for a Visceral Adiposity-Related Risk: Type 2 Diabetes. Lipids Health Dis (2011) 10:88.
24. Ciresi A, Amato MC, Guarnotta V, Lo Castro F, Giordano C. Higher Doses of Cabergoline Further Improve Metabolic Parameters in Patients With Prolactinoma Regardless of the Degree of Reduction in Prolactin Levels. Clin Endocrinol (Oxf) (2013) 79(6):845–52.
25. de Koning L, Merchant AT, Pogue J, Anand SS. Waist Circumference and Waist-to-Hip Ratio as Predictors of Cardiovascular Events: Meta-Regression Analysis of Prospective Studies. Eur Heart J (2007) 28(7):850–6.
26. Goldani H, Adami FS, Antunes MT, Rosa LH, Fassina P, Quevedo Grave MT, et al. Applicatility Of The Visceral Adiposity Index (Vai) In The Prediction Of The Components Of The Metabolic Syndrome In Elderly. Nutr Hosp (2015) 32(4):1609–15.
27. Ahluwalia N, Dwyer J, Terry A, Moshfegh A, Johnson C. Update on NHANES Dietary Data: Focus on Collection, Release, Analytical Considerations, and Uses to Inform Public Policy. Adv Nutr (2016) 7(1):121–34.
28. Randrianarisoa E, Lehn-Stefan A, Hieronimus A, Rietig R, Fritsche A, Machann J, et al. Visceral Adiposity Index as an Independent Marker of Subclinical Atherosclerosis in Individuals Prone to Diabetes Mellitus. J Atheroscler Thromb (2019) 26(9):821–34.
29. Ji B, Qu H, Wang H, Wei H, Deng H. Association Between the Visceral Adiposity Index and Homeostatic Model Assessment of Insulin Resistance in Participants With Normal Waist Circumference. Angiology (2017) 68(8):716–21.
30. Preis SR, Massaro JM, Robins SJ, Hoffmann U, Vasan RS, Irlbeck T, et al. Abdominal Subcutaneous and Visceral Adipose Tissue and Insulin Resistance in the Framingham Heart Study. Obes (Silver Spring) (2010) 18(11):2191–8.
31. Rytka JM, Wueest S, Schoenle EJ, Konrad D. The Portal Theory Supported by Venous Drainage-Selective Fat Transplantation. Diabetes (2011) 60(1):56–63.
32. Makki K, Froguel P, Wolowczuk I. Adipose Tissue in Obesity-Related Inflammation and Insulin Resistance: Cells, Cytokines, and Chemokines. ISRN Inflammation (2013) 2013:139239.
33. Hardy OT, Czech MP, Corvera S. What Causes the Insulin Resistance Underlying Obesity? Curr Opin Endocrinol Diabetes Obes (2012) 19(2):81–7.
34. Steppan CM, Bailey ST, Bhat S, Brown EJ, Banerjee RR, Wright CM, et al. The Hormone Resistin Links Obesity to Diabetes. Nature (2001) 409(6818):307–12.
35. Hivert MF, Sullivan LM, Fox CS, Nathan DM, D'Agostino RB Sr., Wilson PW, et al. Associations of Adiponectin, Resistin, and Tumor Necrosis Factor-Alpha With Insulin Resistance. J Clin Endocrinol Metab (2008) 93(8):3165–72.
36. Coker RH, Williams RH, Yeo SE, Kortebein PM, Bodenner DL, Kern PA, et al. Visceral Fat and Adiponectin: Associations With Insulin Resistance are Tissue-Specific in Women. Metab Syndr Relat Disord (2009) 7(1):61–7.
Keywords: cross-sectional study, american adult, VAI, IR, NHANES
Citation: Jiang K, Luan H, Pu X, Wang M, Yin J and Gong R (2022) Association Between Visceral Adiposity Index and Insulin Resistance: A Cross-Sectional Study Based on US Adults. Front. Endocrinol. 13:921067. doi: 10.3389/fendo.2022.921067
Received: 15 April 2022; Accepted: 22 June 2022;
Published: 22 July 2022.
Edited by:
Andile Khathi, University of KwaZulu-Natal, South AfricaReviewed by:
Luisa Fernández-Chirino, Monterrey Institute of Technology and Higher Education (ITESM), MexicoIbrahim Solak, Konya Beyhekim Training and Research Hospital, Turkey
Lishun Liu, China Agricultural University, China
Copyright © 2022 Jiang, Luan, Pu, Wang, Yin and Gong. This is an open-access article distributed under the terms of the Creative Commons Attribution License (CC BY). The use, distribution or reproduction in other forums is permitted, provided the original author(s) and the copyright owner(s) are credited and that the original publication in this journal is cited, in accordance with accepted academic practice. No use, distribution or reproduction is permitted which does not comply with these terms.
*Correspondence: Rongpeng Gong, Z29uZ3JvbmdwZW5nQHFodS5lZHUuY24=; NDcyODk1NUBxcS5jb20=; Jiahui Yin, MTA3NDM3NDk5MkBxcS5jb20=
†These authors have contributed equally to this work