 Genki Kobayashi1
 Hiroshi Okada1,2*
 Masahide Hamaguchi1
 Kazushiro Kurogi3Hiroaki Murata4Masato Ito3
 Michiaki Fukui1
- 1Department of Endocrinology and Metabolism, Kyoto Prefectural University of Medicine, Graduate School of Medical Science, Kyoto, Japan
- 2Department of Diabetes and Endocrinology, Matsushita Memorial Hospital, Moriguchi, Japan
- 3Department of Health Care Center, Panasonic Health Insurance Organization, Moriguchi, Japan
- 4Department of Orthopaedic Surgery, Matsushita Memorial Hospital, Moriguchi, Japan
Low-density lipoprotein (LDL) cholesterol, high-density lipoprotein (HDL) cholesterol, and LDL/HDL ratio have been associated with new-onset diabetes; however, their cut-off levels have not been determined. We clarified the association between dyslipidemia and the incidence of diabetes. People who underwent a health checkup under a program conducted by Panasonic Corporation from 2008 to 2018 were included. In total, 87,570 participants were included, of whom 5,110 developed type 2 diabetes. Cox regression analyses and time-dependent receiver operating characteristic (ROC) curves were used to evaluate the association between LDL cholesterol, HDL cholesterol, or LDL/HDL ratio and incident diabetes and to identify the cut-off values for incident diabetes. Multivariate analysis showed that LDL cholesterol, HDL cholesterol, and LDL/HDL ratio were significantly associated with the risk of incident type 2 diabetes. Further, the area under the ROC curve and optimized cut-off values for LDL cholesterol, HDL cholesterol, and LDL/HDL ratio for incident type 2 diabetes at 10 years were 0.613 and 124 mg/dl, 0.640 and 54 mg/dl, and 0.662 and 2.4 mg/dl, respectively. The LDL/HDL ratio with a cut-off value of 2.4 was a better predictor of incident diabetes within 10 years than LDL and HDL cholesterol.
Introduction
The number of patients with diabetes has increased in recent years. Without effective countermeasures, the diabetic population is projected to increase to 783 million by 2045 (1), and treatment costs associated with diabetes care will continue to increase. Therefore, the prevention of diabetes is extremely important.
Both dyslipidemia and diabetes are risk factors for atherosclerosis and increased vascular complications that may lead to mortality, such as cardiovascular disease (2, 3). Remarkably, diabetes and dyslipidemia frequently occur together (4). Previous reports have shown that dyslipidemia sometimes precedes the onset of hyperglycemia (5, 6), and low-density lipoprotein (LDL) cholesterol and high-density lipoprotein (HDL) cholesterol are also associated with new-onset diabetes (7). Recently, it has been reported that the LDL/HDL ratio is a more robust indicator of some diseases because it is based on two items instead of only one (7, 8). For instance, previous studies have shown that the LDL/HDL ratio is an indicator of cardiovascular disease (9), stroke (10), non-alcoholic fatty liver disease (11), microalbuminuria (12), and insulin resistance (13). Moreover, recent retrospective studies have suggested that higher LDL/HDL ratios are associated with an increased risk of incident diabetes (7). However, the cut-off values for LDL cholesterol, HDL cholesterol, and LDL/HDL ratio for predicting the incidence of diabetes are unknown. Moreover, the best predictor of diabetes has not yet been reported. Therefore, we conducted this retrospective cohort study to evaluate the association between dyslipidemia and a 10-year incidence of diabetes and to determine the cut-off values of LDL cholesterol, HDL cholesterol, and LDL/HDL ratio to indicate incident type 2 diabetes.
Materials and methods
Study population and study design
This long-term cohort study included participants from a medical health checkup program conducted by the Panasonic Corporation in Osaka, Japan. This program improved public health through the early detection of chronic diseases, including metabolic disorders, and by evaluating potential risk factors. All employees participated in this annual medical checkup. We used data collected between 2008 and 2018 from the database of the Panasonic Cohort Study.
Blood samples were obtained after fasting for >10 h. Weight and height were recorded using an automatic weight and height meter. The baseline characteristics were assessed using a self-administered questionnaire that was previously standardized and validated (14). Participants were categorized as nonsmokers, past smokers, or current smokers. Participants were also grouped into three levels of eating speed: fast, normal, and slow. The eating rate was determined using a questionnaire. The participants were asked about their breakfast habits. Participants who regularly engaged in any sport at least twice per week were defined as regular exercisers. Type 2 diabetes was defined as a fasting plasma glucose level of ≥126 mg/dl, a self-reported history of diabetes, and the use of anti-diabetic drugs.
This study was approved by the local ethics committee of the Panasonic Health Insurance Organization (approval number: 2021-001) and was conducted in accordance with the principles of the Declaration of Helsinki.
Exclusion criteria
Figure 1 shows the study flow diagram for the registration of participants. In total, 140,590 employees underwent medical health checkups in 2008. Participants who did not undergo a blood examination in 2008 (n = 36,406), participants with missing data (BMI or self-administered questionnaires) (n = 1,264), those who were taking anti-dyslipidemic drugs at baseline (n = 2,811), those with diabetes at baseline (N = 5,244), and those who had undergone a medical health checkup only in 2008 (n = 7,295) were excluded from the study.
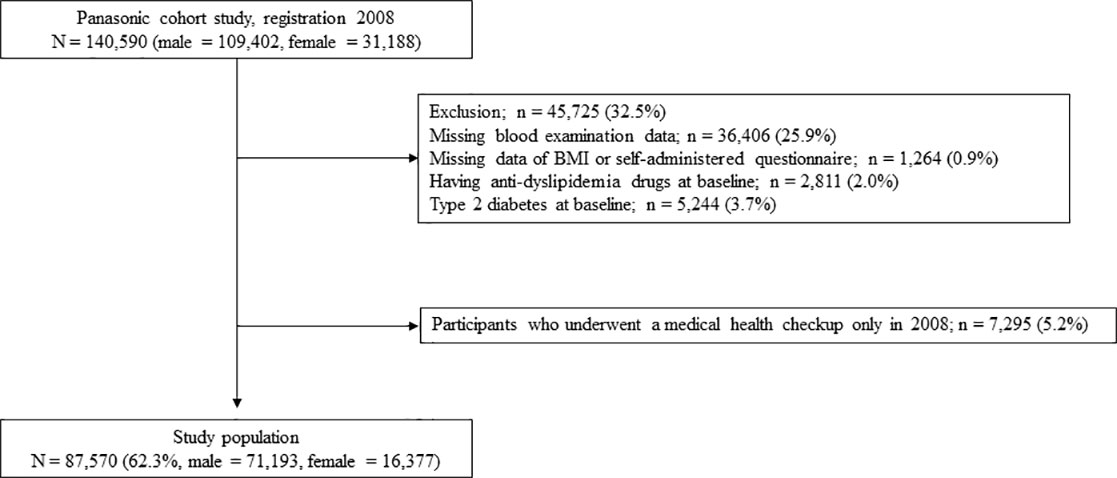
Figure 1 Study flow diagram for the registration of participants.
Statistical analyses
The means and frequencies of potential confounding variables were calculated. The Student’s t-test and the chi-square test were used to assess the differences in general characteristics at baseline according to the incidence of type 2 diabetes at the 10-year follow-up. The association between LDL cholesterol, HDL cholesterol, or LDL/HDL ratio and incident type 2 diabetes was evaluated by Cox regression analyses using multivariate models. The covariates included in the multivariate models were the factors associated with incident type 2 diabetes. The multivariate model was adjusted for age, sex, BMI, systolic blood pressure, triglycerides, uric acid, fasting plasma glucose, smoking status, eating speed, skipping breakfast, and exercise habits. LDL cholesterol and HDL cholesterol levels were added to Model 1. The LDL/HDL ratio was added to model 2 instead of LDL cholesterol and HDL cholesterol. To evaluate the predictive performance of LDL cholesterol, HDL cholesterol, and LDL/HDL ratio, we employed time-dependent ROC curves for censored survival data and the AUC as criteria. We compared the AUC of LDL cholesterol, HDL cholesterol, and LDL/HDL ratio with the Bootstrap method. We assessed the optimal cut-off values of LDL cholesterol, HDL cholesterol, and LDL/HDL ratio for incident type 2 diabetes in all patients, patients with BMI <25 kg/m2, and patients with BMI ≥25 kg/m2. All continuous variables are presented as the mean ± SD or absolute numbers. Differences were considered statistically significant at P <0.05. The associations are presented as HRs with a 95% CI. Statistical analyses were conducted using JMP software, version 12 (SAS Institute, Cary, NC, USA).
Results
Table 1 shows the baseline characteristics of the participants. A total of 5,110 participants developed type 2 diabetes during the study period. Biochemical tests showed significantly higher levels of LDL cholesterol and lower levels of HDL cholesterol in the population with incident diabetes than in those without incident diabetes. Table 2 shows the unadjusted and adjusted hazard ratios (HRs) for incident type 2 diabetes. Multivariate analysis showed that LDL cholesterol (HR; 1.02 [95% confidence interval (CI): 1.01–1.03]), HDL cholesterol (HR; 0.89 [95% CI: 0.87–0.91]), and LDL/HDL ratio (HR; 1.19 [95% CI: 1.16–1.23]) were significantly associated with the risk of incident type 2 diabetes.
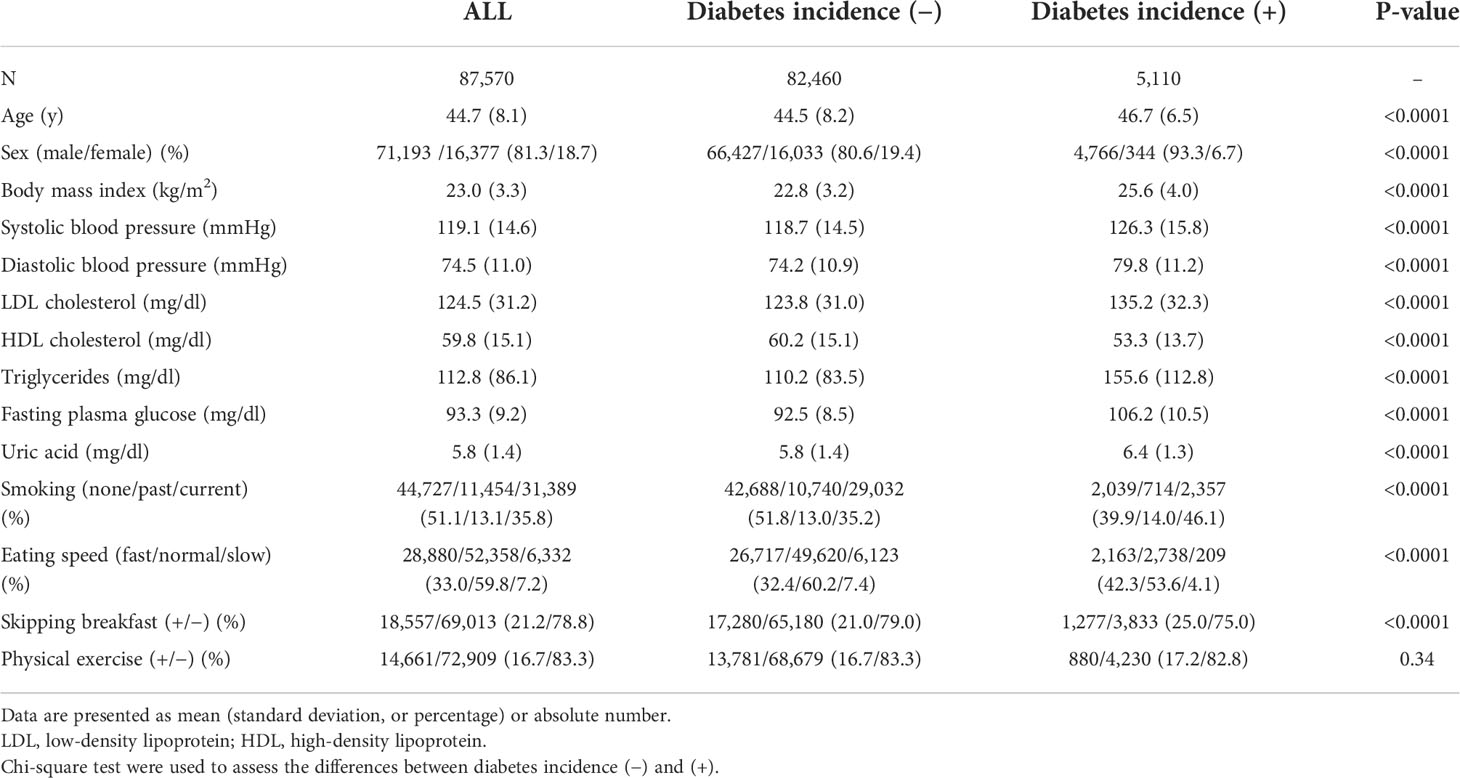
Table 1 Characteristics of Panasonic Cohort Study participants at baseline by diabetes incidence during the 10-year follow-up period.
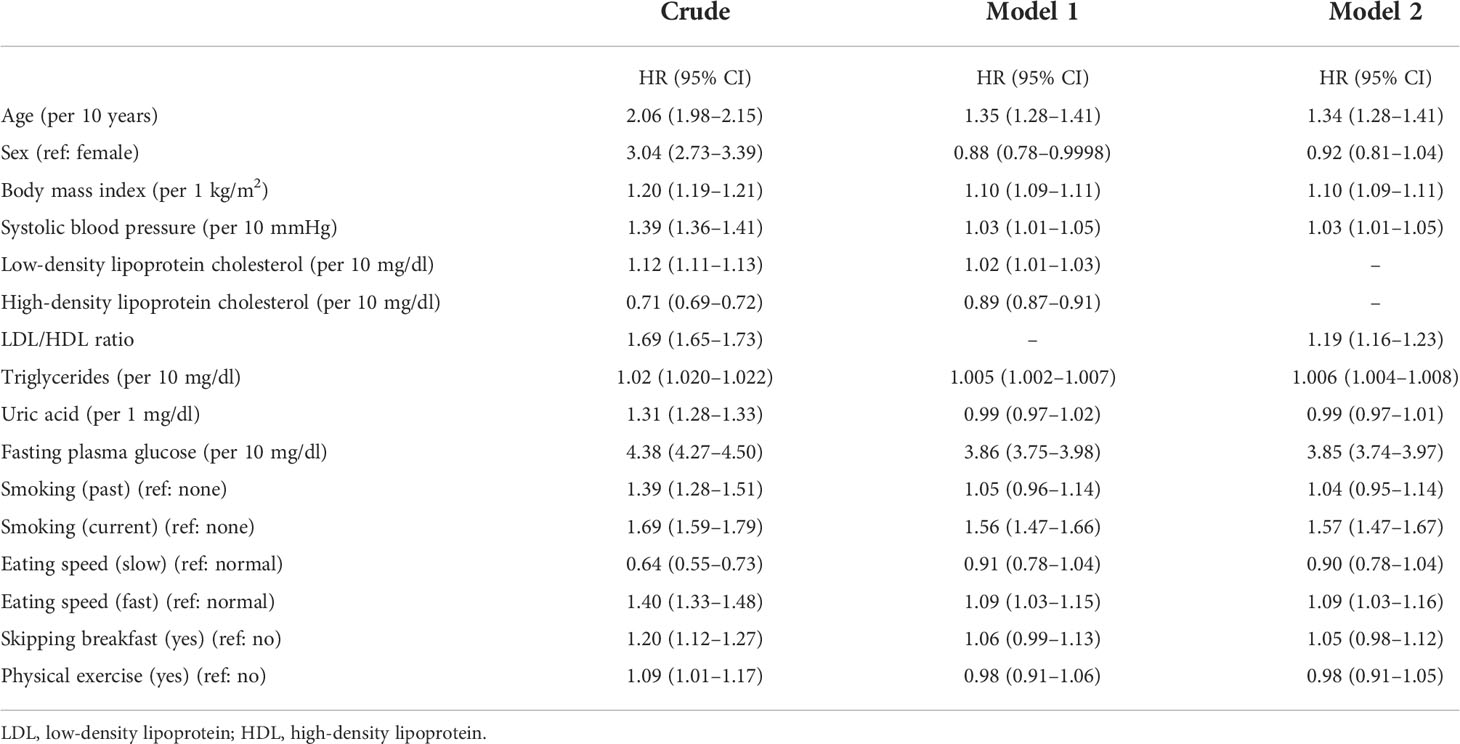
Table 2 Unadjusted and adjusted hazard ratios for incidence of diabetes during the 10-year follow-up period.
Time-dependent receiver operating characteristic (ROC) curve analysis revealed the area under the curve (AUC) at 10 years. The AUC and optimized cut-off values for LDL cholesterol, HDL cholesterol, and LDL/HDL ratio for incident type 2 diabetes at 10 years were 0.613 and 124 mg/dl, 0.640 and 54 mg/dl, and 0.662 and 2.4 mg/dl, respectively. The AUC of the LDL/HDL ratio was higher than that of LDL cholesterol (difference value; 0.05, 95% CI; 0.044 to 0.055, P <0.0001) or HDL cholesterol (difference value; 0.019, 95% CI; 0.013 to 0.024, P <0.0001). Figure 2 and Table 3 show the time-dependent ROC curve that indicates the ability of LDL cholesterol, HDL cholesterol, and LDL/HDL ratio for predicting the incidence of diabetes. The sensitivity and specificity of LDL cholesterol, HDL cholesterol, and LDL/HDL ratio to predict the incidence of diabetes were 64.2% and 53.3%, 57.7% and 63.7%, and 60.7% and 63.7%, respectively. The AUC and optimal cut-off values were similar in all patients, patients with a body mass index (BMI) <25 kg/m2, and patients with a BMI ≥25 kg/m2 (Table 3).
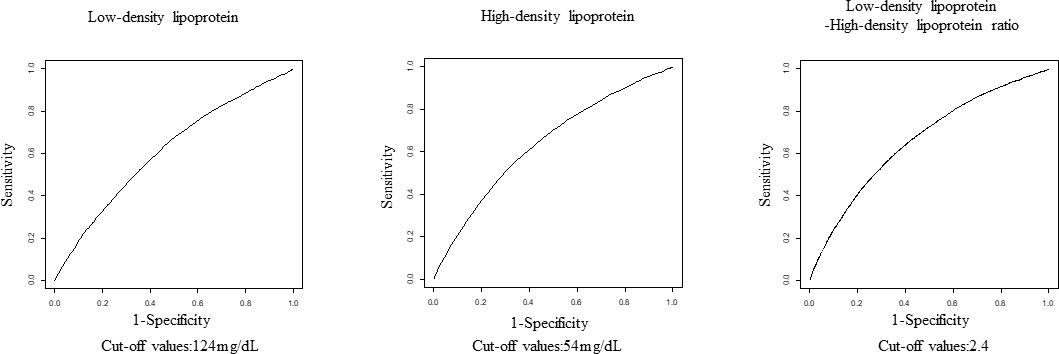
Figure 2 The receiver operating characteristic curve showing the ability of LDL, HDL, and LDL/HDL ratio to determine the incidence of diabetes after 10 years of follow-up. LDL, low-density lipoprotein; HDL, high-density lipoprotein.

Table 3 The area under the curve and optimal cut-off values.
Discussion
Our major findings were as follows: (1) we obtained cut-off values of 124 mg/dl, 54 mg/dl, and 2.4 mg/dl for LDL cholesterol, HDL cholesterol, and LDL/HDL ratio, respectively, for incident type 2 diabetes within 10 years, and (2) the LDL/HDL ratio was more predictive of incident diabetes within 10 years than LDL and HDL cholesterol.
Dyslipidemia in type 2 diabetes is characterized by high triglyceride or LDL cholesterol levels and low HDL levels (15, 16). Previous reports have shown that both LDL and HDL cholesterol are associated with the risk of developing diabetes (5, 6, 17). Previous studies have reported that lipid ratios are more sensitive than individual lipid indices (e.g., HDL cholesterol, LDL cholesterol, and triglycerides) for the diagnosis and prevention of coronary atherosclerotic disease in patients with type 2 diabetes (15, 18). Moreover, other studies have shown that the LDL/HDL ratio is a valid predictor of insulin resistance in healthy adults (19) and that this parameter is associated with incident diabetes in patients with hypertension (20). It has also been shown that the incidence of diabetes increases as the LDL/HDL ratio increases (7). However, these studies have some limitations; they are cross-sectional studies (19, 20) or have follow-up periods of only a few years (7). Moreover, the use of anti-dyslipidemic drugs, including statins, which could affect the incidence of diabetes (21, 22), was not considered in a previous study (7). Furthermore, the cut-off levels for LDL cholesterol, HDL cholesterol, and LDL/HDL ratio that are most associated with incident diabetes have not been determined.
It has been reported that an LDL/HDL ratio of <2 inhibits plaque growth and regression due to atherosclerosis (23). Another study has shown that an LDL/HDL ratio of <2.5 is useful for screening atherosclerosis (24). These cut-off values are consistent with our results. We assessed the optimal cut-off values of LDL cholesterol, HDL cholesterol, and LDL/HDL ratio for incident type 2 diabetes in patients with BMI <25 kg/m2, and in patients with BMI ≥25 kg/m2, which is the definition of obesity in Japan, because it has been reported that obesity could modulate the relationship between dyslipidemia and diabetes due to insulin resistance and relative insulin deficiency, and the risk factors of incident diabetes vary with BMI in the Japanese population (25). The AUC and optimal cut-off values in this study were similar for both obese and non-obese patients.
The relationship between dyslipidemia and diabetes may be as follows: LDL cholesterol decreases the expression of cyclin B1 in pancreatic β-cells and inhibits insulin secretion mediated by the LDL receptor, resulting in insulin resistance (5, 7, 26–28). In contrast, HDL cholesterol improves insulin resistance by inhibiting β-cell apoptosis, promoting insulin secretion, and inhibiting the action of LDL cholesterol (5, 7, 26–28). Additionally, diabetes and insulin resistance can lead to high triglyceride levels, resulting in decreased HDL cholesterol levels (29, 30).
Interestingly, a previous study has reported a U-shaped association between the LDL/HDL ratio and all-cause mortality in elderly hypertensive patients (31). The reasons why not only higher LDL/HDL ratios but also lower LDL/HDL ratios were associated with higher all-cause mortality are thought to be as follows. The lower LDL/HDL ratio was caused by higher HDL cholesterol levels. Bowe et al. (32) reported that a higher HDL cholesterol level was associated with increased mortality. HDL cholesterol loses its protective effect at higher levels (33). No U-shaped association between the LDL/HDL ratio and incident type 2 diabetes was not found in this study (data not shown).
The strength of our study stem from its large sample size and long follow-up duration because this cohort study was conducted using health examinations of the corporation. Furthermore, patients taking anti-dyslipidemia drugs that could affect lipid profiles were excluded. However, one limitation of this study was that only relatively young Japanese subjects were included. Therefore, it is unclear whether the results of this study can be generalized to other ethnic categories and age groups.
We determined the cut-off levels of LDL cholesterol, HDL cholesterol, and LDL/HDL ratio for 10-year diabetes incidence. Additionally, we found that LDL/HDL ratio was more useful than LDL and HDL cholesterol in predicting incident diabetes within 10 years. Therefore, it is important to focus on LDL cholesterol, HDL cholesterol, and, especially, LDL/HDL ratio to assess the risk of diabetes, and if screening is positive, the patients should be carefully monitored and early intervention should be considered, including diet and exercise therapy, to prevent the incidence of diabetes.
Data availability statement
The original contributions presented in the study are included in the article/supplementary material. Further inquiries can be directed to the corresponding author.
Ethics statement
The studies involving human participants were reviewed and approved by the local ethics committee of the Panasonic Health Insurance Organization. Written informed consent for participation was not required for this study in accordance with the national legislation and the institutional requirements.
Author contributions
GK wrote the manuscript. MH, KK, and HM contributed to the discussion. HO and MI researched the data and contributed to the conception and discussion. HO and MF reviewed and edited the manuscript. All authors listed have made a substantial, direct, and intellectual contribution to the work and approved it for publication.
Conflict of interest
HO received personal fees from MSD K.K., Mitsubishi Tanabe Pharma Corporation, Sumitomo Dainippon Pharma Co., Ltd., Novo Nordisk Pharma Ltd., Daiichi Sankyo Co., Ltd, Eli Lilly Japan K.K, Kyowa Hakko Kirin Company Ltd, Kissei Pharmaceutical Co., Ltd, Kowa Pharmaceutical Co., Ltd, Ono Pharmaceutical Co., Ltd. and Sanofi K.K. M.H. received grants from Ono Pharma Co. Ltd., AstraZeneca K.K., Oishi Kenko Inc., Yamada Bee Farm and received personal fees from Sumitomo Dainippon Pharma Co., Ltd., AstraZeneca K.K., Ono Pharma Co. Ltd., Eli Lilly, Japan, Daiichi Sankyo Co. Ltd., Mitsubishi Tanabe Pharma Corp., Sanofi K.K., K.K., Kowa Pharma Co. Ltd., outside the submitted work. MF received grants from Ono Pharma Co. Ltd., Oishi Kenko inc., Yamada Bee Farm, Astellas Pharma Inc., Mitsubishi Tanabe Pharma Corp., Nippon Boehringer Ingelheim Co. Ltd., MSD K.K., Kissei Pharma Co. Ltd., Daiichi Sankyo Co. Ltd., Sanwa Kagagu Kenkyusho Co., Ltd., Sanofi K.K., Takeda Pharma Co. Ltd., Kyowa Kirin Co., Ltd., Sumitomo Dainippon Pharma Co., Ltd., Terumo Corp., Tejin Pharma Ltd., Novo Nordisk Pharma Ltd., Eli Lilly, Japan, K.K., Taisho Pharma Co., Ltd., Abbott Japan Co. Ltd., Nippon Chemiphar Co., Ltd., Kowa Pharma Co. Ltd. and Johnson & Johnson K.K. Medical Co. and received personal fees from Abbott Japan Co. Ltd., Kissei Pharma Co., Ltd., Sumitomo Dainippon Pharma Co. Ltd., Mitsubishi Tanabe Pharma Corp., Daiichi Sankyo Co. Ltd., Sanofi K.K., Astellas Pharma Inc., MSD K.K., Kyowa Kirin Co. Ltd., Taisho Pharma Co., Ltd., Kowa Pharma Co. Ltd., Mochida Pharma Co. Ltd., Novo Nordisk Pharma Ltd., Ono Pharma Co. Ltd., Sanwa Kagaku Kenkyusho Co. Ltd., Eli Lilly Japan K.K., Takeda Pharma Co. Ltd., Bayer Yakuhin, Ltd., AstraZeneca K.K., Nippon Boehringer Ingelheim Co., Ltd., Teijin Pharma Ltd., Medtronic Japan Co. Ltd., Arkray Inc. and Nipro Corp. outside the submitted work.
The remaining authors declare that the research was conducted in the absence of any commercial or financial relationships that could be construed as a potential conflict of interest.
Publisher’s note
All claims expressed in this article are solely those of the authors and do not necessarily represent those of their affiliated organizations, or those of the publisher, the editors and the reviewers. Any product that may be evaluated in this article, or claim that may be made by its manufacturer, is not guaranteed or endorsed by the publisher.
References
1. Sun H, Saeedi P, Karuranga S, Pinkepank M, Ogurtsova K, Duncan BB, et al. IDF diabetes atlas: Global, regional and country-level diabetes prevalence estimates for 2021 and projections for 2045. Diabetes Res Clin Pract (2022) 183:109119. doi: 10.1016/j.diabres.2021.109119
2. Costa J, Borges M, David C, Vaz Carneiro A. Efficacy of lipid lowering drug treatment for diabetic and non-diabetic patients: Meta-analysis of randomised controlled trials. Br Med J (2006) 332:1115–24. doi: 10.1136/bmj.38793.468449.AE
3. Rao Kondapally Seshasai S, Kaptoge S, Thompson A, Angelantonio ED, Gao P, Sarwar N, et al. Diabetes mellitus, fasting glucose, and risk of cause-specific death. N Engl J Med (2011) 364(9):829–41. doi: 10.1056/NEJMoa1008862
4. Fujihara K, Matsubayashi Y, Yamamoto M, Osawa T, Ishizawa M, Kaneko M, et al. Impact of body mass index and metabolic phenotypes on coronary artery disease according to glucose tolerance status. Diabetes Metab (2017) 43:543–6. doi: 10.1016/j.diabet.2017.08.002
5. von Eckardstein A, Sibler RA. Possible contributions of lipoproteins and cholesterol to the pathogenesis of diabetes mellitus type 2. Curr Opin Lipidology (2011) 22:26–32. doi: 10.1097/MOL.0b013e3283412279
6. Taskinen M-R, Borén J. New insights into the pathophysiology of dyslipidemia in type 2 diabetes. Atherosclerosis (2015) 239:483–95. doi: 10.1016/j.atherosclerosis.2015.01.039
7. Wei L, Wei M, Chen L, Liang S, Gao F, Cheng X, et al. Low-density lipoprotein cholesterol : High-density lipoprotein cholesterol ratio is associated with incident diabetes in Chinese adults: A retrospective cohort study. J Diabetes Invest (2021) 12:91–8. doi: 10.1111/jdi.13316
8. Bando Y, Wakaguri H, Aoki K, Kanehara H, Hisada A, Okafuji K, et al. Non-High-Density cholesterol level as a predictor of maximum carotid intima-media thickness in Japanese subjects with type 2 diabetes: A comparison with low-density lipoprotein level. Diabetol Int (2016) 7:34–41. doi: 10.1007/s13340-015-0208-0
9. Kurebayashi N, Yoshikawa D, Ishii H, Sato B, Ando H, Okada T, et al. Impact of the low-to high-density lipoprotein cholesterol ratio on composition of angiographically ambiguous. Circ J (2011) 75:1960–7. doi: 10.1253/circj.cj-11-0019
10. Liu L, Yin P, Lu C, Li J, Zang Z, Liu Y, et al. Association of LDL-C/HDL-C ratio with stroke outcomes within 1 year after onset: A hospital-based follow-up study. Front Neurol (2020) 11:408. doi: 10.3389/fneur.2020.00408
11. Zou Y, Zhong L, Hu C, Zhong M, Peng N, Sheng G. LDL/HDL cholesterol ratio is associated with new-onset NAFLD in Chinese non-obese people with normal lipids: A 5-year longitudinal cohort study. Lipids Health Dis (2021) 20(1):28. doi: 10.1186/s12944-021-01457-1
12. Idowu AA, Ajose AO, Adedeji AT, Adegoke AO, Jimoh KA. Microalbuminuria, other markers of nephropathy and biochemical derangements in type 2 diabetes mellitus: Relationships and determinants. Ghana Med J (2017) 51:56–63. doi: 10.4314/gmj.v51i2.3
13. Kawamoto R, Tabara Y, Kohara K, Miki T, Kusunoki T, Takayama S, et al. Low-density lipoprotein cholesterol to high-density lipoprotein cholesterol ratio is the best surrogate marker for insulin resistance in non-obese Japanese adults. Lipids Health Dis (2020) 9:138. doi: 10.1186/1476-511X-9-138
14. Kobayashi S, Honda S, Murakami K, Sasaki S, Okubo H, Hirota N, et al. Both comprehensive and brief self-administered diet history questionnaires satisfactorily rank nutrient intakes in Japanese adults. J Epidemiol (2012) 22:151–9. doi: 10.2188/jea.je20110075
15. Du Y, Chen J, Chen MH, Yang SH, Li S, Guo YL, et al. Relationship of lipid and lipoprotein ratios with coronary severity in patients with new on-set coronary artery disease complicated with type 2 diabetics. J Geriatric Cardiol (2016) 13:685–92. doi: 10.11909/j.issn.1671-5411.2016.08.007
16. Araki E, Goto A, Kondo T, Noda M, Noto M, Origasa H, et al. Japanese Clinical practice guideline for diabetes 2019. Diabetol Int (2020) 11(4):1020–76. doi: 10.1111/jdi.13306
17. Yan Z, Liu Y, Huang H. Association of glycosylated hemoglobin level with lipid ratio and individual lipids in type 2 diabetic patients. Asian Pacific J Trop Med (2012) 6:469–71. doi: 10.1016/S1995-7645(12)60080-7
18. Ridker PM, Rifai N, Cook NR, Bradwin G, Buring JE. Non–HDL cholesterol, apolipoproteins a-I and b 100 , standard lipid measures, lipid ratios, and CRP as risk factors for cardiovascular disease in women. JAMA (2005) 294(3):326–33. doi: 10.1001/jama.294.3.326
19. Byun AR, Lee SW, Lee HS, Shim KW. What is the most appropriate lipid profile ratio predictor for insulin resistance in each sex? a cross-sectional study in Korean populations (The fifth Korea national health and nutrition examination survey). Diabetol Metab Syndrome (2015) 7:59. doi: 10.1186/s13098-015-0051-2
20. Hong M, Ling Y, Lu Z, Liu Y, Gu P, Shao J, et al. Contribution and interaction of the low-density lipoprotein cholesterol to high-density lipoprotein cholesterol ratio and triglyceride to diabetes in hypertensive patients: A cross-sectional study. J Diabetes Invest (2019) 10:131–8. doi: 10.1111/jdi.12856
21. Mansi IA, Chansard M, Lingvay I, Zhang S, Halm EA, Alvarez CA. Association of statin therapy initiation with diabetes progression: A retrospective matched-cohort study. JAMA Intern Med (2021) 181:1562–74. doi: 10.1001/jamainternmed.2021.5714
22. Dormuth CR, Filion KB, Paterson JM, James MT, Teare GF, Raymond CB, et al. Higher potency statins and the risk of new diabetes: Multicentre, observational study of administrative databases. BMJ (2014) 348:g3244. doi: 10.1136/bmj.g3244
23. Nicholls SJ, Tuzcu EM, Sipahi I, Grasso AW, Schoenhagen P, Hu T, et al. Statins, high-density lipoprotein cholesterol, and regression of coronary atherosclerosis. JAMA (2007) 297(5):499–508. doi: 10.1001/jama.297.5.499
24. Hamri WH, Diaf M. Lipoprotein ratios: A potential biomarker for clinical diagnosis of atherosclerosis in type 1 diabetic patients with foot ulceration. Cureus (2021) 13(3):e14064. doi: 10.7759/cureus.14064
25. Saijo Y, Okada H, Hamaguchi M, Habu M, Kurogi K, Murata H, et al. The risk factors for development of type 2 diabetes: Panasonic cohort study 4. Int J Environ Res Public Health (2022) 19(1):571. doi: 10.3390/ijerph19010571
26. Sokooti S, Flores-Guerrero JL, Heerspink HJL, Connelly MA, Bakker SJL, Dullaart RPF. Triglyceride-rich lipoprotein and LDL particle subfractions and their association with incident type 2 diabetes: The PREVEND study. Cardiovasc Diabetol (2021) 20(1):156. doi: 10.1186/s12933-021-01348-w
27. Roehrich ME, Mooser V, Lenain V, Herz J, Nimpf J, Azhar S, et al. Insulin-secreting β-cell dysfunction induced by human lipoproteins. J Biol Chem (2003) 278:18368–75. doi: 10.1074/jbc.M300102200
28. Rütti S, Ehses JA, Sibler RA, Prazak R, Rohrer L, Georgopoulos S, et al. Low- and high-density lipoproteins modulate function, apoptosis, and proliferation of primary human and murine pancreatic β-cells. Endocrinology (2009) 150:4521–30. doi: 10.1210/en.2009-0252
29. Tang X, Yan X, Zhou H, Huang G, Niu X, Jiang H, et al. Associations of insulin resistance and beta-cell function with abnormal lipid profile in newly diagnosed diabetes. Chin Med J (2022). doi: 10.1097/CM9.0000000000002075
30. Ginsberg HN. Insulin resistance and cardiovascular disease. J Clin Invest (2000) 106:453–8. doi: 10.1172/JCI10762
31. Yu Y, Li M, Huang X, Zhou W, Wang T, Zhu T, et al. A U-shaped association between the LDL-cholesterol to HDL-cholesterol ratio and all-cause mortality in elderly hypertensive patients: A prospective cohort study. Lipids Health Dis (2020) 19(1):238. doi: 10.1186/s12944-020-01413-5
32. Bowe B, Xie Y, Xian H, Balasubramanian S, Zayed MA, Al-Aly Z. High density lipoprotein cholesterol and the risk of all-cause mortality among U.S. veterans. Clin J Am Soc Nephrol (2016) 11(10):1784–93. doi: 10.2215/CJN.00730116
33. Huang CY, Lin FY, Shih CM, Au HK, Chang YJ, Nakagami H, et al. Moderate to high concentrations of high-density lipoprotein from healthy subjects paradoxically impair human endothelial progenitor cells and related angiogenesis by activating rho-associated kinase pathways. Arterioscler Thromb Vasc Biol (2012) 10:2405–17. doi: 10.1161/ATVBAHA.112.248617
Keywords: incident diabetes, LDL/HDL ratio, LDL cholesterol, HDL cholesterol, cohort study
Citation: Kobayashi G, Okada H, Hamaguchi M, Kurogi K, Murata H, Ito M and Fukui M (2022) Dyslipidemia and 10-year diabetes incidence in Japanese people: Population-based Panasonic cohort study 9. Front. Endocrinol. 13:957728. doi: 10.3389/fendo.2022.957728
Received: 31 May 2022; Accepted: 05 July 2022;
Published: 05 August 2022.
Edited by:
Antonio Brunetti, Magna Græcia University, ItalyReviewed by:
Silvia Paredes, University Hospital Center of Porto, PortugalAnu Grover, Ipca Laboratories, India
Copyright © 2022 Kobayashi, Okada, Hamaguchi, Kurogi, Murata, Ito and Fukui. This is an open-access article distributed under the terms of the Creative Commons Attribution License (CC BY). The use, distribution or reproduction in other forums is permitted, provided the original author(s) and the copyright owner(s) are credited and that the original publication in this journal is cited, in accordance with accepted academic practice. No use, distribution or reproduction is permitted which does not comply with these terms.
*Correspondence: Hiroshi Okada, Y29udGlAa290by5rcHUtbS5hYy5qcA==