 Wolfgang Högler
 Katharina Tischlinger
 William D. Fraser
 Jonathan C. Y. Tang
 Suma Uday
- 1Department of Paediatrics and Adolescent Medicine, Johannes Kepler University Linz, Linz, Austria
- 2Institute of Metabolism and Systems Research, University of Birmingham, Edgbaston, Birmingham, United Kingdom
- 3Department of Medicine, Norwich Medical School, University of East Anglia, Norwich Research Park, Norwich, United Kingdom
- 4Departments of Diabetes and Endocrinology and Clinical Biochemistry, Norfolk and Norwich University Hospital, Norwich, United Kingdom
- 5Clinical Biochemistry, Departments of Laboratory Medicine, Norfolk and Norwich University Hospital NHS Foundation Trust, Norwich, United Kingdom
- 6Department of Endocrinology and Diabetes, Birmingham Women’s and Children’s Hospital, Birmingham, United Kingdom
Objectives: Vitamin D deficiency in neonates can have life-threatening consequences, hence the knowledge of risk factors is essential. This study aimed to explore the effect of maternal socioeconomic status (SES) on newborn 25-hydroxyvitamin D (25OHD) concentrations.
Design: Over two 1-week periods (winter and summer of 2019), 3000 newborn heel prick dried blood spots (DBS) and additional data of newborns, from a regional newborn screening laboratory (52° N) in the West Midlands, UK, were gathered. Post code was replaced with lower layer super output area (LSOA). Index of Multiple Deprivation (IMD) quintiles for the corresponding LSOA was used to assess SES [quintile one (Q1): most deprived 20%, quintile five (Q5): least deprived 20%]. Each of the seven domains of deprivation were examined (income, employment, education, health, barriers to housing and services, crime and living environment). 25OHD was measured on 6mm sub-punch from DBS using quantitative liquid chromatography tandem mass spectrometry and equivalent plasma values were derived.
Results: In total 2999 (1500 summer-born, 1499 winter-born) newborn DBS (1580 males) were analysed. Summer-born newborns had significantly higher 25OHD (IQR) concentrations [49.2 (34.3; 64.8) nmol/l] than winter-born newborns [29.1 (19.8; 40.6) nmol/l, p<0.001].25OHD levels varied significantly between the different IMD quintiles in the whole (p<0.001) and summer-born cohort (p<0.001), but not in the winter-born cohort (p=0.26), whereby Q1 had the lowest 25OHD concentrations. Among the domains of deprivation, living environment had a significant influence on 25OHD levels (β=0.07, p=0.002). In this subdomain, 25OHD levels varied significantly between quintiles in the whole (p<0.001) and summer-born cohort (mean 25OHD Q1 46.45 nmol/l, Q5 54.54 nmol/l; p<0.001) but not in the winter-born cohort (mean 25OHD Q1 31.57 nmol/l, Q5 31.72 nmol/l; p=0.16). In a regression model, living environment was still significant (p=0.018), albeit less than season of birth and ethnicity.
Conclusion: Among the seven domains of deprivation, maternal living environment had the greatest effect on newborn 25OHD levels. Whilst improved living environment positively influenced vitamin D status in the summer-born babies, winter-born had low 25OHD levels irrespective of the environment. Strategies such as enhanced supplementation and food fortification with vitamin D should be considered to overcome the non-modifiable main risk factors for vitamin D deficiency.
Introduction
Akin to many other micronutrients, the newborn’s vitamin D status depends mainly on maternal supplies. Adequate maternal vitamin D reserve confers protection of her offspring from complications of vitamin D deficiency and provides adequate mineral substrate for bone growth, strength and wellbeing (1–4). Infants are a known risk group for vitamin D deficiency for several reasons, including deprivation of direct sunlight for cutaneous production (5), rapid growth and the lack of adequate vitamin D in breast milk (6). Vitamin D deficiency can lead to serious hypocalcaemic and hypophosphataemic complications. Hypocalcaemic complications in infancy include seizures, tetany, dilated cardiomyopathy and cardiac failure (7–9). Hypophosphataemic complications typically manifest after the first 6 months of life and can lead to poor growth, delayed motor milestones and nutritional rickets (10).
Ethnicity, living at high latitude, season, reduced sun exposure or chronic diseases are just a few well studied risk factors for vitamin D deficiency (11). It has been well recognised that socioeconomic status (SES), affects the prevalence of obesity and care of children with type 1 diabetes (12, 13), similarly it is thought to affect vitamin D status. Heterogeneity of SES definitions and confounding factors such as diet and lifestyle are likely to influence the association. To assess deprivation some studies use an overall SES index or index of multiple deprivation (IMD) (14–16) and others differentiate between its components such as income, employment, housing or education (17, 18).
There is evidence that socioeconomic deprivation, which is assessed in various ways in the literature such as SES index or individual income data, is associated with lower 25OHD levels (19–21). Data from pregnant women in the US showed an association of maternal 25OHD with SES, but after multivariable analysis including ethnicity, vitamin D supplement use and physical activity, the association with SES was no longer evident (22).
Whether newborn 25OHD level is influenced by maternal SES is not entirely clear. Some studies observed an association between neonatal vitamin D status and different maternal SES components such as health insurance status (18) and housing (23). However, other studies showed no association of 25OHD levels with maternal SES as assessed by education and annual income, following single variant analysis (24), or after multivariable analysis including ethnicity, season of birth and prenatal vitamin D intake (17).
Here, we set out to assess the influence of maternal SES on newborn vitamin D status in a large cohort of summer- and winter-born babies from diverse ethnic backgrounds.
Aims
1. Ascertain the variation in newborn 25OHD levels based on maternal deprivation quintiles.
2. Evaluate the influence of each of the seven domains of maternal deprivation quintiles (income, employment, education, health, crime, barriers to housing and services and living environment) on newborn 25OHD levels.
3. Evaluate the seasonal variation in influence of living environment quintiles on newborn 25OHD levels.
Research design and methods
Study design:
3000 dried blood spot (DBS) cards received at Birmingham Women’s and Children’s Hospital’s regional newborn screening laboratory, covering the West Midlands region of England (52° N), were collected after obtaining ethical and regulatory approvals. After anonymisation of the data collected on newborn blood spot (NBS) cards, quantitative liquid chromatography tandem mass spectrometry was used to measure 25OHD concentration on DBS and evaluate plasma equivalent values. Results on the ethnic and seasonal variations in 25OHD of the cohort have been published (25). Here, we present the results of additional analysis focusing on socioeconomic data.
Study population:
To identify a panel of metabolic diseases, the national NBS programme screens every newborn baby in England by collecting a DBS sample around day 5 of life. After all routine NBS testing was done these samples were gathered in two one-week periods, one in winter (February 2019) and one in summer (August 2019). Samples with high risk of infection, incomplete data or insufficienct sample, second tests and newborns older than 21 days were excluded.
DBS samples:
An appropriately trained health care professional obtained the sample by a heel prick and transferred it to a standard Whatman 903 filter paper. The samples were continuously kept at room temperature and away from direct sunlight during daily transportation from the maternity service to the screening laboratory. All samples arrived in the screening laboratory within 3 days and 90% on the same day. Within a week after arrival at the screening laboratory the samples were stored at -20°C and analysis undertaken at recruitment completion (October 2019-December 2019) (25).
Source data
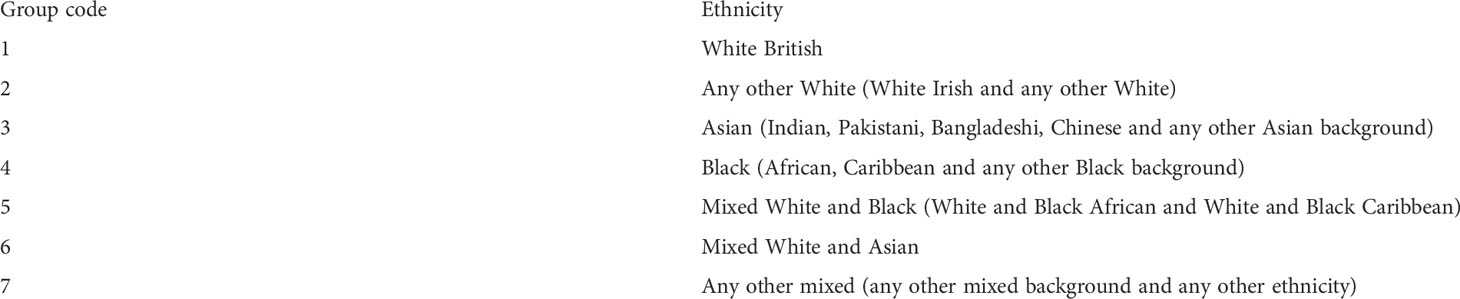
Information about the newborn (birth weight, gestational age) and the mother (maternal age, ethnic group code) was obtained and anonymised. Ethnic group codes were assigned (Box 1) according to the UK Office of National Statistics (26).
Lower Layer Super Output Area (LSOA)
Postcode was replaced with LSOA, a geographic area used for small area statistics. Every LSOA contains a mean population of 1500, yielding to a total of 32,844 LSOA’s in England and every LSOA has a deprivation index rank assigned (27).
Deprivation indices
The UK government uses 39 separate indicators to measure indices of deprivation. The Index of Multiple Deprivation (IMD) is part of the Indices of Deprivation and is the most widely used of these indices. It combines information from the seven domains (which measure different types or dimensions of deprivation) to produce an overall relative measure of deprivation. The seven main domains with different impact include income (22.5%), employment (22.5%), education (13.5%), health (13.5%), crime (9.3%), barriers to housing and services (9.3%) and living environment (9.3%) (27).
Every LSOA can be ranked according to their IMD (1 to 32,844) and each subdomain from the most deprived to the least deprived or it can be divided in five quintiles. Each quintile accounts for 20% of the total LSOA with quintile (Q)1 indicating the most deprived, Q2 the second most deprived, Q3 the third least deprived, Q4 the second least deprived and Q5 the least deprived (28).
Box 1. Ethnic group codes according to the UK Office of National Statistics.
25 OHD analysis and plasma equivalent values
The Bioanalytical facility of the University of East Anglia, Norwich, UK, performed the analysis of 25OHD3 and 25OHD2 levels of the DBS cards by using quantitative liquid chromatography tandem mass spectrometry followed by extraction methods as previously described (29, 30).
Using a DBS card puncher (Analytical Sales & Services, NJ, USA) an individual 6mm part of each DBS card was collected and then further processed by extracting samples using 300µL of 50:50 (v/v) isopropanol to water solution containing carbon-13 labelled 25OHD3-13C5 internal standard. This was kept in an ultrasonic water bath at 35°C for 30 minutes. A supported Liquid Extraction plate (Biotage, Uppsala, Sweden) was used as medium for further purification of the extracts followed by elution with 1.5mL of heptane. Subsequent processing included drying, derivatization and detection using Micromass Quattro Ultima Pt tandem mass spectrometer (Waters Corp., Milford, MA, USA) as detailed previously (25).
Quality controls prepared in vitamin D and its hydroxylated metabolite-free packed red cells as well as a matrix-matched calibration standard was used for analysis of the samples.
As reported previously (25) across the concentration range of the assay there was an inter/intra-assay coefficient of variation between 3.9-9.4% and linearity from lower limit of quantification of 1 nmol/l to 150 nmol/l.
Equivalent total plasma 25OHD was derived using the following calculation (25):
As 25OHD is mainly present in the extracellular fluid compartment adjustment for haematocrit was included. Owing to the higher Hct in neonates (31) and capillary blood samples (32) a factor of 0.60 was used.
Ethics and consent
The UK Health Research Authority, the East Midlands – Leicester South Research Ethics Committee (REC Reference 19/EM/0019) and the Antenatal and Newborn Research Advisory Committee of Public Health England, UK approved the study. In accordance with the code of practice for retention, storage and use of residual NBS, parental consent was not needed (33).
Statistical analysis
For descriptive statistics, median with interquartile ranges (IQR) or mean with standard deviation (SD) was used for continuous variables and frequencies with percentages were used for categorical variables. 25OHD levels were used as both continuous and categorical variable. Vitamin D deficiency was defined as 25OHD concentrations<30 nmol/L (12 µg/l), insufficiency as 30-50 nmol/L (12-20 µg/l) and sufficiency as >50 nmol/L (>20 µg/l) in line with the Institute Of Medicine (34) and Global Consensus Recommendations (35). Deprivation quintiles (1–5) were used as categorical variables.
As 25OHD levels were not normally distributed, non-parametric tests were used. After root transformation a normal 25OHD distribution was attained. Because results on parametric tests were very similar, these are not reported here.
Kruskal-Wallis test was used to compare 25OHD concentrations between deprivation quintiles with further pair-wise analysis to ascertain differences between groups. Stepwise linear regression was used to assess the effect of each of the seven components of deprivation on total 25OHD levels. Additional independent variables (season of birth, ethnicity, gestational age, maternal age) which were significant on bivariate analysis were also entered in the regression analysis to ascertain the effect of deprivation on total 25OHD in the full model. SPSS statistical software v28.0 (IBM, Armonk, NY) was used for all analyses.
Results
General demographics
2999 samples (1499 winter-born, 1500 summer-born) were included in 25OHD analysis of whom 1580 were male. The age of the newborn at sample collection ranged between 5 and 19 days, but 99% of the samples were collected within the first 7 days of life.
More than half of the newborns were white British (59.1%), had a mean birth weight of 3306 (± 565) grams and were born at term at 38.3 (± 1.8) weeks of gestation. The descriptive characteristics of the study cohort, as previously published (25), are shown in Table 1.
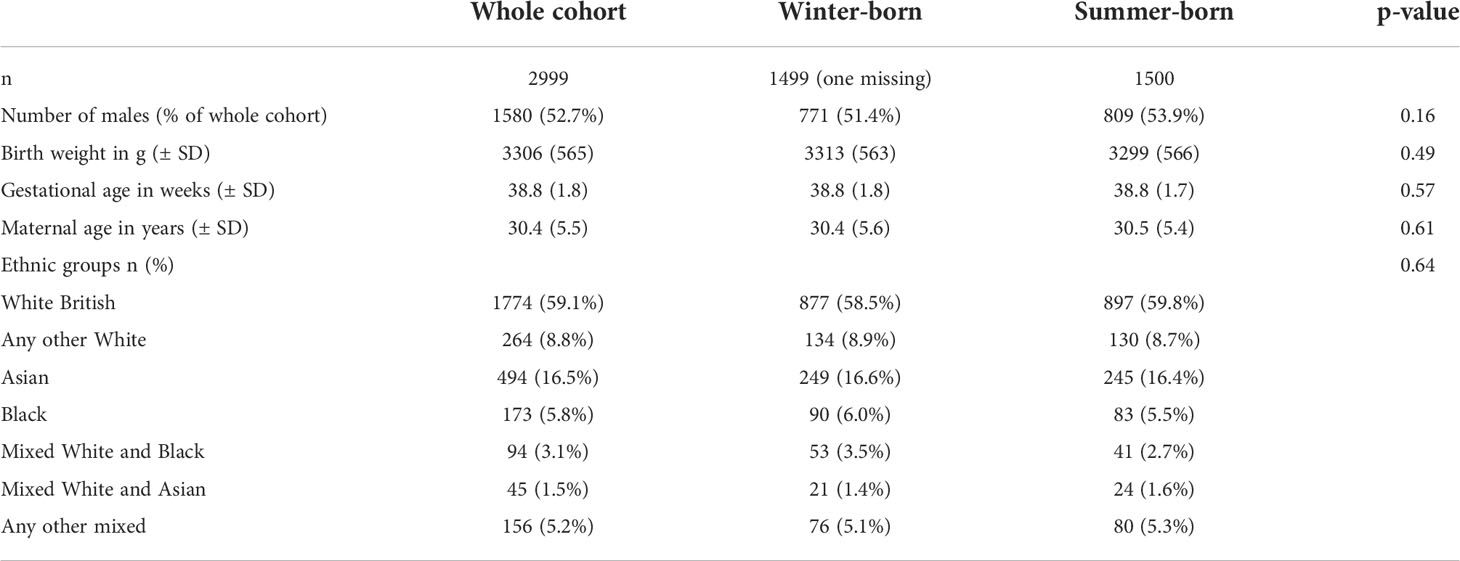
Table 1 Baseline characteristics of the study cohort with subanalysis of winter-borns and summer-borns.
Season, ethnicity and 25OHD levels
These results have been published in detail (25) but are briefly summarised below. The overall median (IQR) 25OHD level was 37.8 (24.8; 54.8) nmol/l. 25OHD deficiency was noted in 35.7% (n=1070), insufficiency in 33.7% (n=1010) and sufficiency in 30.6% (n=919) of the DBS cards. The summer-born cohort had significantly higher 25OHD concentration [49.2 (34.3; 64.8) nmol/l] compared to the winter-born cohort [29.1 (19.8; 40.6) nmol/l, p<0.001]. The median (IQR) 25OHD level was significantly higher in newborns of White British descent [41.6 (27.6; 59.3) nmol/L], compared to all other groups, with the lowest 25 OHD levels in the newborns of Black ethnic background [30.3 (19.4; 43.2) nmol/L, p<0.001].
25OHD and deprivation
The variation in 25OHD levels between the IMD quintiles was statistically significant in the whole cohort (p<0.001, Figure 1 and Table 2) and in the summer-born cohort (p<0.001) but not in the winter-born cohort (p=0.26). A pairwise comparison demonstrated significant differences (p<0.05) in 25OHD levels between specific IMD quintiles in the whole (Figure 2A) and summer-born (Figure 2B) cohort but not in the winter-born cohort.
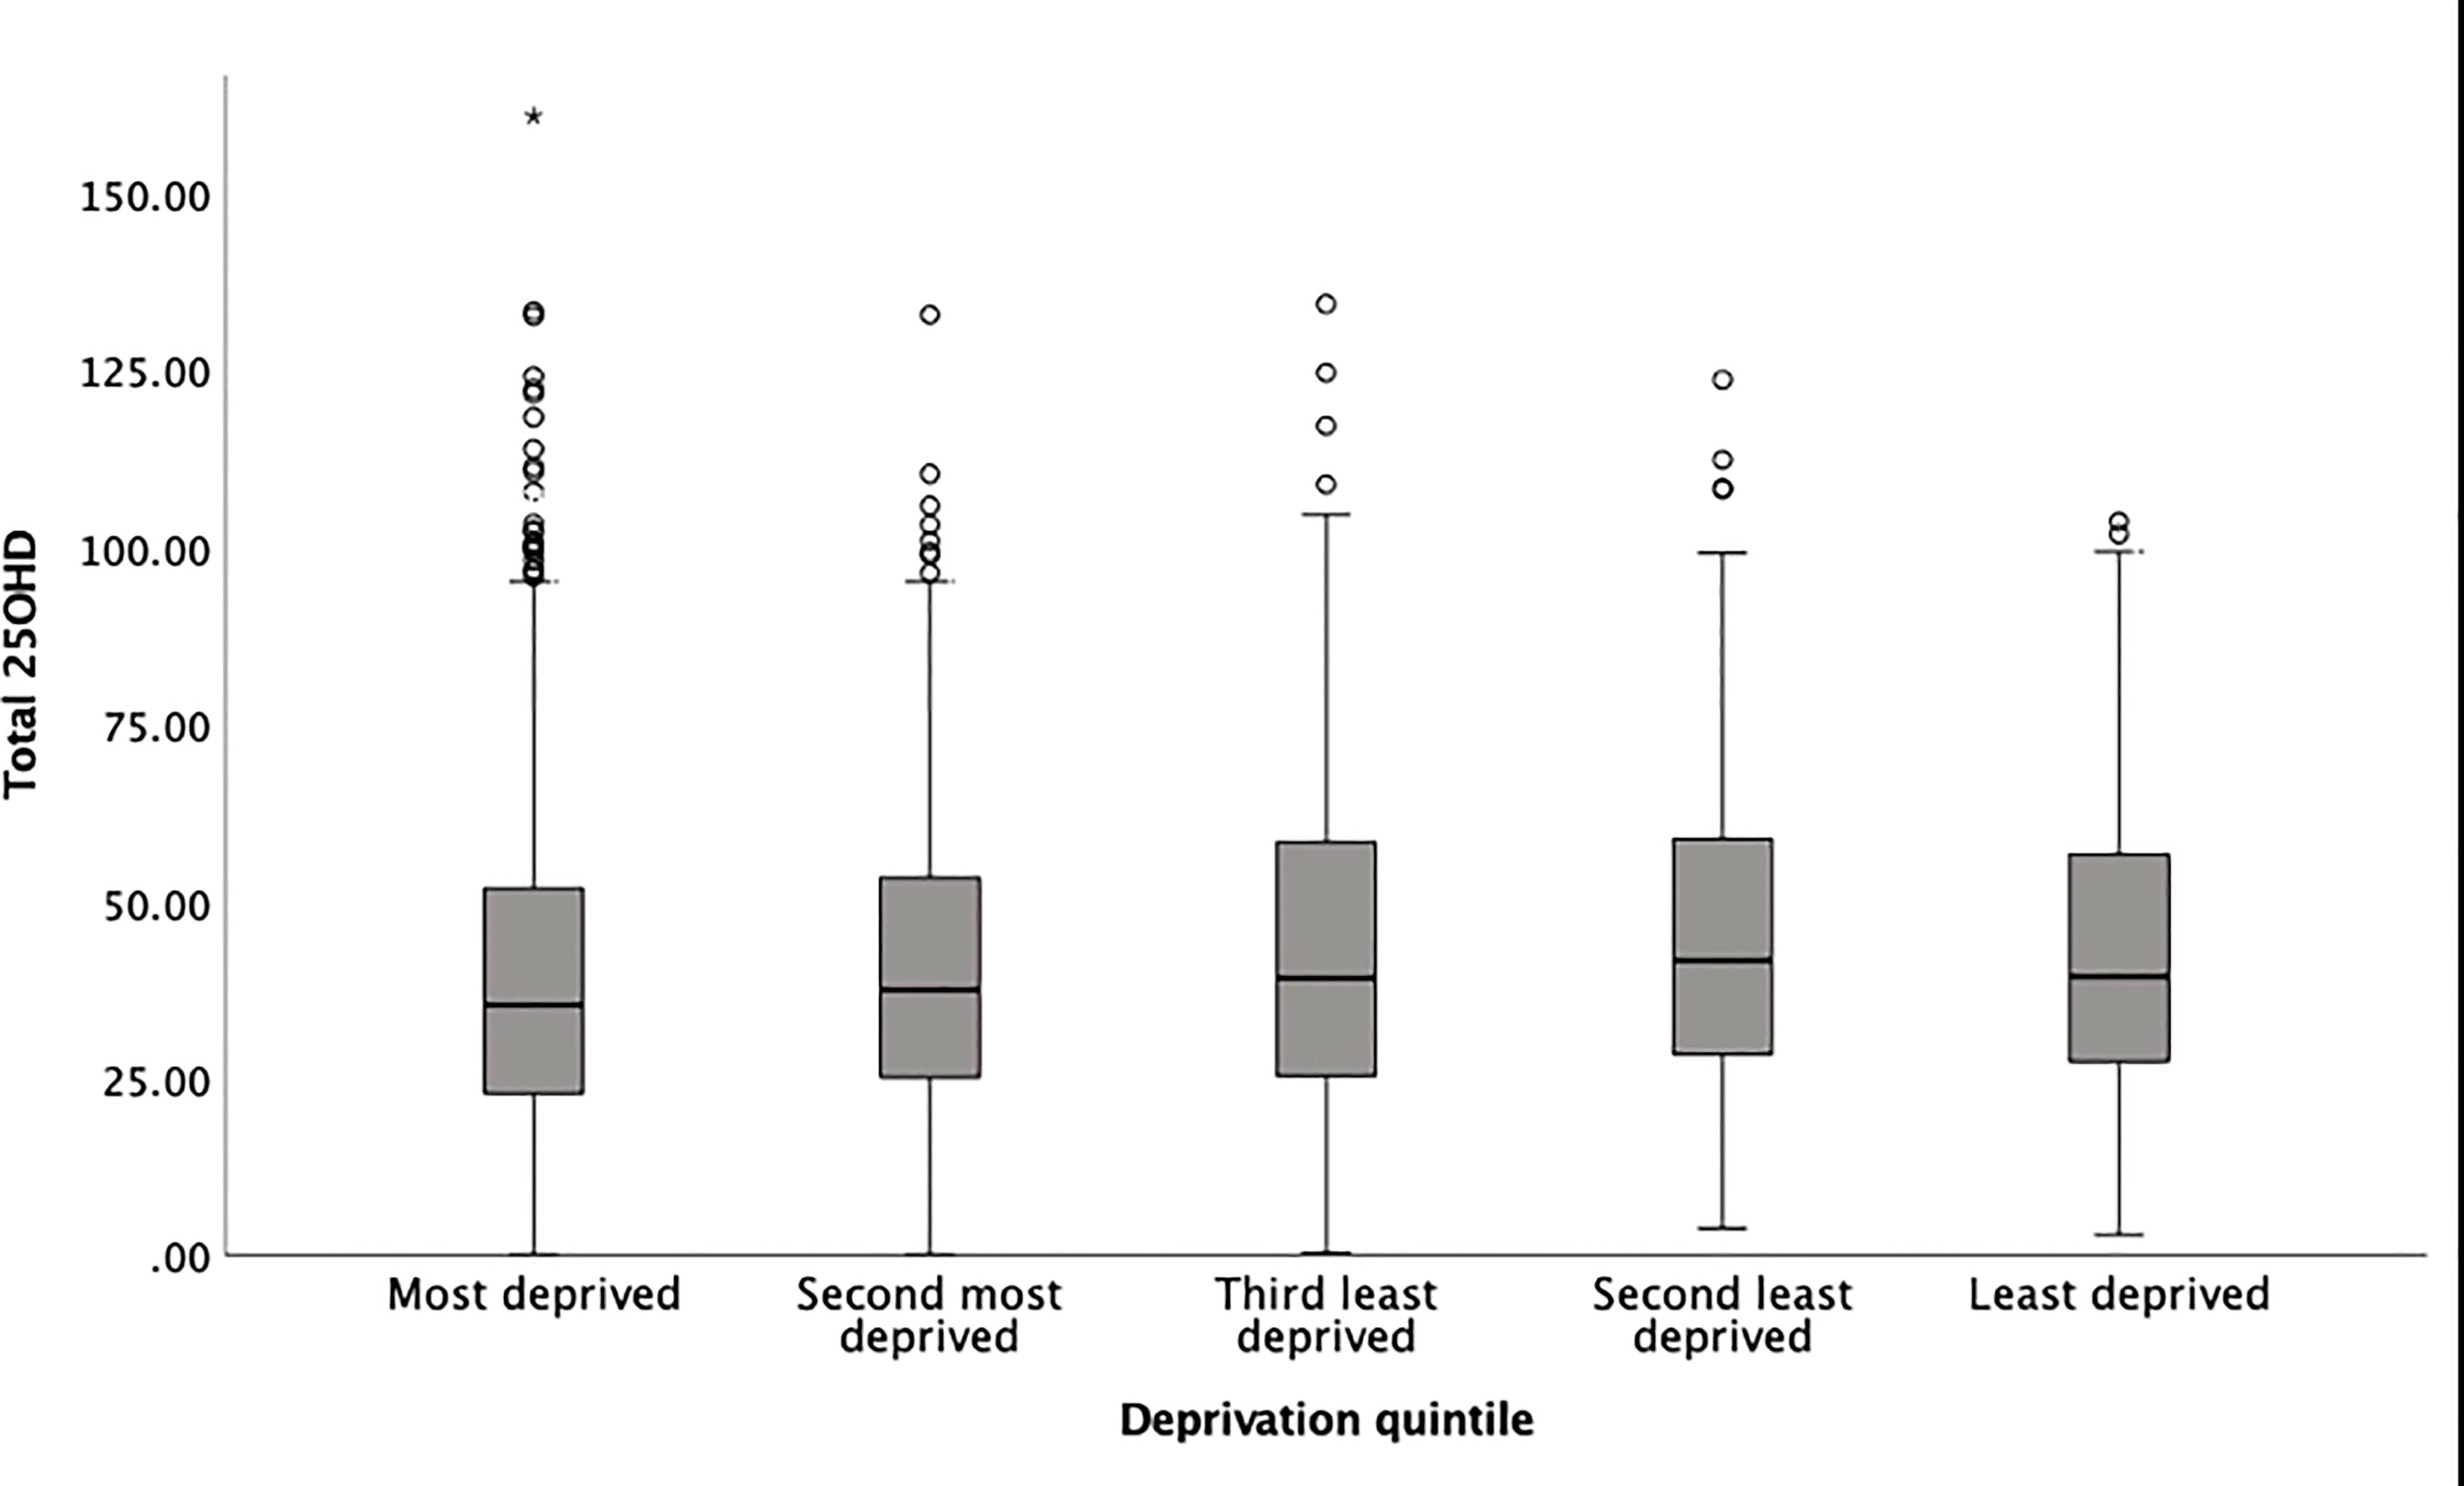
Figure 1 Box plot of newborn 25OHD concentrations from DBS cards and quintiles of IMD (total study cohort). * is an outlier.
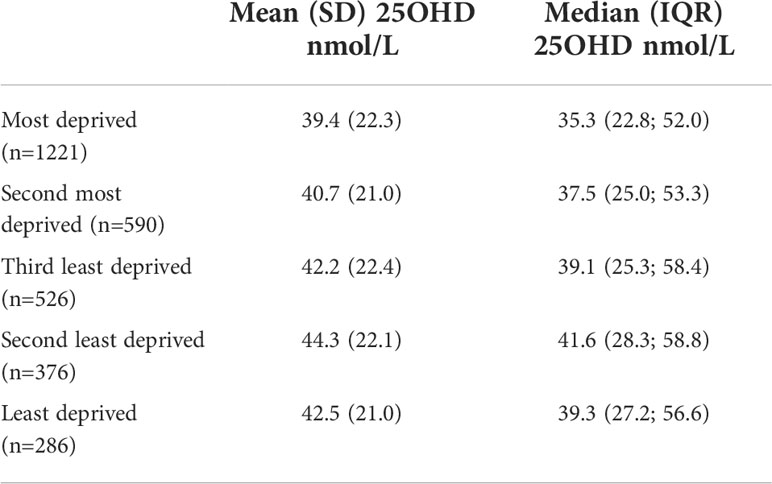
Table 2 Newborn 25OHD concentrations grouped in IMD quintiles.
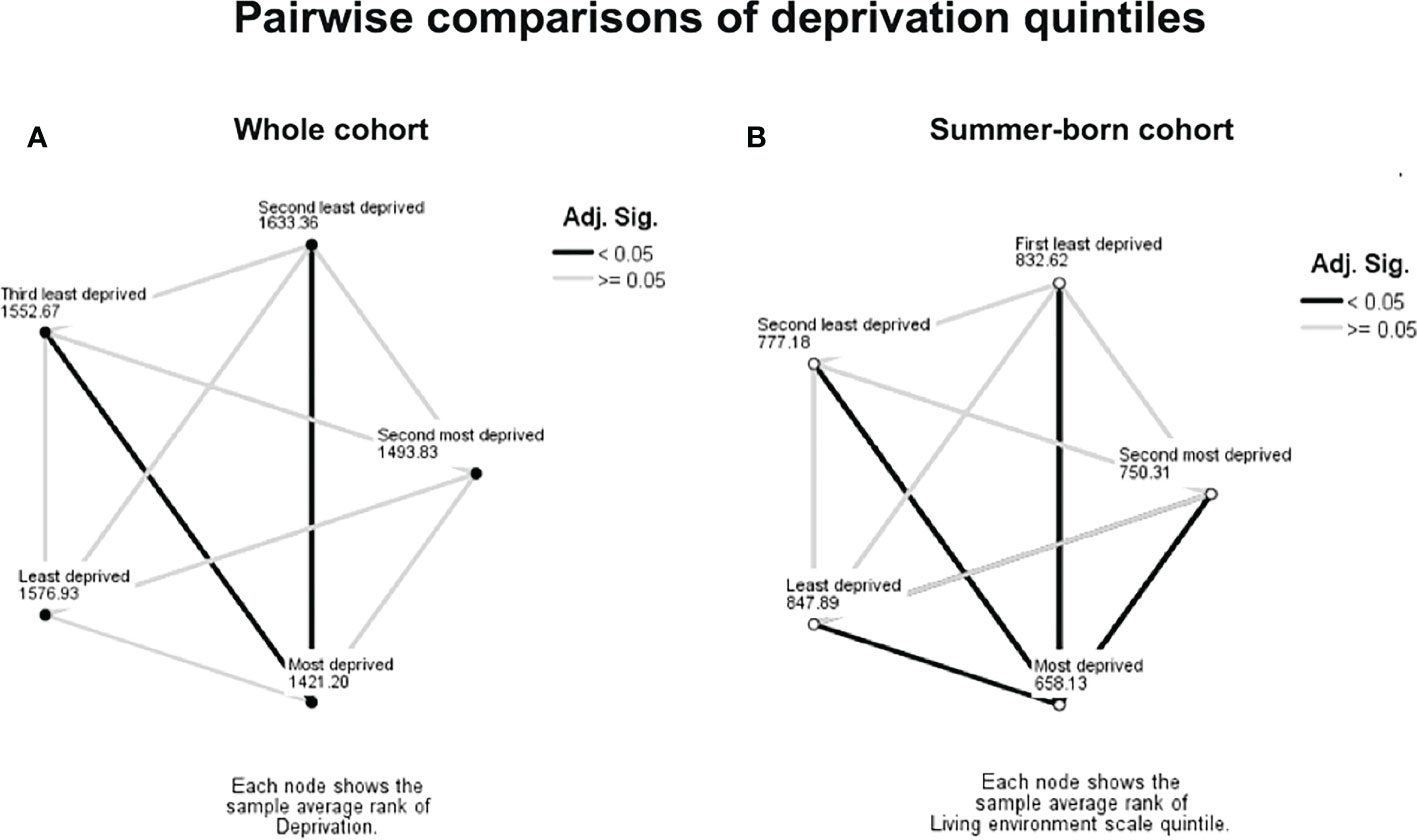
Figure 2 Pairwise comparison between socioeconomic groups, whole (A) and summer-born cohort (B). Numbers represent IMD average ranks, dark lines represent significant difference (p<0.05).
Living environment was identified as the most significant domain of deprivation influencing 25OHD levels (β=0.07; p=0.002) among the seven independent domains of deprivation (Table 3). 25OHD levels varied significantly between different living environment quintiles in the whole (p<0.001) and summer-born cohort (p<0.001, Figure 3A) but not in the winter-born cohort (p=0.16, Figure 3B). A pairwise comparison demonstrated significant (p<0.05) differences in 25OHD levels between the different living environment quintiles in the whole (Figure 4A) and summer-born (Figure 4B) cohort but not in the winter-born cohort. In a multivariable regression model (Table 4), season of birth, ethnicity, maternal age, gestation of birth and living environment deprivation quintile were statistically significant factors affecting 25OHD levels. Season of birth, ethnicity and gestational age explained the greatest part (23.1%) of the variation in 25OHD level, whilst maternal age and living environment quintile each explained only another 0.1% of the variation
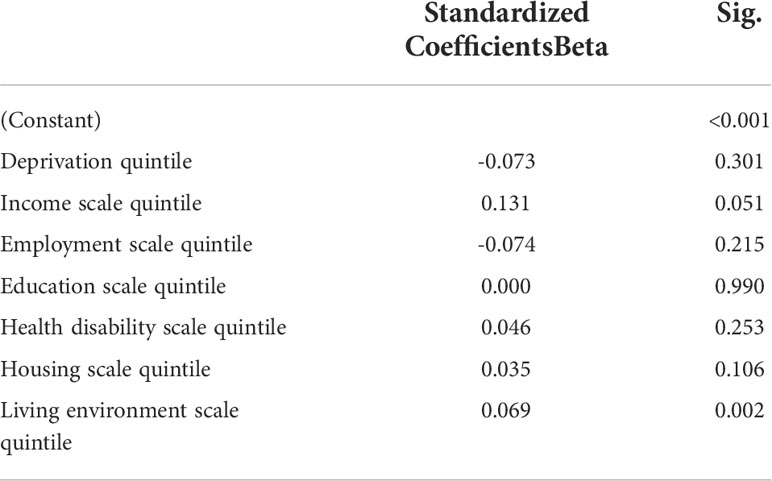
Table 3 Different domains of IMD and their effect on 25OHD in the whole cohort.
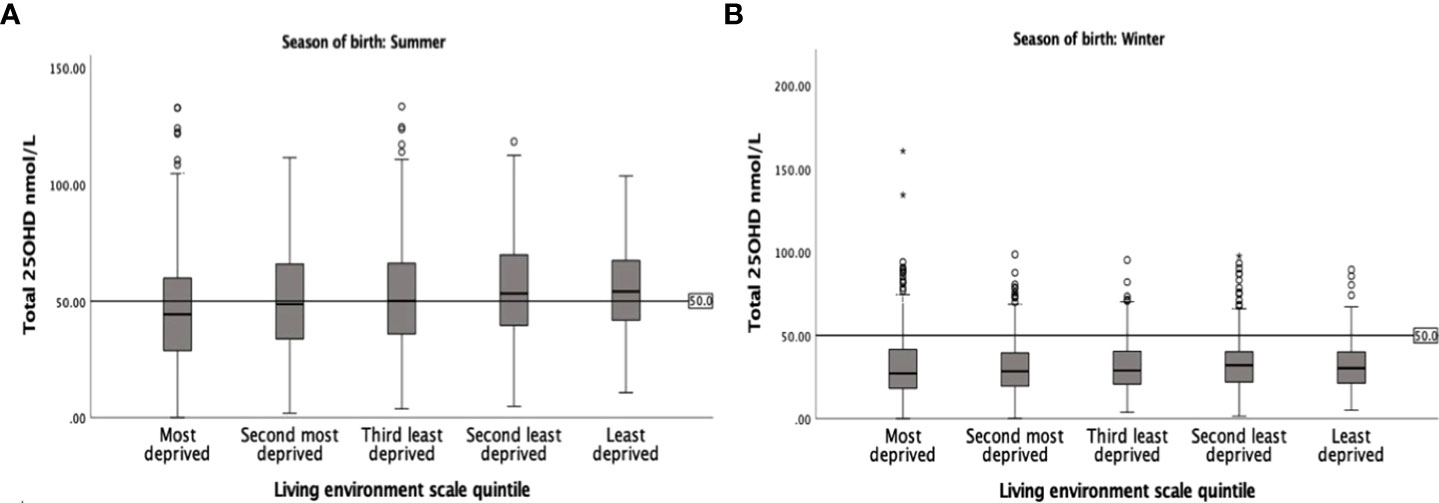
Figure 3 Box plot of 25OHD levels in the summer-born (A) and the winter-born (B) cohort of the different living environment quintiles. Note the variation in 25OHD levels by the different living environment quintiles in the summer-born and the persistently low 25OHD levels in the winter-born cohort.
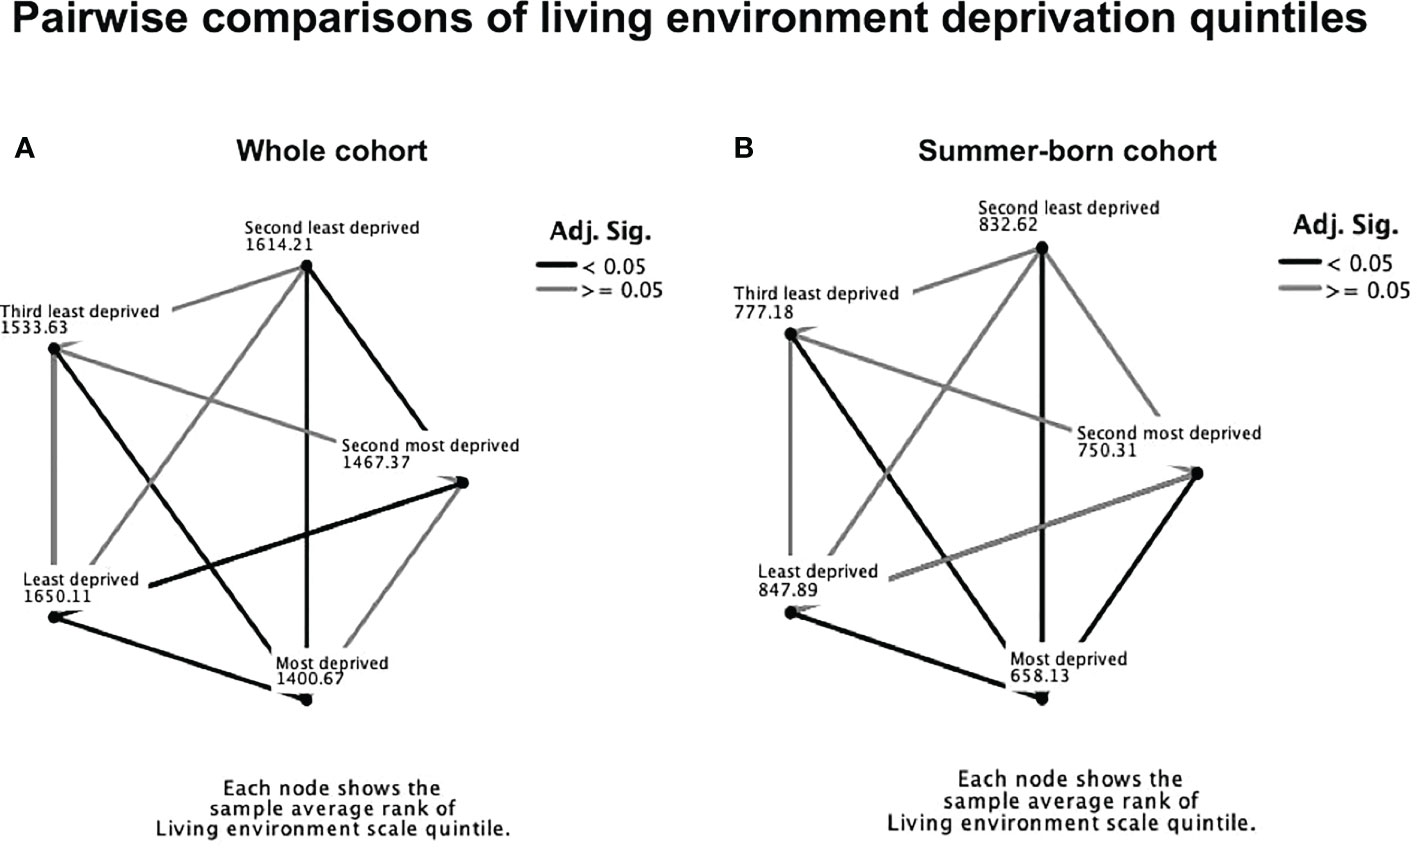
Figure 4 Pairwise comparison of living environment quintiles in the whole cohort (A) and in the summer-born cohort (B). Numbers represent IMD average ranks, dark lines represent significant differences (p<0.05).
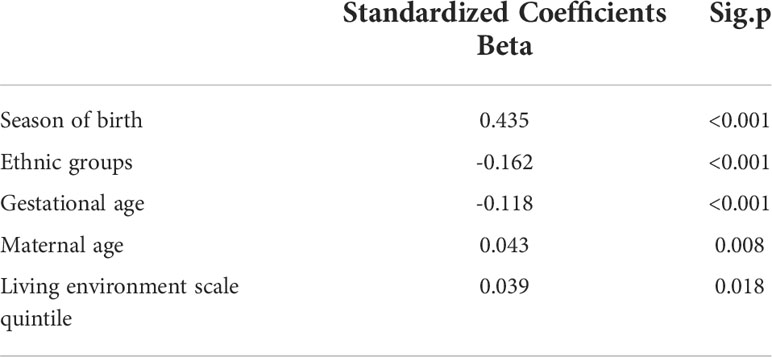
Table 4 Multivariable analysis (dependent variable 25OHD) with different models indicating living environment as a significant factor affecting 25OHD levels.
Ethncitiy and deprivation
The median deprivation quintile in all ethnic groups, except mixed White and Asian, was significantly lower when compared to the White ethnic group (Figure 5).
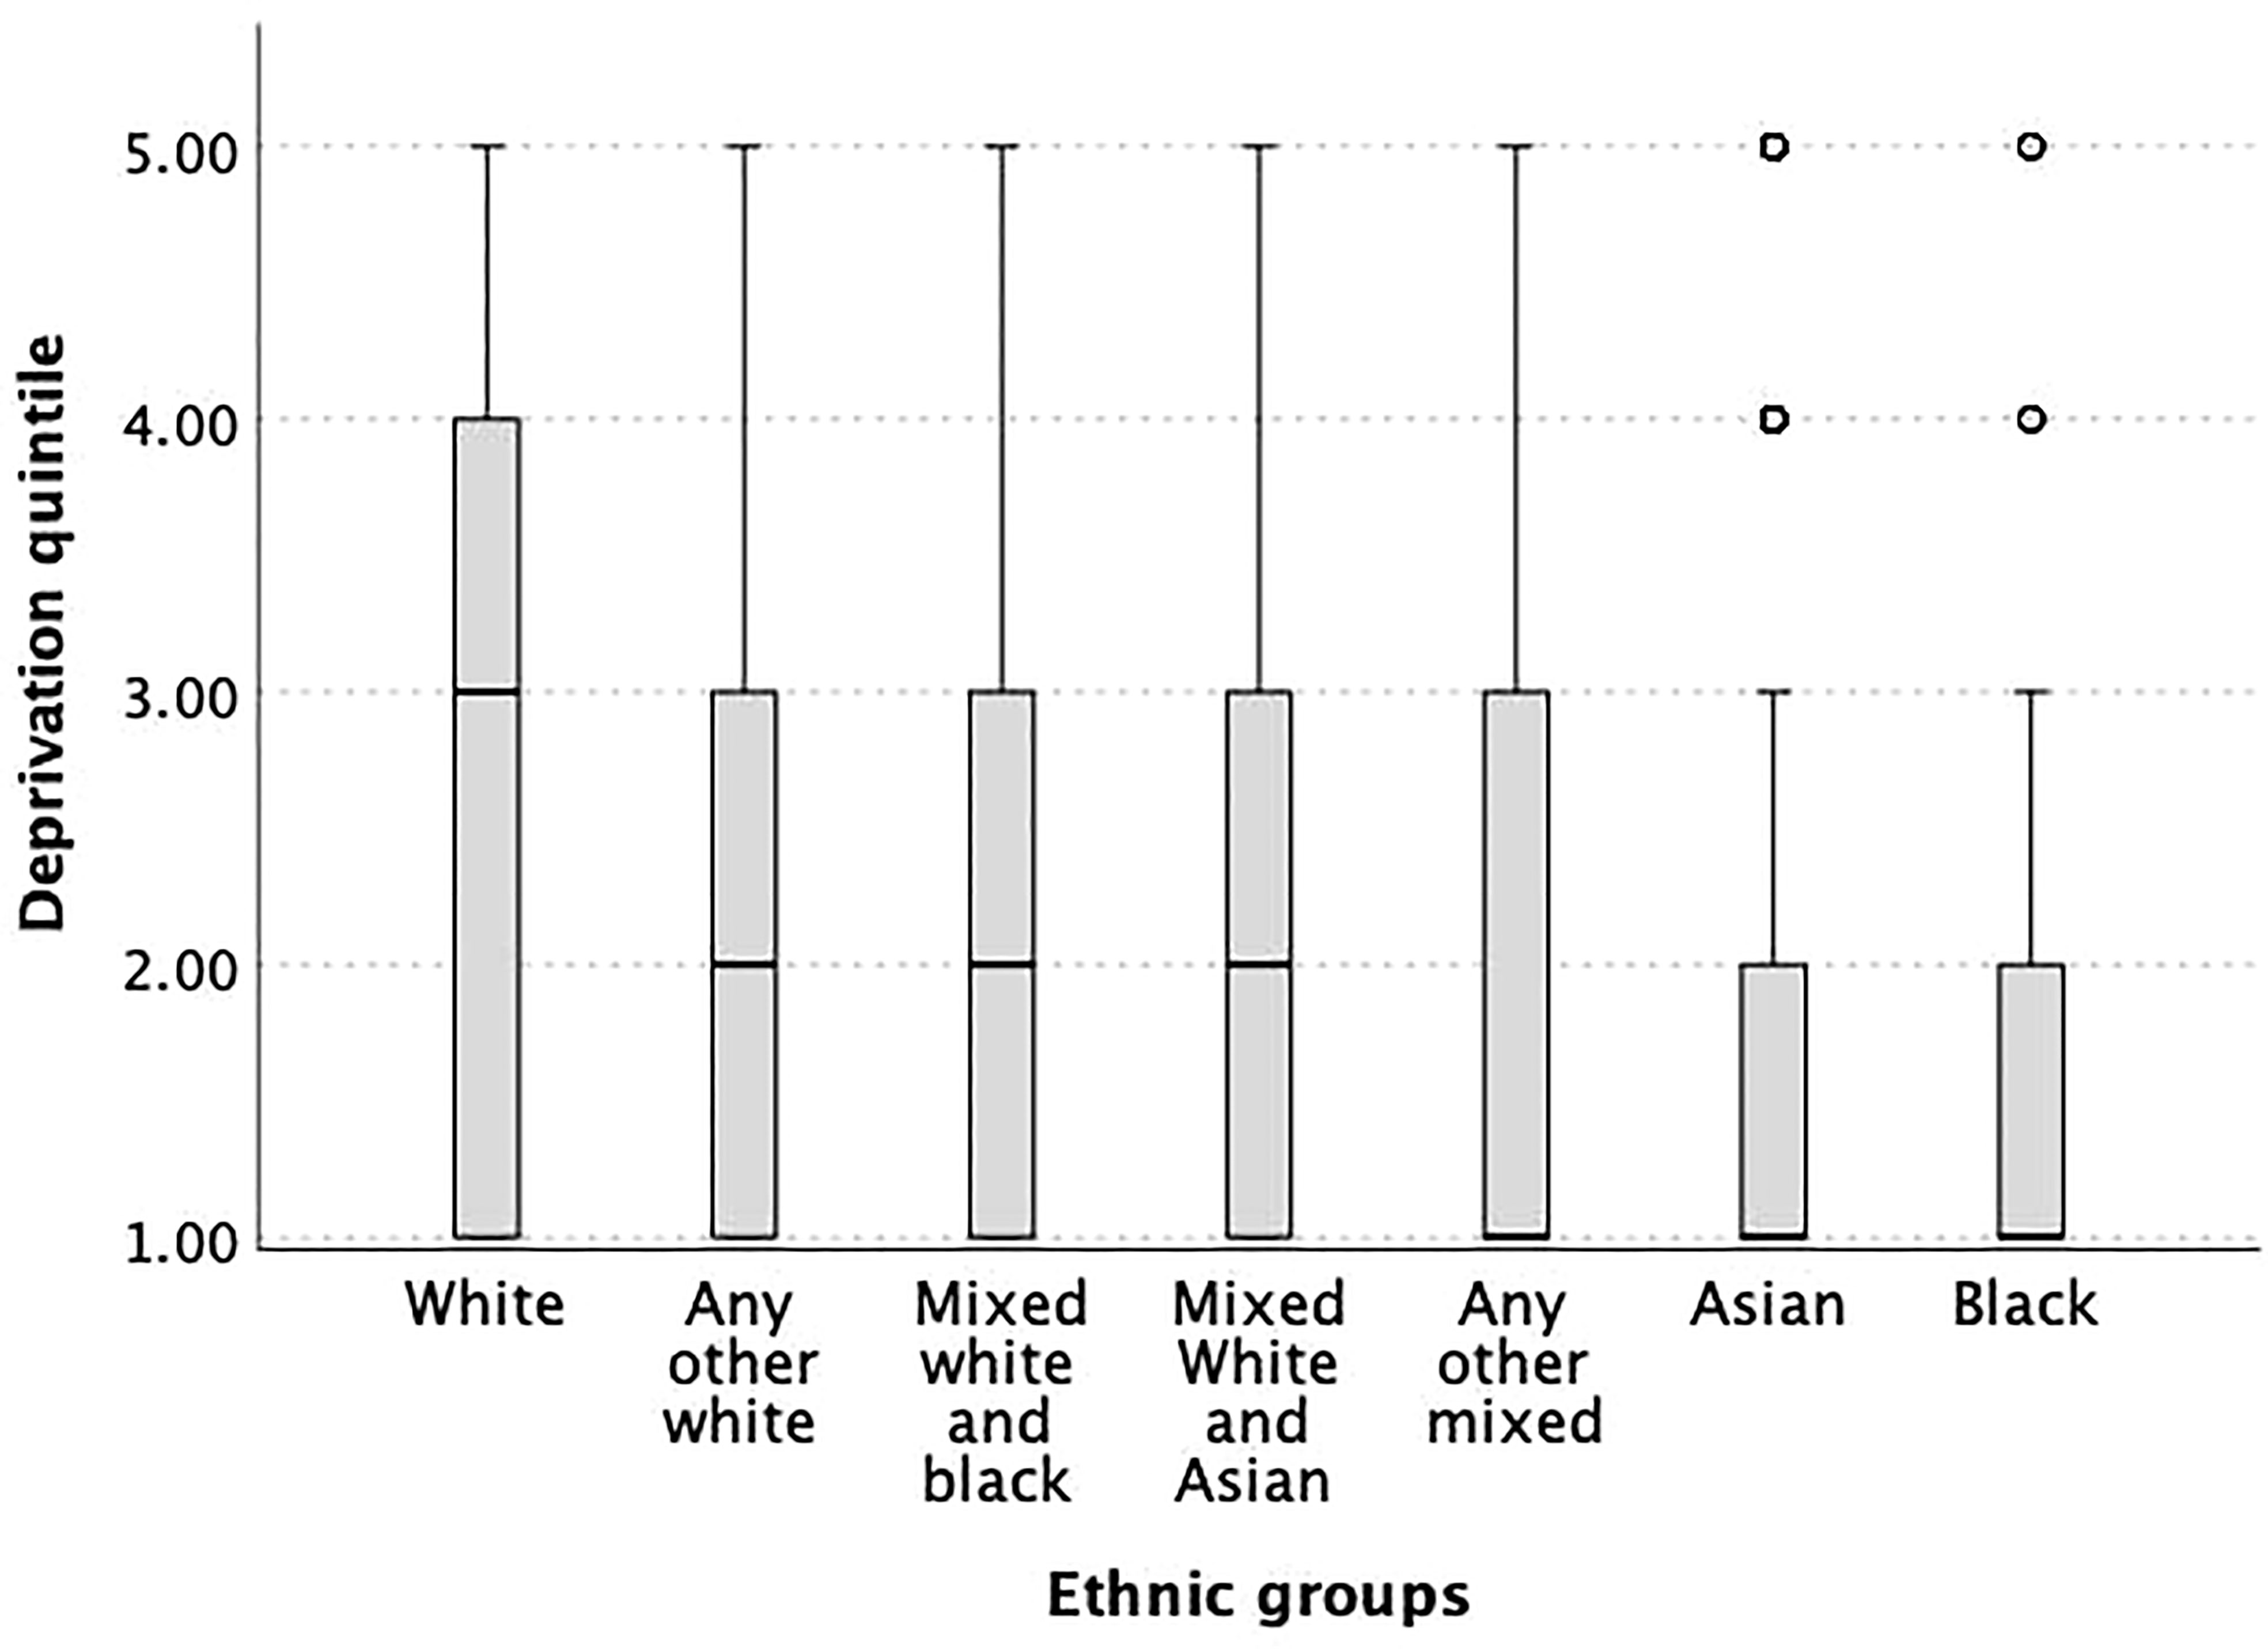
Figure 5 Box plot of the different ethnicities and associated deprivation quintiles indicating strong differences of SES in the different ethnic groups. All ethnicities, except for the mixed White and Asian, had significantly lower newborn 25OHD levels than White ethnicity (p<0.05).
Discussion
In this multi-ethnic large newborn cohort, only 30% of the newborns had sufficient 25-hydroxyvitamin D levels, with highest levels in newborns of White ethnic background and those born in summer. IMD, which was lowest in babies of Black, Asian and any other mixed ethnic origin, was significantly associated with lower 25OHD levels. We demonstrate that better living environment positively influences 25OHD levels in summer-born babies but the winter-born had consistently low 25OHD levels confirming the substantial effect of season on vitamin D status. Despite the strong effect of season and ethnicity on 25OHD levels, living environment still remained significant in a multivariable regression.
We found that the IMD influences the vitamin D status in the overall and summer-born cohort, but not in the winter-born cohort. Of the seven different domains of deprivation, living environment was the strongest predictor of a newborn’s 25OHD level primarily affecting the summer-born cohort, indicating that indoor living and sun exposure play a substantial role during pregnancy. The observation that living environment is a strong predictor of an individual’s vitamin D status has been reported in previous studies (36, 37). Living environment has been shown to be a statistically significant predictor of vitamin D status even after adjusting for ethnicity and season (37), an association which was reproduced in our study. Assessment of living environment includes indoor aspects, such as housing in poor conditions or failing to meet decent homes standard, and outdoor aspects like air quality (38). Attractive neighbourhood environment is associated with increased leisure time and physical activity (39). Reduced physical activity or unattractive leisure time facilities are associated with reduced time spent outdoors and thus reduced UVB exposure (40). The effect of living environment, in our cohort, was reduced in the winter months since the necessary UVB spectrum for cutaneous vitamin D production is missing from UK sunlight between October and March. Vitamin D winter therefore affects newborns of all living environment quintiles (41). However, we do not have the data to confirm different UVB exposure in the cohorts from different deprivation quintiles.
The relationship of UVB exposure and SES is quite difficult to assess. Several factors have to be addressed when evaluating outdoor activity and therefore UVB exposure, for example occupation, residency, leisure time activities or transport physical activity like cycling or walking to work. Greater leisure time outdoor physical activity has been associated with higher SES in rural, suburban and urban residents (42, 43). However, occupational physical activity and thus time spent outdoors may affect all SES groups (44).
Maternal factors associated with neonatal vitamin D deficiency other than SES have been previously investigated in studies utilising DBS and have demonstrated a correlation with ethnicity, sunlight exposure prior to delivery (45), ambient temperatures or sunshine hours (46).
In the UK, the relation of SES and ethnicity is evidenced by the fact that people of white ethnic origin are more likely to live in the least deprived areas than people from other ethnic groups (47). Previous studies from Birmingham reported a significant positive correlation between the percentage of non-white population and socioeconomic deprivation, but no correlation between median 25OHD concentration and IMD after multivariate analysis (16). This finding supports the notion that ethnicity is a stronger predictor of vitamin D status compared to IMD. In our cohort living environment continued to be statistically significant in regression model including season of birth and ethnicity, but to a lesser extent than the two latter ones. We examined the link between ethnicity and IMD and found that people of white ethnic background had significantly higher IMD when compared to all other ethnic groups except the mixed White and Asian group.
Our study’s strengths include the large sample size and no missing data for the studied parameters. Limitations of this study are the missing information on supplement use and data on sunlight exposure. Maternal vitamin D supplementation (48) and sunlight exposure (49, 50) are associated with higher 25OHD levels in the newborn (18). The association between low SES and vitamin D supplement use is not well studied, indeed data are sparse. A survey in Ireland demonstrated no difference in vitamin D supplementation adherence between women of higher education and higher family income to those of poor education or lower family income (51). However general data on supplement use and SES indicates, that higher SES is associated with higher adherence to supplement use (52–54). Another limitation is that the IMD was used as a proxy for postcode which is less accurate, but acceptable for larger scale studies like ours. The IMD is not an absolute but rather a relative measurement, so care has to be taken when comparing the data over time or with other areas. Measurements of 25OHD in DBS provide a reliable and accurate reflection of serum 25OHD, when appropriately adjusted and storage time does not affect 25OHD concentrations (55, 56).
The public health challenge is to overcome social disparities and provide every newborn/infant as well as their mothers with sufficient vitamin D. One way is to implement vitamin D supplementation in all pregnant women and infants. Adequate 25OHD levels in pregnant women are a key factor for neonatal vitamin D stores and supplementation of pregnant women can improve the newborn’s vitamin D level effectively (48, 57–59). Most European countries have policies regarding vitamin D supplementation of infants and pregnant women, but these differ substantially (60).
Another way of addressing widespread vitamin D deficiency is food fortification, which is an elegant, cheap universal way and independent of issues related to supplementation (logistics, adherence, costs) (61, 62). Data from Finland are a prime example of how food fortification could improve 25OHD levels (40, 63). The Finish National Nutrition Council introduced a voluntary food fortification programme and achieved a substantial rise in 25OHD levels over time by fortifying milk and fat spreads and by an increase in supplement users (11% in 2000 to 41% in 2011). This intervention reduced the prevalence of vitamin D insufficiency or deficiency independent of season by increasing 25OHD levels by approximately 20nmol/L (63). USA and Canada also, but to a lesser extent, fortify food (mainly milk) with vitamin D and have achieved an improvement in population vitamin D status (64, 65). A similar approach in vitamin D fortification should follow, especially in high latitude countries. Models for successful food fortification programmes are available and an easy and cost effective way to prevent complications associated with vitamin D deficiency (66).
Conclusions
The extent of neonatal vitamin D deficiency in the UK is worrying, since vitamin D deficiency is easy to avoid when complications are serious and potentially fatal. Knowledge about risk factors is key for prevention. SES, particularly living environment, is a risk factor, but to a lesser extent than season and ethnicity. Seasonal variation in UVB radiation and therefore endogenous 25OHD production seems to minimize the effect of living environment on 25OHD levels, since winter-born newborns had persistently low 25OHD concentrations regardless of their living environment. A holistic intervention to reach every newborn, irrespective of their SES, ethnicity or seasonal variation in UVB availability, is needed and food fortification would be an easy approach to overcome these issues. Concurrently, supplementation for infants and other high risk groups such as pregnant women should be monitored and regulated by the health care system, since these high risk groups would not benefit from fortification alone.
Data availability statement
The original contributions presented in the study are included in the article/supplementary material. Further inquiries can be directed to the corresponding author.
Ethics statement
The studies involving human participants were reviewed and approved by UK Health Research Authority, East Midlands – Leicester South Research Ethics Committee, UK, Antenatal and Newborn Research Advisory Committee of Public Health England, UK. Written informed consent from the participants’ legal guardian/next of kin was not required to participate in this study in accordance with the national legislation and the institutional requirements.
Author contributions
SU: Funding acquisition, methodology, supervision, data curation, formal analysis, visualization and original draft writing. WF and JT: Investigation, sample analysis, data curation, resources and review and editing of manuscript. WH: Conceptualization, funding acquisition, methodology, supervision, visualization and intellectual editing of manuscript. KT: original draft writing, manuscript preparation and final revisions. All authors contributed to the article and approved the submitted version.
Funding
SU was funded by a Global challenges research scholarship by the University of Birmingham, Birmingham, UK. SU and WH received additional funding for consumables from Internis pharmaceuticals limited, c/o Thornton and Ross ltd. The funders have not had any input into the design, conduct and reporting of the study. Submission was funded by Kepler University Hospital GmbH, Linz, Austria.
Acknowledgments
We would like to thank Sunia Naseem and Jamie Large, medical students for help with sample collection. We are grateful to Russell Denmeade for supervision of sample collection and data anonymisation. We gratefully acknowledge the support of Mary Anne Preece, the director of newborn screening and Philippa Goddard, the newborn screening consultant clinical scientist.
Conflict of interest
SU, WH and WF have previously received speaker’s fee from Internis pharmaceuticals limited, c/o Thornton and Ross ltd.
The remaining authors declare that the research was conducted in the absence of any commercial or financial relationships that could be constructed as a potential conflict of interest.
Publisher’s note
All claims expressed in this article are solely those of the authors and do not necessarily represent those of their affiliated organizations, or those of the publisher, the editors and the reviewers. Any product that may be evaluated in this article, or claim that may be made by its manufacturer, is not guaranteed or endorsed by the publisher.
References
1. Novakovic B, Galati JC, Chen A, Morley R, Craig JM, Saffery R. Maternal vitamin d predominates over genetic factors in determining neonatal circulating vitamin d concentrations. Am J Clin Nutr (2012) 96(1):188–95. doi: 10.3945/ajcn.112.035683
2. Javaid MK, Crozier SR, Harvey NC, Gale CR, Dennison EM, Boucher BJ, et al. Maternal vitamin d status during pregnancy and childhood bone mass at age 9 years: a longitudinal study. Lancet (2006) 367(9504):36–43. doi: 10.1016/S0140-6736(06)67922-1
3. Thiele DK, Ralph J, El-Masri M, Anderson CM. Vitamin D3 supplementation during pregnancy and lactation improves vitamin d status of the mother-infant dyad. J Obstet Gynecol Neonatal Nurs. (2017) 46(1):135–47. doi: 10.1016/j.jogn.2016.02.016
4. Sachan A, Gupta R, Das V, Agarwal A, Awasthi PK, Bhatia V. High prevalence of vitamin d deficiency among pregnant women and their newborns in northern India. Am J Clin Nutr (2005) 81(5):1060–4. doi: 10.1093/ajcn/81.5.1060
5. Wagner CL, Taylor SN, Dawodu A, Johnson DD, Hollis BW. Vitamin d and its role during pregnancy in attaining optimal health of mother and fetus. Nutrients (2012) 4(3):208–30. doi: 10.3390/nu4030208
6. við Streym S, Højskov CS, Møller UK, Heickendorff L, Vestergaard P, Mosekilde L, et al. Vitamin d content in human breast milk: a 9-mo follow-up study. Am J Clin Nutr (2016) 103(1):107–14. doi: 10.3945/ajcn.115.115105
7. Hatun S, Ozkan B, Orbak Z, Doneray H, Cizmecioglu F, Toprak D, et al. Vitamin d deficiency in early infancy. J Nutr (2005) 135(2):279–82. doi: 10.1093/jn/135.2.279
8. Uday S, Fratzl-Zelman N, Roschger P, Klaushofer K, Chikermane A, Saraff V, et al. Cardiac, bone and growth plate manifestations in hypocalcemic infants: revealing the hidden body of the vitamin d deficiency iceberg. BMC Pediatr (2018) 18(1):183. doi: 10.1186/s12887-018-1159-y
9. Maiya S, Sullivan I, Allgrove J, Yates R, Malone M, Brain C, et al. Hypocalcaemia and vitamin d deficiency: an important, but preventable, cause of life-threatening infant heart failure. Heart (2008) 94(5):581–4. doi: 10.1136/hrt.2007.119792
10. Kreiter SR, Schwartz RP, Kirkman HN, Charlton PA, Calikoglu AS, Davenport ML. Nutritional rickets in African American breast-fed infants. J Pediatr (2000) 137(2):153–7. doi: 10.1067/mpd.2000.109009
12. Disparities TOfHIa. National child measurement programme, England 2020/2021 school year (2021). Available at: https://digital.nhs.uk/data-and-information/publications/statistical/national-child-measurement-programme/2020-21-school-year/deprivation.
13. Health RCoPaC. National paediatric diabetes audit (NPDA) (2022). Available at: https://www.rcpch.ac.uk/resources/npda-annual-reports#downloadBox.
14. Ncayiyana JR, Martinez L, Goddard E, Myer L, Zar HJ. Prevalence and correlates of vitamin d deficiency among young south African infants: A birth cohort study. Nutrients (2021) 13(5):1500. doi: 10.3390/nu13051500
15. Hayden KE, Sandle LN, Berry JL. Ethnicity and social deprivation contribute to vitamin d deficiency in an urban UK population. J Steroid Biochem Mol Biol (2015) 148:253–5. doi: 10.1016/j.jsbmb.2014.11.014
16. Webster C. Relationship of total 25-OH vitamin d concentrations to indices of multiple deprivation: Geoanalysis of laboratory results. Ann Clin Biochem (2013) 50(Pt 1):31–8. doi: 10.1258/acb.2012.011249
17. Halicioglu O, Aksit S, Koc F, Akman SA, Albudak E, Yaprak I, et al. Vitamin d deficiency in pregnant women and their neonates in spring time in western Turkey. Paediatr Perinat Epidemiol. (2012) 26(1):53–60. doi: 10.1111/j.1365-3016.2011.01238.x
18. Wang C, Gao J, Liu N, Yu S, Qiu L, Wang D. Maternal factors associated with neonatal vitamin d deficiency. J Pediatr Endocrinol Metab (2019) 32(2):167–72. doi: 10.1515/jpem-2018-0422
19. Sutherland JP, Zhou A, Leach MJ, Hyppönen E. Differences and determinants of vitamin d deficiency among UK biobank participants: A cross-ethnic and socioeconomic study. Clin Nutr (2021) 40(5):3436–47. doi: 10.1016/j.clnu.2020.11.019
20. Lin S, Jiang L, Zhang Y, Chai J, Li J, Song X, et al. Socioeconomic status and vitamin d deficiency among women of childbearing age: A population-based, case-control study in rural northern China. BMJ Open (2021) 11(3):e042227. doi: 10.1136/bmjopen-2020-042227
21. Hirani V, Mosdøl A, Mishra G. Predictors of 25-hydroxyvitamin d status among adults in two British national surveys. Br J Nutr (2009) 101(5):760–4. doi: 10.1017/S0007114508023416
22. Ginde AA, Sullivan AF, Mansbach JM, Camargo CA. Vitamin d insufficiency in pregnant and nonpregnant women of childbearing age in the united states. Am J Obstet Gynecol. (2010) 202(5):436.e1–8. doi: 10.1016/j.ajog.2009.11.036
23. Andiran N, Yordam N, Ozön A. Risk factors for vitamin d deficiency in breast-fed newborns and their mothers. Nutrition (2002) 18(1):47–50. doi: 10.1016/S0899-9007(01)00724-9
24. Czech-Kowalska J, Gruszfeld D, Jaworski M, Bulsiewicz D, Latka-Grot J, Pleskaczynska A, et al. Determinants of postpartum vitamin d status in the Caucasian mother-offspring pairs at a latitude of 52°N: A cross-sectional study. Ann Nutr Metab (2015) 67(1):33–41. doi: 10.1159/000437099
25. Uday S, Naseem S, Large J, Denmeade R, Goddard P, Preece MA, et al. Failure of national antenatal vitamin d supplementation programme puts dark skinned infants at highest risk: A newborn bloodspot screening study. Clin Nutr (2021) 40(5):3542–51. doi: 10.1016/j.clnu.2020.12.008
26. Statistics OoN. Ethnic group, national identity and religion (2016). Available at: https://webarchive.nationalarchives.gov.uk/20160106185816/http://www.ons.gov.uk/ons/guide-method/measuring-equality/equality/ethnic-nat-identity-religion/ethnic-group/index.html#2.
27. Government MoHCL. National statistics English indices of deprivation 2019 (2019). Available at: https://www.gov.uk/government/statistics/english-indices-of-deprivation-2019.
28. Government DfCaL. The English index of multiple deprivation (IMD) 2015 – guidance (2015). Available at: https://www.gov.uk/government/statistics/english-indices-of-deprivation-2015.
29. Ball N, Tang JCY, Fraser WD, Dutton J. Development of a quantitative LC-MS/MS analysis for measurement of circulating 25-hydroxyvitamin d using volumetric absorptive microsampling (VAMS). Mass Matters (2017):18–21.
30. Tang JCY, Nicholls H, Ball N, Piec I, Rudge J, Washbourne C, et al. Assessment of vitamin d status using MitraTM volumetric absorptive microsampling (VAMS) device. In: Annual meeting of the American society for bone and mineral research. Denver, CO, USA: Colorado Convention Center (2017).
31. Jopling J, Henry E, Wiedmeier SE, Christensen RD. Reference ranges for hematocrit and blood hemoglobin concentration during the neonatal period: Data from a multihospital health care system. Pediatrics (2009) 123(2):e333–7. doi: 10.1542/peds.2008-2654
32. Kayiran SM, Ozbek N, Turan M, Gürakan B. Significant differences between capillary and venous complete blood counts in the neonatal period. Clin Lab Haematol (2003) 25(1):9–16. doi: 10.1046/j.1365-2257.2003.00484.x
33. England PH. NHS Newborn blood spot screening programme code of practice for the retention and storage of residual newborn blood spots (2018). Available at: https://www.gov.uk/government/uploads/system/uploads/attachment_data/file/670641/Code_of_Practice_for_the_Retention_and_Storage_of_Residual_Newborn_Blood_Spots.pdf.
34. Ross AC, Manson JE, Abrams SA, Aloia JF, Brannon PM, Clinton SK, et al. The 2011 report on dietary reference intakes for calcium and vitamin d from the institute of medicine: What clinicians need to know. J Clin Endocrinol Metab (2011) 96(1):53–8. doi: 10.1210/jc.2010-2704
35. Munns CF, Shaw N, Kiely M, Specker BL, Thacher TD, Ozono K, et al. Global consensus recommendations on prevention and management of nutritional rickets. J Clin Endocrinol Metab (2016) 101(2):394–415. doi: 10.1210/jc.2015-2175
36. Cairncross CT, Stonehouse W, Conlon CA, Grant CC, McDonald B, Houghton LA, et al. Predictors of vitamin d status in new Zealand preschool children. Matern Child Nutr (2017) 13(3):e12340. doi: 10.1111/mcn.12340
37. Thacher TD, Dudenkov DV, Mara KC, Maxson JA, Wi CI, Juhn YJ. The relationship of 25-hydroxyvitamin d concentrations and individual-level socioeconomic status. J Steroid Biochem Mol Biol (2020) 197:105545. doi: 10.1016/j.jsbmb.2019.105545
38. Ministry of Housing CaLG. The English indices of deprivation 2019, technical report (2019). Available at: https://assets.publishing.service.gov.uk/government/uploads/system/uploads/attachment_data/file/833951/IoD2019_Technical_Report.pdf.
39. Witten K, Blakely T, Bagheri N, Badland H, Ivory V, Pearce J, et al. Neighborhood built environment and transport and leisure physical activity: Findings using objective exposure and outcome measures in new Zealand. Environ Health Perspect (2012) 120(7):971–7. doi: 10.1289/ehp.1104584
40. Hauta-Alus HH, Holmlund-Suila EM, Rita HJ, Enlund-Cerullo M, Rosendahl J, Valkama SM, et al. Season, dietary factors, and physical activity modify 25-hydroxyvitamin d concentration during pregnancy. Eur J Nutr (2018) 57(4):1369–79. doi: 10.1007/s00394-017-1417-z
41. Cashman KD, Dowling KG, Škrabáková Z, Gonzalez-Gross M, Valtueña J, De Henauw S, et al. Vitamin d deficiency in Europe: pandemic? Am J Clin Nutr (2016) 103(4):1033–44. doi: 10.3945/ajcn.115.120873
42. Stalsberg R, Pedersen AV. Are differences in physical activity across socioeconomic groups associated with choice of physical activity variables to report? Int J Environ Res Public Health (2018) 15(5):922. doi: 10.3390/ijerph15050922
43. Parks SE, Housemann RA, Brownson RC. Differential correlates of physical activity in urban and rural adults of various socioeconomic backgrounds in the united states. J Epidemiol Community Health (2003) 57(1):29–35. doi: 10.1136/jech.57.1.29
44. Beenackers MA, Kamphuis CB, Giskes K, Brug J, Kunst AE, Burdorf A, et al. Socioeconomic inequalities in occupational, leisure-time, and transport related physical activity among European adults: a systematic review. Int J Behav Nutr Phys Act. (2012) 9:116. doi: 10.1186/1479-5868-9-116
45. Smith CA, Sun C, Pezic A, Rodda C, Cameron F, Allen K, et al. Determinants of neonatal vitamin d levels as measured on neonatal dried blood spot samples. Neonatology (2017) 111(2):153–61. doi: 10.1159/000448680
46. Keller A, Frederiksen P, Händel MN, Jacobsen R, McGrath JJ, Cohen AS, et al. Environmental and individual predictors of 25-hydroxyvitamin d concentrations in Denmark measured from neonatal dried blood spots: the d-tect study. Br J Nutr (2019) 121(5):567–75. doi: 10.1017/S0007114518003604
47. Ministry of Housing, Communities and Local Government. (2020). Available at: https://www.ethnicity-facts-figures.service.gov.uk/uk-population-by-ethnicity/demographics/people-living-in-deprived-neighbourhoods/latest#download-the-data.
48. Dror DK, King JC, Durand DJ, Allen LH. Association of modifiable and nonmodifiable factors with vitamin d status in pregnant women and neonates in Oakland, CA. J Am Diet Assoc (2011) 111(1):111–6. doi: 10.1016/j.jada.2010.10.002
49. Gangat M, Ponnapakkam T, Bradford E, Katikaneni R, Gensure R. Reversed seasonal variation in maternal vitamin d levels in southern Louisiana. Clin Pediatr (Phila). (2012) 51(8):718–22. doi: 10.1177/0009922812444599
50. Dijkstra SH, van Beek A, Janssen JW, de Vleeschouwer LH, Huysman WA, van den Akker EL. High prevalence of vitamin d deficiency in newborn infants of high-risk mothers. Arch Dis Child. (2007) 92(9):750–3. doi: 10.1136/adc.2006.105577
51. Hemmingway A, Fisher D, Berkery T, Murray DM, Kiely ME. Adherence to the infant vitamin d supplementation policy in Ireland. Eur J Nutr (2021) 60(3):1337–45. doi: 10.1007/s00394-020-02334-w
52. Gonzalez-Casanova I, Nguyen PH, Young MF, Harding KB, Reinhart G, Nguyen H, et al. Predictors of adherence to micronutrient supplementation before and during pregnancy in Vietnam. BMC Public Health (2017) 17(1):452. doi: 10.1186/s12889-017-4379-4
53. Zegeye B, Adjei NK, Olorunsaiye CZ, Ahinkorah BO, Ameyaw EK, Seidu AA, et al. Pregnant women's decision-making capacity and adherence to iron supplementation in sub-Saharan Africa: a multi-country analysis of 25 countries. BMC Pregnancy Childbirth. (2021) 21(1):822. doi: 10.1186/s12884-021-04258-7
54. Felipe-Dimog EB, Yu CH, Ho CH, Liang FW. Factors influencing the compliance of pregnant women with iron and folic acid supplementation in the Philippines: 2017 Philippine demographic and health survey analysis. Nutrients (2021) 13(9):3060. doi: 10.3390/nu13093060
55. Eyles D, Anderson C, Ko P, Jones A, Thomas A, Burne T, et al. A sensitive LC/MS/MS assay of 25OH vitamin D3 and 25OH vitamin D2 in dried blood spots. Clin Chim Acta (2009) 403(1-2):145–51. doi: 10.1016/j.cca.2009.02.005
56. Heath AK, Williamson EJ, Ebeling PR, Kvaskoff D, Eyles DW, English DR. Measurements of 25-hydroxyvitamin d concentrations in archived dried blood spots are reliable and accurately reflect those in plasma. J Clin Endocrinol Metab (2014) 99(9):3319–24. doi: 10.1210/jc.2014-1269
57. Hollis BW, Johnson D, Hulsey TC, Ebeling M, Wagner CL. Vitamin d supplementation during pregnancy: Double-blind, randomized clinical trial of safety and effectiveness. J Bone Miner Res (2011) 26(10):2341–57. doi: 10.1002/jbmr.463
58. Grant CC, Stewart AW, Scragg R, Milne T, Rowden J, Ekeroma A, et al. Vitamin d during pregnancy and infancy and infant serum 25-hydroxyvitamin d concentration. Pediatrics (2014) 133(1):e143–53. doi: 10.1542/peds.2013-2602
59. Green TJ, Li W, Barr SI, Jahani M, Chapman GE. Vitamin d supplementation is associated with higher serum 25OHD in Asian and white infants living in Vancouver, Canada. Matern Child Nutr (2015) 11(2):253–9. doi: 10.1111/mcn.12008
60. Uday S, Kongjonaj A, Aguiar M, Tulchinsky T, Högler W. Variations in infant and childhood vitamin d supplementation programmes across Europe and factors influencing adherence. Endocr Connect. (2017) 6(8):667–75. doi: 10.1530/EC-17-0193
61. Aguiar M, Andronis L, Pallan M, Högler W, Frew E. The economic case for prevention of population vitamin d deficiency: A modelling study using data from England and Wales. Eur J Clin Nutr (2020) 74(5):825–33. doi: 10.1038/s41430-019-0486-x
62. Händel MN, Jacobsen R, Thorsteinsdottir F, Keller AC, Stougaard M, Jensen CB, et al. Assessing health consequences of vitamin d fortification utilizing a societal experiment design: Methodological lessons learned from the d-tect project. Int J Environ Res Public Health (2021) 18(15):8136. doi: 10.3390/ijerph18158136
63. Jääskeläinen T, Itkonen ST, Lundqvist A, Erkkola M, Koskela T, Lakkala K, et al. The positive impact of general vitamin d food fortification policy on vitamin d status in a representative adult Finnish population: evidence from an 11-y follow-up based on standardized 25-hydroxyvitamin d data. Am J Clin Nutr (2017) 105(6):1512–20. doi: 10.3945/ajcn.116.151415
64. Torres-Gonzalez M, Cifelli CJ, Agarwal S, Fulgoni VL. Association of milk consumption and vitamin d status in the US population by ethnicity: NHANES 2001-2010 analysis. Nutrients (2020) 12(12):3720. doi: 10.3390/nu12123720
65. Calvo MS, Whiting SJ. Survey of current vitamin d food fortification practices in the united states and Canada. J Steroid Biochem Mol Biol (2013) 136:211–3. doi: 10.1016/j.jsbmb.2012.09.034
Keywords: income, vitamin D (25-hydroxyvitamin D), employment, housing, micronutrients, neonate - age
Citation: Högler W, Tischlinger K, Fraser WD, Tang JCY and Uday S (2022) Influence of maternal socioeconomic deprivation and living environment on newborn bloodspot 25-hydroxyvitamin D levels. Front. Endocrinol. 13:978580. doi: 10.3389/fendo.2022.978580
Received: 26 June 2022; Accepted: 24 October 2022;
Published: 03 November 2022.
Edited by:
Artemis Doulgeraki, Institute of Child Health, GreeceReviewed by:
Assimina Galli-Tsinopoulou, AHEPA University Hospital, GreeceTom Thacher, Mayo Clinic, United States
Copyright © 2022 Högler, Tischlinger, Fraser, Tang and Uday. This is an open-access article distributed under the terms of the Creative Commons Attribution License (CC BY). The use, distribution or reproduction in other forums is permitted, provided the original author(s) and the copyright owner(s) are credited and that the original publication in this journal is cited, in accordance with accepted academic practice. No use, distribution or reproduction is permitted which does not comply with these terms.
*Correspondence: Wolfgang Högler, d29sZmdhbmcuaG9lZ2xlckBrZXBsZXJ1bmlrbGluaWt1bS5hdA==
†These authors share first authorship