 Yufang Liu
 Sanbao Chai
 Xiaomei Zhang
- Department of Endocrinology, Peking University International Hospital, Beijing, China
Objective: This study aimed to investigate the effect of sarcopenia, osteoporosis, and osteosarcopenia on spine fracture in patients with prediabetes.
Methods: We collected and analyzed the data from the U.S. National Health and Nutrition Examination Surveys during the period from 2009 to 2018. Bone mineral density and the skeletal muscle mass index (SMI) were measured with dual-energy X-ray absorptiometry (DXA). The diagnosis of spine fracture was based on DXA and history.
Results: People with prediabetes were more likely to develop sarcopenia than normal glucose tolerance subjects (OR 1.33, 95% CI 1.07–1.66), while there was no significant increase of osteoporosis in prediabetes (OR 0.91, 95% CI 0.78–1.05). The SMI was independently associated with osteoporosis in prediabetes adults (OR 0.65, 95% CI 0.50–0.85). Both sarcopenia and osteoporosis were positively associated with spine fracture in prediabetes (OR 4.44, 95% CI 1.76–11.21, and OR 2.90, 95% CI 1.85–4.56, respectively). The risk of spine fracture was substantially higher in the presence of osteosarcopenia (OR 6.63; 95% CI, 1.34–32.94) than in the presence of sarcopenia or osteoporosis alone in prediabetes.
Conclusion: In adults with prediabetes, both sarcopenia and osteoporosis are risk factors for spine fracture, and the combination of sarcopenia and osteoporosis further increases the prevalence of spine fracture.
Introduction
Prediabetes refers to an intermediate metabolic state between normoglycemia and diabetes, and it includes impaired fasting plasma glucose, impaired glucose tolerance, and mildly raised hemoglobin A1c (HbA1c). Although there is no clinically confirmed hyperglycemia in prediabetes, a series of pathophysiological changes related to diabetes have occurred. Recent evidence has shown that the prevalence of diabetes-associated complications in prediabetes starts to rise compared with those with normal glucose levels (1).
Osteoporosis describes a systemic bone disease that is prone to fractures due to a decrease in bone mass and the destruction of bone microstructures, resulting in increased bone fragility, whereas sarcopenia refers to decreased muscle mass, strength, and function. The incidence of both osteoporosis and sarcopenia increases as the aggravated population ages. Both osteoporosis and sarcopenia can lead to a greater risk of falls, fractures, hospitalization, and mortality. Because of the close relationship between the two conditions, the concept of osteosarcopenia has been established, which refers to the coexistence of osteoporosis and sarcopenia.
Previous studies have shown that people with diabetes are more likely to have sarcopenia (2, 3), and people with diabetes are at a higher risk of developing fractures (4). Therefore, sarcopenia and osteoporosis are increasingly recognized as chronic complications of diabetes. For people with prediabetes, the risk of sarcopenia, osteoporosis, and osteosarcopenia and their impact on fractures are still unclear.
In this study, we analyzed the data from the American NHANES from 2009 to 2018 to examine the association among sarcopenia, osteoporosis, and prediabetes and the effect of sarcopenia, osteoporosis, and osteosarcopenia on spine fracture in American adults with prediabetes.
Methods
Population
NHANES consists of a cross-sectional multistage, stratified, and clustered probability sample of the deinstitutionalized population in the United States. It was conducted by the National Center for Health Statistics and approved by the National Center for Health Statistics institutional review board. Written informed consent was received for all participants.
The data of participants in the American NHANES 2009–2018 survey were analyzed. NHANES 2009–2018 data are publicly available and can be accessed online (https://www.cdc.gov).
Participants with missing relevant data and the lack of relevant examinations were excluded from the analyses. The analyses of the present study were limited to individuals aged ≥18 years.
Measurements
Information was collected through family interviews and physical examinations in a mobile examination center. A standardized questionnaire was used to collect data on age, sex, race, education level, physical activity, and the history of fracture. Race was self-reported, and in the present study, it was categorized into white, black, Mexican, Asian, and other races. Current smoking was defined as having smoked 100 cigarettes or more in one’s lifetime and currently smoking cigarettes. The education level was categorized as less than 9th grade, 9–11th grade, high school graduate, AA degree, and college or above. The BMI was calculated by dividing body weight (kg) by the square of height (m). Steroid use was defined as ever taken any prednisone or cortisone pills nearly every day for a month or longer. Information about physical activity was self-reported by participants using the Global Physical Activity Questionnaire since the 2007–2008 cycle. Based on the data from self-reported questionnaire, metabolic equivalents (METs) can be calculated, which were used to estimate the average weekly energy expenditure of participants (5).
BMD was evaluated by DXA. HbA1c levels were measured by testing whole blood samples using the method of high-performance liquid chromatography. The glucose tolerance test is to measure the plasma glucose value 2 h after the oral administration of 75 g glucose.
Definition of variables
Participants eligible for any of the following conditions were classified as diabetic patients in the present study: (1) a confirmed history of diabetes in questionnaire; (2) HbA1c level ≥ 6.5% (6); and (3) fasting glucose level ≥ 7.0 mmol/L (6). Participants who accord with all of the following conditions were defined as NGT: (1) a denied history of diabetes or prediabetes in the questionnaire; (2) HbA1c level <5.7% (6); and (3) fasting glucose level <5.6mmol/L. The remaining participants were defined as prediabetes.
T-scores were calculated as (BMDrespondent-mean BMDreference group)/SDreference group. In the formula above, SD stands for standard deviation. Osteoporosis was defined as a T-score<−2.5 in total lumbar spine (L1–L4) or femoral neck tested by DXA. As recommended by the World Health Organization (7), the diagnosis of osteoporosis should be based on ethnic and sex-specific reference values. Therefore, the race-specific reference value of BMD for the calculation of T-scores at the femoral neck and the lumbar spine was obtained from the Vital and Health Statistics from the Centers for Disease Control (CDC) (8).
The appendicular SMI was calculated by dividing the appendicular skeletal muscle mass (kg) by square of height (m). The SMI cutoff values for the diagnosis of low muscle mass were 7.0 kg/m2 for men and 5.5kg/m2 for women (9), according to the 2nd meeting of European Working Group on Sarcopenia in Older People.
The presence of either of the following conditions is defined as a spine fracture: previous spine fracture history in the questionnaire; the vertebral fracture status summary in DXA suggests a fracture (mild, moderate, or severe fracture at any level in T4–L4).
Statistical analysis
The Kolmogorov–Smirnov method was used to evaluate the data distribution. Continuous variables are represented as mean ± standard deviation for normally distributed data or medians and interquartile ranges in parentheses for abnormally distributed data. The chi-square test, Mann–Whitney U test, or independent t-test was performed to compare the differences between two groups when appropriate. Categorical variables are represented as frequency (percentage), and between-group differences were evaluated by the chi-square test. Logistic regression was used to adjust for potential confounding variables when appropriate. P-values < 0.05 were considered indicative of statistical significance. All statistical analyses were performed using STATA 12.0.
Results
The baseline clinical characteristics of the participants enrolled in this study are shown in Tables 1 (all the subjects) and 2 (subjects with prediabetes). From 2009 to 2018, a total of 23,825 adults were included in the study, of whom 7,427 (31.2%) had prediabetes. As compared to normoglycemic people, subjects with prediabetes had a higher proportion of men, older age, a higher proportion of black race, a lower education level, less physical activity, a higher BMI, and higher waist circumference (WC), so did the subjects with diabetes. In terms of the HbA1c level, as expected, the diabetic group was higher than the prediabetic group, and the prediabetic group was higher than the NGT group. The trend of the insulin level among the three groups appeared the same with the HbA1c level. There was no significant difference among the three groups on Serum 25(OH)D. Interestingly, the lumbar and spinal bone mineral density of the prediabetic group was lower than that of the NGT group, while there was no significant difference between the diabetic group and the NGT group, which may be explained by the excessive weight of the diabetic group (10). In terms of prevalence of osteoporosis, the diabetic group was higher than the prediabetic group, and the prediabetic group was higher than the NGT group. The trend of spine fracture prevalence among three groups appeared the same as osteoporosis prevalence. In terms of the SMI, the diabetic group was higher than the prediabetic group, and the prediabetic group was higher than the NGT group, which may be explained by the excessive weight of prediabetic and diabetic groups.
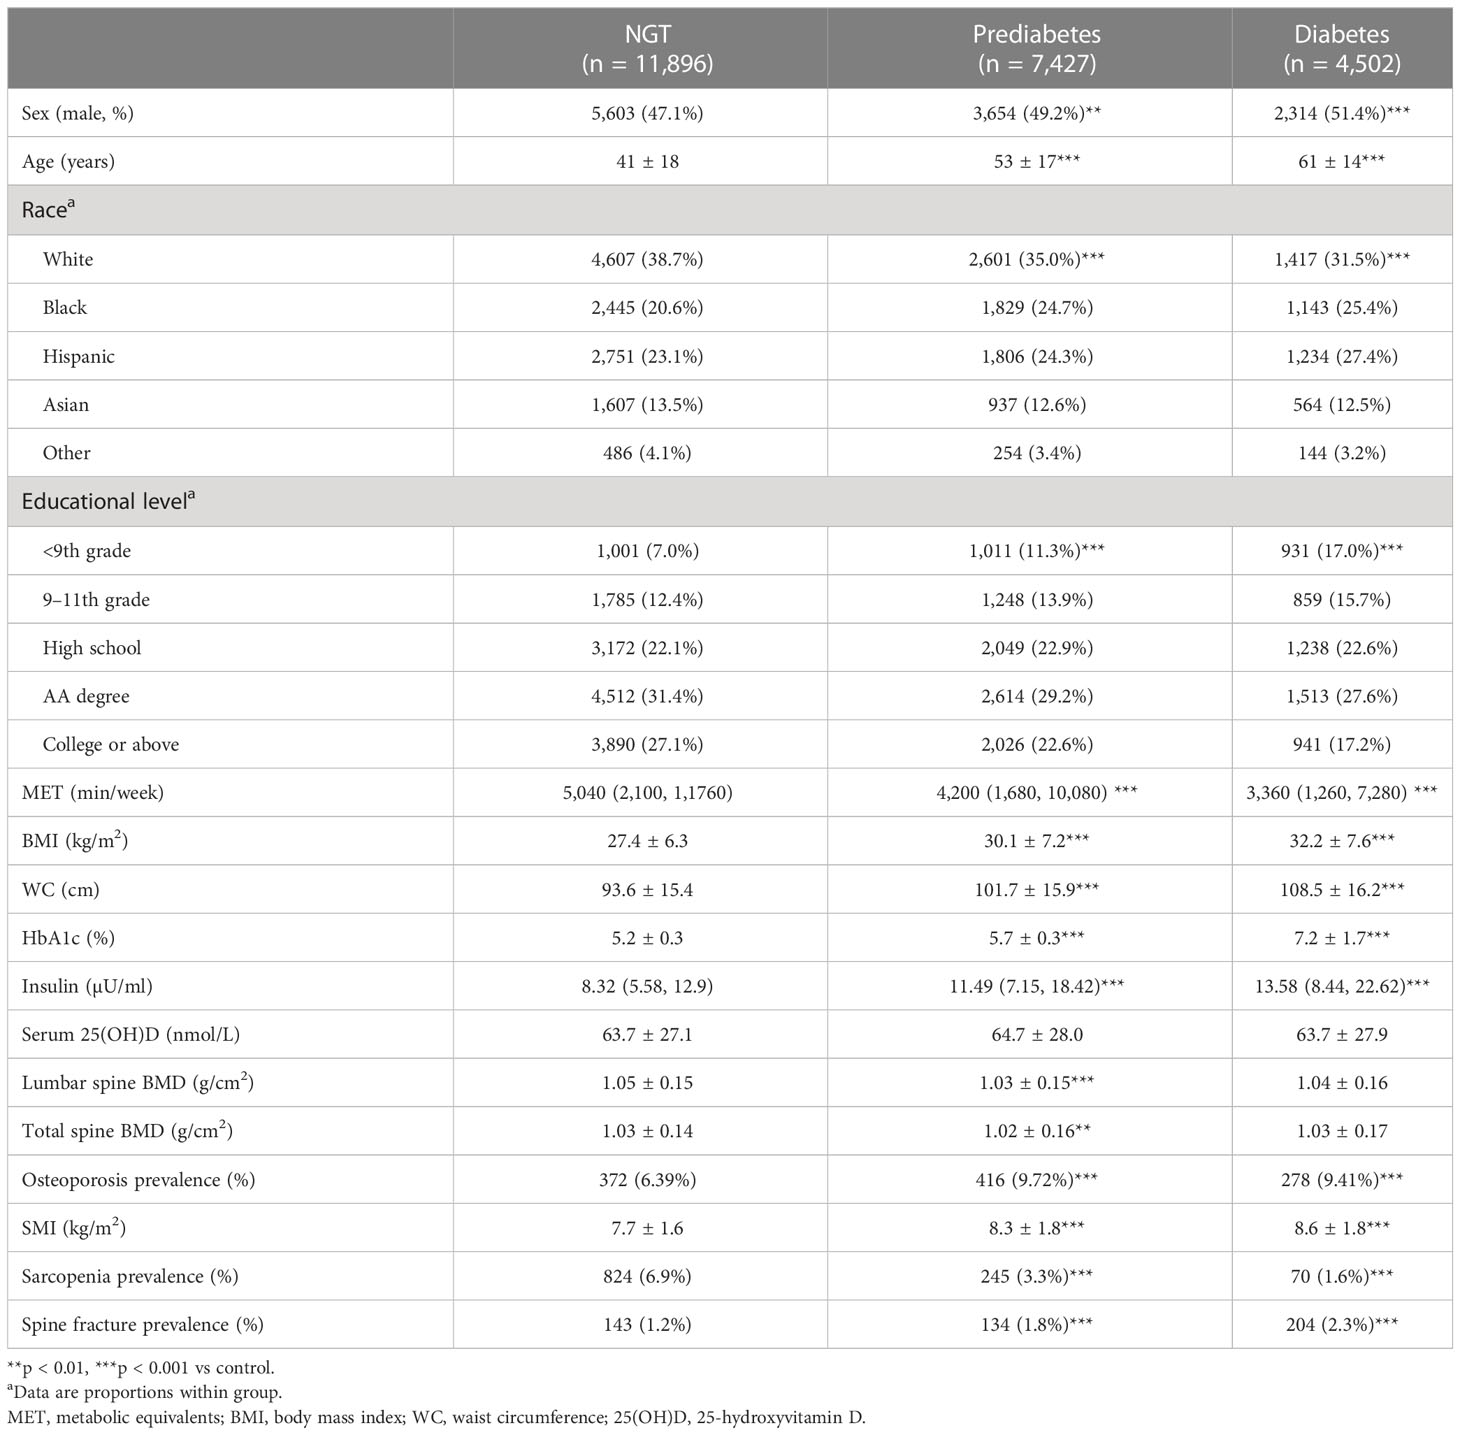
Table 1 Characteristics of U.S. adults with diabetes, with prediabetes and with NGT, 2009–2018.
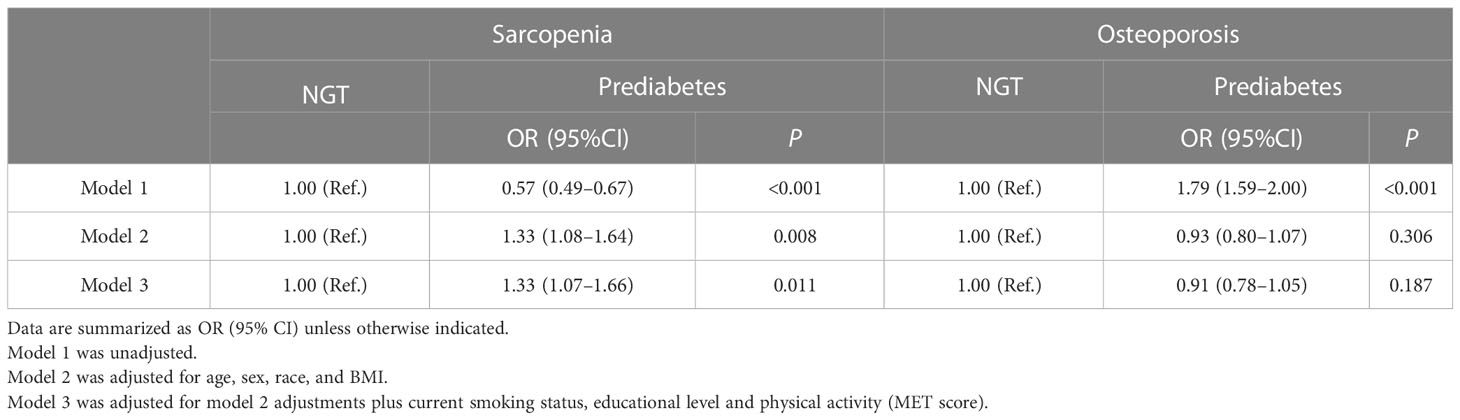
Table 2 Association between prediabetes and the odds of sarcopenia and osteoporosis.
After adjusting for age, sex, race, BMI, current smoking status, educational level, and physical activity (MET score), people with prediabetes were more likely to develop sarcopenia than NGT subjects (OR 1.33, 95% CI 1.07–1.66), while prediabetes was not an independent risk factor for osteoporosis (OR 0.91, 95% CI 0.78–1.05) (Table 2).
Furthermore, in order to explore the effects of osteoporosis and sarcopenia on spinal fractures in the population of prediabetes, we divided the prediabetes population into four groups: normal group (without sarcopenia or osteoporosis), sarcopenia group, osteoporosis group, and osteosarcopenia group (with both sarcopenia and osteoporosis). The subject characteristics of the four groups are shown in Table 3. Individuals in the osteosarcopenia group were significantly older and had a lower BMI, lower WC, and less physical activity than normal subjects. As expected, subjects in osteosarcopenia group had lower BMD, a lower SMI, and higher spine fracture prevalence than individuals in the normal group. After adjusting for confounders, the SMI was independently associated with osteoporosis in prediabetes adults (OR 0.65, 95% CI 0.50–0.85) (Table 4).
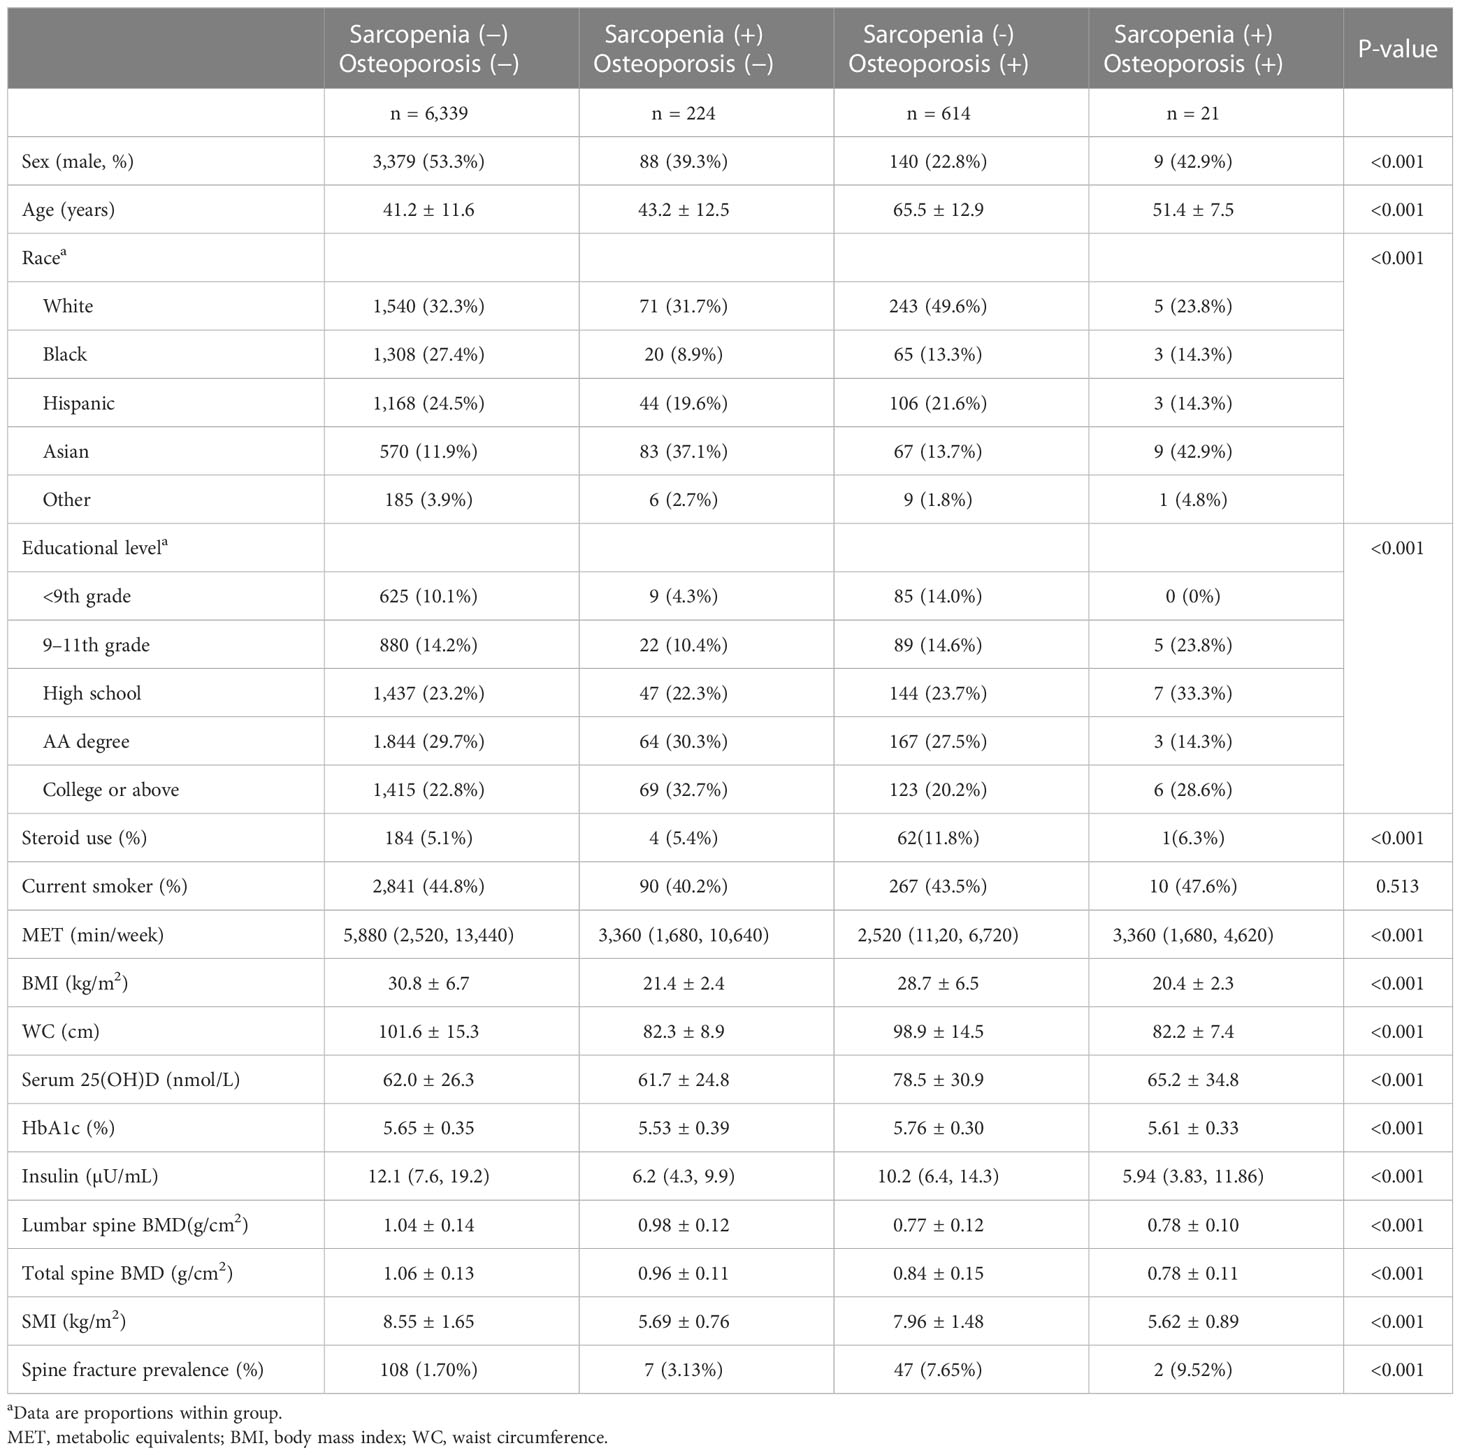
Table 3 Characteristics of prediabetes adults with sarcopenia, with osteoporosis, and with osteosarcopenia.
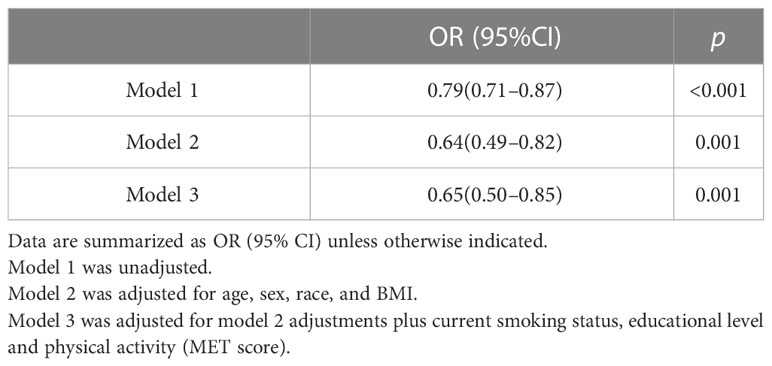
Table 4 Association between the SMI and osteoporosis in prediabetes adults.
As shown in Figure 1, in the prediabetes population, sarcopenia was not an independent risk factor for spine fracture, while osteoporosis and osteosarcopenia were independent risk factors for spine fracture without adjustment for any confounding factors. In Table 5, after adjusting for age, sex, race, BMI, steroid use, current smoking status, educational level, and physical activity (MET score), both sarcopenia and osteoporosis were positively associated with spine fracture in the fully adjusted model (model 3, OR 4.44, 95% CI 1.76–11.21, and OR 2.90, 95% CI 1.85–4.56, respectively). Furthermore, the likelihood of spine fracture was substantially higher in the presence of osteosarcopenia (OR 6.63; 95% CI, 1.34–32.94). Unlike prediabetes, there was no significant association between sarcopenia and spine fracture in the NGT group, while sarcopenia and osteosarcopenia were still positively associated with spine fracture in the NGT group (model 3, OR 2.40, 95% CI 1.53–3.76, and OR 4.31, 95% CI 1.17–15.92, respectively).
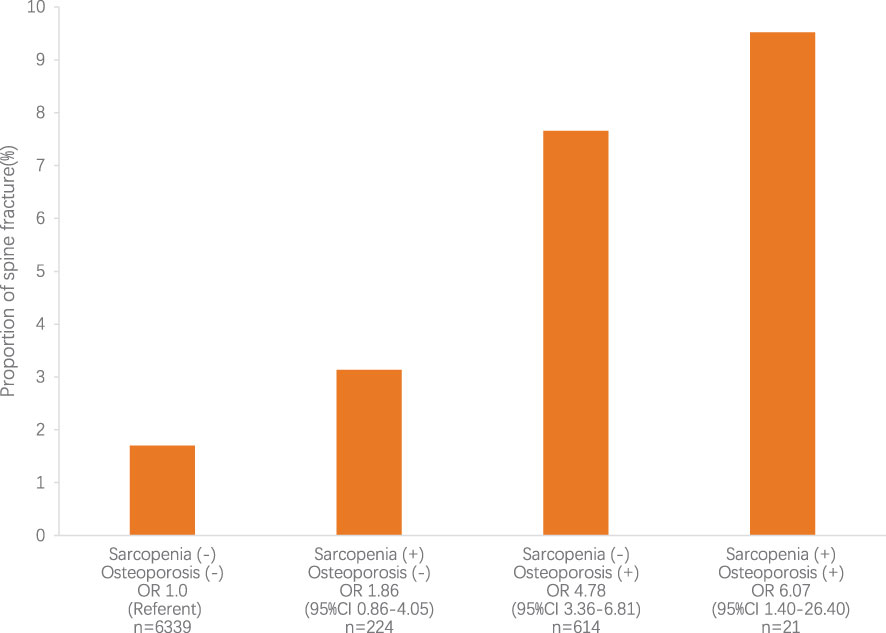
Figure 1 The relative risk for spine fracture according to sarcopenia and osteoporosis status. The relative risk for spine fracture was highest in subjects with sarcopenia and osteoporosis (P<0.05). CI, confidence interval; OR, odds ratio.
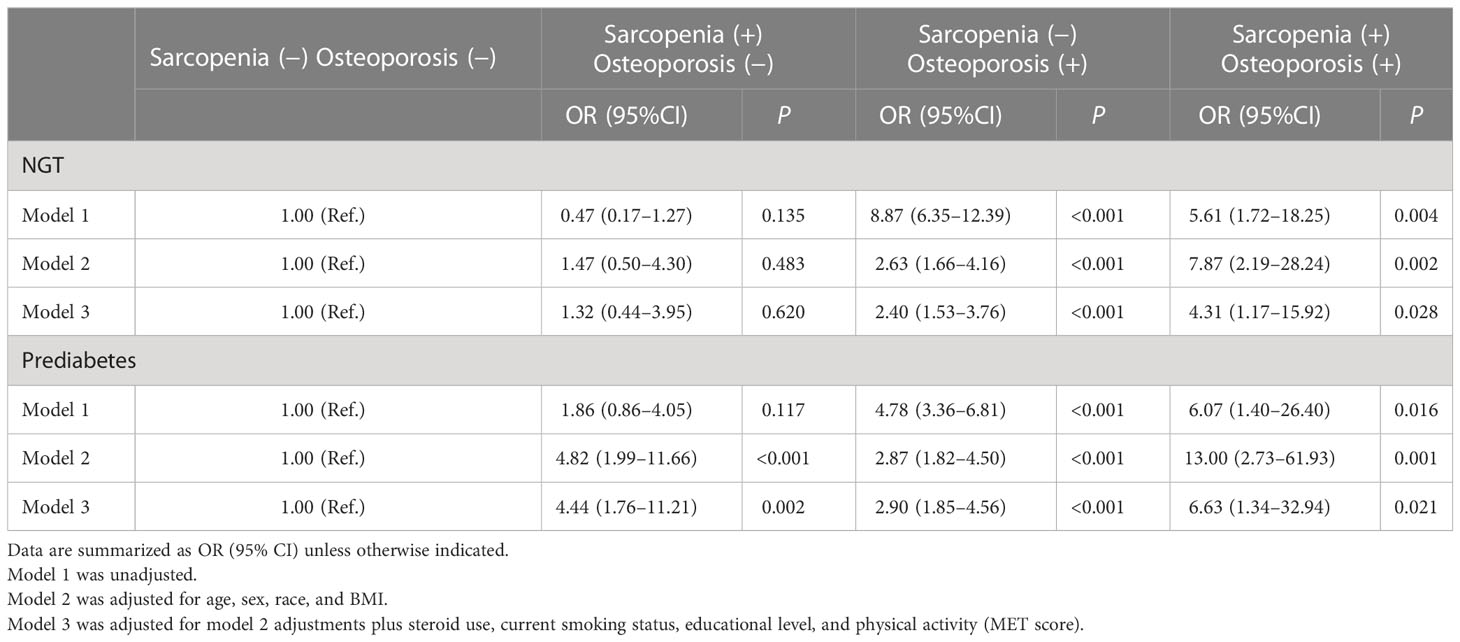
Table 5 Incidence rate ratios (95% CI) for spine fracture according to categories based on sarcopenia and osteoporosis in NGT/prediabetes adults.
Discussion
Prediabetes and osteoporosis
Recently, the correlation between diabetes and bone health is attracting increasing attention. It is well known that type 2 diabetes predisposes individuals to a higher risk of fractures; even type 2 diabetes is associated with an average or higher BMD (11). Nevertheless, there are few studies exploring the relation between prediabetes and skeletal health, and the results were conflicting (12–14). This study found an increased risk of spine fractures in prediabetes. In addition, in this study, although the risk of spine fracture increased in the prediabetes population compared with the NGT, the prevalence of osteoporosis was not significantly different from that in the NGT population. Previous studies have also found that the risks of hip fractures begun to increase in prediabetes (15). Thus, similar to the condition in diabetes, the bone in prediabetes appears to have relatively low strength for a given BMD. As a result, the BMD as a conventional tool appears to underestimate the risk of fracture in individuals with prediabetes, which is a challenge for clinicians.
Prediabetes and sarcopenia
A previous study has reported that muscle strength was lower in diabetes patients than individuals without diabetes (16), and type 2 diabetes is related to accelerated loss of leg muscle strength in elderly individuals (17). In fact, type 2 diabetes has already been identified as an independent risk factor for sarcopenia (18). In terms of sarcopenia, it has been revealed that strength of hand grip adjusted by the BMI (19) or body weight (20) is related to prediabetes. Kaga et al. recently reported that prediabetes is an independent risk factor for sarcopenia in older Japanese men but not in older Japanese women (21). In the present study, after adjusting for age, sex, race, BMI, current smoking status, educational level, and physical activity (MET score), prediabetes is an independent risk factor for sarcopenia in the multiracial group. Therefore, it is necessary for healthcare providers to pay more attention to the development of sarcopenia in prediabetes as well as diabetes.
Sarcopenia and osteoporosis
In the present study, osteoporosis is closely related to the SMI in subjects with prediabetes. To the best of our knowledge, our study is the first attempt to provide the association between the SMI and osteoporosis in U.S. adults with prediabetes. Sharing the same mechanical and molecular mechanisms, muscle and skeleton function are closely linked (22). Both skeleton and muscle mass are intrinsically related to the declined physical performance with aging, while the bone–muscle crosstalk, which is the molecular mechanisms linking bone to muscle function, is less well defined. Hormones were identified as having an important role in the development of osteosarcopenia, including growth hormone (GH)/insulin-like growth factor-1 (IGF-1) and gonadal sex hormones (23).
Osteosarcopenia and fracture
Previous studies have shown that the coexistence of sarcopenia and osteoporosis was associated with some adverse outcomes, such as depression, malnutrition, peptic ulcer disease, inflammatory arthritis, and reduced mobility (24). Meanwhile, there are studies demonstrating that subjects with both osteoporosis and sarcopenia are at a higher risk of falls and frailty than those with osteoporosis or sarcopenia alone (24, 25). In a Korean study conducted in hip fracture patients, osteosarcopenia was associated with a higher 1-year mortality rate (15.1%) compared with subjects with osteoporosis (5.1%) or sarcopenia (10.3%) alone (26). In the present study, in patients with prediabetes, sarcopenia increases the risk of spinal fractures by 4.4 times, osteoporosis increases the risk of spinal fractures by 2.9 times, and sarcopenia combined with osteoporosis increases the risk of spinal fractures by 6.6 times. As for people with NGT, although sarcopenia does not significantly increase the risk of spinal fractures, its combination with osteoporosis further increases the prevalence of spinal fractures.
In conclusion, patients with prediabetes had an increased risk of sarcopenia compared with people with NGT. In adults with prediabetes, muscle weight loss is associated with osteoporosis; meanwhile, osteoporosis and sarcopenia both increase the risk of spinal fractures, while the combined presence of sarcopenia and osteoporosis further increases the prevalence of spinal fractures. For patients with prediabetes, in order to prevent spinal fracture, attention should be paid to the prevention and treatment of sarcopenia and osteoporosis, and special attention should be paid to the combination of sarcopenia and osteoporosis.
A key strength of this analysis is the source of the data. NHANES is a series of meticulously conducted surveys with continuous quality control, ensuring that the data are timely and of high quality. NHANES also uses population-based cluster random selection to identify a nationally representative sample that can be applied to the whole U.S. population. However, it has some limitations. First, the definition of osteoporosis, in addition to BMD < −2.5, also includes a history of fragility fractures, which were not included in the osteoporosis group because fragility fractures could not be defined. Second, the diagnosis of sarcopenia, in addition to decreased muscle quantity, also includes a decrease in muscle quality, which was not analyzed in this study due to the lack of relevant test results. Third, the reference standards for muscle mass are diverse, and this study uses the criteria of the second meeting of the European Sarcopenia Working Group, which does not necessarily apply to people of African, Asian, Hispanic, or other races. Fourth, because some of the respondents did not complete the full set of examinations, fewer people were diagnosed with osteosarcopenia. It is hoped that data with larger sample size will be available for future studies in this area.
Data availability statement
The raw data supporting the conclusions of this article will be made available by the authors, without undue reservation.
Ethics statement
The studies involving human participants were reviewed and approved by National Center for Health Statistics (NCHS) Research Ethics Review Board (ERB). The patients/participants provided their written informed consent to participate in this study.
Author contributions
YL and SC conceived and designed the experiments. YL performed the data analysis. YL wrote the manuscript. XZ provided supervision. All authors contributed to the article and approved the submitted version.
Conflict of interest
The authors declare that the research was conducted in the absence of any commercial or financial relationships that could be construed as a potential conflict of interest.
Publisher’s note
All claims expressed in this article are solely those of the authors and do not necessarily represent those of their affiliated organizations, or those of the publisher, the editors and the reviewers. Any product that may be evaluated in this article, or claim that may be made by its manufacturer, is not guaranteed or endorsed by the publisher.
References
1. Zhang Y, Dall TM, Chen Y, Baldwin A, Yang W, Mann S, et al. Medical cost associated with prediabetes. Popul Health Manage (2009) 12(3):157–63. doi: 10.1089/pop.2009.12302
2. Park SW, Goodpaster BH, Lee JS, Kuller LH, Boudreau R, Rekeneire N, et al. Excessive loss of skeletal muscle mass in older adults with type 2 diabetes. Diabetes Care (2009) 32(11):1993–7. doi: 10.2337/dc09-0264
3. Kalyani RR, Corriere M, Ferrucci L. Age-related and disease-related muscle loss: the effect of diabetes, obesity, and other diseases. Lancet Diabetes Endocrinol (2014) 2(10):819–29. doi: 10.1016/S2213-8587(14)70034-8
4. Fan Y, Wei F, Lang Y, Liu Y. Diabetes mellitus and risk of hip fractures: a meta-analysis. Osteoporos Int (2016) 27(1):219–28. doi: 10.1007/s00198-015-3279-7
5. Du Y, Liu B, Sun Y, Snetselaar LG, Wallace RB, Bao W. Trends in adherence to the physical activity guidelines for americans for aerobic activity and time spent on sedentary behavior among US adults, 2007 to 2016. JAMA Netw Open (2019) 2(7):e197597. doi: 10.1001/jamanetworkopen.2019.7597
6. American Diabetes Association. 2. Classification and diagnosis of diabetes: Standards of medical care in diabetes-2019. Diabetes Care (2019) 42(Suppl 1):S13–28. doi: 10.2337/dc19-S002
7. Kanis JA. Assessment of fracture risk and its application to screening for postmenopausal osteoporosis: synopsis of a WHO report. WHO Study Group Osteoporos Int (1994) 4(6):368–81. doi: 10.1007/BF01622200
8. Looker AC, Borrud LG, Hughes JP, Fan B, Shepherd JA, Melton LJ 3rd. Lumbar spine and proximal femur bone mineral density, bone mineral content, and bone area: United states, 2005-2008. Vital Health Stat 11 (2012) 251):1–132.
9. Cruz-Jentoft AJ, Bahat G, Bauer J, Boirie Y, Bruyère O, Cederholm T, et al. Sarcopenia: revised European consensus on definition and diagnosis. Age Ageing (2019) 48(1):16–31. doi: 10.1093/ageing/afy169
10. Kinjo M, Setoguchi S, Solomon DH. Bone mineral density in adults with the metabolic syndrome: analysis in a population-based U.S. sample. J Clin Endocrinol Metab (2007) 92(11):4161–4. doi: 10.1210/jc.2007-0757
11. Schwartz AV. Diabetes, bone and glucose-lowering agents: clinical outcomes. Diabetologia. (2017) 60(7):1170–9. doi: 10.1007/s00125-017-4283-6
12. Rabijewski M, Papierska L, Piątkiewicz P. An association between bone mineral density and anabolic hormones in middle-aged and elderly men with prediabetes. Aging Male (2017) 20(3):205–13. doi: 10.1080/13685538.2017.1338254
13. Kim CH. Bone mineral density in prediabetic men (korean diabetes j 2010;34:294-302). Korean Diabetes J (2010) 34(6):384–5. doi: 10.4093/kdj.2010.34.6.384
14. de Liefde II, van der Klift M, de Laet CE, van Daele PL, Hofman A, Pols HA. Bone mineral density and fracture risk in type-2 diabetes mellitus: the Rotterdam study. Osteoporos Int (2005) 16(12):1713–20. doi: 10.1007/s00198-005-1909-1
15. Park HY, Han K, Kim Y, Kim YH, Sur YJ. The risk of hip fractures in individuals over 50 years old with prediabetes and type 2 diabetes - a longitudinal nationwide population-based study. Bone. (2021) 142:115691. doi: 10.1016/j.bone.2020.115691
16. Park SW, Goodpaster BH, Strotmeyer ES, Rekeneire N, Harris TB, Schwartz AV, et al. Decreased muscle strength and quality in older adults with type 2 diabetes: the health, aging, and body composition study. Diabetes. (2006) 55(6):1813–8. doi: 10.2337/db05-1183
17. Park SW, Goodpaster BH, Strotmeyer ES, Kuller LH, Broudeau R, Kammerer C, et al. Accelerated loss of skeletal muscle strength in older adults with type 2 diabetes: the health, aging, and body composition study. Diabetes Care (2007) 30(6):1507–12. doi: 10.2337/dc06-2537
18. Nakamura K, Yoshida D, Honda T, Hata J, Shibata M, Hirakawa Y, et al. Midlife and late-life diabetes and sarcopenia in a general older Japanese population: The hisayama study. J Diabetes Investig (2021) 12(10):1899–907. doi: 10.1111/jdi.13550
19. Jang BN, Nari F, Kim S, Park EC. Association between relative handgrip strength and prediabetes among south Korean adults. PloS One (2020) 15(10):e0240027. doi: 10.1371/journal.pone.0240027
20. Hu S, Gu Y, Lu Z, Zhang Q, Liu L, Meng G, et al. Relationship between grip strength and prediabetes in a Large-scale adult population. Am J Prev Med (2019) 56(6):844–51. doi: 10.1016/j.amepre.2019.01.013
21. Kaga H, Tamura Y, Someya Y, Naito H, Tabata H, Kakehi S, et al. Prediabetes is an independent risk factor for sarcopenia in older men, but not in older women: the bunkyo health study. J Cachexia Sarcopenia Muscle (2022) 13(6):2835–42. doi: 10.1002/jcsm.13074
22. Clynes MA, Gregson CL, Bruyère O, Cooper C, Dennison EM. Osteosarcopenia: where osteoporosis and sarcopenia collide. Rheumatol (Oxford) (2021) 60(2):529–37. doi: 10.1093/rheumatology/keaa755
23. Girgis CM, Mokbel N, Digirolamo DJ. Therapies for musculoskeletal disease: can we treat two birds with one stone. Curr Osteoporos Rep (2014) 12(2):142–53. doi: 10.1007/s11914-014-0204-5
24. Huo YR, Suriyaarachchi P, Gomez F, Curcio CL, Boersma D, Muir SW, et al. Phenotype of osteosarcopenia in older individuals with a history of falling. J Am Med Dir Assoc (2015) 16(4):290–5. doi: 10.1016/j.jamda.2014.10.018
25. Wang YJ, Wang Y, Zhan JK, Tang ZY, He JY, Tan P, et al. Sarco-osteoporosis: Prevalence and association with frailty in Chinese community-dwelling older adults. Int J Endocrinol (2015) 2015:482940. doi: 10.1155/2015/482940
Keywords: prediabetes, sarcopenia, osteoporosis, spine fracture, osteosarcopenia
Citation: Liu Y, Chai S and Zhang X (2023) Effect of sarcopenia, osteoporosis, and osteosarcopenia on spine fracture in American adults with prediabetes. Front. Endocrinol. 14:1163029. doi: 10.3389/fendo.2023.1163029
Received: 10 February 2023; Accepted: 31 March 2023;
Published: 19 April 2023.
Edited by:
Ifigenia Kostoglou-Athanassiou, Asclepeion Hospital, GreeceReviewed by:
Leila Warszawski, Instituto Estadual de Diabetes e Endocrinologia Luiz Capriglione, BrazilYan Wang, University of Pittsburgh, United States
Copyright © 2023 Liu, Chai and Zhang. This is an open-access article distributed under the terms of the Creative Commons Attribution License (CC BY). The use, distribution or reproduction in other forums is permitted, provided the original author(s) and the copyright owner(s) are credited and that the original publication in this journal is cited, in accordance with accepted academic practice. No use, distribution or reproduction is permitted which does not comply with these terms.
*Correspondence: Xiaomei Zhang, ei54Lm1laUAxNjMuY29t