 Hesong Zhang
 Juhua Dai1†
 Wei Zhang
 Hongwei Li
- 1Department of Clinical Laboratory, Peking University International Hospital, Beijing, China
- 2State Key Laboratory of Molecular Vaccinology and Molecular Diagnostics, School of Public Health, Xiamen University, Xiamen, Fujian, China
Gestational diabetes mellitus (GDM) is one of the most common complications in pregnancy, impairing both maternal and fetal health in short and long term. As early interventions are considered desirable to prevent GDM, this study aims to develop a simple-to-use nomogram based on multiple common risk factors from electronic medical health records (EMHRs). A total of 924 pregnant women whose EMHRs were available at Peking University International Hospital from January 2022 to October 2022 were included. Clinical demographics and routine laboratory analysis parameters at 8-12 weeks of gestation were collected. A novel nomogram was established based on the outcomes of multivariate logistic regression. The nomogram demonstrated powerful discrimination (the area under the receiver operating characteristic curve = 0.7542), acceptable agreement (Hosmer-Lemeshow test, P = 0.3214) and favorable clinical utility. The C-statistics of 10-Fold cross validation, Leave one out cross validation and Bootstrap were 0.7411, 0.7357 and 0.7318, respectively, indicating the stability of the nomogram. A novel nomogram based on easily-accessible parameters was developed to predict GDM in early pregnancy, which may provide a paradigm for repurposing clinical data and benefit the clinical management of GDM. There is a need for prospective multi-center studies to validate the nomogram before employing the nomogram in real-world clinical practice.
1 Introduction
Gestational diabetes mellitus (GDM) is a common chronic complication defined as glucose intolerance with onset or first detection in pregnancy (1), affects the health of millions of pregnant women worldwide (2), and its prevalence has been up to 14.8% in China (3). The pathogenesis of GDM in pregnant women primarily involves insulin resistance and β-cell defects, characterized by the inability of pancreatic β-cells to adequately respond to the increased insulin demands of pregnancy, contributing to varying degrees of hyperglycemia (4, 5). In addition, increased circulating placental-related insulin antagonists, including growth hormone, corticotrophin-releasing hormone, human placental lactogen, prolactin, estrogen, and insulinase, cause a reduction in insulin sensitivity of approximately 50-60% in late pregnancy, leading to a progressive increase in insulin resistance (5, 6). The hyperglycemia is closely associated with short- and long-term negative health of mother and offspring (6). Pregnant women with GDM have an increased risk of preeclampsia and cesarean section in the short term (7), and a higher risk of co-morbidities including recurrence of GDM and type 2 diabetes mellitus (T2DM) in the long term (8, 9). Similarly, the offspring of women with GDM are at high risk of preterm birth and neonatal hypoglycemia in the short term (10), and T2DM and cardiovascular diseases in the long term (11, 12).
It was reported that the typical diagnosis of GDM at 24-28 weeks of gestation made it too late for the reversal of adverse effects mainly because of the short window left for glycemic control (13). The poor results of insulin therapy and diet-exercise interventions underlying the evidence that fetal development has already occurred before the oral glucose tolerance test (OGTT) (13, 14). While the therapies after OGTT were limited, early identification of GDM and interventions that subsequently initiated in the first or second trimester were considered desirable as these might be able to prevent GDM and reduce the risk of its associated co-morbidities (15). Given that the increased prevalence of GDM may occur along with the implementation of three-child policy in China, it is thus of great importance to predict and identify GDM in the early pregnancy for the prevention of GDM.
Publications show that risk factors for GDM include ethnicity and maternal factors such as older age, high parity, overweight and obesity, excessive weight gain in the index pregnancy, short stature, polycystic ovarian syndrome, history of diabetes mellitus in first-degree relatives, a history of poor pregnancy outcome (abortion, fetal loss), macrosomia in previous and/or index pregnancy, GDM in a previous pregnancy, pre-eclampsia, and multifetal pregnancy (16). As for the early prediction of GDM, despite much progress in identifying novel GDM biomarkers including exosomes, microRNA, and plasma fatty acid-binding protein 4 (17–19), however, lack of the availability in clinical practice leads to their limited application. To address the problems mentioned above, predicting GDM based on common risk factors has been proposed, yet most of them usually use a single variable or biomarker, resulting in the disadvantage of univariate approaches, that is, modest predictive accuracy (20). The strategy of establishing a prediction model using multiple common risk factors in early pregnancy provides a novel perspective in the economic and accurate prediction of GDM (21), as well as reducing unnecessary burdens on women without GDM by identifying low-risk women since OGTT requires multiple blood collections and is cumbersome to apply (22).
Electronic medical health records (EMHRs) are easily accessible clinical data resources (23) and have therefore been highlighted as invaluable for common data research (24) and feasible for construction of prediction models (23, 25). Regrettably, few prediction models of GDM have hitherto been established and widely accepted in clinical practice (22, 26). Here, we aimed to screen the clinical demographic and routine laboratory analysis parameters from EMHRs at the early stage of pregnancy, and then select potential variables that relevant with GDM to establish an early, cost-effective, and accurate prediction nomogram of GDM, which may serve as a novel prevention approach for GDM.
2 Material and methods
2.1 Study population and sample size calculation
This study included pregnant women for which electronic medical health record data were available at Peking University International Hospital from January 2022 to October 2022 (Figure 1). A total of 1097 women aged 18-50 years with a singleton pregnancy were initially included. We excluded samples based on the following criteria: pre-existing diabetes mellitus (n = 19); pregnancy combined with cancer and tumor (n = 4); abnormal hepatic function or renal function due to other diseases (n = 36); virus infection or carriers (n = 18); mental illness (n = 6); abortion or ovulation before OGTT (n = 21); loss of data (n = 69). This study was approved by the Medical Ethics Committee of Peking University International Hospital (No. 2016032).
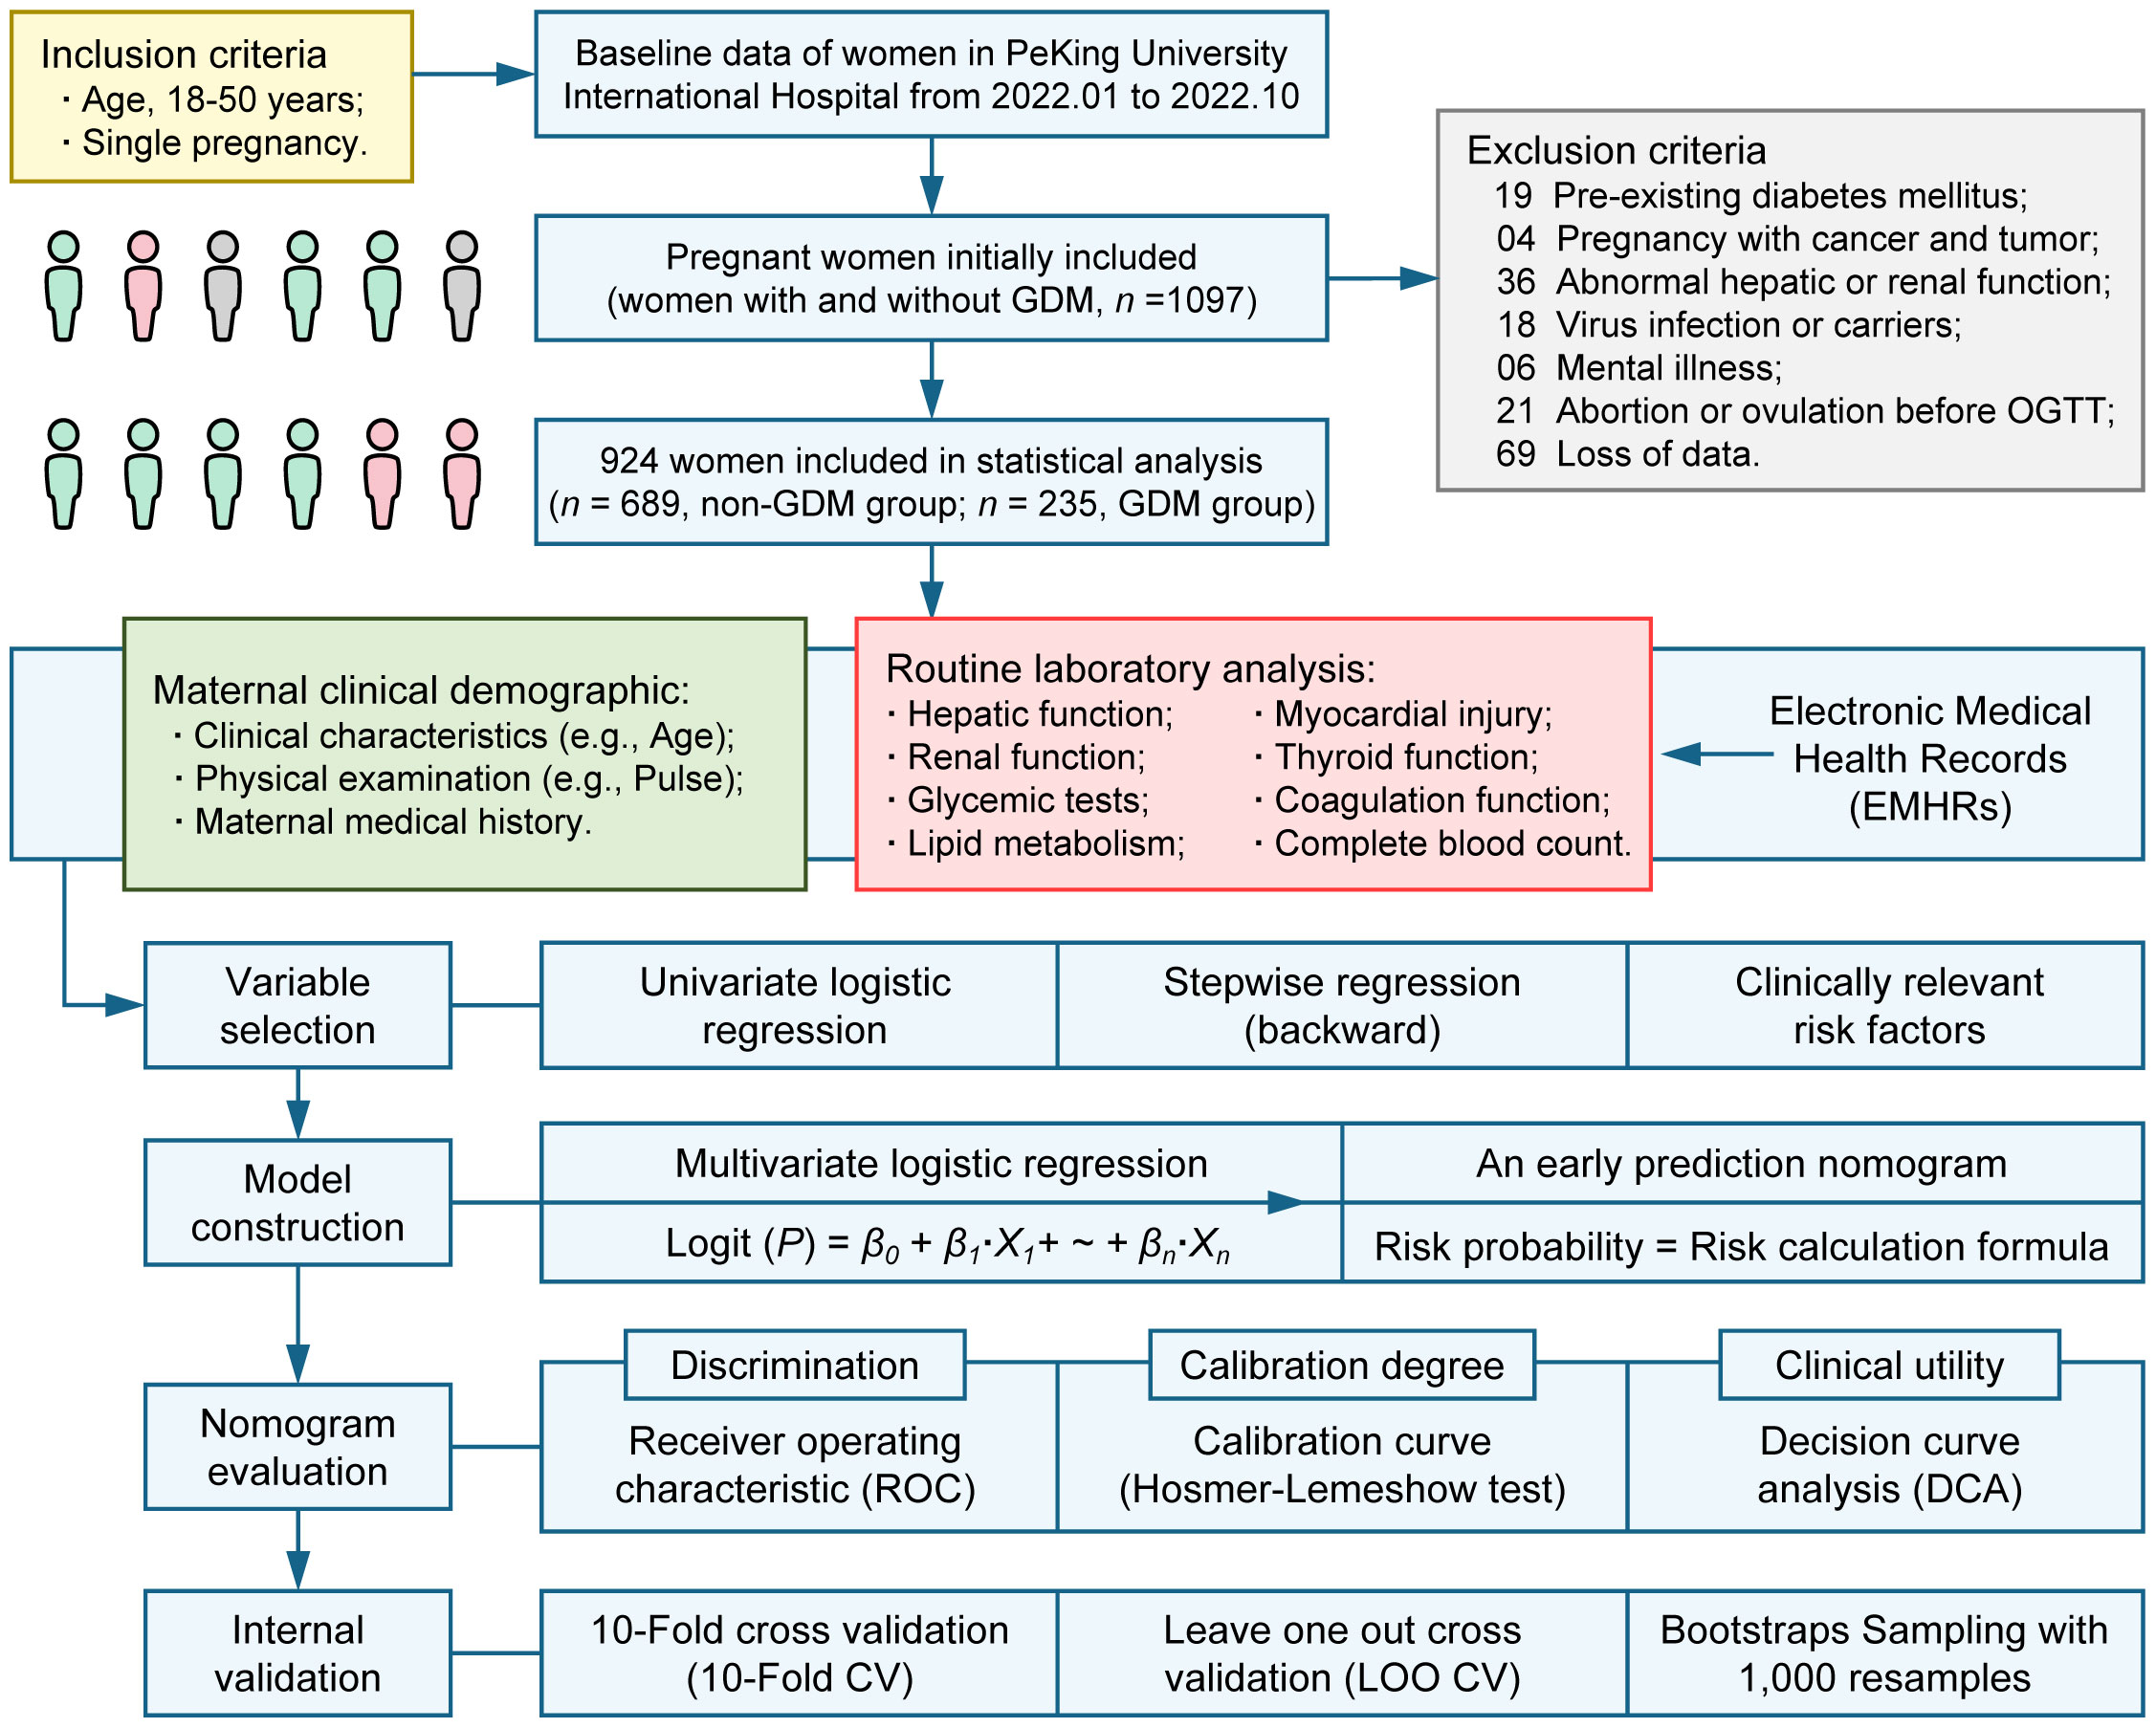
Figure 1 Study design.
According to the guideline for calculating sample size of the clinical prediction model with binary outcome, a target C-statistic, the number of predictors and the prevalence of GDM are the parameters required for sample size calculation (27). With a target C-statistic of 0.8, 12 candidate predictors and a GDM prevalence of 14.8% (3), the minimum sample size required for new model development is 664 participants (99 events) assuming 0.05 as acceptable difference between apparent and adjusted R2. Therefore, the sample size of this study met the requirements for developing a clinical prediction model with sufficient accuracy.
2.2 The diagnosis of gestational diabetes mellitus
OGTT was performed for the diagnosis of GDM at 24-28 weeks based on the International Association of Diabetes and Pregnancy Study Groups (IADPSG) guidelines (28). Pregnant women were admitted to Peking University International Hospital after 8-12 hours of fasting at 24-28 weeks of gestation. 75g of glucose powder would be dissolved in warm water and was then taken orally by pregnant women within 5 minutes. GDM cases would be diagnosed if their one or more values met the following criteria: 0-hour plasma glucose ≥ 5.1 mmol/L; 1-hour plasma glucose ≥ 10.0 mmol/L; 2-hour plasma glucose ≥ 8.0 mmol/L.
2.3 Clinical demographics parameters of pregnant women
Clinical demographics parameters at 8-12 weeks of gestation were obtained from maternal EMHRs (Table 1). (1) Basic characteristics including age, parity and gravidity, etc. in maternal the questionnaire data were recorded in their pregnancy files. (2) Physical measurement: systolic blood pressure (SBP), diastolic blood pressure (DBP) and pulse were measured. (3) Maternal medical history: history of abnormal pregnancy, cesarean delivery, GDM, and macrosomia were collected.
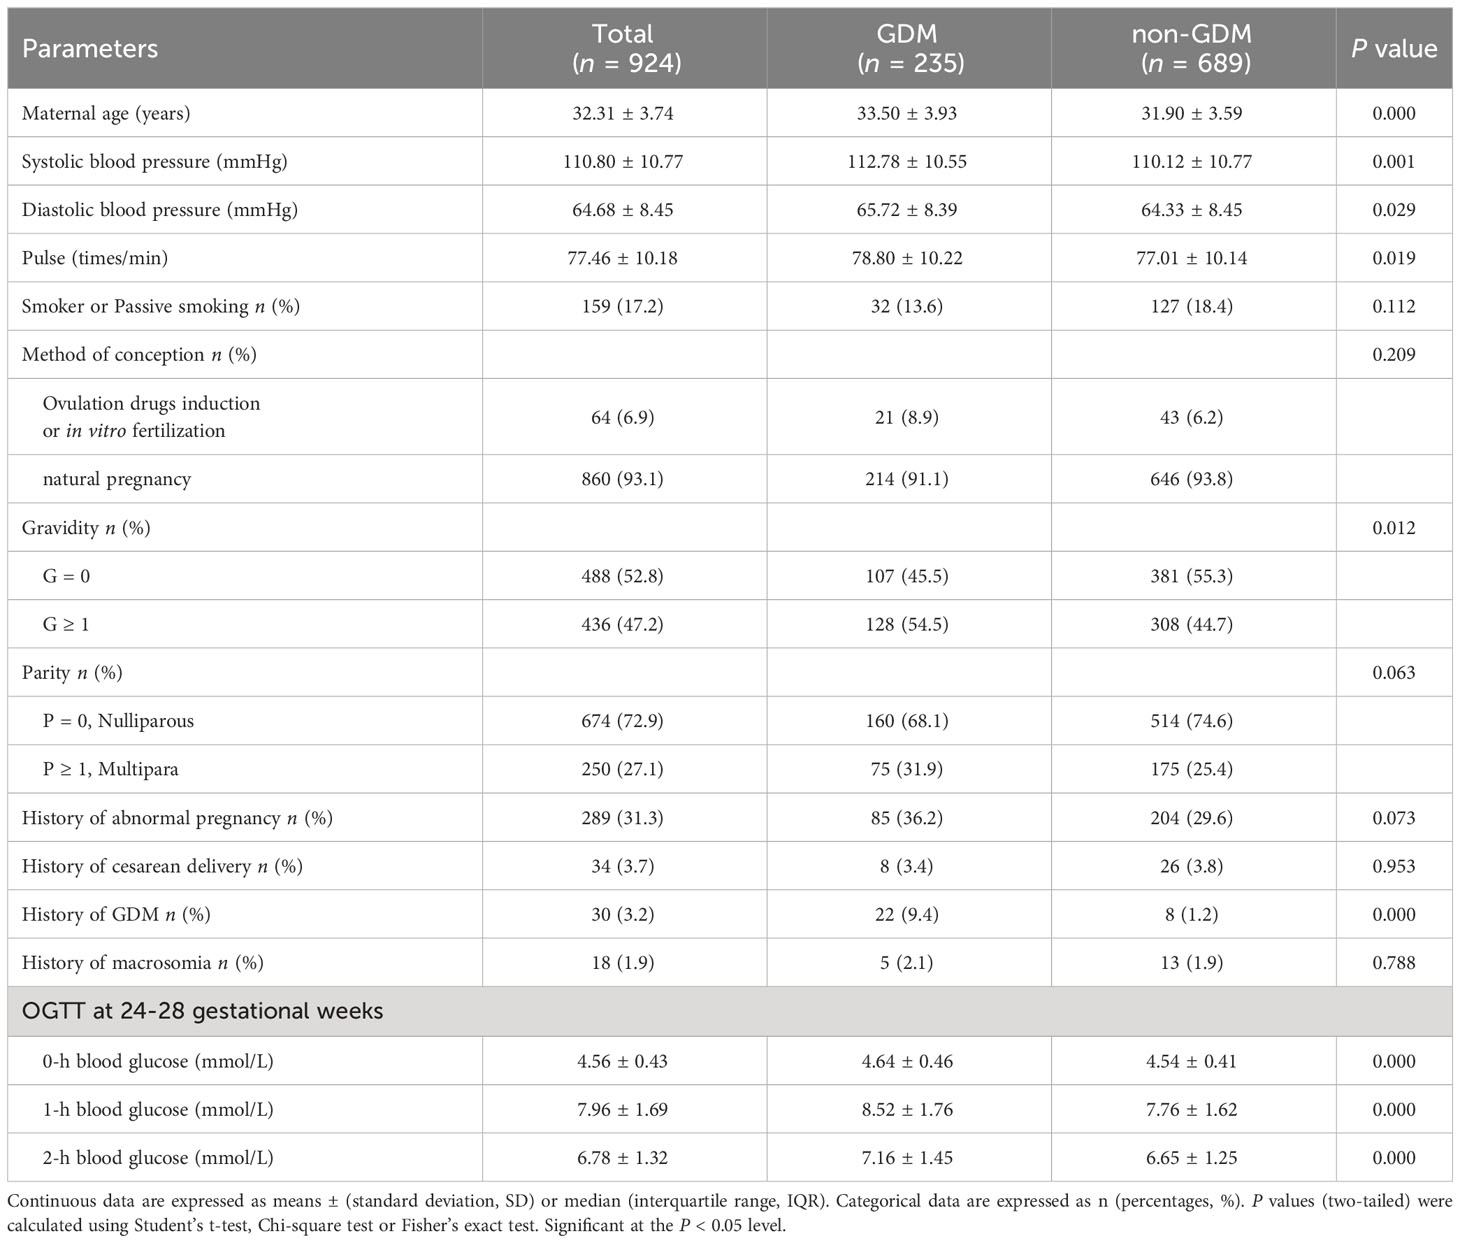
Table 1 Clinical demographics parameters of women with and without GDM in the first trimester.
2.4 Routine laboratory analysis parameters of pregnant women
Venous blood samples at 8-12 weeks of gestation were collected for routine laboratory analysis (Table 2). Laboratory measurements including: (1) hepatic function tests (Beckman AU 5800, USA); (2) renal function tests (Beckman AU 5800, USA); (3) glycemic tests (Beckman AU 5800, USA, glycated hemoglobin was measured using glycosylated hemoglobin analyzer); (4) lipid metabolism tests (Beckman AU 5800, USA); (5) myocardial injury tests (Beckman AU 5800, USA); (6) thyroid function tests (Roche Cobas E601, Switzerland), (7) coagulation function tests (Werfen ACL TOP 700, USA); (8) complete blood count (Sysmex XN-1000, Japan).
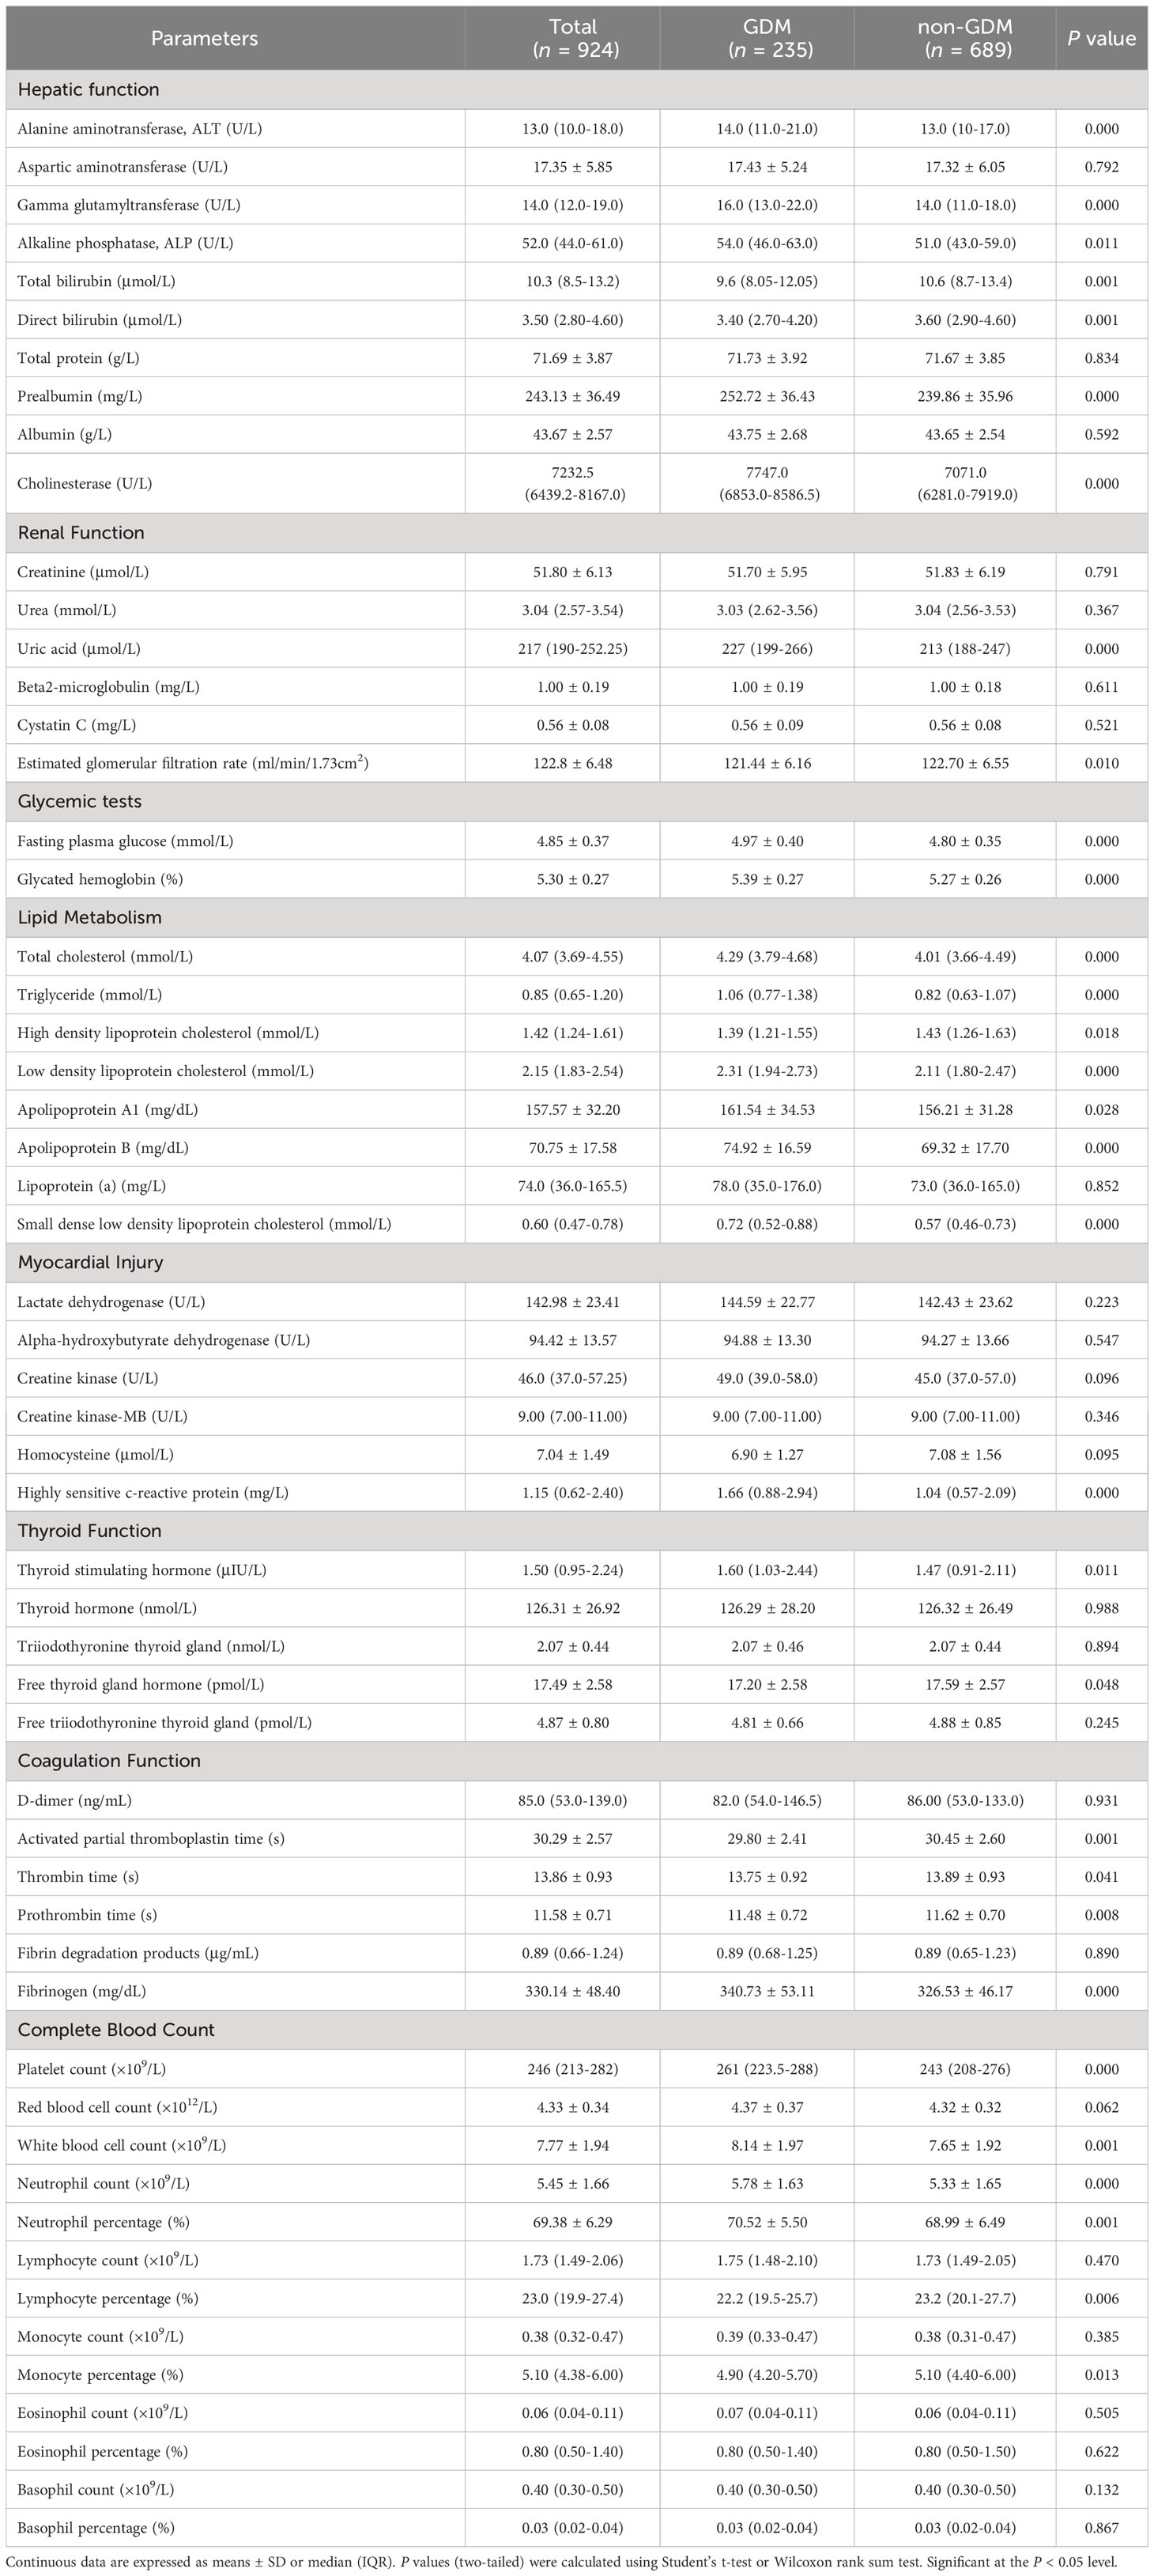
Table 2 Routine laboratory analysis parameters of women with and without GDM in the first trimester.
2.5 Statistical analysis
Continuous data with a normal distribution were expressed as mean ± (standard deviation, SD) and non-normal data as median (interquartile range, IQR). Categorical data were expressed as n (percentages, %). P values (two-tailed) were calculated using Student’s t-test or Wilcoxon rank sum test for continuous data. Chi-square test or Fisher’s exact test were used for calculating the P values (two-tailed) of categorical data. For variable selection, univariate logistic regression was used to screen candidate variables and stepwise regression (backward elimination) based on Akaike Information Criterion (AIC) was then used for further variable selection. Besides, clinically relevant risk factors were also included. For model construction, a novel nomogram based on the outcomes of multivariate logistic regression analysis was established using statistically significant predictors in the multivariate logistic regression model. For nomogram evaluation, receiver operating characteristic (ROC) analysis was performed and the area under the receiver operating characteristic curve (AUC, C-statistics) was used to evaluate the discrimination of the nomogram. We evaluated the calibration degree of the nomogram based on the agreement between predicted probability and observed probability, in addition, The Hosmer-Lemeshow test was used to assess the goodness of fit of the nomogram. The clinical utility of the nomogram was evaluated by the introduction of decision curve analysis (DCA). For internal validation, 10-Fold cross validation (10-Fold CV), Leave one out cross validation (LOO CV) and Bootstraps Sampling with 1, 000 resamples were used to evaluate the stability of the nomogram (Figure 1).
All statistical data analysis were performed using R Studio software (version 4.2.1) or GraphPad Prism software (version 9.5.0). Significant at the P < 0.05 level (*P < 0.05, **P < 0.01, ***P < 0.001).
3 Results
3.1 Baseline characteristics of women with and without GDM in the first trimester
In total, we included 235 instances of GDM pregnant women and 635 cases of non-GDM pregnant women in this study, the incidence of GDM was 25.43% (Figure 1). The candidate variables were collected for each pregnant women in the study. For clinical demographics parameters (Table 1), the average age, systolic blood pressure, diastolic blood pressure, and pulse of GDM women were significantly higher than non-GDM women (all P < 0.05). Despite GDM cases had higher gravidity ≥ 1 percentage and multipara rate than non-GDM cases, the difference of multipara rate between two groups didn’t reach statistically significance (P = 0.063). The percentage of women with previous GDM (Pre-GDM) was significantly higher in GDM group (9.4% vs. 1.2%, P < 0.001).
As for routine laboratory analysis parameters (Table 2), GDM cases had higher alanine aminotransferase (ALT), gamma glutamyltransferase (GGT), alkaline phosphatase (ALP), prealbumin (PA), cholinesterase (CHE) but lower total bilirubin (TBIL), direct bilirubin (DBIL) in hepatic function tests (all P < 0.05). In renal function tests, the levels of uric acid (UA) and estimated glomerular filtration rate (eGFR) were also higher in women with GDM (all P < 0.05). The fasting plasma glucose (FPG) and glycated hemoglobin (HbA1c) were both higher in GDM group than those in non-GDM group (all P < 0.001). In lipid metabolism tests, in addition to lower high density lipoprotein cholesterol (HDL-C) in GDM group, parameters including total cholesterol (TC), triglyceride (TG), low density lipoprotein cholesterol (LDL-C), apolipoprotein A1 (apo-A1), apolipoprotein B (apo-B) and small dense low density lipoprotein cholesterol (sdLDL-C) were higher in GDM group (all P < 0.05). Only the difference of highly sensitive c-reactive protein (hs-CRP) levels between GDM group and non-GDM group in the myocardial injury tests showed statistical significance (P < 0.001). In thyroid function tests, higher thyroid stimulating hormone (TSH) and lower free thyroid gland hormone (FT4) were observed in GDM group (all P < 0.05). In coagulation function tests, GDM cases had shorter activated partial thromboplastin time (APTT), thrombin time (TT), prothrombin time (PT), and increased fibrinogen (all P < 0.05). In complete blood count tests, increased platelet count (PLT), white blood cell count (WBC), neutrophil count (NC), neutrophil percentage (NP) and decreased lymphocyte percentage (LP), monocyte percentage (MP) were found in women with GDM (all P < 0.05).
3.2 Predictors setting for multivariate logistic regression model
Initially, univariate logistic regression was performed for all clinical demographics and routine laboratory analysis parameters to screen potential GDM-related variables. With 34 statistically significant variables in the univariate logistic regression analysis, ROC analysis was simultaneously performed using GraphPad Prism to get a glimpse of the diagnostic value of these variables (Table 3). CHE, TG and sdLDL-C were the markers with the highest AUC among these variables. The AUC of each variable was lower than 0.7 indicating that the diagnostic value of single variable was limited. Stepwise regression (backward) was then used for further variable selection. Additionally, clinically relevant risk factors were included. The 12 selected predictors were as follows: Maternal age (33.50 vs. 31.90, P < 0.001), Pre-GDM (9.4% vs. 1.2%, P < 0.001), CHE (median, 7747.0 vs. 7071.0, P < 0.001), GGT (median, 16. vs. 14.0, P < 0.001), FPG (4.97 vs. 4.80, P < 0.001), HbA1c (5.39 vs. 5.27, P < 0.001), TC (median, 4.29 vs. 4.07, P < 0.001), sdLDL-C (median, 0.72 vs. 0.57, P < 0.001), TSH (median, 1.60 vs. 1.47, P < 0.05), APTT (29.80 vs. 30.45, P < 0.001), PLT (median, 261 vs. 243, P < 0.001), LP (median, 22.2% vs. 23.2%, P < 0.01) (Figures 2A–F, left panel). ROC analysis was performed for the continuous variables among these predictors (Figures 2A–F, right panel), and all predictors had limited diagnostic value when applied individually.
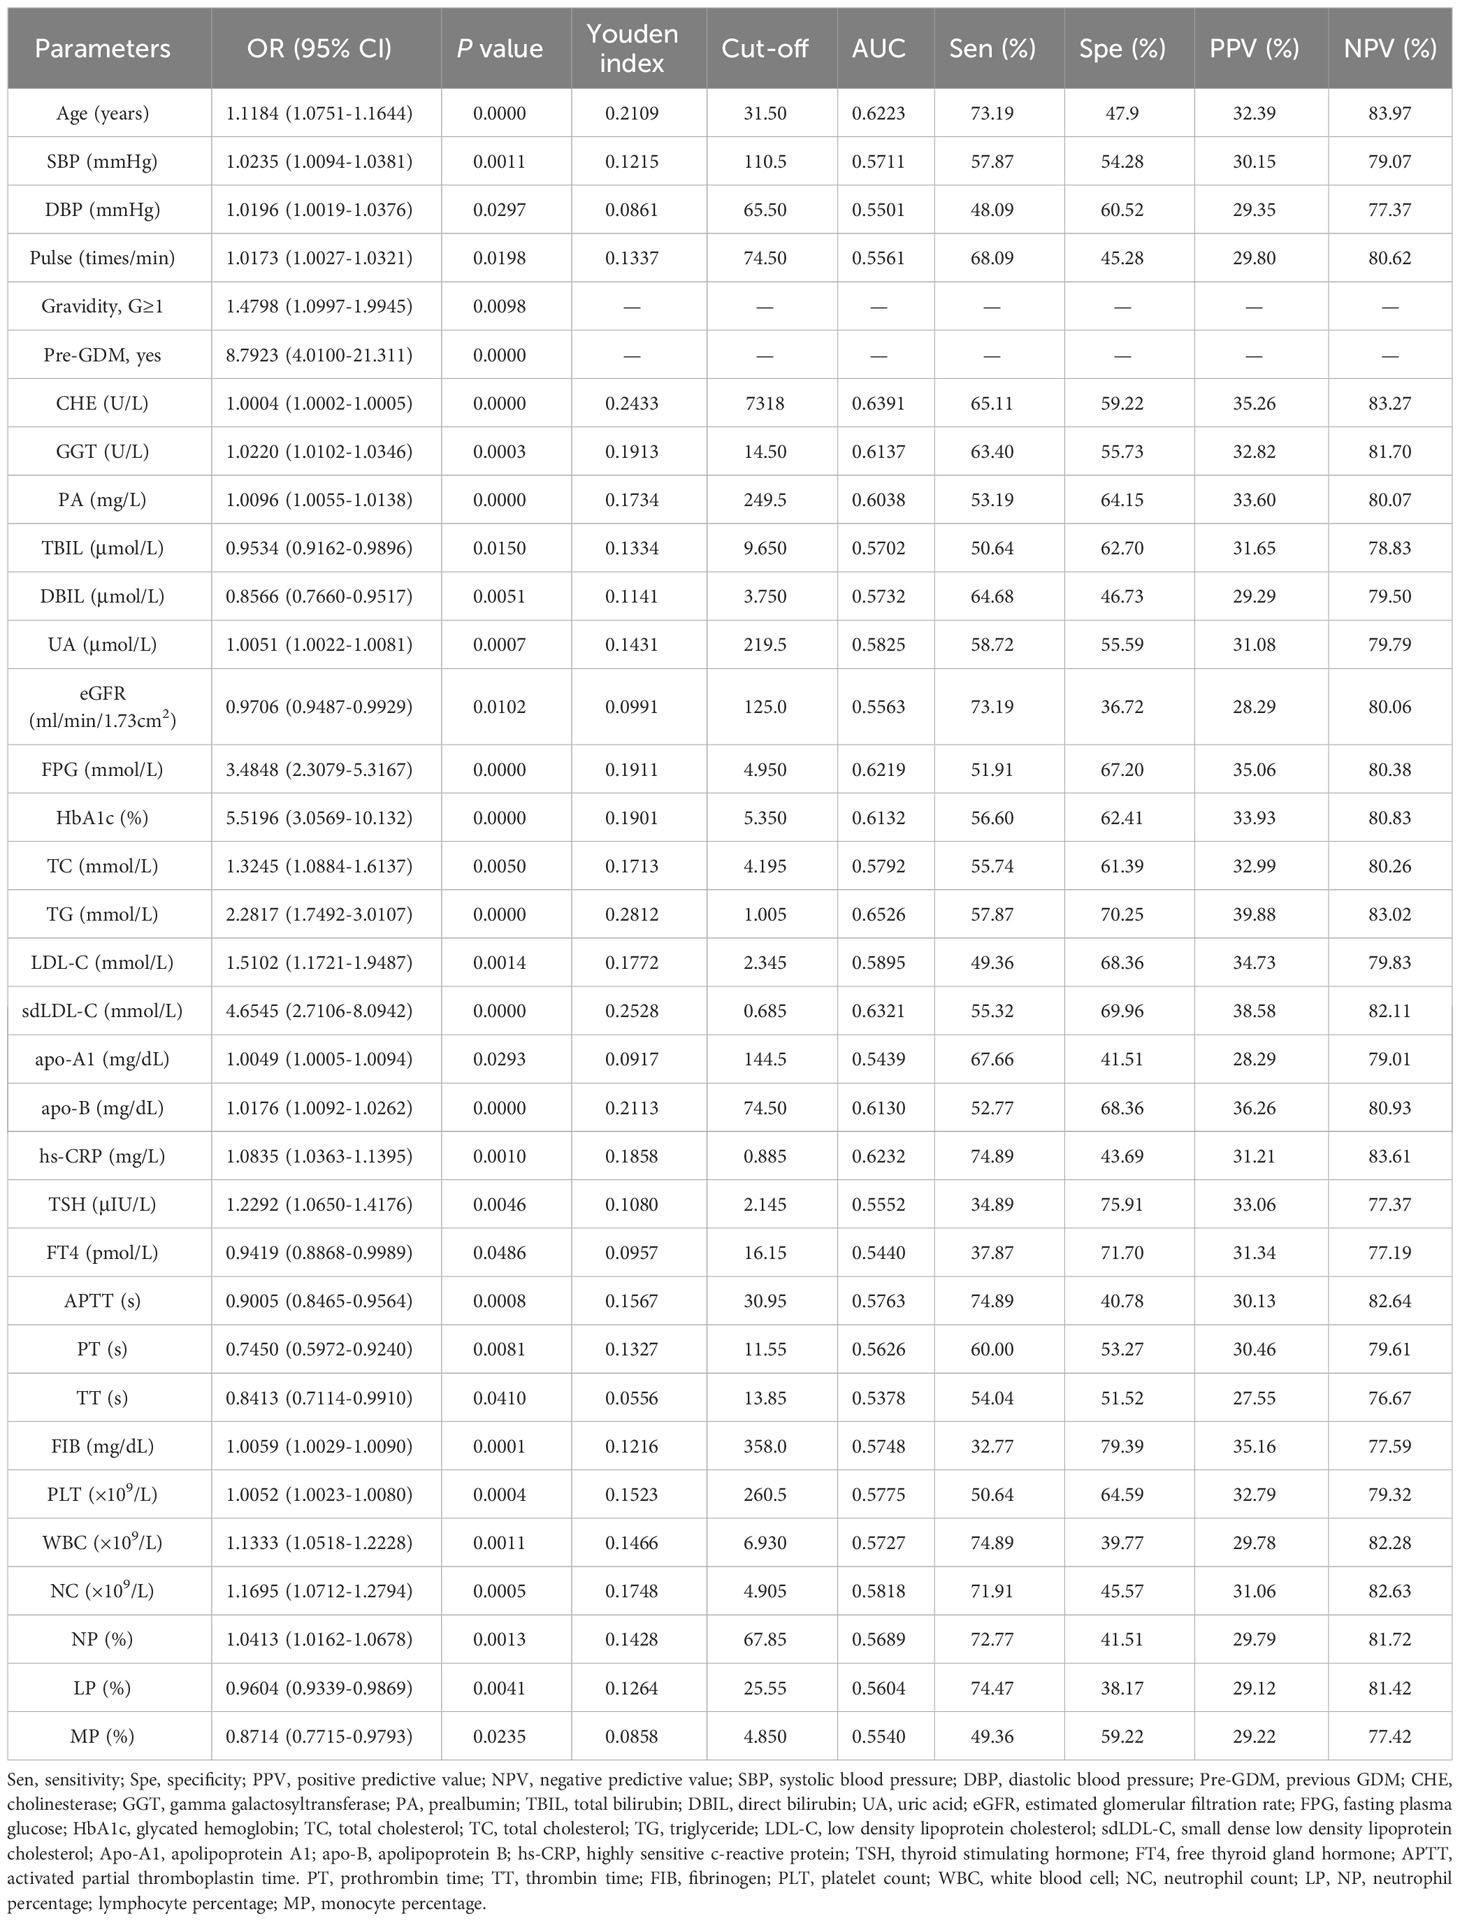
Table 3 Results of univariate logistic regression and ROC analysis for the statistically significant variables.
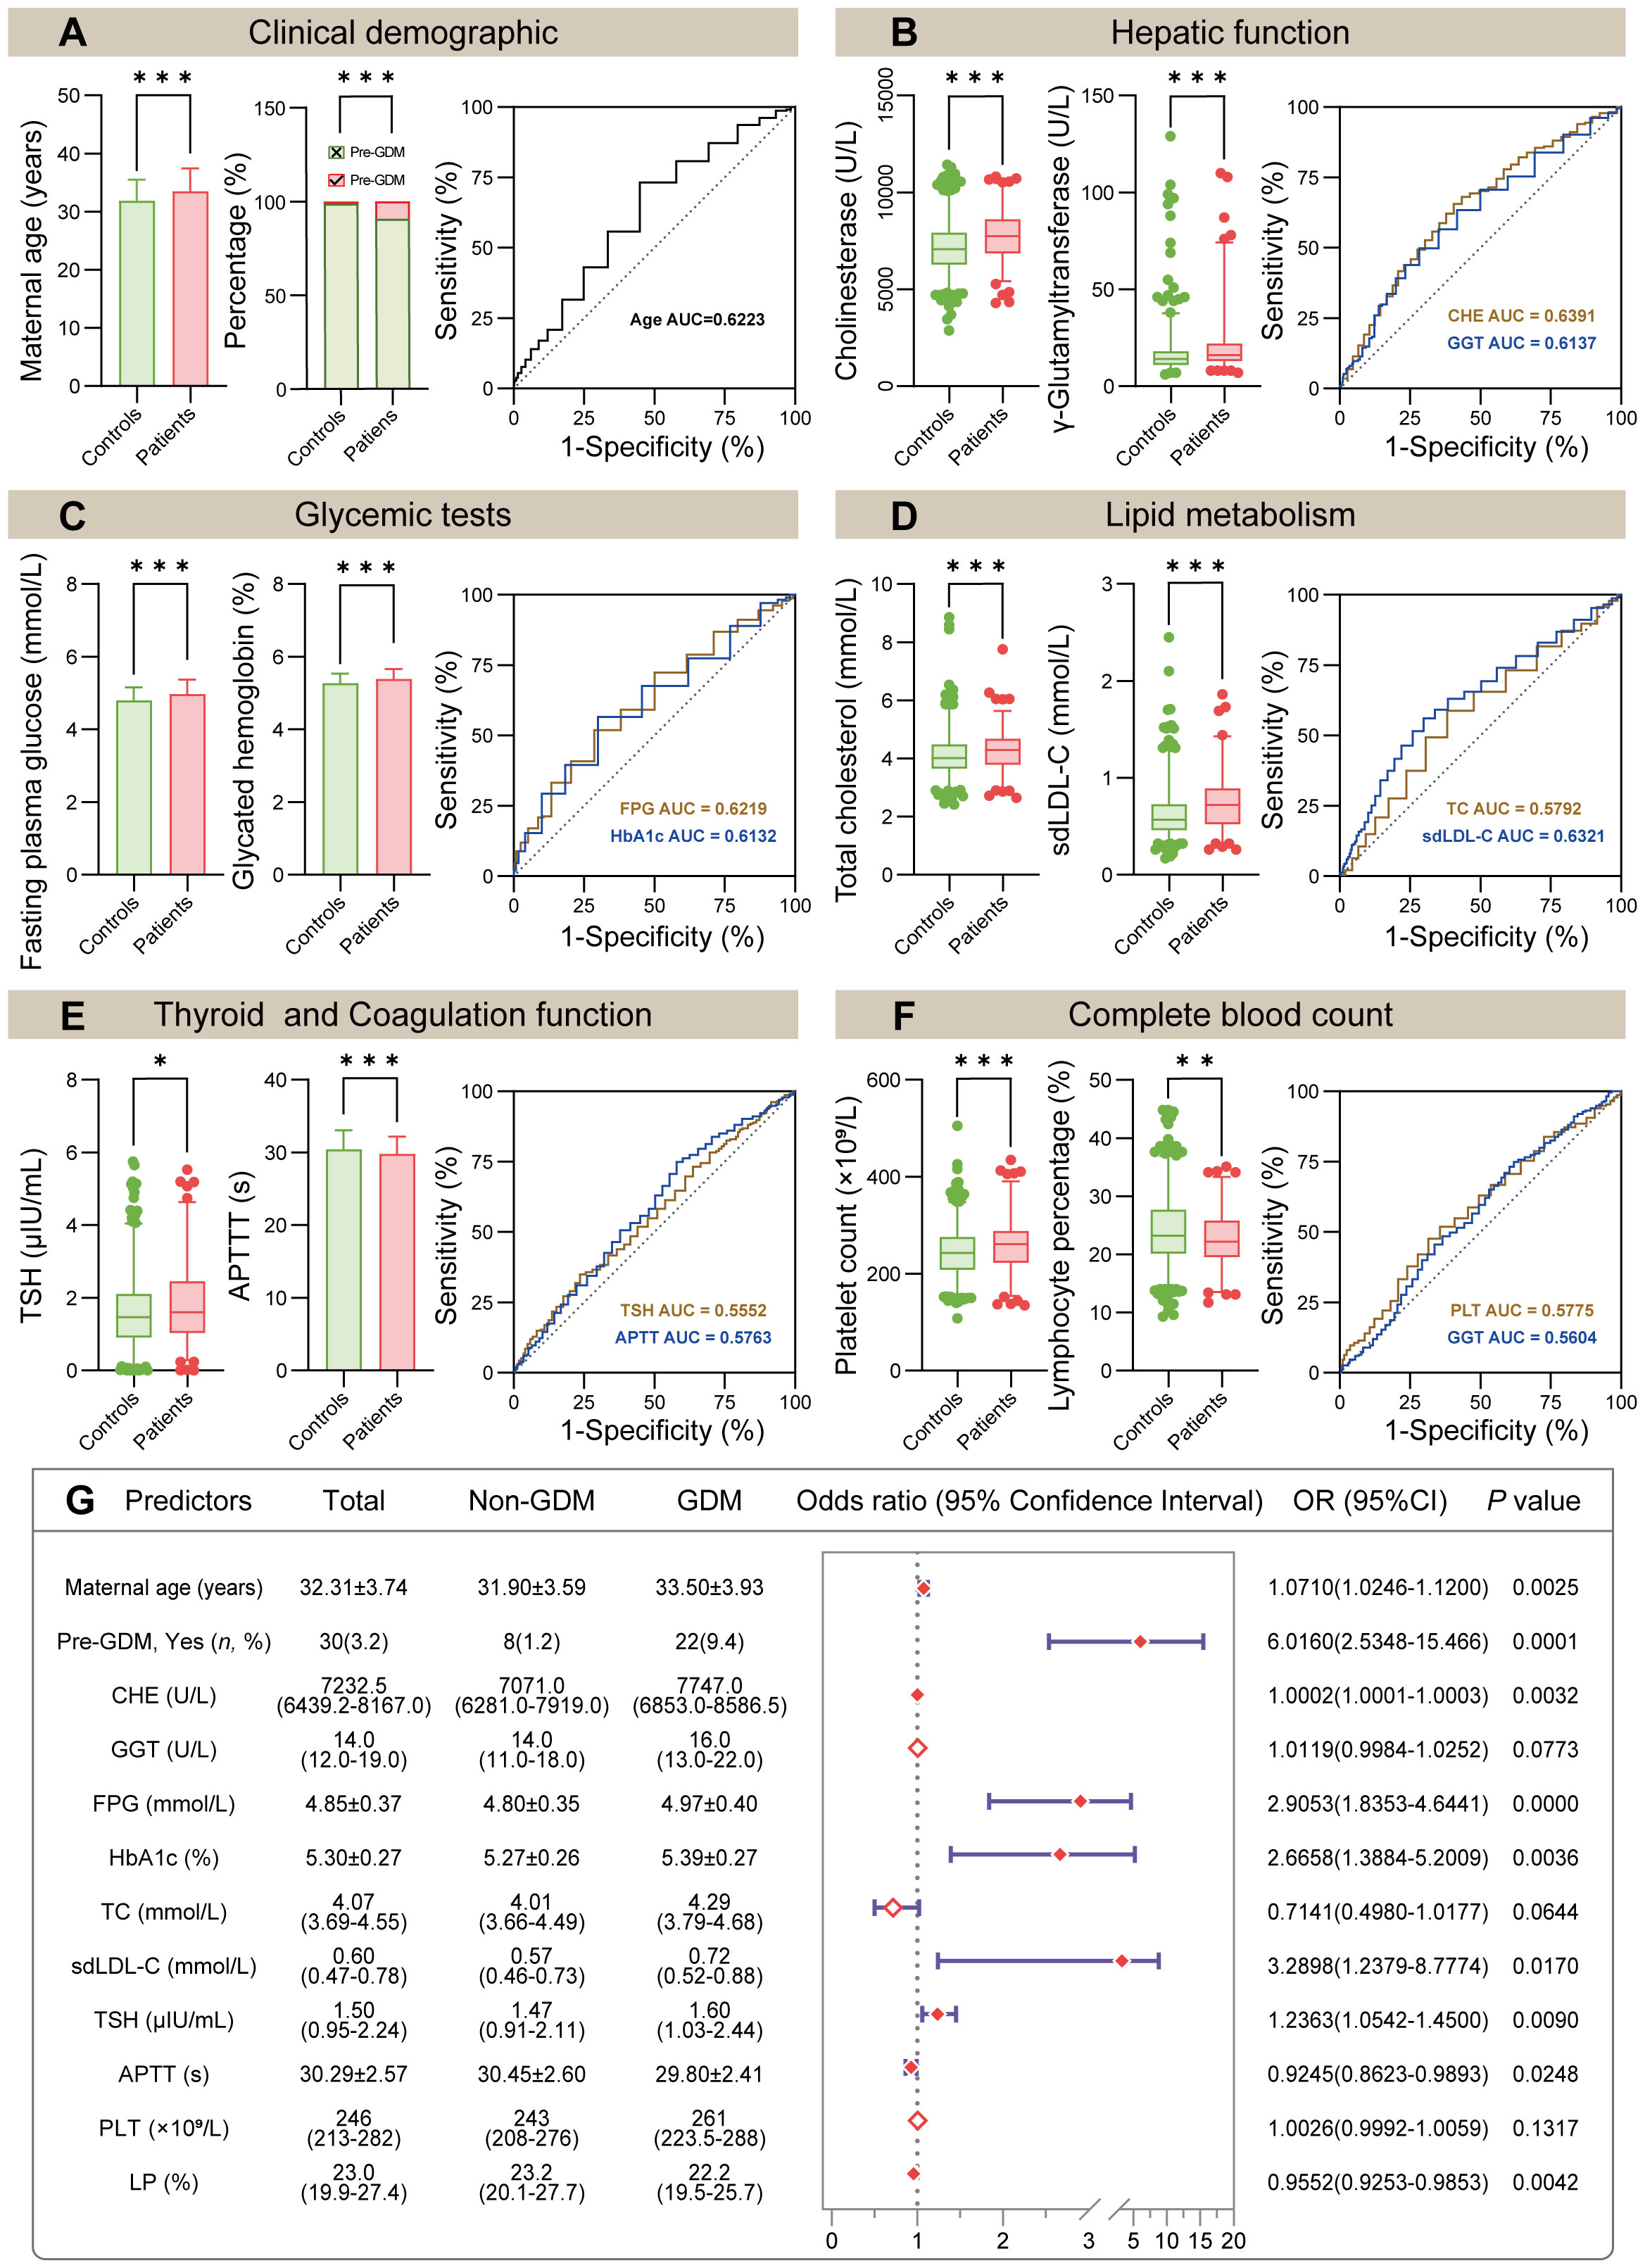
Figure 2 Comparison of initially selected predictors and model construction. (A–F) Comparison of 12 selected predictors between non-GDM group and GDM group (left panel). The ROC curve showed the AUC of indicated predictors (right panel, the detailed ROC analysis shown in Table 3). (G) Forest plot of multivariate logistic regression analysis based on the 12 predictors mentioned above. Abbreviations: Pre-GDM, previous GDM; CHE, cholinesterase; GGT, gamma glutamyltransferase; FPG, fasting plasma glucose; HbA1c, glycated hemoglobin; TC, total cholesterol; sdLDL-C, small dense low density lipoprotein cholesterol; TSH, thyroid stimulating hormone; APTT, activated partial thromboplastin time; PLT, platelet count; LP, lymphocyte percentage. In (A–F), P values (two-tailed) were calculated using Student’s t-test, Wilcoxon rank sum test or Chi-square test (*P < 0.05, **P < 0.01, ***P < 0.001).
3.3 Establishment of a novel nomogram based on multivariate logistic regression model
Multivariate logistic regression model was constructed using 12 selected predictors. The final model equation was Logit (P) = -12.48 + 0.069 × Age (years) + 1.794 × Pre-GDM (yes vs. no) + 0.0002 × CHE (U/L) + 1.067 × FPG (mmol/L) + 0.9805 × HbA1c (%) + 1.191 × sdLDL-C (mmol/L) + 0.212 × TSH (μIU/L) + -0.079 × APTT (s) + -0.046 × LP (%). As shown in the forest plot, the odds ratio (OR) of 9 predictors and their 95% confidence interval (95% CI) were as follows: Age (OR 1.0710, 95% CI 1.0246-1.1200, P = 0.0025), Pre-GDM (yes vs. no, OR 6.0160, 95% CI 2.5348-15.466, P = 0.0001), CHE (OR 1.0002, 95% CI 1.0001-1.0003, P = 0.0032), FPG (OR 2.9053, 95% CI 1.8353-4.6441, P < 0.0001), HbA1c (OR 2.6658, 95% CI 1.3884-5.2009, P = 0.0036), sdLDL-C (OR 3.2898, 95% CI 1.2379-8.7774, P = 0.0170), TSH (OR 1.2363, 95% CI 1.0542-1.4500, P = 0.009), APTT (OR 0.9245, 95% CI 0.8623-0.9893, P = 0.0248), LP (OR 0.9552, 95% CI 0.9253-0.9853, P = 0.0042) (Figure 2G; Table 4). Based on the predictors that were statistically significant in the multivariate logistic regression model, a novel nomogram was established (Figure 3). The risk factors in our model were as follows, Age, Pre-GDM(yes), CHE, FPG, HbA1c, sdLDL-C, and TSH.
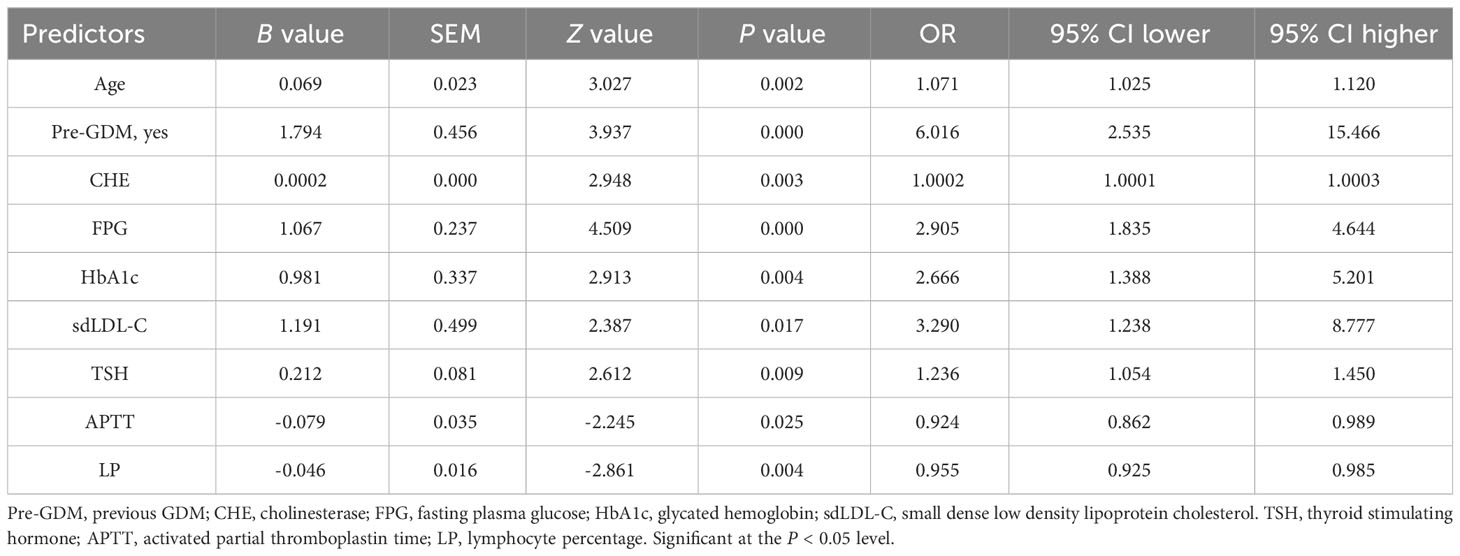
Table 4 Results of multivariate logistic regression analysis.
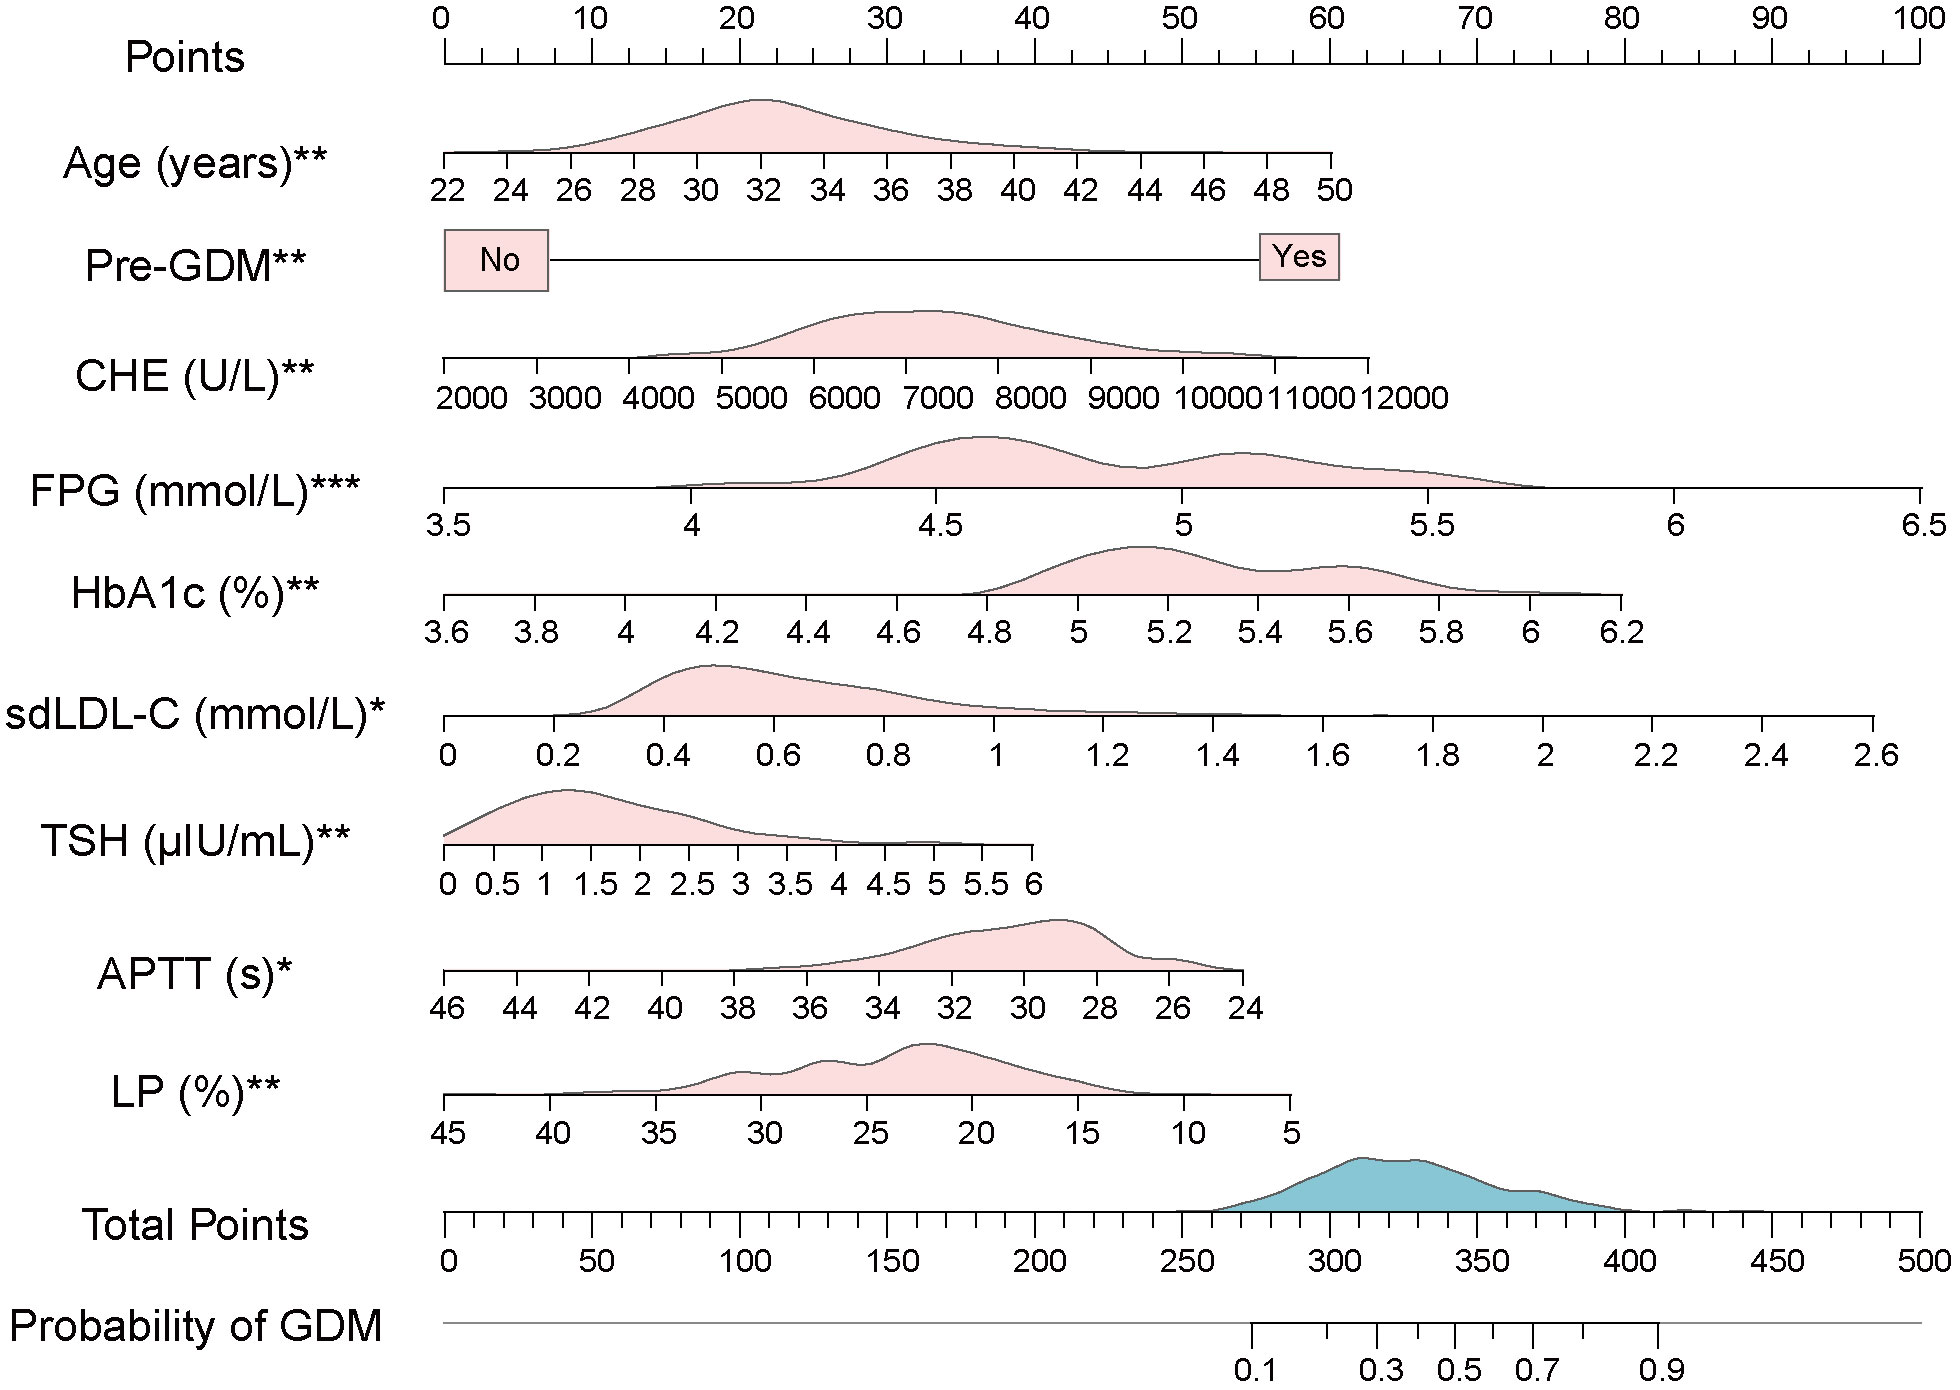
Figure 3 A novel nomogram based on multivariate logistic model. The value of each variable of pregnant women was placed on the corresponding points of the axis. The points on each row were aligned with the points on the top point scale to calculate the total points. The total score was then used to determine the risk probability of GDM. The pink area on the axis represents the distribution of the corresponding variable. The blue area on the axis shows the distribution of Total Points. Abbreviations: Pre-GDM, previous GDM; CHE, cholinesterase; FPG, fasting plasma glucose; HbA1c, glycated hemoglobin; sdLDL-C, small dense low density lipoprotein cholesterol; TSH, thyroid stimulating hormone; APTT, activated partial thromboplastin time; LP, lymphocyte percentage. Significant at the P < 0.05 level (*P < 0.05, **P < 0.01, ***P < 0.001).
For the usage of the nomogram, pregnant women or clinicians only need to collect the value of each variable in the first-trimester pregnancy and place them on the points of corresponding axes. The points on each row were then aligned with the points on the top point scale to calculate the total points. The total points were finally used to determine the risk probability of GDM (Figure 3). For example, participant No. 1 in our data set had the age of 38 (years), no previous GDM, CHE of 8320 (U/L), FPG of 5.3 (mmol/L), HbA1c of 5.7 (%), sdLDL-C of 0.94 (mmol/L), TSH of 0.503 (μIU/L), APTT of 27 (s), and LP of 30.1 (%). To this participant, a total point of 304.57 and a risk probability of 27.71% were calculated using the established nomogram. This pregnant woman was therefore judged as GDM by the Cut-off value (24.58%, Cut-off value was shown in Figure 4A), which was in line with her actual state.
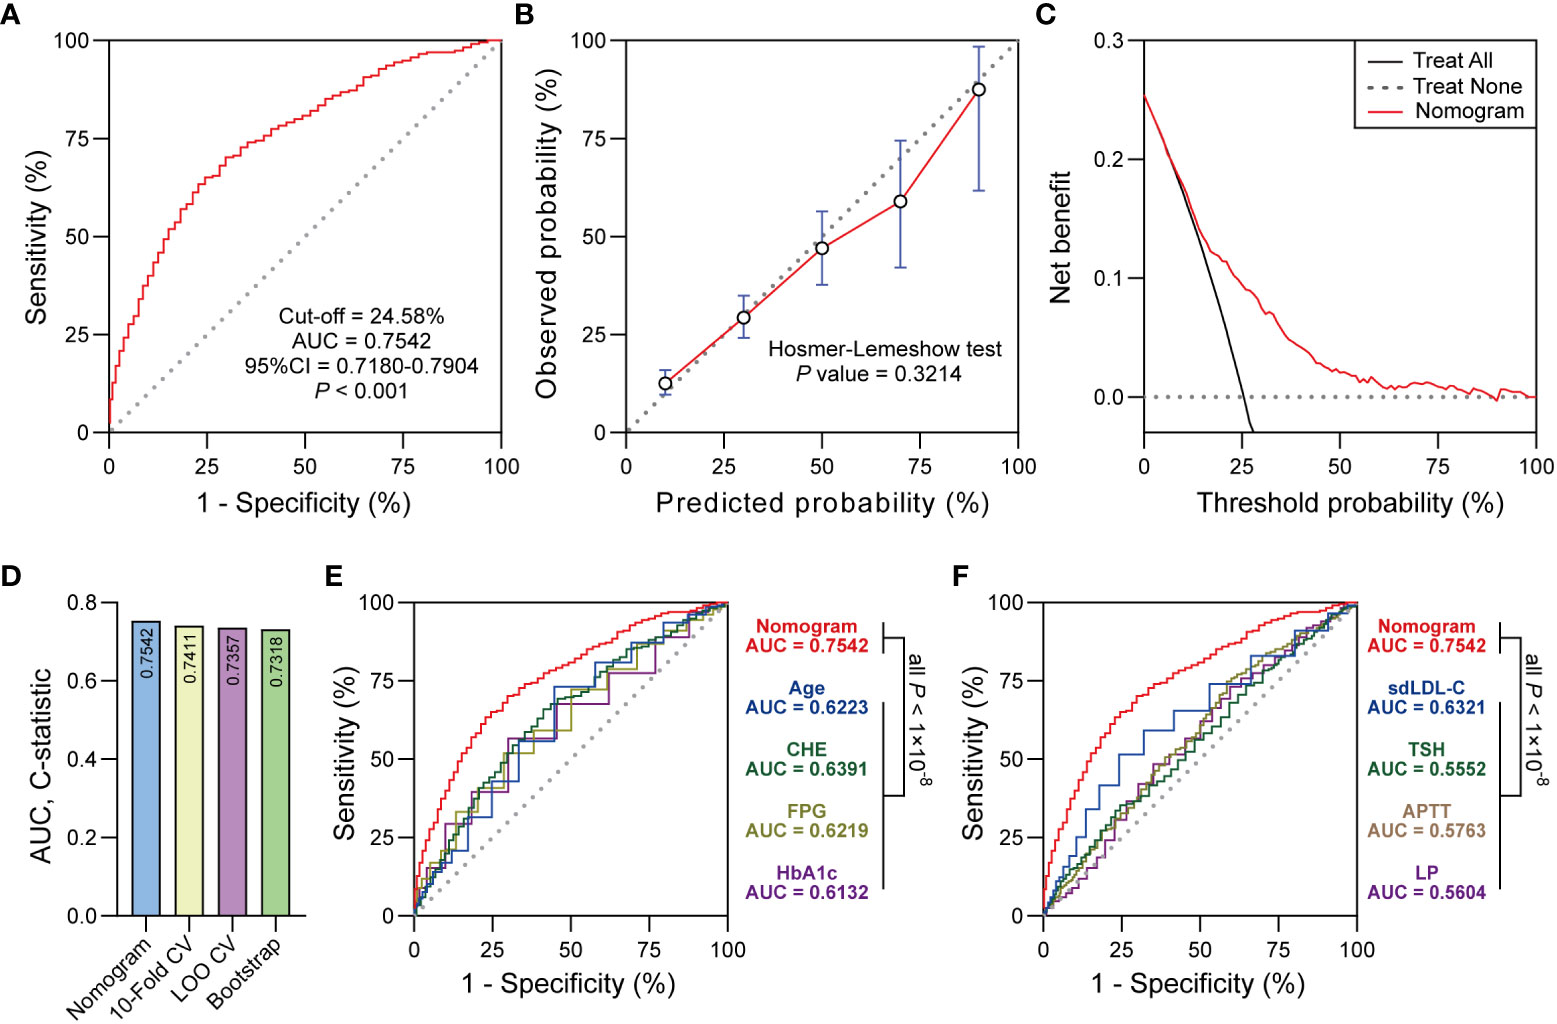
Figure 4 (A) ROC curve showed the discrimination of the nomogram. (B) The calibration curve showed the agreement between predicted probabilities and observed probabilities. (C) Decision curve analysis (DCA) showed the clinical utility of the nomogram. (D) 10-Fold CV, LOO CV and Bootstrap were performed for internal validation. (E, F) Delong test was used to compare the AUC between nomogram and predictors in the nomogram. Significant at the P < 0.05 level.
3.4 Nomogram evaluation and internal validation
The ROC curve derived from the nomogram achieved powerful discrimination (Cut-off = 24.58%, AUC = 0.7542, 95% CI 0.7180-0.7904, P < 0.001, Figure 4A). When the optimal threshold was 24.58%, the AUC of the nomogram was 0.7542 which was higher than any predictor in the nomogram according to the Delong test (Figures 4E, F). The sensitivity (Sen), specificity (Spe), positive predictive value (PPV), negative predictive value (NPV), and Youden Index of the nomogram were 70.21%, 70.54%, 44.84%, 87.41%, and 0.4075, respectively. The calibration curve indicated the acceptable agreement between the predicted values from the nomogram and the actual values from the observation (Hosmer-Lemeshow test, P = 0.3214, Figure 4B). In terms of the clinical utility, decision curve analysis showed the positive net benefit of the nomogram among majority of threshold probabilities (Figure 4C). Furthermore, with the C-statistics of 0.7411, 0.7357 and 0.7318 from 10-Fold CV, LOO CV and Bootstrap, respectively, the internal validation indicated the stability of the nomogram, which revealed the good predictive reproducibility of the nomogram among the modeling data set (Figure 4D).
4 Discussion
In recent years, the number of studies aimed at developing risk prediction models for GDM has increased along with the increased incidence of GDM. However, most of them used well-known risk factors for GDM as predictors of the models (e.g., age and pre-pregnancy body mass index) (29–31). This may result in the ineffective use of GDM-related serological indicators. Here, a novel nomogram integrating several common risk factors from EMHRs, in particular serological indicators, was established, which significantly improved the predictive performance compared to single markers. The predictors in the nomogram were found to be associated with previous clinical studies. With this inspiration, systematic description of these risk factors was as follows.
Previous studies have shown that severe insulin resistance increased with advancing age (32, 33). Pregnant women of advanced age faced with adverse changes in the number of insulin receptors and the insulin receptor signaling pathway, leading to insulin resistance and pancreatic β-cell defects, which increased the risk of GDM (33). Additionally, women with advanced age tend to be obese, and notably obesity might be the strongest known risk factor for GDM (34). Consistent with these, maternal age was observed to be a risk factor in our model (OR 1.0710, 95% CI 1.0246-1.1200). With the promotion of three-child policy in China, the number of elder pregnant women will increase rapidly in the future, and the incidence of GDM may rise as well. Thus, early prediction or screening of GDM should be performed for these pregnant women and timely interventions should be taken to reduce the incidence of GDM.
Of all the risk factors for recurrent GDM, Pre-GDM has been reported as a strong risk factor for up to 84% of GDM recurrences (8). Likewise, Pre-GDM had an adjusted OR of 6.0160 (95% CI 2.5348-15.466) in our multivariate logistic analysis. These are reminiscent of the recurrence of GDM may be associated with the genetics of GDM. Indeed, single-nucleotide polymorphisms (SNPs) in several genes were found to be involved in the regulation of insulin secretion and associated with the increased risk of GDM (35). This suggests that pregnant women with a history of GDM should be more aware of their blood glucose levels during pregnancy to avoid the recurrence of GDM.
The liver, an organ essential for maintaining glucose homeostasis and insulin resistance, plays an important role in the pathogenesis of metabolic diseases (36). Cholinesterase, which is synthesized in the liver and released into the blood to catalyze the hydrolysis of acetylcholine, etc., is a sensitive indicator of liver synthesis (37). A previous study showed that about 22% of patients with T2DM had abnormal liver function and increased CHE activity (38). Likewise, with an AUC of 0.6391 and an adjusted OR of 1.0002 in our ROC and multivariate logistic analysis, respectively, CHE was found to have elevated levels in GDM women. Most previous studies have focused on the association between CHE and T2DM, to our knowledge, the role of CHE in GDM remains unknown. Increased activity of CHE has been reported to be associated with insulin resistance in T2DM by regulating acetylcholine (39, 40). Specifically, in patients with T2DM combined with hyperlipidemia, the synthesis and transfer of fatty acids increased, leading to the upregulation of acylcholine (e.g., acetylcholine and butyrylcholine, both of which are substrates for serum). Thus, the elevated CHE levels may be caused by the substrate-induced increase in hepatic synthase (41). The increased activity of CHE in turn led to a decrease in acetylcholine, and the decrease in acetylcholine blocked the increase in intracellular Ca2+, negatively affecting the signaling pathway of blood glucose regulation after insulin binding to insulin receptors, thus causing insulin resistance (40, 41). It is worth noting that patients with diabetes mellitus may benefit from CHE inhibitors as these could reduce mortality and contribute to diabetes self-management (42). Given that GDM and T2DM share a similar pathogenesis, the mechanisms of CHE in developing and progressing GDM should be investigated in the future.
It was hypothesized that FPG levels in early pregnancy may not be able to accurately predict GDM before OGTT since FPG reflects blood glucose in a short term (43). However, it has also been suggested that FPG is simple and convenient to apply, and that high levels of FPG in the first trimester may predict GDM, although with limited accuracy (44). As for current study, FPG reached an AUC of 0.6219 when the threshold was 4.950 in our ROC analysis, and was found to be as a strong risk factor for GDM in our model (adjusted OR 2.9053, 95% CI 1.8353-4.6441). Notably, although the accuracy of single FPG was limited, FPG tests were advised for pregnant women to avoid pre-pregnancy diabetes mellitus (10). Besides, higher FPG levels in early pregnancy, even within the non-diabetic reference interval, increased the risk of adverse pregnancy outcomes (45). Unlike FPG, HbA1c indicates the average blood glucose levels over the last 8 to 12 weeks (46). It was suggested that high levels of HbA1c in the first trimester significantly increased the risk of GDM and was therefore useful for early prediction of GDM (47). Regrettably, the predictive accuracy of both FPG and HbA1c was limited when applied individually in our study. Encouragingly, our nomogram combining FPG and HbA1c with other risk factors has improved the prediction performance.
Pregnant women with higher lipid levels increased the risk of GDM, and the levels of sdLDL-C were slightly higher in women with GDM than in those without GDM (48, 49). It was reported that sdLDL-C was positively correlated with lipid levels and insulin resistance (50), suggesting that the increased risk of GDM may be associated with elevated levels of sdLDL-C. Indeed, higher sdLDL-C levels in early pregnancy were considered to have a significant predictive value for GDM (31). In line with these studies, our results confirmed that elevated sdLDL-C levels increased the risk of GDM (adjusted OR 3.2898, 95% CI 1.2379-8.7774). Thus, sdLDL-C may be an excellent marker of lipid metabolism for predicting GDM.
Thyroid function has a regulatory role in glucose metabolism and pancreatic function, characterized by the fact that the normal regulation of glucose can be disturbed by either deficient or excessive thyroid hormones (51). Indeed, it was suggested that higher TSH levels in early pregnancy, even within the normal reference range, increased the risk of GDM (52). Consistently, we found that elevated TSH levels were associated with the incidence of GDM (adjusted OR 1.2363, 95% CI 1.0542-1.4500). TSH has been reported to bind to receptors on adipocytes, leading to differentiation and proliferation of adipocytes (53), and translocated adiposity was strongly associated with the development of insulin resistance (54). This may explain the association between TSH and GDM found in our model and previous studies.
In terms of coagulation function, it has been reported that the endothelial damage caused by the hyperglycaemic state activated the internal coagulation system in women with GDM (55). It was noted that the coagulation function of pregnant women was enhanced from mid-pregnancy to reduce the risk of postpartum haemorrhage, known as physiological hypercoagulability (56). In addition, hypercoagulability was more likely to be found in women with GDM than in normal women during the same pregnancy (55). Confirming these, APTT, which reflects the state of the internal coagulation pathways, was shorter in women with GDM in our study (29.80 vs. 30.45, P < 0.001). It was thus suggested that, at least from the perspective of our study, differences in coagulation between GDM women and non-GDM women may occur in early pregnancy rather than in mid-pregnancy. Therefore, early monitoring of coagulation function indicators, especially APTT, may be useful in predicting GDM.
Although the etiology and pathogenesis of GDM are not fully explicit, studies have shown that inflammatory responses increased the risk of GDM (57, 58). As abnormal WBC indicate the inflammatory state, and elevated levels of WBC have been found in women with GDM, WBC may serve as a good predictive biomarker for GDM (57). In addition, elevated NC in the first trimester was found to be closely correlated with the development of maternal GDM and adverse pregnancy outcomes (59). Likewise, in our study, higher WBC and NC were observed in GDM women rather than in non-GDM women. Intriguingly, lymphocyte percentage, the predictor in our model as well as a type of peripheral WBC, was lower in women with GDM (median, 22.2% vs. 23.2%, P < 0.01) and had an adjusted OR of 0.9552 (95% CI 0.9253-0.9853). One likely scenario was that the increased NC was juxtaposed with the decreased lymphocyte count, leading to the increased neutrophil-to-lymphocyte ratio (NLR). Indeed, elevated NLR was found in GDM women due to the long-term chronic inflammatory state (60). Aberrant expression of inflammatory mediators promoted oxidative stress damage, leading to the apoptosis of peripheral blood lymphocytes, which may explain the lower LP in women with GDM in our study (61).
Taken together, by collecting clinical demographics and routine laboratory analysis parameters from EMHRs (Figure 5, blue panel) and screening potentially GDM-related variables (Figure 5, purple panel), this study established a simple-to-use nomogram for the prediction of GDM in the Chinese population (Figure 5, orange panel). The nomogram, which integrated several common risk factors, in particular serological indicators, demonstrated powerful discrimination, acceptable agreement and favorable clinical utility (Figure 5, grey panel). The 9 predictors in the nomogram are worthy of in-depth study, especially CHE, which may be closely associated with GDM. In this study, first-trimester CHE levels were found to be positively correlated with the risk of GDM after adjusting for confounders. We first developed a nomogram introducing CHE that could be used to accurately predict GDM. Our study may provide substantive clinical evidence to draw attention for exploring the association between CHE and GDM in the future. Introducing Age, Pre-GDM, CHE, FPG, HbA1c, sdLDL-C, TSH, APTT, LP, a nomogram based on these predictors might be used as a clinical tool to guide the early treatment for high-risk women and reduce the unnecessary burdens of glucose tolerance test on low-risk women (Figure 5, yellow panel). This is a clinically practical and cost-effective method for first-trimester screening for GDM, which is expected to be applied in district hospitals in the future, and is suitable for a wide range of people, despite special advanced detection equipment. Compared to previous models, the predictive variables included in this study cover several routine categories of laboratory test results, which are combined to objectively predict GDM.
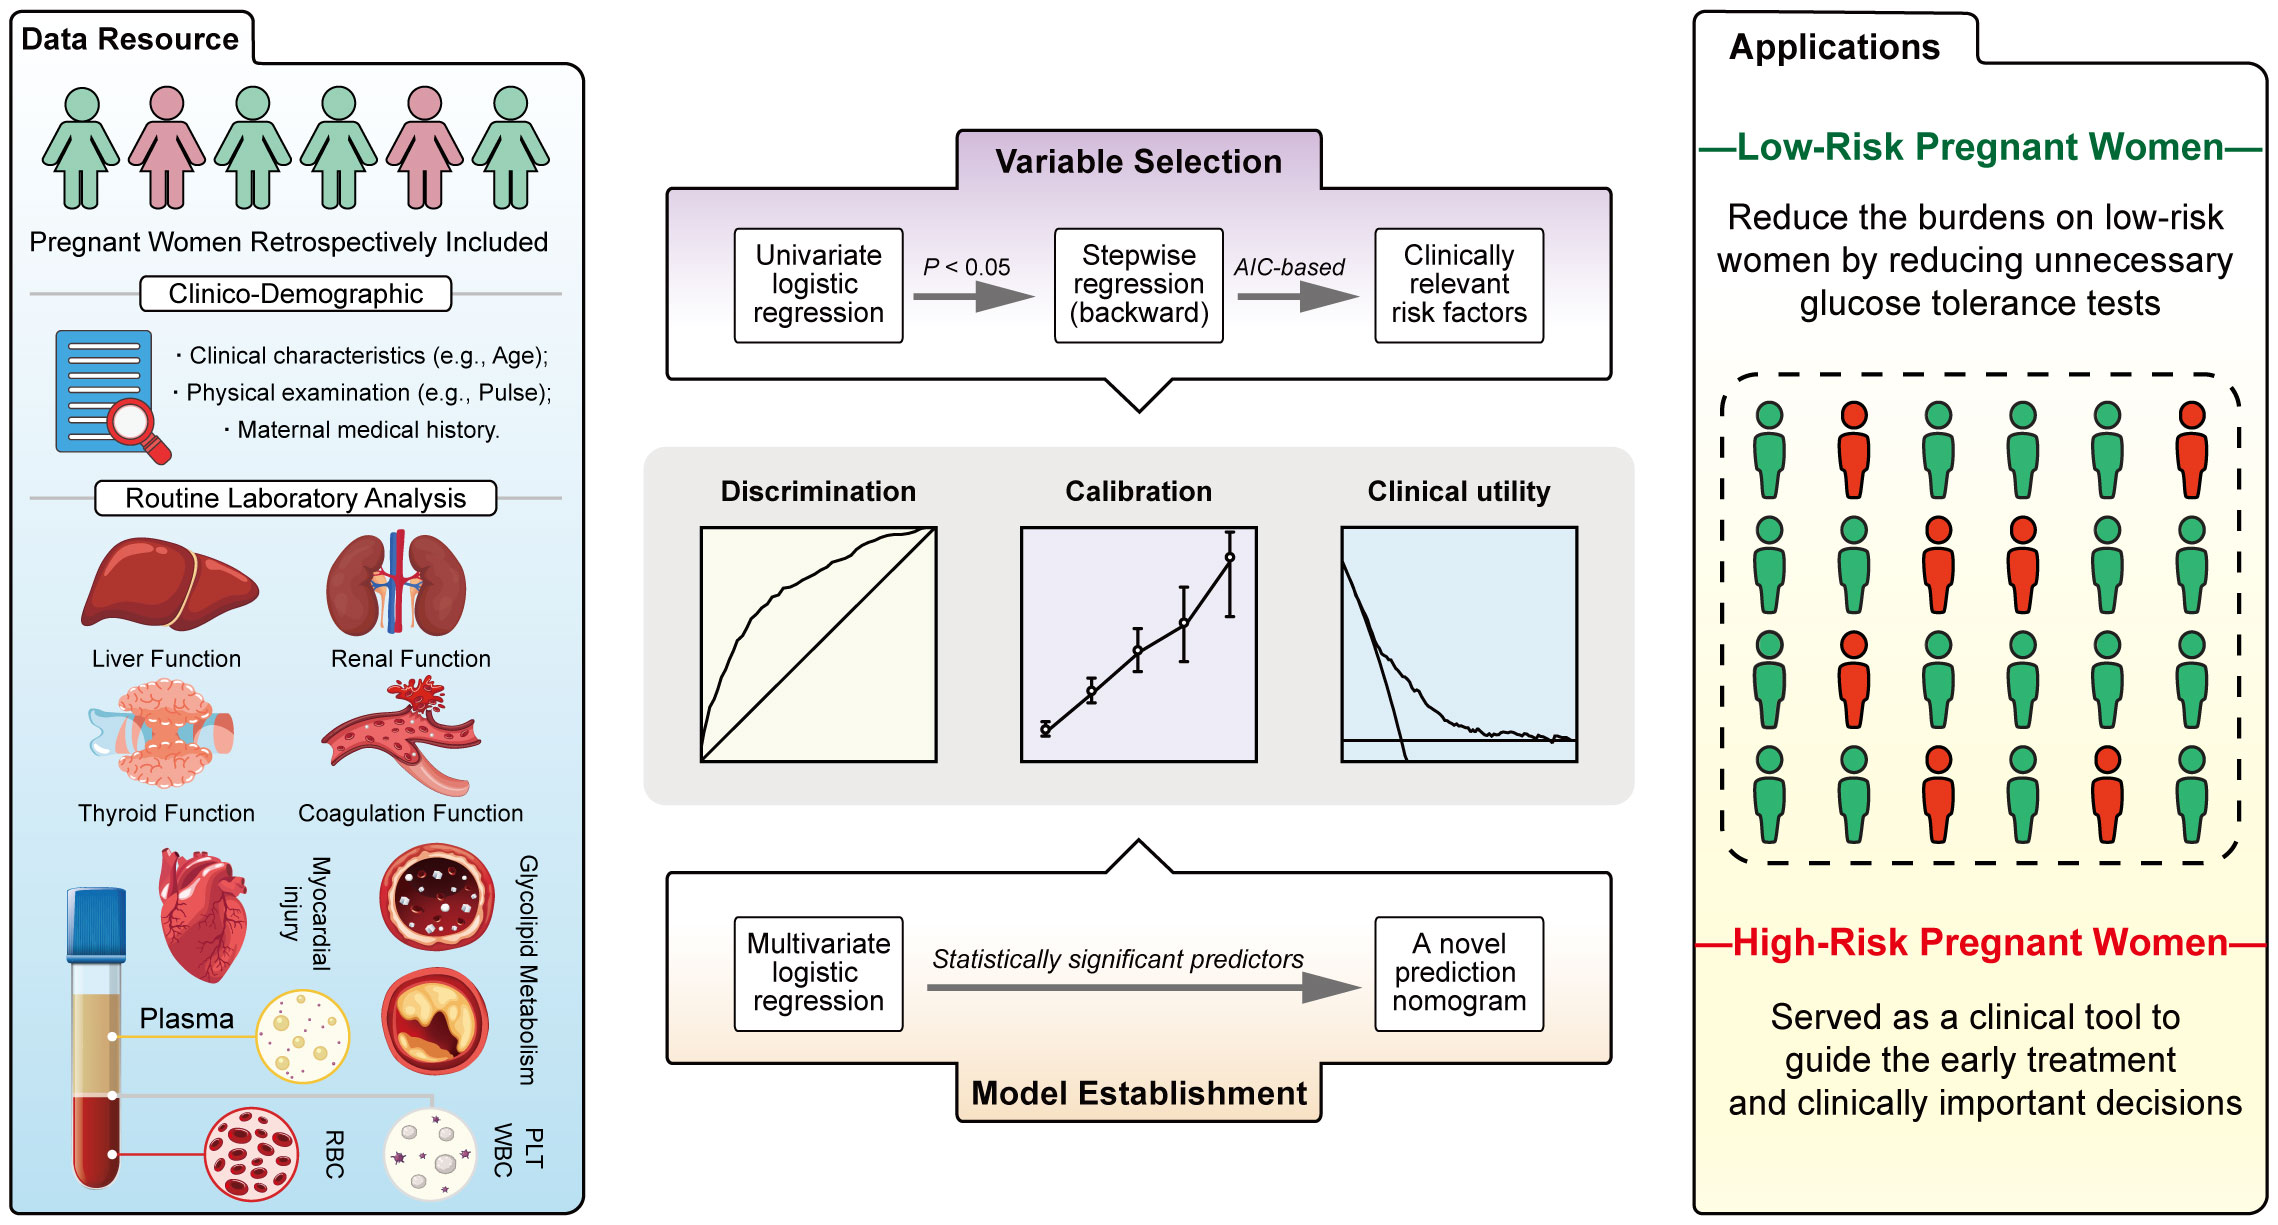
Figure 5 Summary of current study.
However, there were also several limitations in our study. First, all data resource were collected from a single clinical center and the sample size of this study was relatively small. Second, this study established a nomogram for the prediction of GDM in the Chinese pregnant woman population. The nomogram needs external validation to prove its value. Since it is a prediction nomogram, the study needs to observe the follow-up development of positive individuals detected by the nomogram to assess the accuracy of the prediction. Further multi-center prospective studies are necessarily needed to evaluate and validate the nomogram prior to real-world clinical practice.
5 Conclusions
In summary, by integrating multiple common risk factors from EMHRs, this study developed a simple-to-use nomogram to predict GDM in the early pregnancy. In clinical practice, the results of the nomogram may allow early treatment for high-risk pregnant women and serve as a screening approach to avoid burdens of unnecessary OGTT on low-risk pregnant women.
Data availability statement
All relevant data included in this study would not be publicly available due to privacy and ethical restrictions imposed by Peking University International Hospital. Requests to access the data can be directed to the corresponding authors.
Ethics statement
This study was approved by the Medical Ethics Committee of Peking University International Hospital, the informed consent number was No. 2016032. The studies were conducted in accordance with the local legislation and institutional requirements. The human samples used in this study were acquired from a by- product of routine care or industry. Written informed consent for participation was not required from the participants or the participants’ legal guardians/next of kin in accordance with the national legislation and institutional requirements.
Author contributions
Conceptualization: HZ, JD, JZ, HL. Supervision: JZ, HL, JD, XS, YS, LW. Analysis of most of the data: HZ. Visualization: HZ. Writing – original draft: HZ, JD, WZ. Writing – review & editing: JZ, HL, JD, WZ, HZ. All authors contributed to the article and approved the submitted version.
Conflict of interest
The authors declare that the research was conducted in the absence of any commercial or financial relationships that could be construed as a potential conflict of interest.
Publisher’s note
All claims expressed in this article are solely those of the authors and do not necessarily represent those of their affiliated organizations, or those of the publisher, the editors and the reviewers. Any product that may be evaluated in this article, or claim that may be made by its manufacturer, is not guaranteed or endorsed by the publisher.
References
1. National Diabetes Data Group. Classification and diagnosis of diabetes mellitus and other categories of glucose intolerance. Diabetes (1979) 28(12):1039–57. doi: 10.2337/diab.28.12.1039
2. Zhu Y, Zhang C. Prevalence of gestational diabetes and risk of progression to type 2 diabetes: A global perspective. Curr Diabetes Rep (2016) 16(1):7. doi: 10.1007/s11892-015-0699-x
3. Juan J, Yang H. Prevalence, prevention, and lifestyle intervention of gestational diabetes mellitus in China. Int J Environ Res Public Health (2020) 17(24):9517. doi: 10.3390/ijerph17249517
4. McIntyre HD, Catalano P, Zhang C, Desoye G, Mathiesen ER, Damm P. Gestational diabetes mellitus. Nat Rev Dis Primers (2019) 5(1):47. doi: 10.1038/s41572-019-0098-8
5. Johns EC, Denison FC, Norman JE, Reynolds RM. Gestational diabetes mellitus: mechanisms, treatment, and complications. Trends Endocrinol Metab: TEM (2018) 29(11):743–54. doi: 10.1016/j.tem.2018.09.004
6. Sweeting A, Wong J, Murphy HR, Ross GP. A clinical update on gestational diabetes mellitus. Endocr Rev (2022) 43(5):763–93. doi: 10.1210/endrev/bnac003
7. Ye W, Luo C, Huang J, Li C, Liu Z, Liu F. Gestational diabetes mellitus and adverse pregnancy outcomes: systematic review and meta-analysis. BMJ (2022) 377:e067946. doi: 10.1136/bmj-2021-067946
8. Kim C, Berger DK, Chamany S. Recurrence of gestational diabetes mellitus: A systematic review. Diabetes Care (2007) 30(5):1314–9. doi: 10.2337/dc06-2517
9. Vounzoulaki E, Khunti K, Abner SC, Tan BK, Davies MJ, Gillies CL. Progression to type 2 diabetes in women with a known history of gestational diabetes: systematic review and meta-analysis. BMJ (Clinical Res ed) (2020) 369:m1361. doi: 10.1136/bmj.m1361
10. Group HSCR, Metzger BE, Lowe LP, Dyer AR, Trimble ER, Chaovarindr U, et al. Hyperglycemia and adverse pregnancy outcomes. New Engl J Med (2008) 358(19):1991–2002. doi: 10.1056/NEJMoa0707943
11. Dabelea D, Mayer-Davis EJ, Lamichhane AP, D’Agostino RB, Liese AD, Vehik KS, et al. Association of intrauterine exposure to maternal diabetes and obesity with type 2 diabetes in youth: the search case-control study. Diabetes Care (2008) 31(7):1422–6. doi: 10.2337/dc07-2417
12. Tam WH, Ma RCW, Ozaki R, Li AM, Chan MHM, Yuen LY, et al. In utero exposure to maternal hyperglycemia increases childhood cardiometabolic risk in offspring. Diabetes Care (2017) 40(5):679–86. doi: 10.2337/dc16-2397
13. Zhu H, Chen B, Cheng Y, Zhou Y, Yan Y-S, Luo Q, et al. Insulin therapy for gestational diabetes mellitus does not fully protect offspring from diet-induced metabolic disorders. Diabetes (2019) 68(4):696–708. doi: 10.2337/db18-1151
14. Bain E, Crane M, Tieu J, Han S, Crowther CA, Middleton P. Diet and exercise interventions for preventing gestational diabetes mellitus. Cochrane Database System Rev (2015) 4):CD010443. doi: 10.1002/14651858.CD010443.pub2
15. Wang C, Wei Y, Zhang X, Zhang Y, Xu Q, Sun Y, et al. A randomized clinical trial of exercise during pregnancy to prevent gestational diabetes mellitus and improve pregnancy outcome in overweight and obese pregnant women. Am J Obstet Gynecol (2017) 216(4):340–51. doi: 10.1016/j.ajog.2017.01.037
16. Hod M, Kapur A, Sacks DA, Hadar E, Agarwal M, Di Renzo GC, et al. The international federation of gynecology and obstetrics (Figo) initiative on gestational diabetes mellitus: A pragmatic guide for diagnosis, management, and care. Int J Gynecol Obstet (2015) 131:S173–211. doi: 10.1016/s0020-7292(15)30033-3
17. Salomon C, Scholz-Romero K, Sarker S, Sweeney E, Kobayashi M, Correa P, et al. Gestational diabetes mellitus is associated with changes in the concentration and bioactivity of placenta-derived exosomes in maternal circulation across gestation. Diabetes (2016) 65(3):598–609. doi: 10.2337/db15-0966
18. Gillet V, Ouellet A, Stepanov Y, Rodosthenous RS, Croft EK, Brennan K, et al. Mirna profiles in extracellular vesicles from serum early in pregnancies complicated by gestational diabetes mellitus. J Clin Endocrinol Metab (2019) 104(11):5157–69. doi: 10.1210/jc.2018-02693
19. Leong I. Diabetes: Angptl8 as an early predictor of gestational diabetes mellitus. Nat Rev Endocrinol (2018) 14(2):64. doi: 10.1038/nrendo.2017.167
20. Mennickent D, Rodríguez A, Farías-Jofré M, Araya J, Guzmán-Gutiérrez E. Machine learning-based models for gestational diabetes mellitus prediction before 24–28 weeks of pregnancy: A review. Artif Intell Med (2022) 132:102378. doi: 10.1016/j.artmed.2022.102378
21. Naylor CD, Sermer M, Chen E, Farine D. Selective screening for gestational diabetes mellitus. Toronto trihospital gestational diabetes project investigators. New Engl J Med (1997) 337(22):1591–6. doi: 10.1056/NEJM199711273372204
22. Artzi NS, Shilo S, Hadar E, Rossman H, Barbash-Hazan S, Ben-Haroush A, et al. Prediction of gestational diabetes based on nationwide electronic health records. Nat Med (2020) 26(1):71–6. doi: 10.1038/s41591-019-0724-8
23. Wu Y-T, Zhang C-J, Mol BW, Kawai A, Li C, Chen L, et al. Early prediction of gestational diabetes mellitus in the chinese population via advanced machine learning. J Clin Endocrinol Metab (2021) 106(3):e1191–e205. doi: 10.1210/clinem/dgaa899
24. Kuan V, Denaxas S, Gonzalez-Izquierdo A, Direk K, Bhatti O, Husain S, et al. A chronological map of 308 physical and mental health conditions from 4 million individuals in the english national health service. Lancet Digital Health (2019) 1(2):e63–77. doi: 10.1016/S2589-7500(19)30012-3
25. Oh J, Makar M, Fusco C, McCaffrey R, Rao K, Ryan EE, et al. A generalizable, data-driven approach to predict daily risk of clostridium difficile infection at two large academic health centers. Infect Control Hosp Epidemiol (2018) 39(4):425–33. doi: 10.1017/ice.2018.16
26. Wei Y. Risk prediction models of gestational diabetes mellitus before 16 gestational weeks. Uric Acid (2022) 22(1):889. doi: 10.1186/s12884-022-05219-4
27. Riley RD, Ensor J, Snell KIE, Harrell FE, Martin GP, Reitsma JB, et al. Calculating the sample size required for developing a clinical prediction model. BMJ (Clinical Res ed) (2020) 368:m441. doi: 10.1136/bmj.m441
28. Weinert LS. International association of diabetes and pregnancy study groups recommendations on the diagnosis and classification of hyperglycemia in pregnancy: comment to the international association of diabetes and pregnancy study groups consensus panel. Diabetes Care (2010) 33(7):e97; author reply e8. doi: 10.2337/dc10-0544
29. Zhang X, Zhao X, Huo L, Yuan N, Sun J, Du J, et al. Risk prediction model of gestational diabetes mellitus based on nomogram in a chinese population cohort study. Sci Rep (2020) 10(1):21223. doi: 10.1038/s41598-020-78164-x
30. Li L, Zhu Q, Wang Z, Tao Y, Liu H, Tang F, et al. Establishment and validation of a predictive nomogram for gestational diabetes mellitus during early pregnancy term: A retrospective study. Front Endocrinol (2023) 14:1087994. doi: 10.3389/fendo.2023.1087994
31. Zheng Y, Hou W, Xiao J, Huang H, Quan W, Chen Y. Application value of predictive model based on maternal coagulation function and glycolipid metabolism indicators in early diagnosis of gestational diabetes mellitus. Front Public Health (2022) 10:850191. doi: 10.3389/fpubh.2022.850191
32. Lind T, Billewicz WZ, Brown G. A serial study of changes occurring in the oral glucose tolerance test during pregnancy. J Obstet Gynaecol Br Commonwealth (1973) 80(12):1033–9. doi: 10.1111/j.1471-0528.1973.tb02976.x
33. Szoke E, Shrayyef MZ, Messing S, Woerle HJ, van Haeften TW, Meyer C, et al. Effect of aging on glucose homeostasis: accelerated deterioration of beta-cell function in individuals with impaired glucose tolerance. Diabetes Care (2008) 31(3):539–43. doi: 10.2337/dc07-1443
34. Jovanovic L, Pettitt DJ. Gestational diabetes mellitus. JAMA (2001) 286(20):2516–8. doi: 10.1001/jama.286.20.2516
35. Zhang C, Bao W, Rong Y, Yang H, Bowers K, Yeung E, et al. Genetic variants and the risk of gestational diabetes mellitus: A systematic review. Hum Reprod Update (2013) 19(4):376–90. doi: 10.1093/humupd/dmt013
36. Smith BW, Adams LA. Nonalcoholic fatty liver disease and diabetes mellitus: pathogenesis and treatment. Nat Rev Endocrinol (2011) 7(8):456–65. doi: 10.1038/nrendo.2011.72
37. Thompson RH, Trounce JR. Serum-cholinesterase levels in diabetes mellitus. Lancet (London England) (1956) 270(6924):656–8. doi: 10.1016/s0140-6736(56)90690-0
38. Turecky L, Kupcova V, Mojto V, Smutny M, Uhlikova E, Vozar I. Serum cholinesterase activity and proteosynthetic function of liver in patients with diabetes mellitus. Bratislavske Lekarske Listy (2005) 106(8-9):266–9.
39. Abbott CA, Mackness MI, Kumar S, Olukoga AO, Gordon C, Arrol S, et al. Relationship between serum butyrylcholinesterase activity, hypertriglyceridaemia and insulin sensitivity in diabetes mellitus. Clin Sci (London England: 1979) (1993) 85(1):77–81. doi: 10.1042/cs0850077
40. Nakano K, Suga S, Takeo T, Ogawa Y, Suda T, Kanno T, et al. Intracellular ca(2+) modulation of atp-sensitive K(+) channel activity in acetylcholine-induced activation of rat pancreatic beta-cells. Endocrinology (2002) 143(2):569–76. doi: 10.1210/endo.143.2.8625
41. Wang J, Li Q, Cheng Q. Cholin esterase and type-2 diabetes mellitus. China Pharm (2010) 19(1):3–6.
42. Secnik J, Schwertner E, Alvarsson M, Hammar N, Fastbom J, Winblad B, et al. Cholinesterase inhibitors in patients with diabetes mellitus and dementia: an open-cohort study of ~23 000 patients from the Swedish dementia registry. BMJ Open Diabetes Res Care (2020) 8(1):e000833. doi: 10.1136/bmjdrc-2019-000833
43. Fahami F, Torabi S, Abdoli S. Prediction of glucose intolerance at 24-28 weeks of gestation by glucose and insulin level measurements in the first trimester. Iranian J Nurs Midwifery Res (2015) 20(1):81–6.
44. Wei Y-M, Liu X-Y, Shou C, Liu X-H, Meng W-Y, Wang Z-L, et al. Value of fasting plasma glucose to screen gestational diabetes mellitus before the 24th gestational week in women with different pre-pregnancy body mass index. Chin Med J (2019) 132(8):883–8. doi: 10.1097/CM9.0000000000000158
45. Riskin-Mashiah S, Younes G, Damti A, Auslender R. First-trimester fasting hyperglycemia and adverse pregnancy outcomes. Diabetes Care (2009) 32(9):1639–43. doi: 10.2337/dc09-0688
46. Koenig RJ, Peterson CM, Jones RL, Saudek C, Lehrman M, Cerami A. Correlation of glucose regulation and hemoglobin aic in diabetes mellitus. New Engl J Med (1976) 295(8):417–20. doi: 10.1056/NEJM197608192950804
47. Valadan M, Bahramnezhad Z, Golshahi F, Feizabad E. The role of first-trimester hba1c in the early detection of gestational diabetes. BMC Pregnancy Childbirth (2022) 22(1):71. doi: 10.1186/s12884-021-04330-2
48. Shen H, Liu X, Chen Y, He B, Cheng W. Associations of lipid levels during gestation with hypertensive disorders of pregnancy and gestational diabetes mellitus: A prospective longitudinal cohort study. BMJ Open (2016) 6(12):e013509. doi: 10.1136/bmjopen-2016-013509
49. Ryckman KK, Spracklen CN, Smith CJ, Robinson JG, Saftlas AF. Maternal lipid levels during pregnancy and gestational diabetes: A systematic review and meta-analysis. Bjog-an Int J Obstet Gynaecol (2015) 122(5):643–51. doi: 10.1111/1471-0528.13261
50. Li-long S, Bo-ping B, Yan G, Wei-ping Z. Relationship between serum small density low density lipoprotein cholesterol, blood lipid and insulin resistance in gestational diabetes mellitus patients. Chin J Health Lab (2019) 29(13):1608–9+22.
51. Pisarev MA. Interrelationships between the pancreas and the thyroid. Curr Opin Endocrinol Diabetes Obes (2010) 17(5):437–9. doi: 10.1097/MED.0b013e32833e0750
52. Leng J, Li W, Wang L, Zhang S, Liu H, Li W, et al. Higher thyroid-stimulating hormone levels in the first trimester are associated with gestational diabetes in a Chinese population. Diabetic Med: A J Br Diabetic Assoc (2019) 36(12):1679–85. doi: 10.1111/dme.14106
53. Davies T, Marians R, Latif R. The Tsh receptor reveals itself. J Clin Invest (2002) 110(2):161–4. doi: 10.1172/JCI16234
54. Stefan N, Schick F, Häring H-U. Ectopic fat in insulin resistance, dyslipidemia, and cardiometabolic disease. New Engl J Med (2014) 371(23):2236–7. doi: 10.1056/NEJMc1412427
55. Liu Y, Sun X, Tao J, Song B, Wu W, Li Y, et al. Gestational diabetes mellitus is associated with antenatal hypercoagulability and hyperfibrinolysis: A case control study of Chinese women. J Maternal Fetal Neonatal Med (2022) 35(15):2995–8. doi: 10.1080/14767058.2020.1818202
56. James AH, Rhee E, Thames B, Philipp CS. Characterization of antithrombin levels in pregnancy. Thromb Res (2014) 134(3):648–51. doi: 10.1016/j.thromres.2014.07.025
57. Yilmaz H, Celik HT, Namuslu M, Inan O, Onaran Y, Karakurt F, et al. Benefits of the neutrophil-to-lymphocyte ratio for the prediction of gestational diabetes mellitus in pregnant women. Exp Clin Endocrinol Diabetes: Off J German Soc Endocrinol [and] German Diabetes Assoc (2014) 122(1):39–43. doi: 10.1055/s-0033-1361087
58. Wolf M, Sauk J, Shah A, Vossen Smirnakis K, Jimenez-Kimble R, Ecker JL, et al. Inflammation and glucose intolerance: A prospective study of gestational diabetes mellitus. Diabetes Care (2004) 27(1):21–7. doi: 10.2337/diacare.27.1.21
59. Sun T, Meng F, Zhao H, Yang M, Zhang R, Yu Z, et al. Elevated first-trimester neutrophil count is closely associated with the development of maternal gestational diabetes mellitus and adverse pregnancy outcomes. Diabetes (2020) 69(7):1401–10. doi: 10.2337/db19-0976
60. Pace NP, Vassallo J. Association between neutrophil-lymphocyte ratio and gestational diabetes-a systematic review and meta-analysis. J Endocr Soc (2021) 5(7):bvab051. doi: 10.1210/jendso/bvab051
Keywords: gestational diabetes mellitus, prediction model, nomogram, early pregnancy, cholinesterase
Citation: Zhang H, Dai J, Zhang W, Sun X, Sun Y, Wang L, Li H and Zhang J (2023) Integration of clinical demographics and routine laboratory analysis parameters for early prediction of gestational diabetes mellitus in the Chinese population. Front. Endocrinol. 14:1216832. doi: 10.3389/fendo.2023.1216832
Received: 04 May 2023; Accepted: 19 September 2023;
Published: 13 October 2023.
Edited by:
Katarina Braune, Charité University Medicine Berlin, GermanyReviewed by:
Lawrence Merle Nelson, Mary Elizabeth Conover Foundation, Inc., United StatesBarbara Ruszkowska-Ciastek, Nicolaus Copernicus University in Toruń, Poland
Copyright © 2023 Zhang, Dai, Zhang, Sun, Sun, Wang, Li and Zhang. This is an open-access article distributed under the terms of the Creative Commons Attribution License (CC BY). The use, distribution or reproduction in other forums is permitted, provided the original author(s) and the copyright owner(s) are credited and that the original publication in this journal is cited, in accordance with accepted academic practice. No use, distribution or reproduction is permitted which does not comply with these terms.
*Correspondence: Jie Zhang, emhhbmdqQHBrdWloLmVkdS5jbg==; Hongwei Li, cm9jcXVlQHhtdS5lZHUuY24=
†These authors have contributed equally to this work and share first authorship