 Fanqi Meng1,2†
 Lijuan Lan1†Guihui Wu3†Xiaoxia Ren1Xiaoyan Yuan1Ming Yang3
 Qing Chen3Xiaoli Peng2*
 Dafeng Liu1*‡
- 1The First Ward of Internal Medicine, Public Health Clinic Centre of Chengdu, Chengdu, China
- 2School of Public Health, Chengdu Medical College, Chengdu, China
- 3Tuberculosis (TB) Department, Public Health Clinic Centre of Chengdu, Chengdu, China
Objectives: To explore the impact of diabetes itself and glycemic control status on tuberculosis (TB).
Methods: A total of 3393 patients with TB and diabetes mellitus (DM) who were hospitalized in the Public Health Clinical Center of Chengdu from January 1, 2019, to December 31, 2021, were retrospectively included and divided into three groups according to baseline glycemic control status: two groups according to glycemic status at discharge, two groups according to cavity occurrence, three groups according to sputum results, and three groups according to lesion location. The influencing factors and the differences in cavity occurrence, sputum positivity and lesion location among different glycemic control groups or between different glycemic status groups were analyzed.
Results: In this TB with DM cohort, most of the subjects were male, with a male to female ratio of 4.54:1, most of them were 45-59 years old, with an average age of 57.44 ± 13.22 years old. Among them, 16.8% (569/3393) had cavities, 52.2% (1770/3393) were sputum positive, 30.4% (1030/3393) had simple intrapulmonary lesions, 68.1% (2311/3393) had both intra and extrapulmonary lesions, only 15.8% (537/3393) had good glycemic control,16.0% (542/3393) and 68.2% (2314/3393) had fair and poor glycemic control, respectively. Compared with the non-cavity group, the sputum-negative group and the extrapulmonary lesion group, the cavity group, sputum-positive group, intrapulmonary lesion group and the intra and extrapulmonary lesion group all had higher fasting plasma glucose (FPG) and glycosylated hemoglobin A 1c (HbA1c) and lower good glycemic control rates at admission (all P<0.001). Another aspect, compared with the good glycemic control group, the poor glycemic control group had a higher cavity occurrence rate, sputum positive rate, and greater proportion of intrapulmonary lesions. Moreover, FPG and HbA1c levels and poor glycemic control were significantly positively correlated with cavity occurrence, sputum positivity, and intrapulmonary lesions and were the main risk factors for TB disease progression. On the other hand, cavity occurrence, sputum positivity, and intrapulmonary lesions were also main risk factors for hyperglycemia and poor glycemic control.
Conclusion: Diabetes itself and glycemic control status could impact TB disease. Good glycemic control throughout the whole process is necessary for patients with TB and DM to reduce cavity occurrence and promote sputum negative conversion and lesion absorption.
Introduction
The comorbidity of tuberculosis (TB) and diabetes mellitus (DM) has become a public health issue of global concern in recent years. The association between TB and DM was well known in the early 20th century and forgotten in the second half of the 20th century as treatment advanced (1). However, due to changes in people’s lifestyle and diet in recent years, the incidence of DM is increasing yearly, and the immune function of the body of patients with DM is poor, which increases the risk of TB infection (2). Studies have shown that DM can increase the risk of developing TB in infected patients by 3 to 4 times (3). The occurrence of DM may reduce the cure rate and increase the mortality and relapse rates during the treatment of TB patients (4). In the context of the overlap and increasing number of these two diseases, TB combined with DM represents a worldwide health threat (5). The relationships between blood glucose level and glycemic control status and TB cavity formation, sputum positivity and lesion site distribution in patients with TB combined with DM are contradictory, not entirely clear, and worthy of study.
Materials and methods
Study population
A retrospective cohort study was used in this study.
A total of 3393 patients with TB combined with DM who were from six TB wards were presented at the Public Health Clinical Center of Chengdu from January 1, 2019, to December 31, 2021 (Figure 1). The study was approved by the Ethics Committee of Public Health and Clinical Center of Chengdu (No.: YJ-K2022-52-01). Because this study was a retrospective cohort study and most of the subjects could not be contacted, the Ethics Commission of the hospital waived written informed consent.
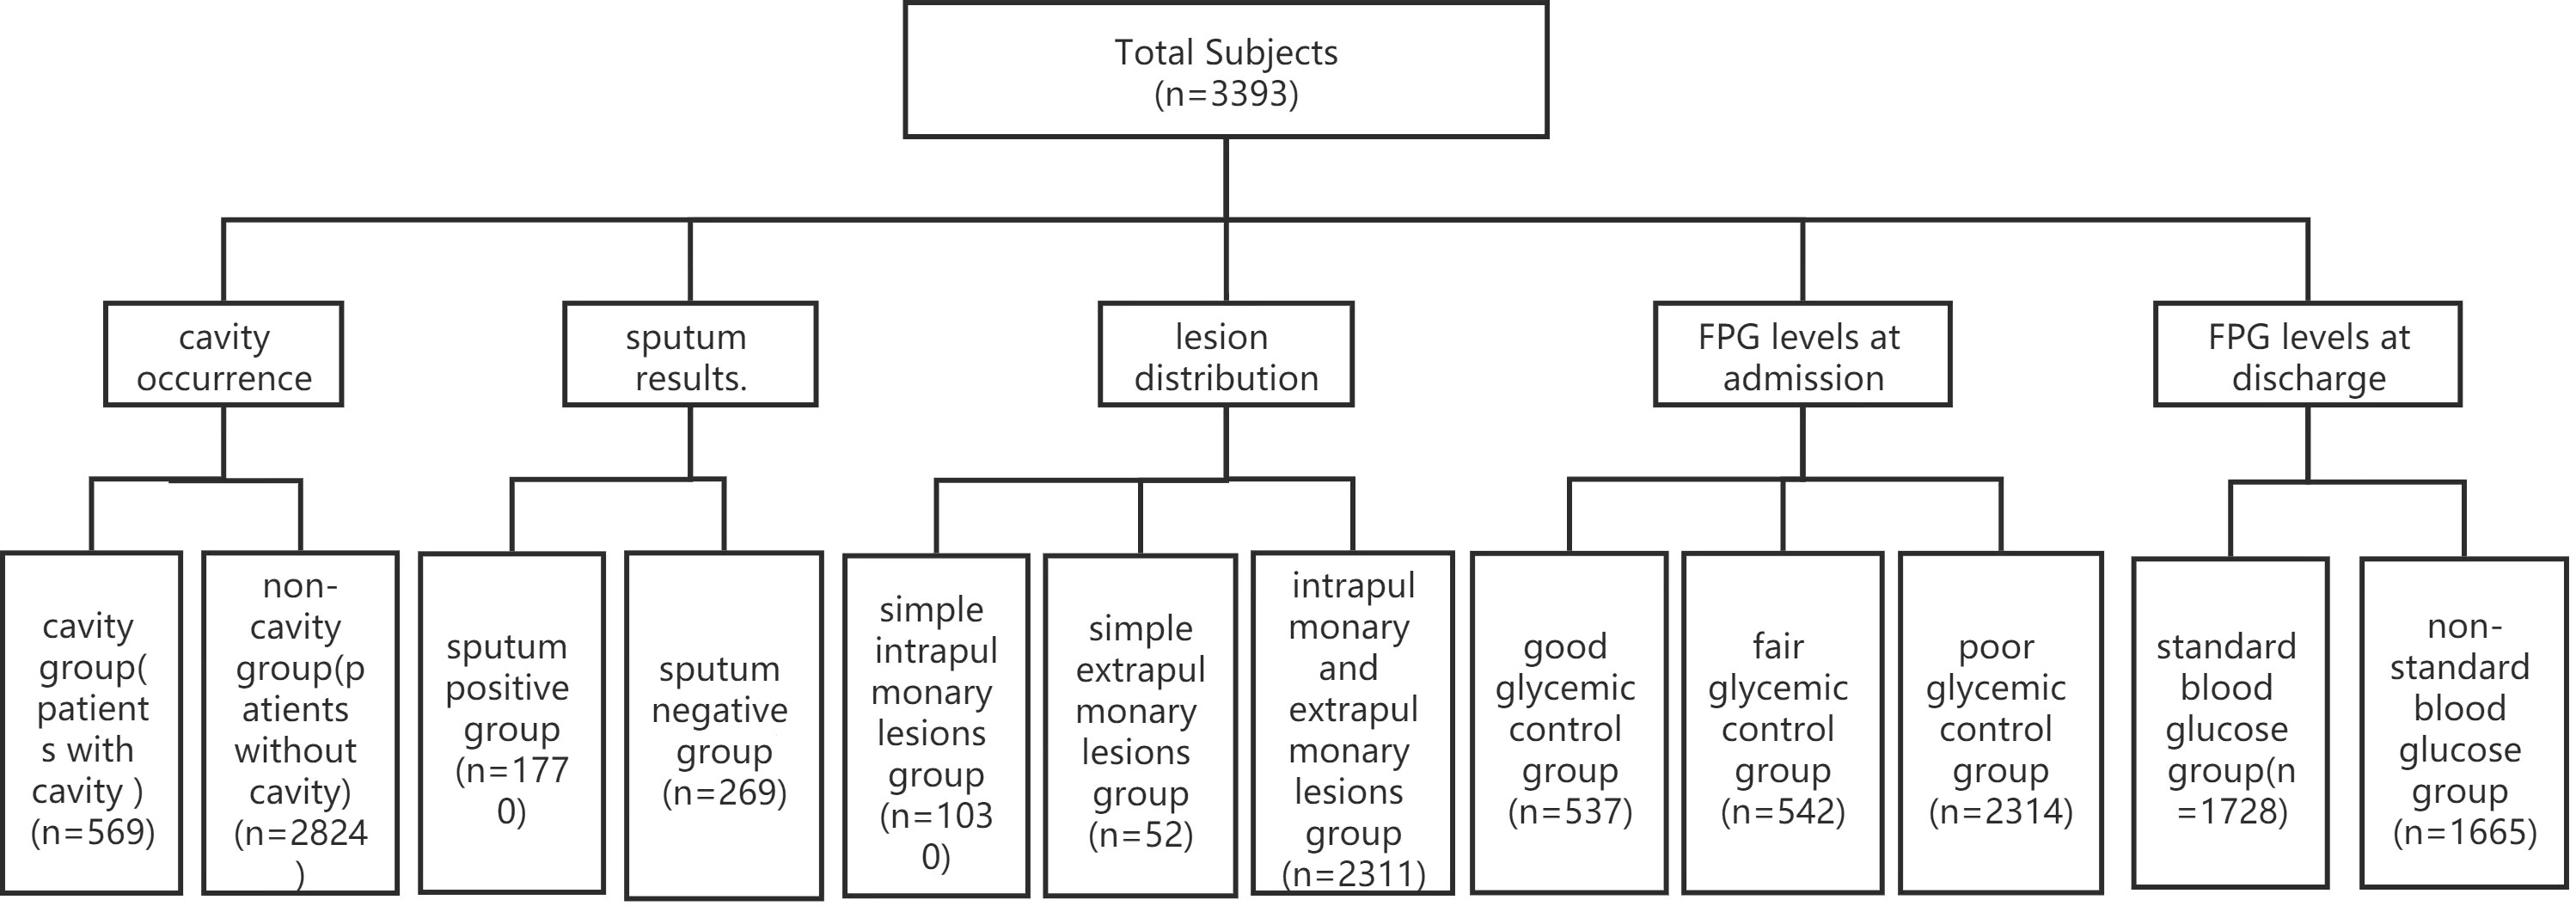
Figure 1 Patient data (n=3393). Of 3393 cases, only 2039 cases had sputum results, and the other 1354 cases did not have sputum results. FPG, fasting plasma glucose.
Eligible patients were clinically or laboratory diagnosed with TB and DM, with no age or gender restrictions.
The exclusion criteria were TB without DM and a lack of fasting plasma glucose (FPG) and glycosylated hemoglobin A 1c (HbA1c) data.
Diagnostic criteria
TB diagnosis as well as staging criteria were based on the 2001 Revised Guidelines for the Diagnosis and Treatment of TB (6). The diagnostic criteria and glycemic grouping of DM were based on the Guideline for the prevention and treatment of type 2 diabetes mellitus in China (2020 Edition) (7, 8).
Grouping standards
Of 3393 patients, 537,542 and 2314 cases were divided into the good glycemic control group (4.4<FPG ≤ 6.1 mmol/L, and HbA1c ≤ 7.0%), the fair glycemic control group (6.1<FPG ≤ 7.8 mmol/L, and 7.0<HbA1c ≤ 8.0%) and the poor glycemic control group (FPG>7.8 mmol/L, and HbA1c>8.0%) according to FPG levels at admission (Figure 1).
A total of 569 and 2824 cases were divided into the cavity group and the without cavity group according to cavity occurrence (Figure 1).
Of 3393 patients, there were 1354 cases without sputum results. In the remaining 2039 cases, 1770 and 269 cases were divided into the sputum-positive group and the sputum-negative group according to sputum results (Figure 1).
A total of 1030,52 and 2311 cases were divided into the intrapulmonary lesion group, the extrapulmonary lesion group and the intra and extrapulmonary lesion group according to lesion location.
Tuberculous pleurisy, secondary pulmonary TB and hematogenous disseminated pulmonary TB are pulmonary TB, and TB of the genitourinary system, lymph nodes, bone and joint, meninges, peritoneum, pericardium, larynx and other organs are extrapulmonary TB (Figure 1).
A total of 1728 and 1665 patients were divided into the FPG standard group (FPG<7.0 mmol/L) and the FPG substandard group (FPG≥7.0 mmol/L) according to FPG levels at discharge (Figure 1).
Measurement of Mycobacterium TB
The standards for the determination of experimental results were strictly in accordance with the Guidelines for diagnosis and treatment of pulmonary TB (6). The test was performed by collecting specimens of sputum, blood, pleural fluid and pus from patients. The determination of Mycobacterium TB includes (1) laboratory tests: smear microscopy, bacterial isolation and culture, Mycobacterium TB nucleic acid detection, immunological tests; (2) imaging tests: chest X-ray, chest CT; (3) bronchoscopy, etc. Among them, sputum Mycobacterium TB testing is the main method to confirm the diagnosis of TB.
Mycobacterium TB strain identification of all subjects in this study was performed using the BACTEC MGIT 960 System, a fully automated mycobacterial culture system from BD, USA.
Data collection
All data of 3393 cases, including clinical data, demographic data, FPG and HbA1c at admission and at discharge, were collected to establish databases. Researchers strictly controlled the accuracy, completeness and authenticity of all data.
Statistical analysis
Statistical and cartographic software, including SPSS 26.0 (SPSS, Chicago, IL, USA) and GraphPad Prism 8 (GraphPad, CA, USA), were used for statistical analyses and cartograph production. The expression of the measurement data is ± SD, and the comparisons of the homogeneity of the variance in the normally distributed data among multigroups were performed using ANOVA. Then, the comparisons between any two groups were performed using the least significant difference (LSD) t test when multigroup comparisons were statistically significant. The comparisons between any two groups used an independent-sample t test. Categorical data are expressed as percentages or proportions, and comparisons of these data were performed using the chi-square test. Multifactors correlation analyses used multiple stepwise regression. Statistical significance was considered P<0.05.
Results
Baseline conditions and the characteristics of TB combined with DM
There were 3393 cases of TB combined with DM, accounting for 11.3% of the total hospitalized TB patients in the same period. The highest percentage of male patients was 82%, and the ratio of males to females was 4.54:1. The average age was 57.44 ± 13.22 years, and age segmentation showed that 45-59 years old accounted for the highest proportion (42.00%), followed by 60-74 years old (31.92%), and the proportion of patients younger 18 years old was the lowest (0.21%) (Table 1). Among 3393 patients, only 0.97% had type 1 DM, while 99.03% had type 2 DM (Table 1), and patients with type 1 DM were significantly younger than those with type 2 DM (29.97 vs. 57.71 years, P<0.0001) (Table 2).
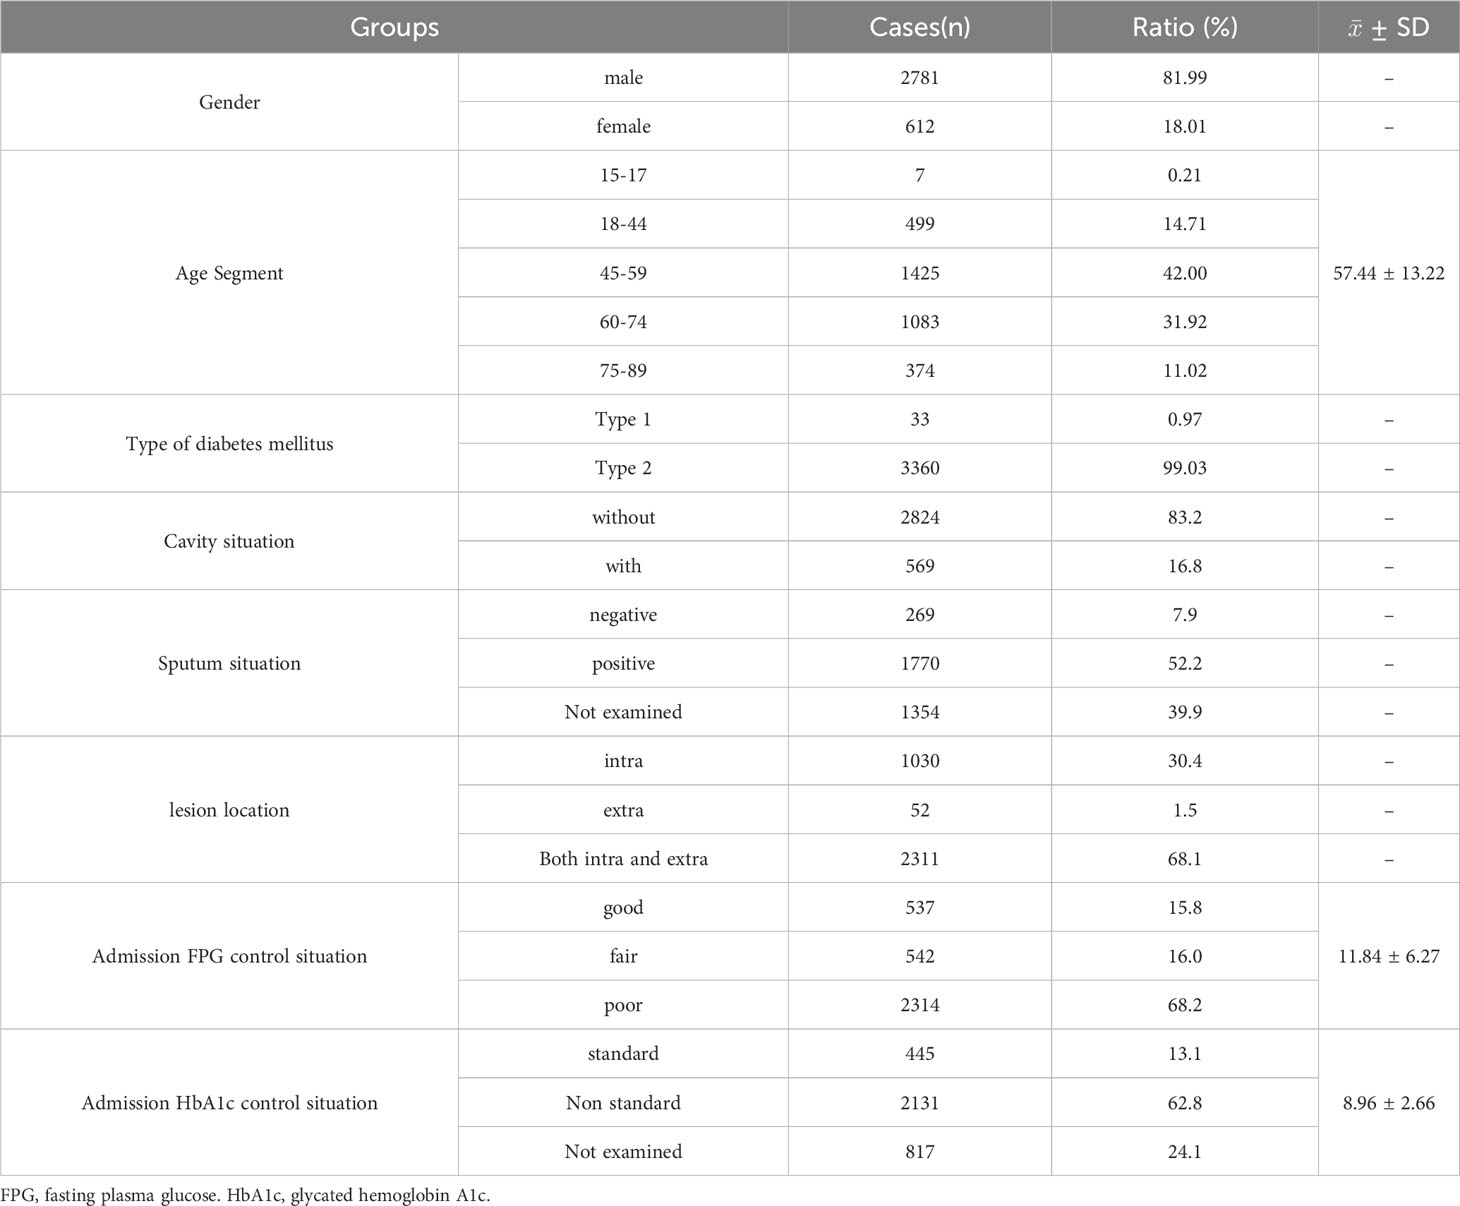
Table 1 General clinical data of tuberculosis patients with diabetes mellitus (n=3393).
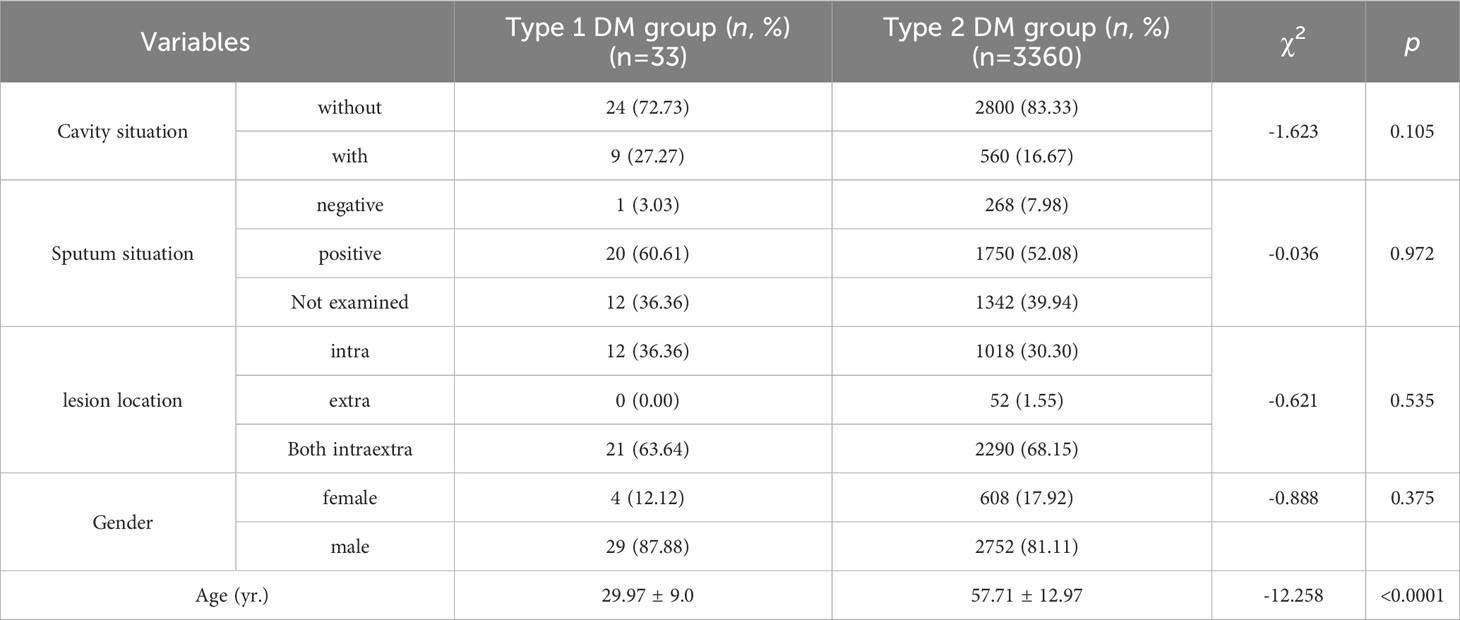
Table 2 Comparison of characteristics of tuberculosis patients with diabetes mellitus between type 1 and type 2 DM groups (n=3393).
Among 3393 patients, only 15.8% (537/3393) had good glycemic control, and 16.0% (542/3393) and 68.2% (2314/3393) had fair glycemic control and poor glycemic control, respectively (Table 1; Figure 2A). At discharge, the percentages of patients with glycemic standard and substandard were 50.9% (1728/3393) and 49.1% (1665/3393), respectively (Figure 3A).
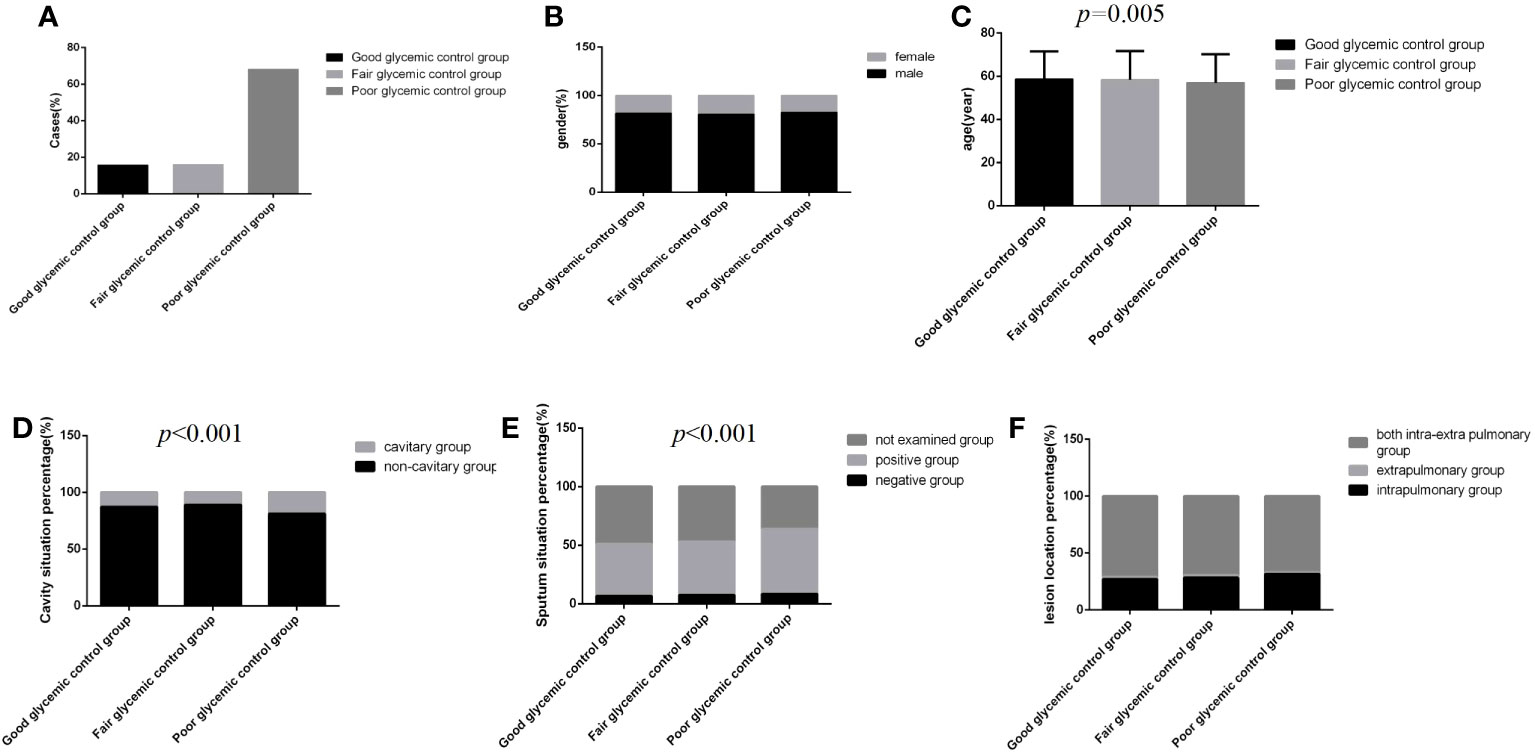
Figure 2 Comparison of clinical characteristics among the three glycemic control status groups (n=3393; good, fair and poor glycemic control groups, n=537, 542 and 2314, respectively). (A) Cases. (B) gender. (C) Age. (D) Cavity situation percentage. (E) sputum situation percentage. (F) Lesion location percentage.Unpaired one-way ANOVA was used for intergroup comparisons of age (P=0.005).The chi-square test was used for the counting data as sex (P>0.05), cavity situation percentage (P<0.001), sputum situation percentage (P<0.001) and lesion location percentage (P>0.05) among the three groups.
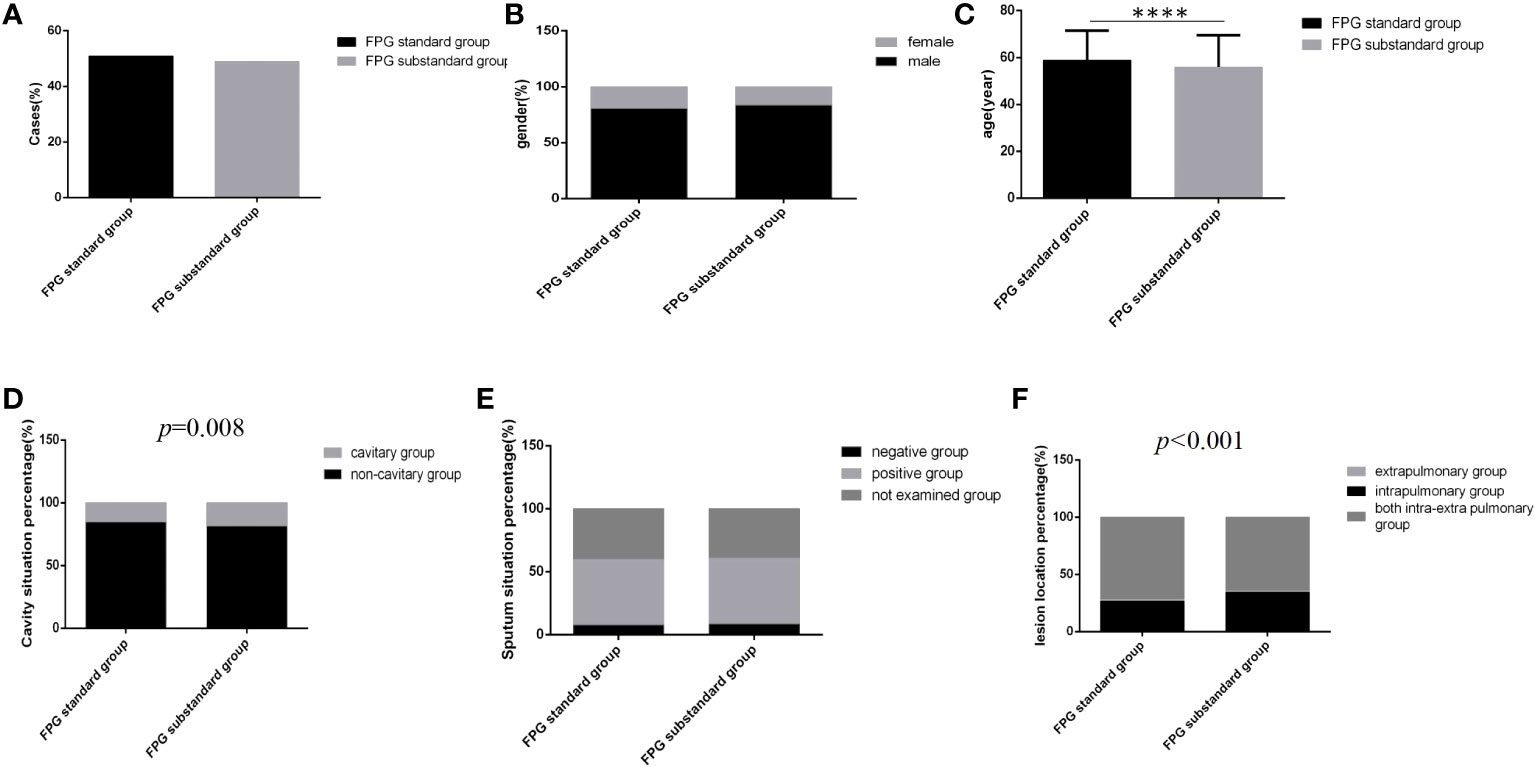
Figure 3 Comparison of clinical characteristics between the FPG standard group and the FPG substandard group (n=3393; FPG standard and substandard groups, n=1728 and 1665, respectively). (A) Cases. (B) gender. (C) Age (D) Cavity situation percentage. (E) sputum situation percentage. (F) Lesion location percentage.Unpaired t tests were used for comparisons of age (****P<0.0001) between the two groups. The chi-square test was used for comparisons of sex (P>0.05), cavity situation percentage(P=0.008), sputum situation percentage (P>0.05) and lesion location percentage (P<0.001) between the two groups.
The total cavity incidence was 16.8%, and the total sputum positive detection rate was 52.2% (Table 1). In addition, 68.1% of patients had both intrapulmonary and extrapulmonary lesions, 30.4% of patients had only intrapulmonary lesions, and cases with extrapulmonary lesions alone were rare, at only 1.5% (Table 1). Patients whose age were 18-44 years old and 45-59 old had higher percentage of cavity incidence, 19.24% and 18.25%, respectively (Table 3), and patients whose age were younger 18 years old had the highest sputum positive rate (85.71%), but there were not differences in lesion location among different age-segment groups (Table 3). Simultaneously, there were not differences in cavity incidence, sputum situation and lesion location between different type DM groups (Table 2).

Table 3 Comparison of characteristics of tuberculosis patients with diabetes mellitus among different age-segment groups (n=3393).
Impact of glucose parameters, glycemic control status at admission and glycemic standard status at discharge on TB disease progression
Regardless of the group, the majority of cases were male, and the distribution of lesion location was dominated by intra and extra pulmonary, but there were no significant differences among the three glycemic control status groups (Figures 2B, F) (P>0.05). However, in the poor glycemic control group, the age was younger, and the cavity rate (19.0%, 440/2314) and the sputum bacteria positive rate (55.4%, 1282/2314) were higher than those in the other two groups; significant differences were all found (Figures 2C–E) (P<0.05).
Regardless of which group the majority of cases were male, the distribution of gender and sputum bacteria status between the two glycemic standard status groups was similar, and there were no significant differences (Figures 3B, E) (P>0.05). However, in the glycemic substandard group, age was younger, and the cavity rate (15.1%, 261/1728) and the percentage of intrapulmonary lesion rate (71.8%, 1241/1728) were higher than those in the glycemic standard group; significant differences were all found (Figures 3C, D, F) (P<0.05).
Moreover, multiple logistic regression analysis showed that age, sex and glycemic control status at admission were risk factors for cavity formation, and FPG level at admission and at discharge were risk factors for lesion location (Table 4) (all P<0.05).
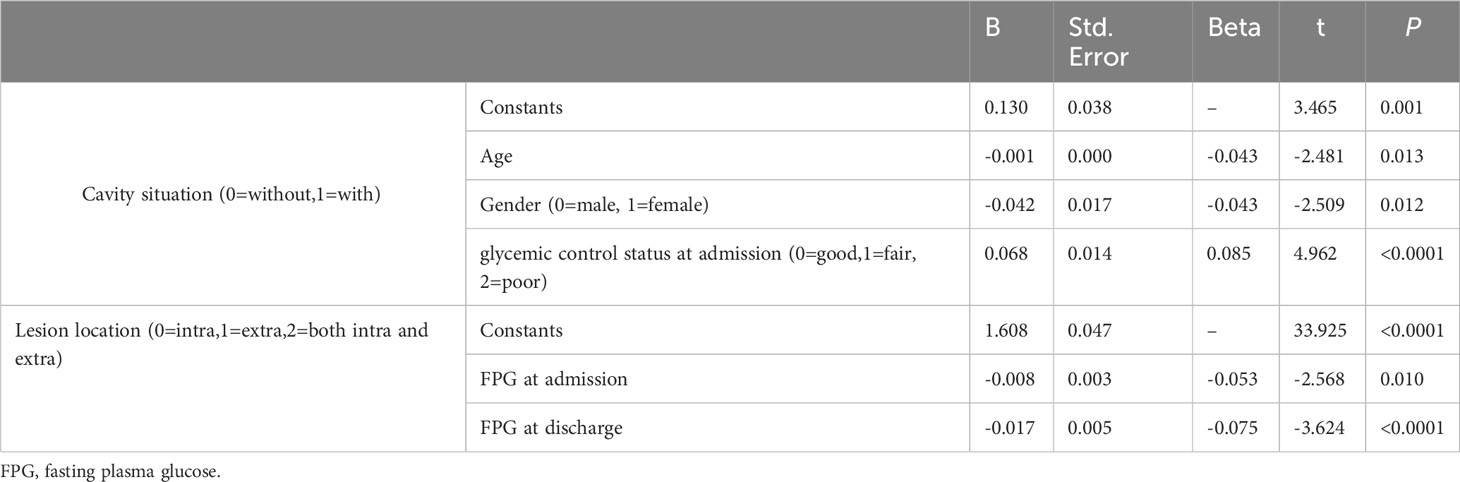
Table 4 Multivariate logistic regression analysis of risk factors for cavity formation, sputum results and lesion site.
Impact of TB on glucose parameters and glycemic control
In the cavitary pulmonary TB group, age was younger, FPG levels and HbA1c levels at admission and HbA1c levels at discharge were all higher than those in the non-cavitary group, and all differences were statistically significant (Figures 4B–D) (all P<0.05). In the cavity group, the proportion of male was higher, and the FPG level at discharge was also higher than that in the non-cavity group, but there were no statistically significant differences (Figures 4A, C) (P>0.05).
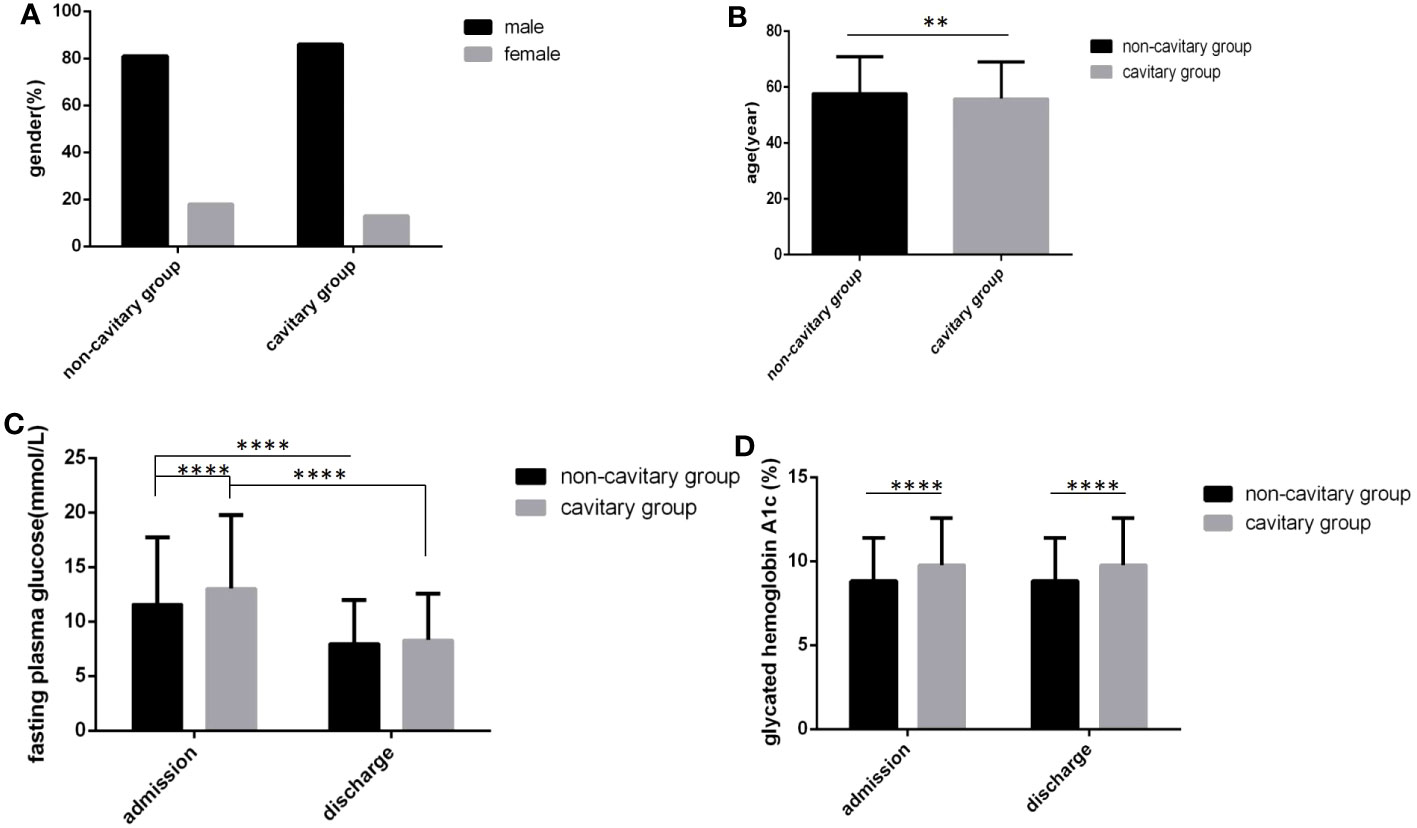
Figure 4 Comparison of clinical characteristics between the cavitary group and the non-cavitary group (n=3393; cavitary and non-cavitary groups, n=569 and 2824, respectively). (A) gender. (B) age. (C) Fasting plasma glucose at admission and discharge. (D) Glycated hemoglobin A1c at admission and discharge. Unpaired t tests were used for comparison of age, fasting plasma glucose and glycated hemoglobin A1c between two groups, **P<0.01, ****P<0.0001. The chi-square test was used for comparisons between sexes (P>0.05).
There were more male cases than female cases in all three sputum bacteria groups, and there were no significant differences in sex distribution and age among the three groups (Figures 5A, B) (P>0.05). In the sputum bacteria-positive group, the FPG level and HbA1c level at admission and the HbA1c level at discharge were all higher than those in the other two groups, and all differences were statistically significant (Figures 5C, D) (P<0.05). Although the sputum bacteria-positive group FPG level at discharge was also higher and the time to reach the blood glucose standard was longer than those in the other two groups, the differences were not statistically significant (Figure 5C) (P>0.05).
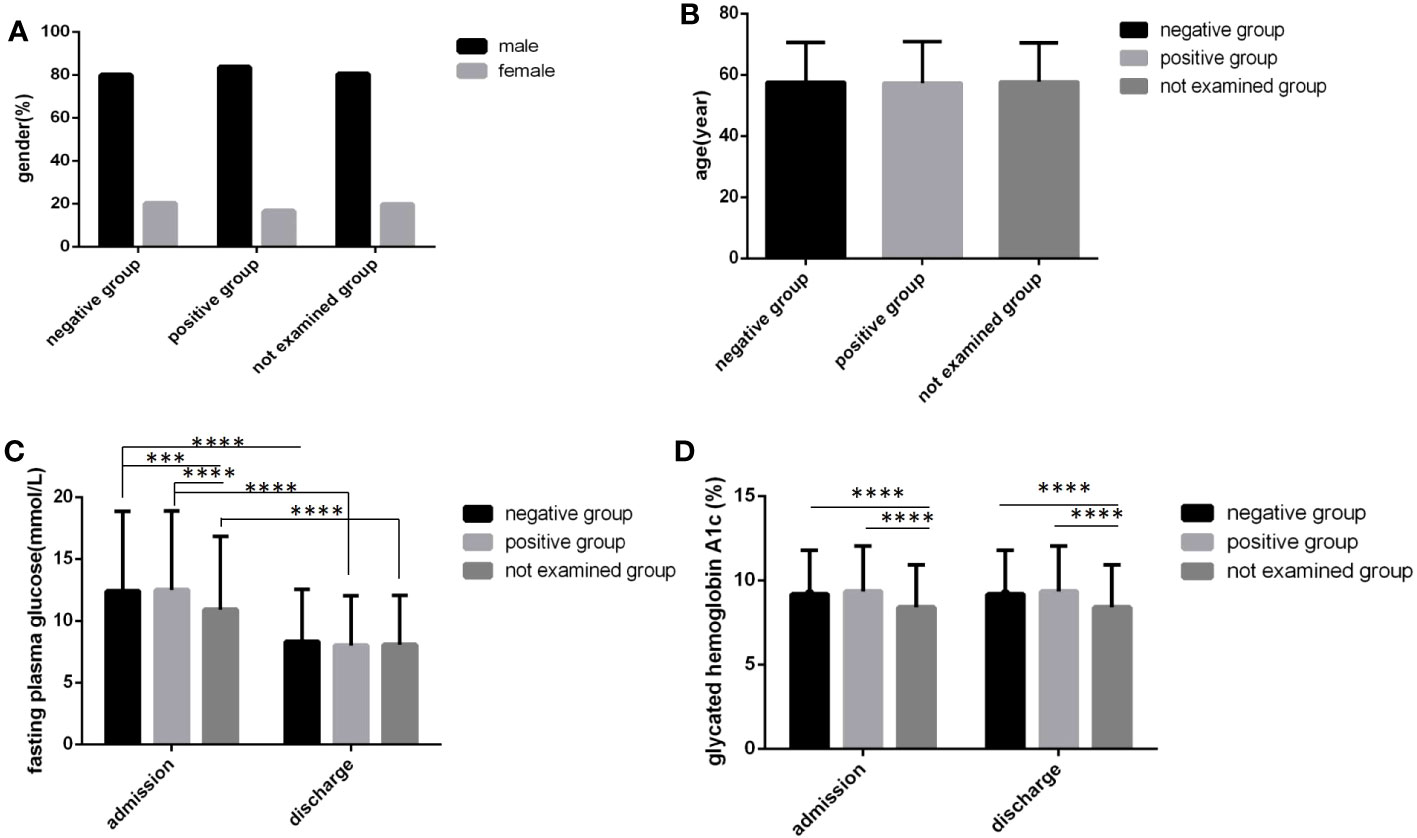
Figure 5 Comparison of clinical characteristics among three sputum results groups(n=3393; sputum-positive, sputum-negative and not examined groups, n=1770, 269 and 1354, respectively). (A) gender. (B) age. (C) Fasting plasma glucose at admission and discharge. (D) Glycated hemoglobin A1c at admission and discharge. Unpaired one-way ANOVA was used to compare age, fasting plasma glucose and glycated hemoglobin A1c among the three groups (c,d, P all<0.0001; a, P>0.05). Unpaired t tests were used for comparison of fasting plasma glucose and glycated hemoglobin A1c between at admission and at discharge and comparison with the sputum-negative group at the same time point, ***P<0.001, ****P<0.0001.The chi-square test was used for comparisons between sexes (P>0.05).
In the extrapulmonary group, age was the oldest, followed by both the intra and extra pulmonary group and the intrapulmonary group, and there were obvious differences (Figure 6B) (P<0.05). In the intrapulmonary group, FPG levels and HbA1c levels not only at admission but also at discharge were the highest, followed by both the intra and extra pulmonary group and the extrapulmonary group, and statistically significant differences were all found (Figures 6C, D) (P<0.05). No difference in sex distribution was found among the three groups (Figure 6A) (P>0.05).
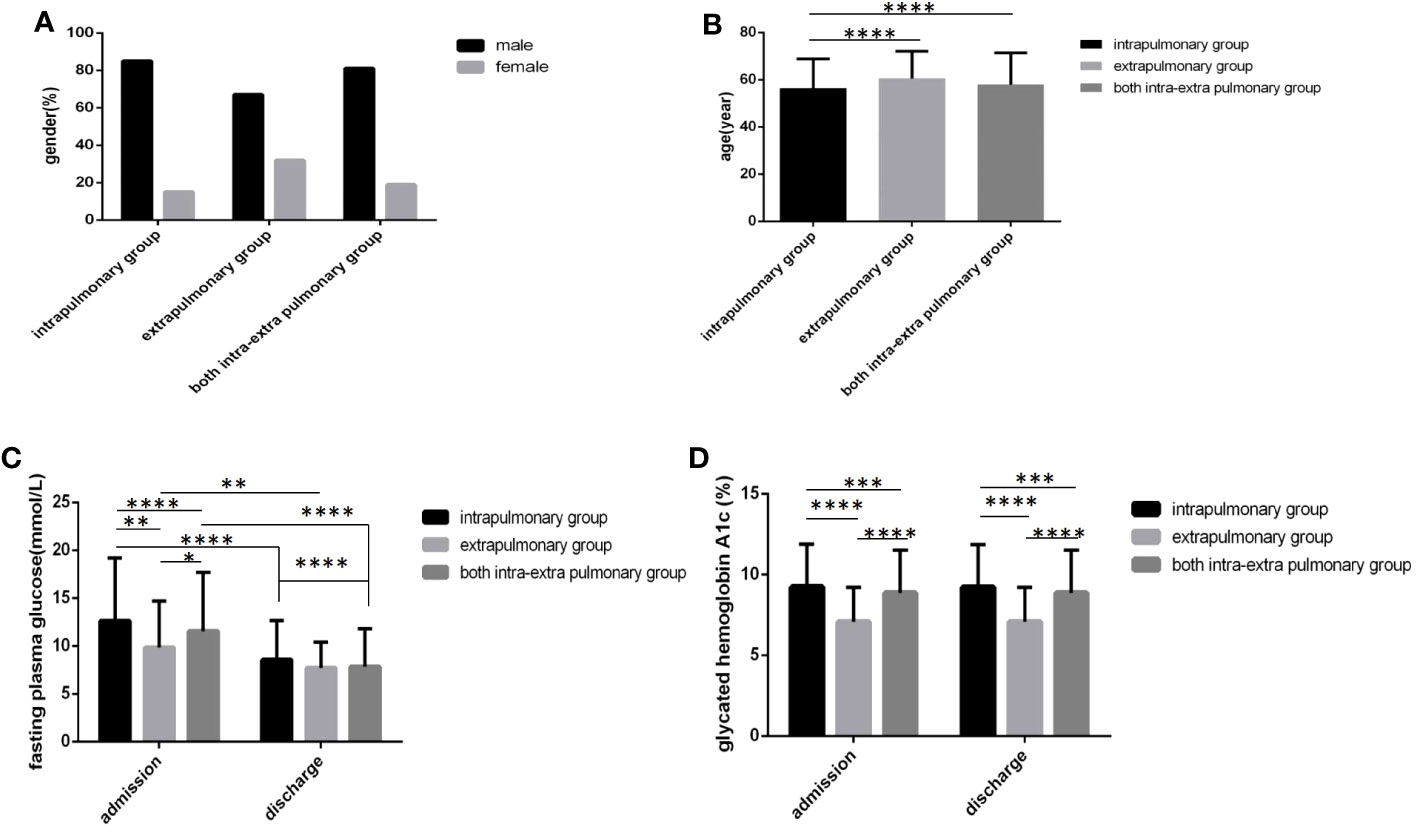
Figure 6 Comparison of clinical characteristics among three lesion location groups(n=3393; intrapulmonary, extrapulmonary and both intra and extra pulmonary groups, n=1030, 52 and 2311, respectively). (A) gender. (B) age. (C) Fasting plasma glucose at admission and discharge. (D) Glycated hemoglobin A1c at admission and discharge.Unpaired one-way ANOVA was used to compare age, fasting plasma glucose and glycated hemoglobin A1c among the three groups (b,c,d, P all<0.0001).Unpaired t tests were used for comparison of fasting plasma glucose and glycated hemoglobin A1c between admission and discharge and comparison with the sputum-negative group at the same time point, *P<0.05, **P<0.01, ***P<0.001, ****P<0.0001. The chi-square test was used for comparisons between sexes (P>0.05).
Moreover, multiple logistic regression analysis showed that cavity formation, sputum results, lesion location and age were all risk factors for the FPG level, HbA1c level and glucose control status at admission; HbA1c level at discharge, lesion location and age were risk factors for the FPG level at discharge; and cavity formation, lesion location and age were risk factors for glucose standard statue at discharge (Table 5) (all P<0.05).
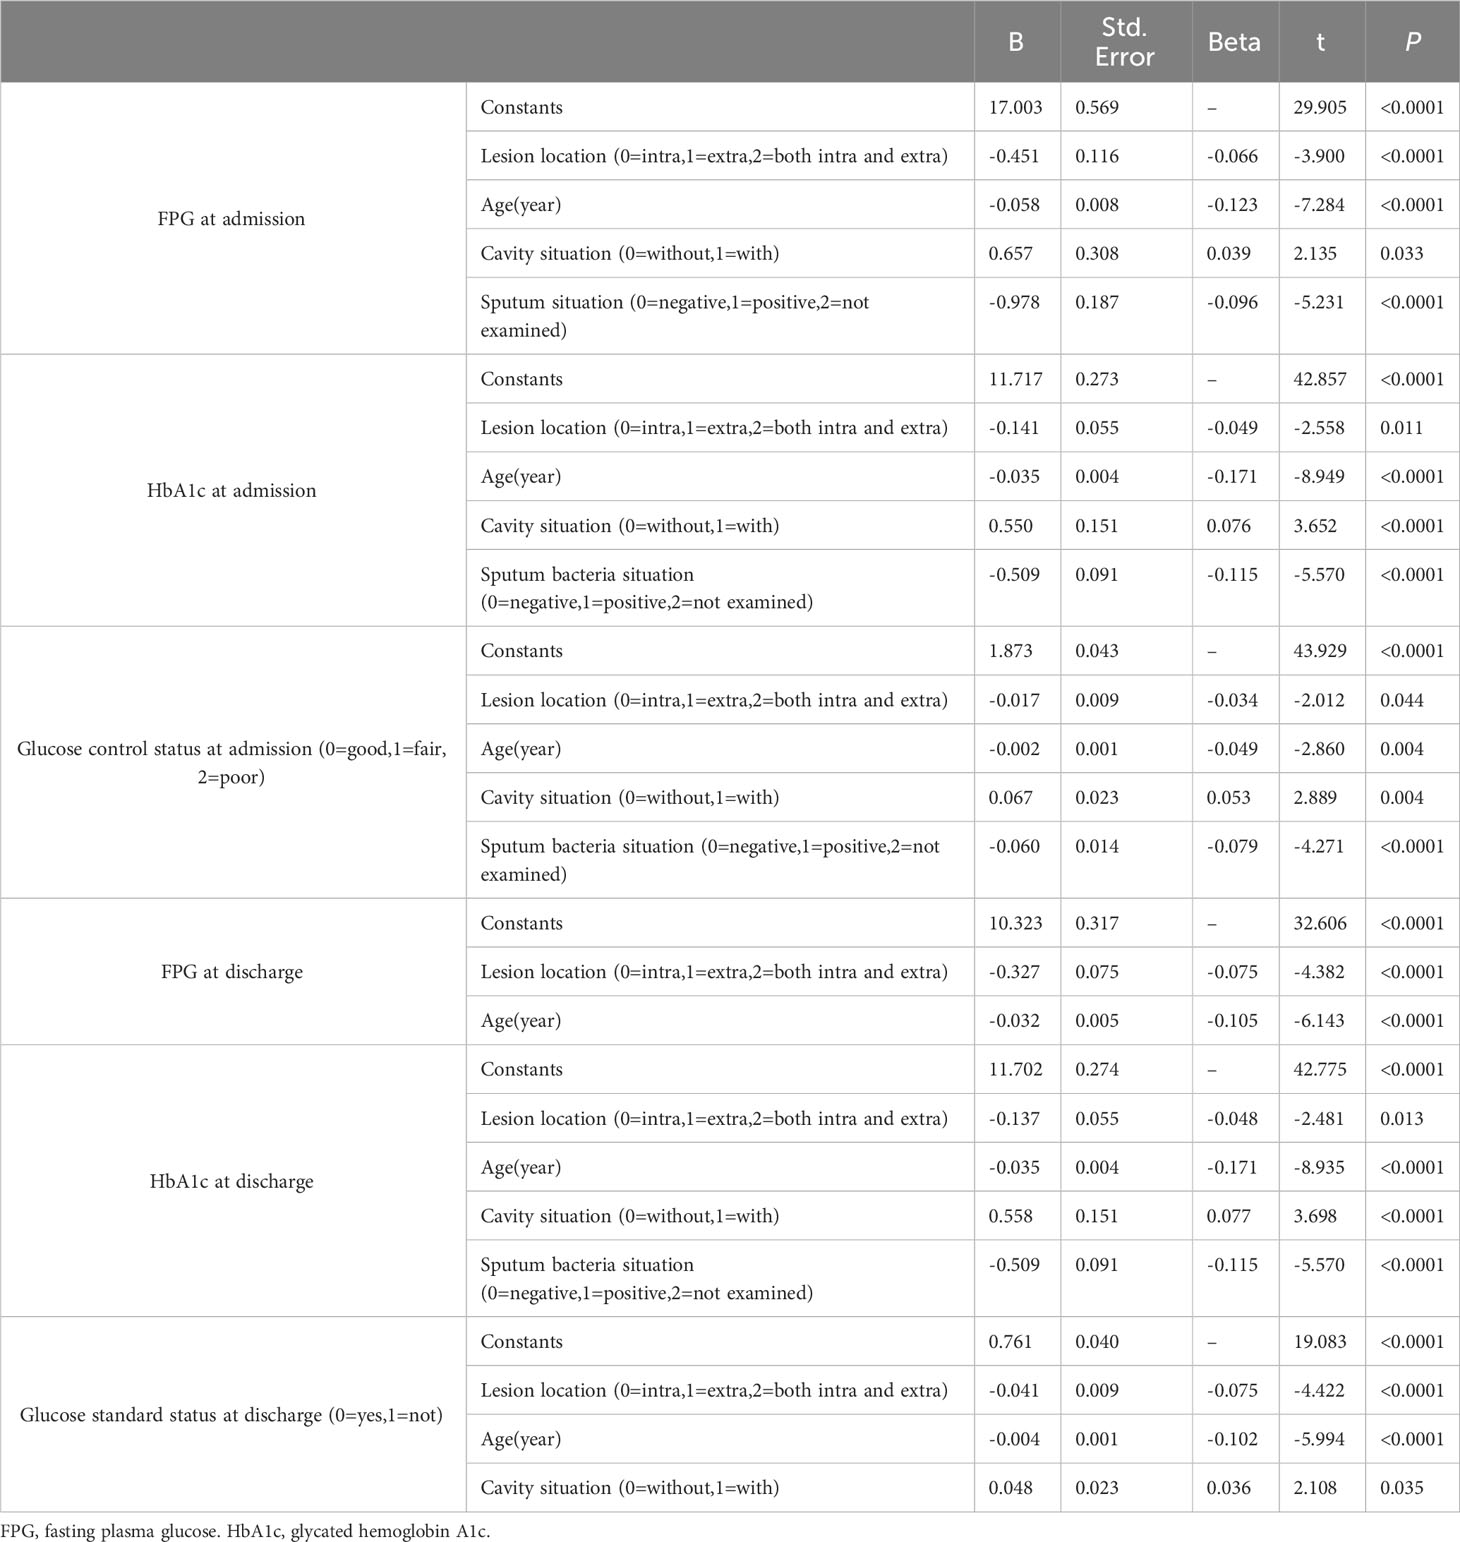
Table 5 Multivariate logistic regression analysis of risk factors for blood glucose parameters.
Discussion
In this study, we found that TB combined with DM accounted for 11.3% of the total hospitalized TB patients in the same period. Previous studies have reported that of the 1.5 million people who die from TB each year, 10% to 25% also have diabetes (9), the pooled prevalence of DM among total TB patients was 12.77% (95% CI 6.91-18.62%) (10), among adult TB patients was 5.1% (95% CI: 2.7%, 7.5%) (11), and among newly diagnosed TB patients was up to 54% (12). On the other hand, patients with DM have a threefold-fold increased risk of developing TB (13) and a 1.5-fold increased risk of developing active TB compared to those without DM (95% CI 1.28-1.76) (14). The pooled prevalence of TB among DM patients was 4.14% (95% CI 2.45-5.83%) (10), and the pooled effect showed a significant association between DM and latent TB infection (for cross-sectional studies, OR = 1.55, 95% CI: 1.30-1.84; for cohort studies, RR = 1.62, 95% CI: 1.02-2.56; rates range from 28.2% to 42.4%) (15, 16).
Type 1 diabetes patients were included in the study, accounting for only 0.97% of the total hospitalized TB patients in this cohort, of them 99.03% had type 2 DM. The average age was 29 years, significantly younger than those with type 2 DM, but there were not differences in cavity incidence, sputum situation and lesion location between different type DM groups. (As shown in Table 2).
In this study, we also found that only 15.8% (537/3393) of patients with TB combined with DM had good glycemic control, and 68.2% (2314/3393) and 16.0% (542/3393) of patients had fair glycemic control and poor glycemic control, respectively. (As shown in Table 1). In a recent study among newly diagnosed TB cases, only 25% of patients had normal blood glucose levels (10–12). The prevalence of persistent dysglycemia (PD)is 29.6% in patients with tuberculosis (17).
In this study, the characteristics of TB combined with DM were predominant in men aged 45 to 74 years, with a 16.8% cavity incidence rate, 52.2% sputum positive rate, 30.4% intrapulmonary lesion rate and 68.1% intra and extrapulmonary lesion rate. (As shown in Table 1). Those patients whose age were 18-44 years old and 45-59 old had higher percentage of cavity incidence, 19.24% and 18.25%, respectively, and those patients whose age were younger 18 years old had the highest sputum positive rate (85.71%). (As shown in Table 3). One study found that patients with both TB and diabetes were more likely to have clinical manifestations such as pulmonary cavitation (adjusted ratio aOR 2.26, 95% CI 1.04-4.90) and hemoptysis (aOR 2.21, 95% CI 1.02-4.78) (18), but there was no significant difference in the positive rate of sputum between the TB-DM and TB-NDM groups (2).
In this study, we found that poor glycemic control and higher FPG and HbA1c were associated with cavity formation, sputum positivity, and more lesions in patients with TB and DM. (As shown in Tables 4, 5). These findings are also consistent with previous studies. One previous study found that pulmonary lobe lesion and cavity formation rates were significantly higher in patients with TB-DM with poor glycemic control than in patients with TB-NDM and TB-DM with normal glycemic control (2). Other previous studies found that concurrence of TB and DM can vary or even worsen the clinical manifestations of the disease, including increased sweats, weight loss, prolonged fever duration and dyspnea (19), have more severe lung involvement, such as more parenchymal lesions and cavities (20, 21), bilateral pulmonary involvement and advanced extensive pulmonary lesions affecting all lobes in CT scans (22), and delay both sputum smear and culture conversion time (9). These characteristics could aggravate if the TB-DM patient has poor glycemic control (23–26). Additionally, TB-DM patients are at a higher risk (twofold) of TB drug resistance (27). Other studies found that controlled potential confounders found a two- to fivefold mortality risk in TB-DM patients compared to non-TB-DM patients (4). All these findings regarding the severity of the clinical presentation translate into adverse treatment outcomes in TB-DM patients, such as an increased risk of delayed mycobacterial clearance, treatment failure, death, relapse, reinfection, and drug resistance (4, 28, 29). TB exerts its effects by complicating glycemic control in DM patients, and persistent dysglycemia (PD)is associated with more lung lesion types, higher bacillary loads, and unfavorable TB treatment outcomes. After adjusting for age, smoking, hemoglobin levels, and smear grade, PD was independently associated with unfavorable treatment outcomes (adjusted odds ratio (aOR): 6.1; 95% CI: 1.9–19.6) (17).
In this study, we also found that in patients with TB and DM cavity formation, sputum positivity and more lesions in turn make glycemic control more difficult. (As shown in Tables 4, 5). Hyperglycemia has been assumed to favor the growth and propagation of MTB (30). Good glycemic control of diabetic patients enhances cellular immune function and the body’s tissue repair ability, accelerates the absorption of lesions, and restores the body’s ability to resist infection, thus enhancing the overall efficacy of the treatment.
Immunity is altered in diabetic patients at many levels, such as depressed polymorphonuclear leukocyte function, chemotaxis, affected leukocyte adherence, and phagocytosis. Cellular innate immunity dysregulation coupled with an increased glucose concentration environment contributes to the increased prevalence of TB infection (9). DM may reduce the control of persistent inflammation in TB through insufficient local IL-10 production in the lung, which could result in pulmonary impairment and aggravation of TB-DM disease (31). Dysglycemia in DM patients was postulated to damage their innate or adaptive immunity and could trigger a hyper inflammatory state (32, 33). It was reported that the synthesis of cytokines in pulmonary TB with DM patients showed significant changes compared to pulmonary TB without DM, such as IL-2, IL-6, IL-17, TNF-α and IFN-γ (34, 35). In addition, a previous study showed that the plasmatic increase in IL-15 could be related to the inflammatory state characteristics among DM and TB patients (36). Furthermore, a hyper inflammatory state of diabetic patients may favor the reactivation of TB (37, 38). The absolute counts of T lymphocytes, CD8+ T lymphocytes, and B lymphocytes in patients with TB-DM were markedly lower than those in patients with TB-NDM. The absolute counts of T lymphocytes and CD8+ T lymphocytes in patients with TB-DM and hyperglycemia were lower than those in patients with euglycemia. Linear regression analysis revealed that the absolute counts of total T lymphocytes, CD8+ T lymphocytes, and NK cells in patients with TB-DM significantly decreased with increasing FPG levels (2). In addition, the immunological hypothesis that may explain the DM and LTBI relationship is based on glycation of the CD271 domain of mesenchymal stem cells in uncontrolled DM patients, which may change their lifespan, becoming a potential niche for MTB in LTBI (5, 39). Thus, improving glucose control may overturn the harm caused to the immunological balance and diminish vulnerability to infectious agents (9).
However, there are still some limitations of this study. First, it was a single-center, retrospective study, and all the inherent limitations of retrospective studies are unavoidable. Second, follow-up was short, only during hospitalization, and did not complete the entire period of TB treatment. Third, the effects of diabetes course, family history of diabetes and hypoglycemic regimen on TB disease progression were not analyzed. Despite these limitations, we report several novel findings: TB combined with DM accounted for 11.3% of the total hospitalized TB patients in the same period and had a relatively high cavity formation rate, sputum positive rate and lesion rate. In this large sample size TB combined with DM cohort, overall glycemic control was poor: only 15.8% of patients had good glycemic control, and 16.0% of patients and 68.2% of patients had fair glycemic control and poor glycemic control, respectively. (As shown in Table 1). Poor glycemic control and hyperglycemia could promote TB disease progression manifested in increasing cavity formation, sputum positivity, and more lesions in those patients. On the other hand, TB disease severity, including the presence of cavities, positive sputum and widespread lesions, could make glycemic control difficult.
Conclusion
TB combined with DM is predominant in men over 44 years of age, with poor overall glycemic control, a relatively high cavity incidence rate, a high rate of sputum positivity and the presence of intrapulmonary and extrapulmonary lesions being more common. Hyperglycemia and poor glycemic control at admission may promote cavity formation, positive sputum and spread of lesions. Conversely, the presence of cavities, positive sputum and widespread lesions are detrimental to glycemic control. Strict glycemic control for these patients is necessary to reduce the incidence of cavitation and to promote negative sputum conversion.
Data availability statement
All data, models, or code generated or used during the study are available from the corresponding author by request: DL, e-mail: bGl1ZGYzMTJAMTI2LmNvbQ==.
Ethics statement
This study was approved by the Ethics Committee of the Public and Health Clinic Centre of Chengdu (ethics approval number:YJ-K2022-52-01). Because this study was a retrospective cohort study and most of the subjects could not be contacted, the Ethics Commission of the hospital waived written informed consent. All of the participants understand that the information will be published without their child’s or ward’s/their relative’s (circle as appropriate) name attached but that full anonymity cannot be guaranteed. All of the participants understand that the text and any pictures or videos published in the article will be freely available on the internet and may be seen by the general public. The pictures, videos and text may also appear on other websites or in print and may be translated into other languages or used for commercial purposes.
Author contributions
Concept and design: FM, LL, GW, XR, MY, QC, XP, DL. Data acquisition: FM, LL, GW, XR, MY, QC, XP, DL. Data analysis and interpretation: FM, LL, GW, XR, MY, QC, XP, DL. Drafting manuscript: FM, LL, GW, XR, DL. Administrative, technical, or material support: FM, LL, GW, XP, DL. Study supervision: XP, DL. All authors contributed to the article and approved the submitted version.
Funding
This research was supported by the Sichuan Province Health Commission (17PJ070) and Chengdu Municipal Health Commission(2019079).
Acknowledgments
We thank Xinyi Zhang (Department of Endocrinology & Metabolism, Sichuan University West China Hospital, Chengdu, China), Dr. Wei He, Lei Chen, Xiu li and Hongde Chen (TB department, Public Health Clinic Centre of Chengdu).
Conflict of interest
The authors declare that the research was conducted in the absence of any commercial or financial relationships that could be construed as a potential conflict of interest.
Publisher’s note
All claims expressed in this article are solely those of the authors and do not necessarily represent those of their affiliated organizations, or those of the publisher, the editors and the reviewers. Any product that may be evaluated in this article, or claim that may be made by its manufacturer, is not guaranteed or endorsed by the publisher.
References
1. Riza AL, Pearson F, Ugarte-Gil C, Alisjahbana B, van de Vijver S, Panduru NM, et al. Clinical management of concurrent diabetes and tuberculosis and the implications for patient services. Lancet Diabetes Endocrinol (2014) 2(9):740–53. doi: 10.1016/S2213-8587(14)70110-X
2. Wei R, Li P, Xue Y, Liu Y, Gong W, Zhao W. Impact of diabetes mellitus on the immunity of tuberculosis patients: a retrospective, cross-sectional study. Risk Manage Healthc Policy (2022) 15:611–27. doi: 10.2147/RMHP.S354377
3. Jeon CY, Murray MB. Diabetes mellitus increases the risk of active tuberculosis: a systematic review of 13 observational studies. PloS Med (2008) 5(7):e152. doi: 10.1371/journal.pmed.0050152
4. Suwanpimolkul G, Kawkitinarong K, Manosuthi W, Sophonphan J, Gatechompol S, Ohata PJ, et al. Utility of urine lipoarabinomannan (LAM) in diagnosing tuberculosis and predicting mortality with and without HIV: prospective TB cohort from the Thailand Big City TB Research Network. Int J Infect Dis (2017) 59:96–102. doi: 10.1016/j.ijid.2017.04.017
5. Cáceres G, Calderon R, Ugarte-Gil C. Tuberculosis and comorbidities: treatment challenges in patients with comorbid diabetes mellitus and depression. Ther Adv Infect Dis (2022) 9:20499361221095831. doi: 10.1177/20499361221095831
6. Association T B o C M. Guidelines for diagnosis and treatment of pulmonary TB(2001 Subscription). J Crit Care Internal Med (2002) 8(04):225–9.
7. Society CD. Guideline for the prevention and treatment of type 2 diabetes mellitus in China(2020 edition)(Part 1). Chin J Pract Internal Med (2021) 41(08):668–95. doi: 10.19538/j.nk2021080106
8. Association D B o C M. Guideline for the prevention and treatment of type 2 diabetes mellitus in China(2020 edition)(Part 2). Chin J Pract Internal Med (2021) 41(09):757–84. doi: 10.19538/j.nk2021090106
9. Pizzol D, Di Gennaro F, Chhaganlal KD, Fabrizio C, Monno L, Putoto G, et al. Tuberculosis and diabetes: current state and future perspectives. Trop Med Int health: TM IH (2016) 21(6):694–702. doi: 10.1111/tmi.12704
10. Alemu A, Bitew ZW, Diriba G, Gumi B. Co-occurrence of tuberculosis and diabetes mellitus, and associated risk factors, in Ethiopia: a systematic review and meta-analysis. IJID Regions (2021) 1:82–91. doi: 10.1016/j.ijregi.2021.10.004
11. Gezahegn H, Ibrahim M, Mulat E. Diabetes mellitus and tuberculosis comorbidity and associated factors among bale zone health institutions, Southeast Ethiopia. Diab Metab Syndr Obes (2020) 13:3879–86. doi: 10.2147/DMSO.S248054
12. Kornfeld H, West K, Kane K, Kumpatla S, Zacharias RR, Martinez-Balzano C, et al. High prevalence and heterogeneity of diabetes in patients with TB in South India: a report from the effects of diabetes on tuberculosis severity (EDOTS) study. Chest (2016) 149(6):1501–8. doi: 10.1016/j.chest.2016.02.675
13. Bates M, Marais BJ, Zumla A. Tuberculosis comorbidity with communicable and noncommunicable diseases. Cold Spring Harbor Perspect Med (2015) 5(11):a017889. doi: 10.1101/cshperspect.a017889
14. Hayashi S, Chandramohan D. Risk of active tuberculosis among people with diabetes mellitus: systematic review and meta-analysis. Trop Med Int Health (2018) 23(10):1058–70. doi: 10.1111/tmi.13133
15. Liu Q, Yan W, Liu R, Bo E, Liu J, Liu M. The association between diabetes mellitus and the risk of latent tuberculosis infection: A systematic review and meta-analysis. Front Med (2022) 9:899821. doi: 10.3389/fmed.2022.899821
16. Dabhi PA, Thangakunam B, Gupta R, James P, Thomas N, Naik D, et al. Screening for prevalence of current TB disease and latent TB infection in type 2 diabetes mellitus patients attending a diabetic clinic in an Indian tertiary care hospital. PloS One (2020) 15(6):e0233385. doi: 10.1371/journal.pone.0233385
17. Calderon RI, Arriaga MB, Aliaga JG, Barreda NN, Sanabria OM, Barreto-Duarte B, et al. Persistent dysglycemia is associated with unfavorable treatment outcomes in patients with pulmonary tuberculosis from Peru. Int J Infect Dis (2022) 116:293–301. doi: 10.1016/j.ijid.2022.01.012
18. Magee MJ, Kempker RR, Kipiani M, Gandhi NR, Darchia L, Tukvadze N, et al. Diabetes mellitus is associated with cavities, smear grade, and multidrug-resistant tuberculosis in Georgia. Int J Tuberculosis Lung Dis (2015) 19(6):685–92. doi: 10.5588/ijtld.14.0811
19. Bantie GM, Wondaye AA, Arike EB, Melaku MT, Ejigu ST, Lule A, et al. Prevalence of undiagnosed diabetes mellitus and associated factors among adult residents of Bahir Dar city, northwest Ethiopia: a community-based cross-sectional study. BMJ Open (2019) 9(10):e030158. doi: 10.1136/bmjopen-2019-030158
20. Chiang C-Y, Lee J-J, Chien S-T, Enarson DA, Chang Y-C, Chen Y-T, et al. Glycemic control and radiographic manifestations of tuberculosis in diabetic patients. PloS One (2014) 9(4):e93397. doi: 10.1371/journal.pone.0093397
21. Sane Schepisi M, Navarra A, Altet Gomez MN, Dudnyk A, Dyrhol-Riise AM, Esteban J, et al. Burden and characteristics of the comorbidity tuberculosis—diabetes in Europe: TBnet prevalence survey and case-control study; proceedings of the Open forum infectious diseases, F. Great Clarendon St, Oxford: Oxford University Press US (2019).
22. Ralph AP, Ardian M, Wiguna A, Maguire GP, Becker NG, Drogumuller G, et al. A simple, valid, numerical score for grading chest x-ray severity in adult smear-positive pulmonary tuberculosis. Thorax (2010) 65(10):863–9. doi: 10.1136/thx.2010.136242
23. Critchley JA, Carey IM, Harris T, DeWilde S, Hosking FJ, Cook DG. Glycemic control and risk of infections among people with type 1 or type 2 diabetes in a large primary care cohort study. Diabetes Care (2018) 41(10):2127–35. doi: 10.2337/dc18-0287
24. Chiang CY, Bai KJ, Lin HH, Chien ST, Lee JJ, Enarson DA, et al. The influence of diabetes, glycemic control, and diabetes-related comorbidities on pulmonary tuberculosis. PloS One (2015) 10(3):e0121698. doi: 10.1371/journal.pone.0121698
25. Dousa KM, Hamad A, Albirair M, Al Soub H, Elzouki A-N, Alwakeel MI, et al. Impact of diabetes mellitus on the presentation and response to treatment of adults with pulmonary tuberculosis in Qatar; proceedings of the Open forum infectious diseases, F. Great Clarendon St, Oxford: Oxford University Press US (2019).
26. Salindri AD, Kipiani M, Kempker RR, Gandhi NR, Darchia L, Tukvadze N, et al. Diabetes reduces the rate of sputum culture conversion in patients with newly diagnosed multidrug-resistant tuberculosis; proceedings of the Open forum infectious diseases, F. Great Clarendon St, Oxford: Oxford University Press (2016).
27. Huangfu P, Ugarte-Gil C, Golub J, Pearson F, Critchley J. The effects of diabetes on tuberculosis treatment outcomes: an updated systematic review and meta-analysis. Int J Tuberculosis Lung Dis (2019) 23(7):783–96. doi: 10.5588/ijtld.18.0433
28. Lewinsohn DM, Leonard MK, LoBue PA, Cohn DL, Daley CL, Desmond E, et al. Official American Thoracic Society/Infectious Diseases Society of America/Centers for Disease Control and Prevention clinical practice guidelines: diagnosis of tuberculosis in adults and children. Clin Infect Dis (2017) 64(2):e1–e33. doi: 10.1093/cid/ciw694
29. Shin H-J, Kim T-O, Oh H-J, Park H-Y, Chang J-S, Ahn S, et al. Impact of diabetes mellitus on indeterminate results of the QuantiFERON TB Gold In-Tube test: A propensity score matching analysis. PloS One (2017) 12(7):e0181887. doi: 10.1371/journal.pone.0181887
30. Sen T, Joshi SR, Udwadia ZF. Tuberculosis and diabetes mellitus: merging epidemics. J Assoc Phys India (2009) 57(1):399–404.
31. Mily A, Sarker P, Taznin I, Hossain D, Haq MA, Kamal SM, et al. Slow radiological improvement and persistent low-grade inflammation after chemotherapy in tuberculosis patients with type 2 diabetes. BMC Infect Dis (2020) 20:1–15. doi: 10.1186/s12879-020-05473-x
32. Haddad MB, Lash TL, Castro KG, Hill AN, Navin TR, Gandhi NR, et al. Tuberculosis infection among people with diabetes: United States population differences by race/ethnicity. Am J Prev Med (2020) 58(6):858–63. doi: 10.1016/j.amepre.2019.12.010
33. Stevenson CR, Critchley JA, Forouhi NG, Roglic G, Williams BG, Dye C, et al. Diabetes and the risk of tuberculosis: a neglected threat to public health? Chronic illness (2007) 3(3):228–45. doi: 10.1177/1742395307081502
34. Restrepo BI, Fisher-Hoch SP, Pino PA, Salinas A, Rahbar MH, Mora F, et al. Tuberculosis in poorly controlled type 2 diabetes: altered cytokine expression in peripheral white blood cells. Clin Infect Dis (2008) 47(5):634–41. doi: 10.1086/590565
35. Kassa D, Ran L, Geberemeskel W, Tebeje M, Alemu A, Selase A, et al. Analysis of immune responses against a wide range of Mycobacterium tuberculosis antigens in patients with active pulmonary tuberculosis. Clin Vaccine Immunol (2012) 19(12):1907–15. doi: 10.1128/CVI.00482-12
36. Sanchez-Jimenez R, Ceron E, Bernal-Alcantara D, Castillejos-Lopez M, Gonzalez-Trujano E, Negrete-García MC, et al. Association between IL-15 and insulin plasmatic concentrations in patients with pulmonary tuberculosis and type 2 diabetes. Tuberculosis (2018) 111:114–20. doi: 10.1016/j.tube.2018.06.009
37. Hodgson K, Morris J, Bridson T, Govan B, Rush C, Ketheesan N. Immunological mechanisms contributing to the double burden of diabetes and intracellular bacterial infections. Immunology (2015) 144(2):171–85. doi: 10.1111/imm.12394
38. Delgado JC, Baena A, Thim S, Goldfeld AE. Aspartic acid homozygosity at codon 57 of HLA-DQ β is associated with susceptibility to pulmonary tuberculosis in Cambodia. J Immunol (2006) 176(2):1090–7. doi: 10.4049/jimmunol.176.2.1090
Keywords: TB, DM, glycemic control status, cavity occurrence, sputum positive, lesions
Citation: Meng F, Lan L, Wu G, Ren X, Yuan X, Yang M, Chen Q, Peng X and Liu D (2023) Impact of diabetes itself and glycemic control status on tuberculosis. Front. Endocrinol. 14:1250001. doi: 10.3389/fendo.2023.1250001
Received: 29 June 2023; Accepted: 12 October 2023;
Published: 08 November 2023.
Edited by:
Albert Lecube, Catalan Health Institute (ICS), SpainReviewed by:
Abilash Nair, Government Medical College, IndiaCarmen Judith Serrano, Mexican Social Security Institute (IMSS), Mexico
Siti Syarifah, Universitas Sumatera Utara, Indonesia
Copyright © 2023 Meng, Lan, Wu, Ren, Yuan, Yang, Chen, Peng and Liu. This is an open-access article distributed under the terms of the Creative Commons Attribution License (CC BY). The use, distribution or reproduction in other forums is permitted, provided the original author(s) and the copyright owner(s) are credited and that the original publication in this journal is cited, in accordance with accepted academic practice. No use, distribution or reproduction is permitted which does not comply with these terms.
*Correspondence: Dafeng Liu, bGRmMzEyQDEyNi5jb20=; Xiaoli Peng, eGlhb3Blbmc5NjdAc29odS5jb20=
†These authors have contributed equally to this work
‡ORCID: Dafeng Liu, orcid.org/0000-0002-6792-641X