 Longti Li1†
 Ya Shao
- 1Department of Nursing, TaiHe Hospital, Hubei University of Medicine, Shiyan, China
- 2Innovation Centre of Nursing Research, TaiHe Hospital, Hubei University of Medicine, Shiyan, China
- 3Health Management Center, TaiHe Hospital, Hubei University of Medicine, Shiyan, China
Background: Insulin resistance (IR), a risk factor for cardiovascular diseases, has garnered significant attention in scientific research. Several studies have investigated the correlation between IR and coronary artery calcification (CAC), yielding varying results. In light of this, we conducted a systematic review to investigate the association between IR as evaluated by the homeostasis model assessment (HOMA-IR) and CAC.
Methods: A comprehensive search was conducted to identify relevant studies in PubMed, Embase, Scopus, and Web of Science databases. In addition, preprint servers such as Research Square, BioRxiv, and MedRxiv were manually searched. The collected data were analyzed using either fixed or random effects models, depending on the heterogeneity observed among the studies. The assessment of the body of evidence was performed using the GRADE approach to determine its quality.
Results: The current research incorporated 15 studies with 60,649 subjects. The analysis revealed that a higher category of HOMA-IR was associated with a greater prevalence of CAC in comparison to the lowest HOMA-IR category, with an OR of 1.13 (95% CI: 1.06–1.20, I2 = 29%, P < 0.001). A similar result was reached when HOMA-IR was analyzed as a continuous variable (OR: 1.27, 95% CI: 1.14–1.41, I2 = 54%, P < 0.001). In terms of CAC progression, a pooled analysis of two cohort studies disclosed a significant association between increased HOMA-IR levels and CAC progression, with an OR of 1.44 (95% CI: 1.04–2.01, I2 = 21%, P < 0.05). It is important to note that the strength of the evidence was rated as low for the prevalence of CAC and very low for the progression of CAC.
Conclusion: There is evidence to suggest that a relatively high HOMA-IR may be linked with an increased prevalence and progression of CAC.
Introduction
Insulin resistance (IR) refers to a pathological condition where the capacity of insulin to facilitate the absorption and utilization of glucose is compromised due to diverse factors. Consequently, the body secretes excessive insulin, leading to hyperinsulinemia (1). Studies indicate that IR is independent of conventional risk factors but is closely linked to cardiovascular disease (2), including coronary artery disease and unfavorable cardiovascular events (3–5). One of the key mechanisms by which IR contributes to cardiovascular disease is the promotion of arterial stiffness, impaired vasodilation, and calcification (6, 7). Following the introduction of the homeostasis model assessment of IR (HOMA-IR) by Matthews (8), it has become widely used in clinical research. Numerous studies have demonstrated its excellent correlation with the gold-standard hyperinsulinemic clamp test (9).
Coronary artery calcification (CAC) is an important indicator of subclinical arteriosclerosis (10), leading to reduced vascular compliance and consequently affecting myocardial perfusion. The timely detection of factors associated with CAC in the general population has a favorable impact on the subsequent cardiovascular disease burden (11). Studies have established a strong association between moderate-to-severe CAC and adverse cardiovascular events (12). At the same time, CAC proves to be a dependable instrument for predicting the probability of upcoming cardiovascular occurrences, especially in individuals who show no symptoms (13). The progression from CAC to a severe cardiovascular event often follows a gradual pathophysiologic process, and individuals typically display no apparent signs or symptoms until the cardiovascular event occurs.
Although the relationship between IR and adverse cardiovascular events is well established by research, the relationship between IR and CAC lacks sufficient evidence. Several studies have revealed a strong link between the two (14, 15), whereas others have found no significant correlation (16–18). The computed tomography-based Agatston score (19) is frequently utilized as a non-invasive approach for evaluating CAC. Considering this, based on the Agatston method, the current study performed a meta-analysis to explore the association between IR and CAC.
Methods
This study was not registered on any platform, and the protocol was not published anywhere. However, we strictly adhere to the Preferred Reporting items for Systematic Reviews and Meta-analyses (20). See Supplementary File 1.
Search strategy
Two independent researchers systematically searched the PubMed, Embase, Scopus, and Web of Science databases. Manual searches were also performed on the Research Square, BioRxiv, and MedRxiv preprint servers to reduce the potential impact of publication bias. Retrieval strategies incorporating Boolean operators were utilized for the following keywords: (1) “insulin resistance” OR “homeostasis model assessment” OR “HOMA” and (2) “coronary artery calcification” OR “coronary calcification” OR “coronary artery calcium” OR “coronary calcium” OR “subclinical coronary atherosclerosis.” A supplementary manual search was conducted through references to relevant literature. The final literature search was updated to 16/09/2023. A detailed search strategy is provided in Supplementary File 2. Endnote software was used in the literature screen process.
Selection of studies
The criteria for inclusion in the literature were as follows: (1) adult participants; (2) reported on the relationship between IR and CAC; (3) assessed IR using the homeostasis model assessment of IR (HOMA-IR) method; (4) evaluated the prevalence or progression of CAC based on the Agatston score; (5) reported effect estimates while accounting for underlying confounding variables. Conference abstracts, case reports, reviews, letters, comments, and expert opinions were excluded. CAC was defined using the definition provided in the original study. The effect estimates were evaluated using risk, hazard, or odds ratio (OR) values.
Data extraction and quality assessment
Literature retrieval, data extraction, and quality evaluation were performed independently by two researchers (YH and XZ). In case of any discrepancies, a consensus was reached by consulting a third researcher (YS) to resolve the dispute. If vital data for analysis were found to be missing, we would approach the respective paper’s corresponding author to acquire the original data. The following information was extracted: author information, year, country, research type, study population characteristics, sample size, age, gender, disease status, HOMA-IR analysis method, reported outcomes, inclusion and exclusion criteria of subjects, variables adjusted, and outcome definitions. To evaluate the quality of the literature incorporated in this research, we applied the Newcastle–Ottawa Scale (NOS) (21). This scale, which employs a scoring system ranging from 0 to 9, was utilized for assessing the selection of research populations, comparability among cohorts, and outcome measurement.
Statistical analysis
We utilized pooled ORs to assess the association between HOMA-IR and CAC. One study separately reported ORs for the relationship between HOMA-IR and CAC based on glycated hemoglobin quartiles (22), whereas another reported ORs for different CAC risk levels (23). Therefore, we combined these groupings, calculated ORs, and analyzed them using a random-effects model. We selected the most appropriately adjusted model for confounding factors in multifactor analyses with multiple models and extracted the corresponding estimates.
When HOMA-IR was analyzed as a categorical variable, we extracted the estimates of its highest quartile to the first quartile. When HOMA-IR was presented as a continuous variable, we extracted the value of each unit increase in the variable. To ensure a normal distribution, a log transformation was applied to both the ORs and their corresponding 95% CIs. Heterogeneity was evaluated using the Cochrane Q and I2 tests (24). A P-value below 0.1 for the Q-test indicated significant heterogeneity. Heterogeneity was considered low if I2 was less than 40%, whereas 40%–60% indicated moderate heterogeneity. In cases where heterogeneity was evident, sources of heterogeneity were sought based on study characteristics and sensitivity analyses. If heterogeneity persisted, a random effects model was employed to combine the information and adjust for different sample sizes, which helped mitigate heterogeneity’s impact (25).
In order to guarantee the dependability of the combined findings, a sensitivity analysis was performed, wherein each study was sequentially excluded, and the corresponding effect on the pooled OR estimates was evaluated (26). Further subgroup analyses were performed to investigate potential differences between integrated ORs with different characteristics, such as demographics and comorbid conditions. In addition, the symmetry of funnel plots was assessed to determine the potential for publication bias. We utilized RevMan (Version 5.1; Cochrane Collaboration, Oxford, UK) and STATA software to conduct this systematic review.
Certainty of evidence
Two researchers (LL and HZ) utilized the GRADE (Grading of Recommendations, Assessment, Development and Evaluation) approach to assess the quality of evidence. Following the GRADE principle, the initial level of evidence obtained from observational research was deemed as having a low quality. Five factors were taken into account to diminish the credibility of the evidence, which encompassed limitations in the study design, inconsistency, indirectness, imprecision, and the presence of publication bias (27). Additionally, three factors enhance the quality of evidence: large effect sizes, potential confounders, and dose–response relationships (28). If factors increased the evidence quality during the evaluation, it was upgraded to moderate quality. Conversely, if factors diminished the quality of evidence, it was downgraded to very low (29).
Results
Literature search
Following the exclusion of duplicate articles in the initial literature search, a total of 1,279 articles were obtained. However, upon reviewing the titles and abstracts, 1,247 articles were deemed irrelevant and subsequently excluded from further consideration. After a thorough review of 32 relevant studies, it was found that five of them used a non-HOMA-IR method for IR evaluation, and 11 did not report study-related results. One study was excluded to avoid duplication of data sets based on a survey of the same population (30), and we used a more recent study of this group. Ultimately, 15 articles were included in the current research (14, 15, 17, 18, 22, 23, 31–39). The entire process of literature selection is shown in Figure 1.
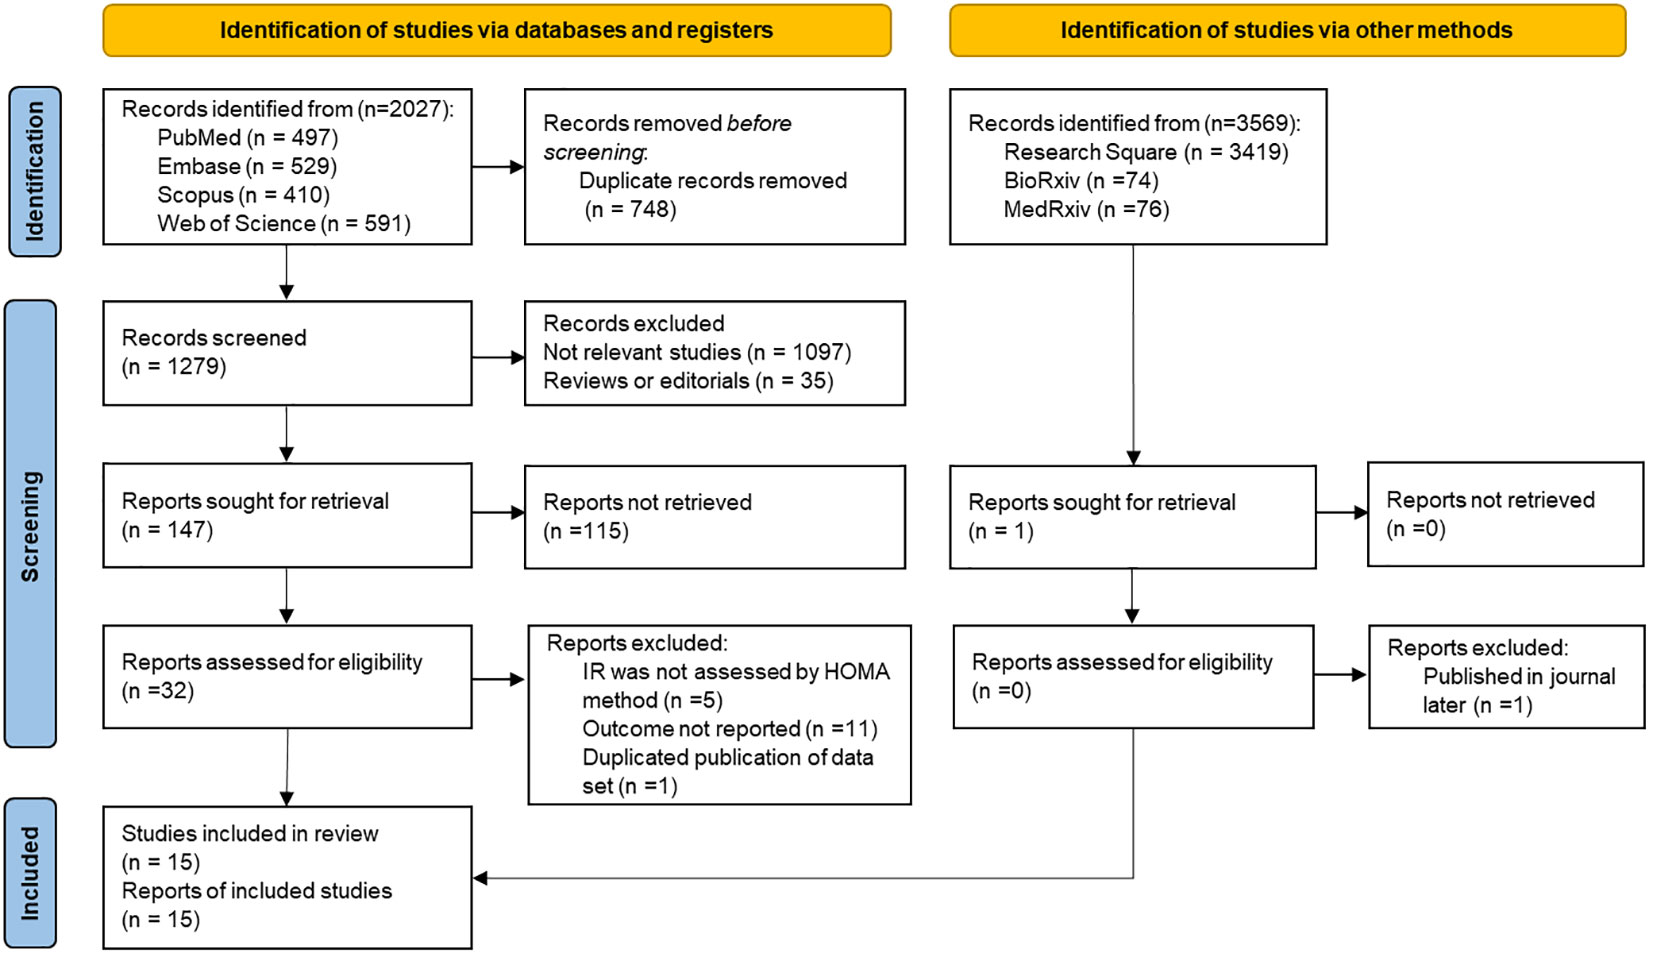
Figure 1 Flowchart of literature selection and screening process.
Study characteristics and quality assessment
Table 1 presents a comprehensive overview of the selected studies comprising 60,649 subjects from 15 studies. The studies were carried out across multiple countries, comprising the United States (17, 18, 23, 32, 35, 36, 38), South Korea (14, 22, 31, 37, 39), Iran (33), Mexico (34), and Japan (15). Five were cohort studies (14, 15, 18, 31, 38), whereas the remaining 10 were cross-sectional (17, 22, 23, 32–37, 39). The population of the studies comprised community residents or citizens (15, 17, 18, 33–36, 38), participants undergoing health screening (14, 22, 31, 32, 37, 39), and chronic kidney disease patients (23). There were 12 studies that excluded individuals with cardiovascular disease (CVD) (14, 17, 18, 22, 31–37, 39). One study partially excluded individuals with CVD by only excluding those with coronary heart disease (15), whereas two other studies included individuals with CVD in their study population (23, 38).
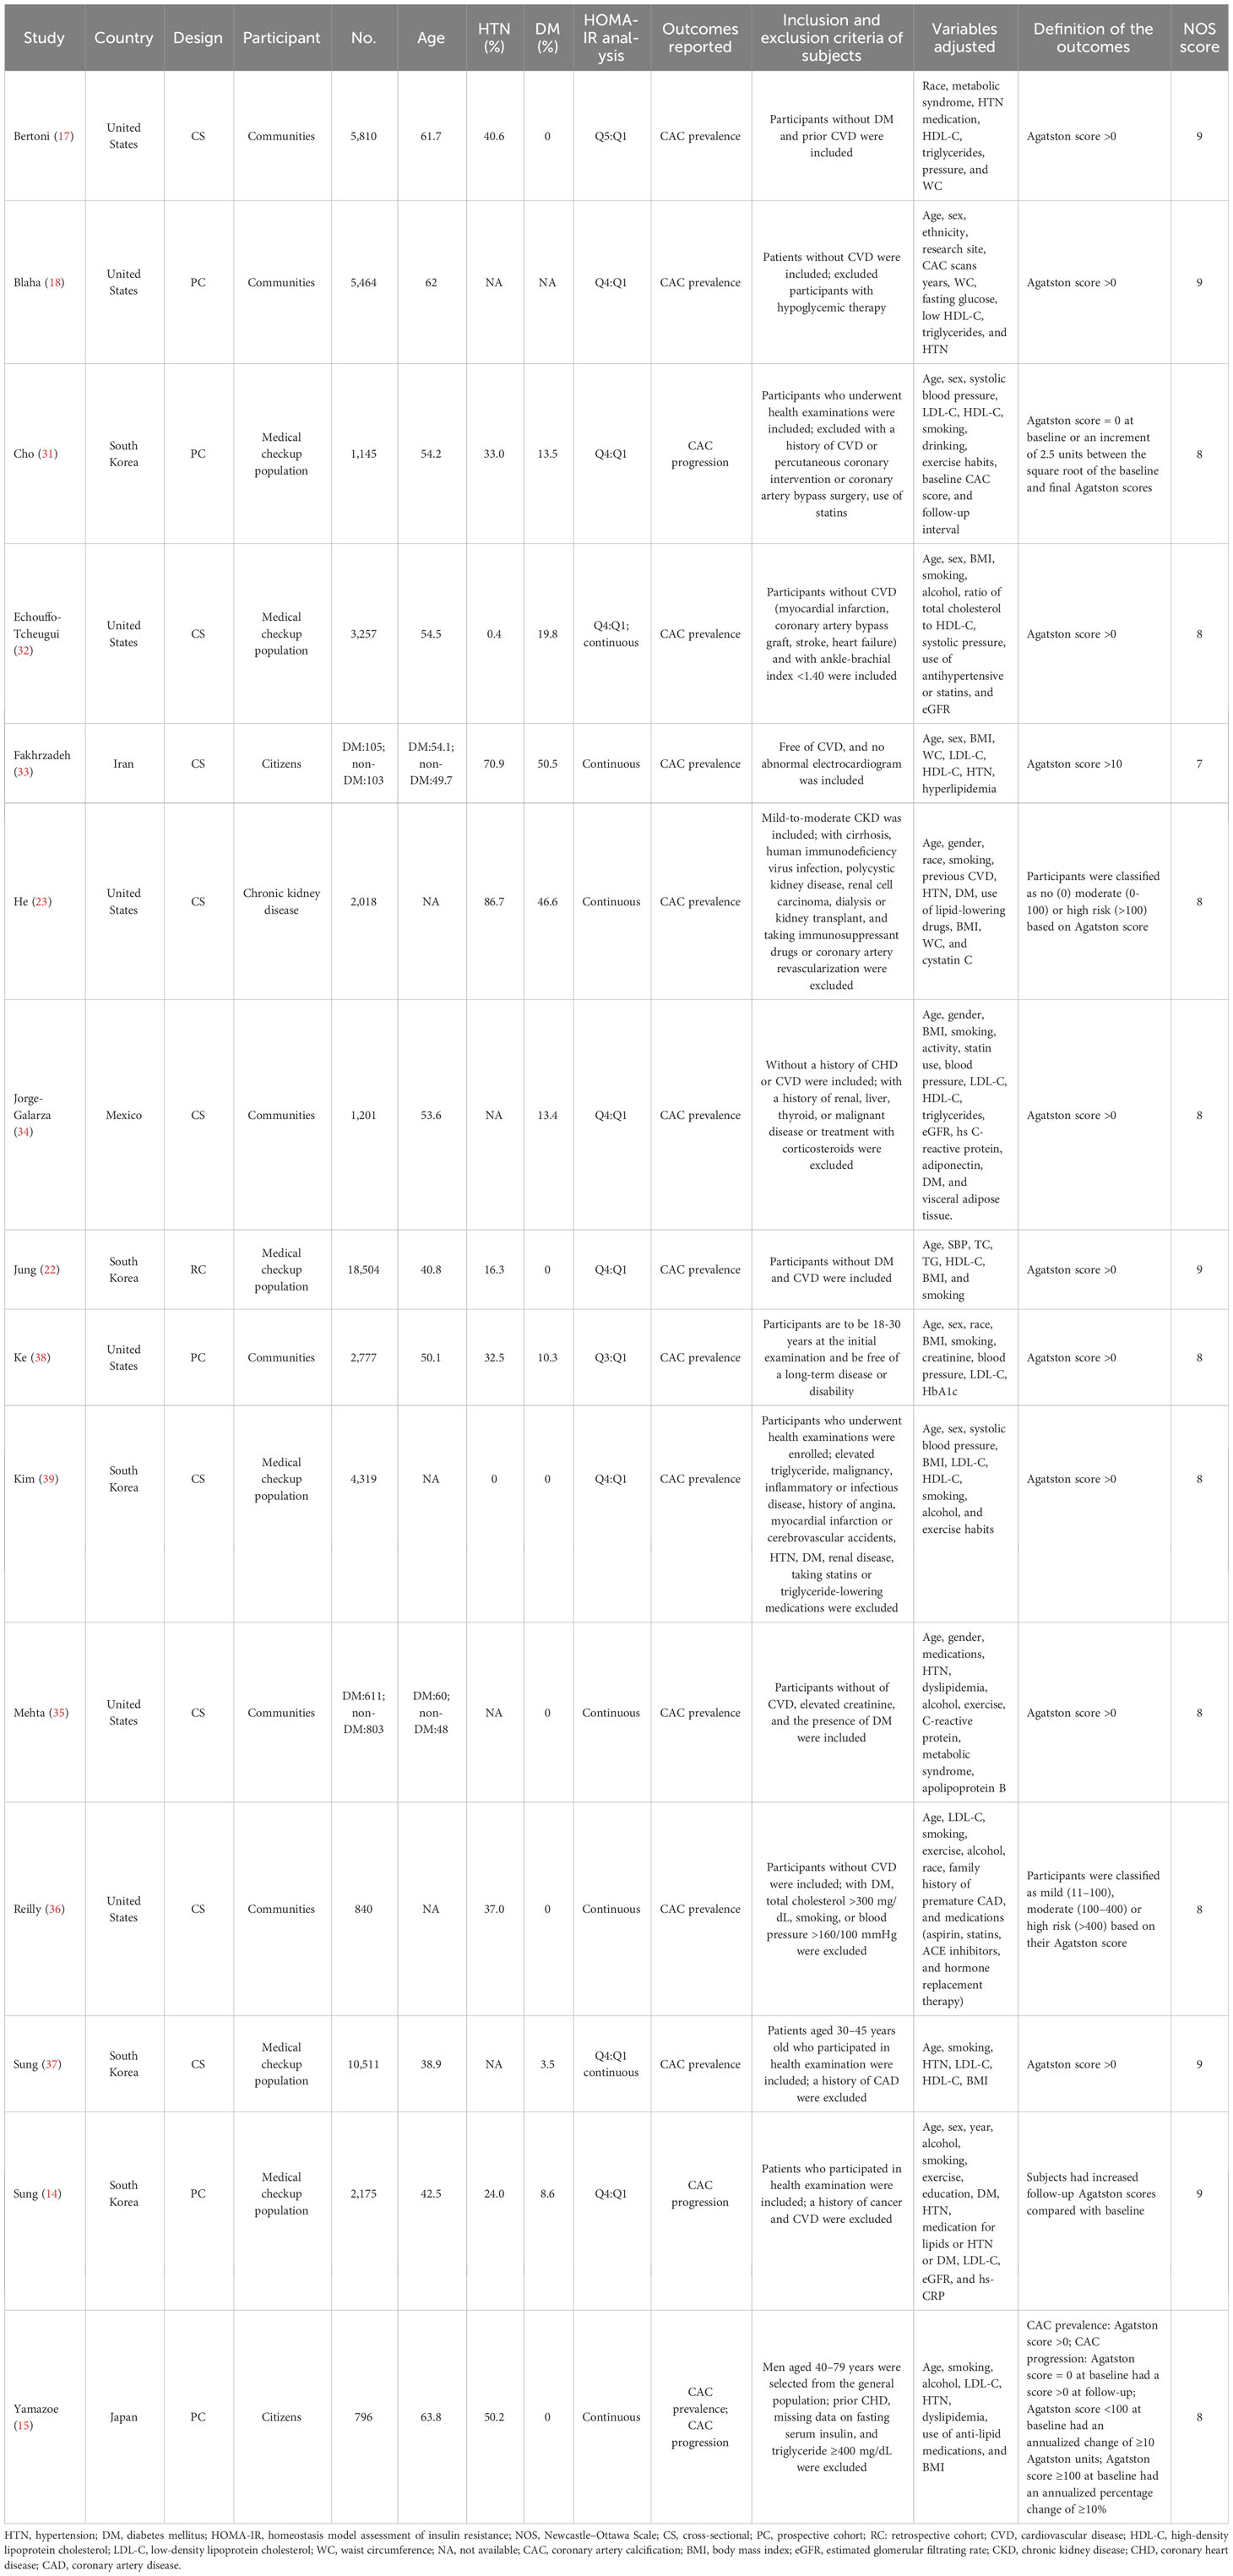
Table 1 Characteristics of the included studies.
The participants involved in the studies exhibited a considerable range in size, with sample sizes ranging from 208 to 18,504. Additionally, the studies displayed diversity in the mean age of the participants, ranging from 38.8 to 63.8 years. In terms of the analysis of HOMA-IR, eight studies used categorical variables (14, 17, 18, 22, 31, 34, 38, 39), whereas five used continuous variables (15, 23, 33, 35, 36) and two used both (32, 37). There were 12 studies that reported CAC prevalence (17, 18, 22, 23, 32–39), two reported CAC progression (14, 31), and one reported CAC prevalence and progression in both (15).
The studies used different criteria to determine the prevalence and progression of CAC, with all studies utilizing the Agatston score methodology for assessment. For the prevalence of CAC, 10 studies used an Agatston score above 0 as the criterion for “judging” (15, 17, 18, 22, 32, 34, 35, 37–39), one had a CAC score more than 10 (33), and two studies classified it into multiple risk classes based on the Agatston score (23, 36). Regarding the progression of CAC, three studies had their criteria for judging the progression of CAC (14, 15, 31). The NOS score for the selected studies ranged from 7 to 9. Details are presented in Table 1.
HOMA-IR and CAC prevalence
When analyzing HOMA-IR as a categorical variable, a fixed-effects model was utilized to pool data from eight studies (14, 17, 18, 22, 32, 34, 37, 39). The outcomes of the analysis showed that individuals who belonged to the highest HOMA-IR group demonstrated an augmented occurrence of CAC among subjects who fell within the lowest classification [OR: 1.13, 95% CI 1.06–1.20, I2 = 29%, P <0.001; Figure 2A]. A similar outcome was obtained when HOMA-IR was treated as a continuous variable (15, 23, 32, 33, 35–37). The application of a random-effects model to analyze the data revealed that higher HOMA-IR values were also correlated with an elevated prevalence of CAC [OR: 1.27, 95% CI: 1.14–1.41, I2 = 54%, P < 0.001; Figure 2B].
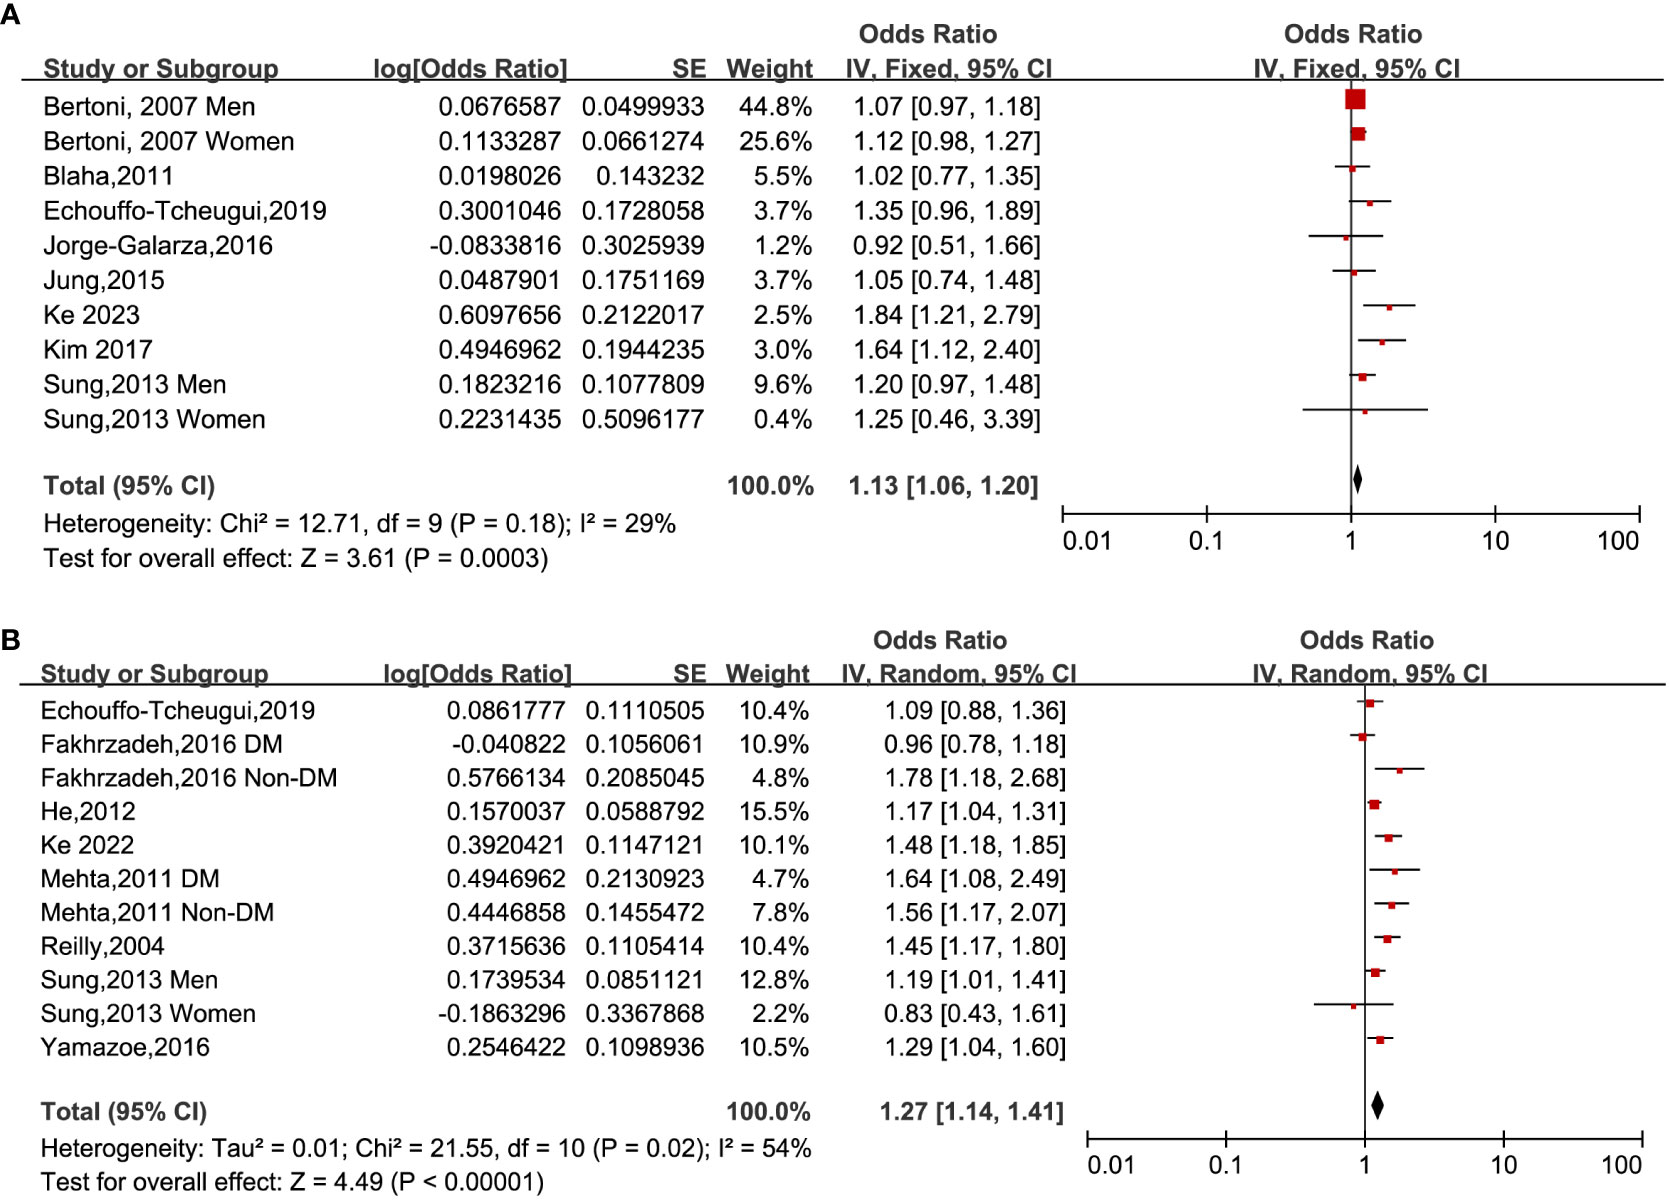
Figure 2 Forest plots of the ORs for CAC prevalence associated with the HOMA-IR. (A): HOMA-IR was estimated as a categorical variable. (B): HOMA-IR was estimated as a continuous variable.
Upon conducting sensitivity analyses, we observed that removing any of the studies did not significantly alter heterogeneity or pooled OR values. Specifically, the ORs for categorical variables ranged from 1.11 to 1.18. Likewise, the ORs for continuous variables ranged from 1.24 to 1.30. All of the above analyses demonstrate P values less than 0.001. See Tables 2 and 3.
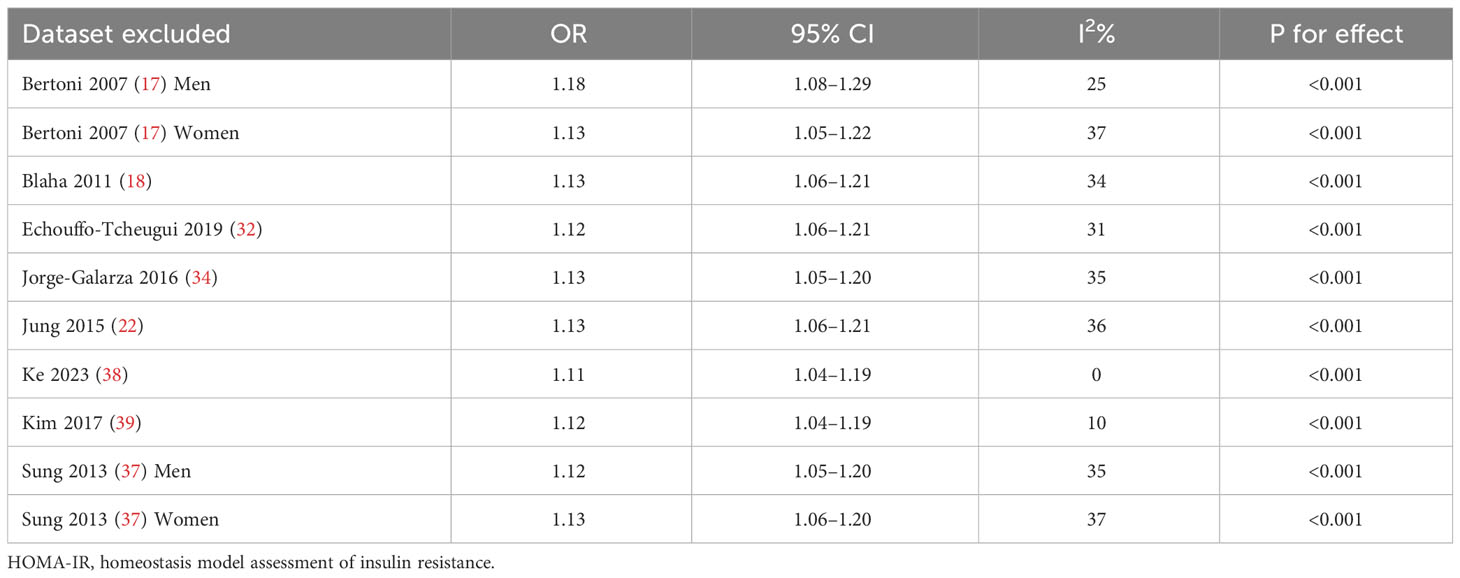
Table 2 Results of sensitivity analysis when the HOMA-IR was applied as a categorical variable.
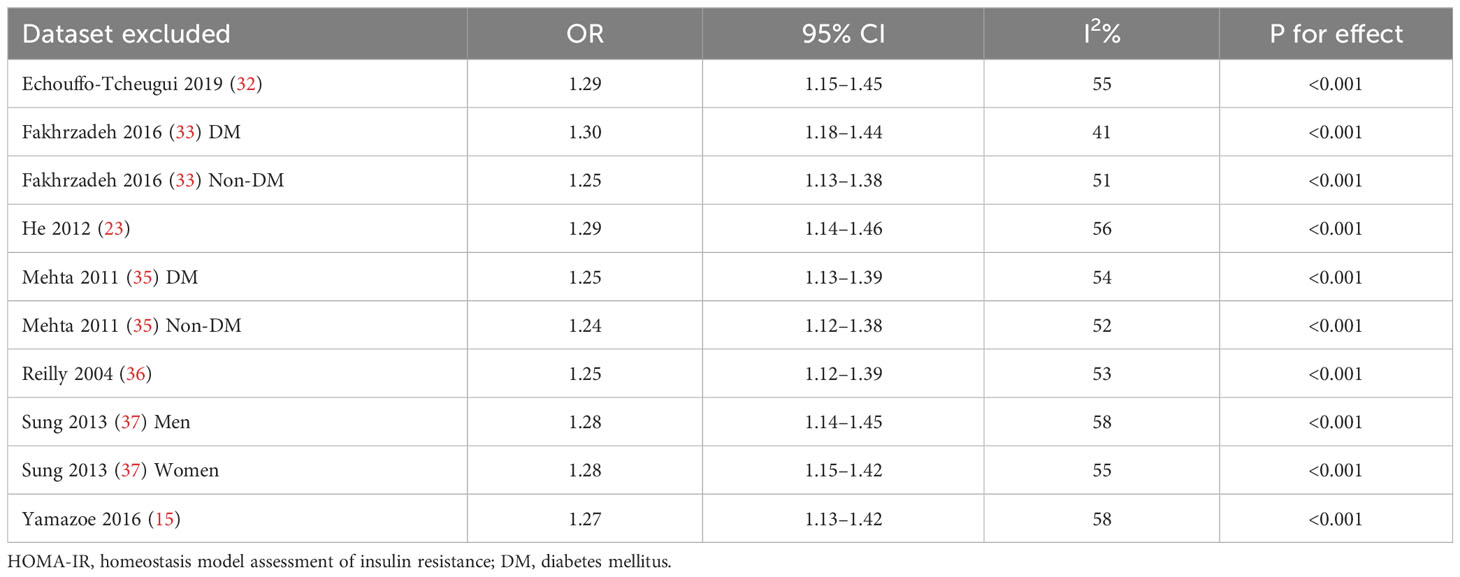
Table 3 Results of sensitivity analysis when the HOMA-IR was applied as a continuous variable.
Subgroup analysis
To account for the potential impact of different clinical characteristics of study subjects on the results, we conducted a subgroup analysis (refer to Table 4). Our analysis revealed that the source of study participants did not significantly affect the pooled ORs in either community or non-community residents, physical examination, or non-physical examination population (all P > 0.05).
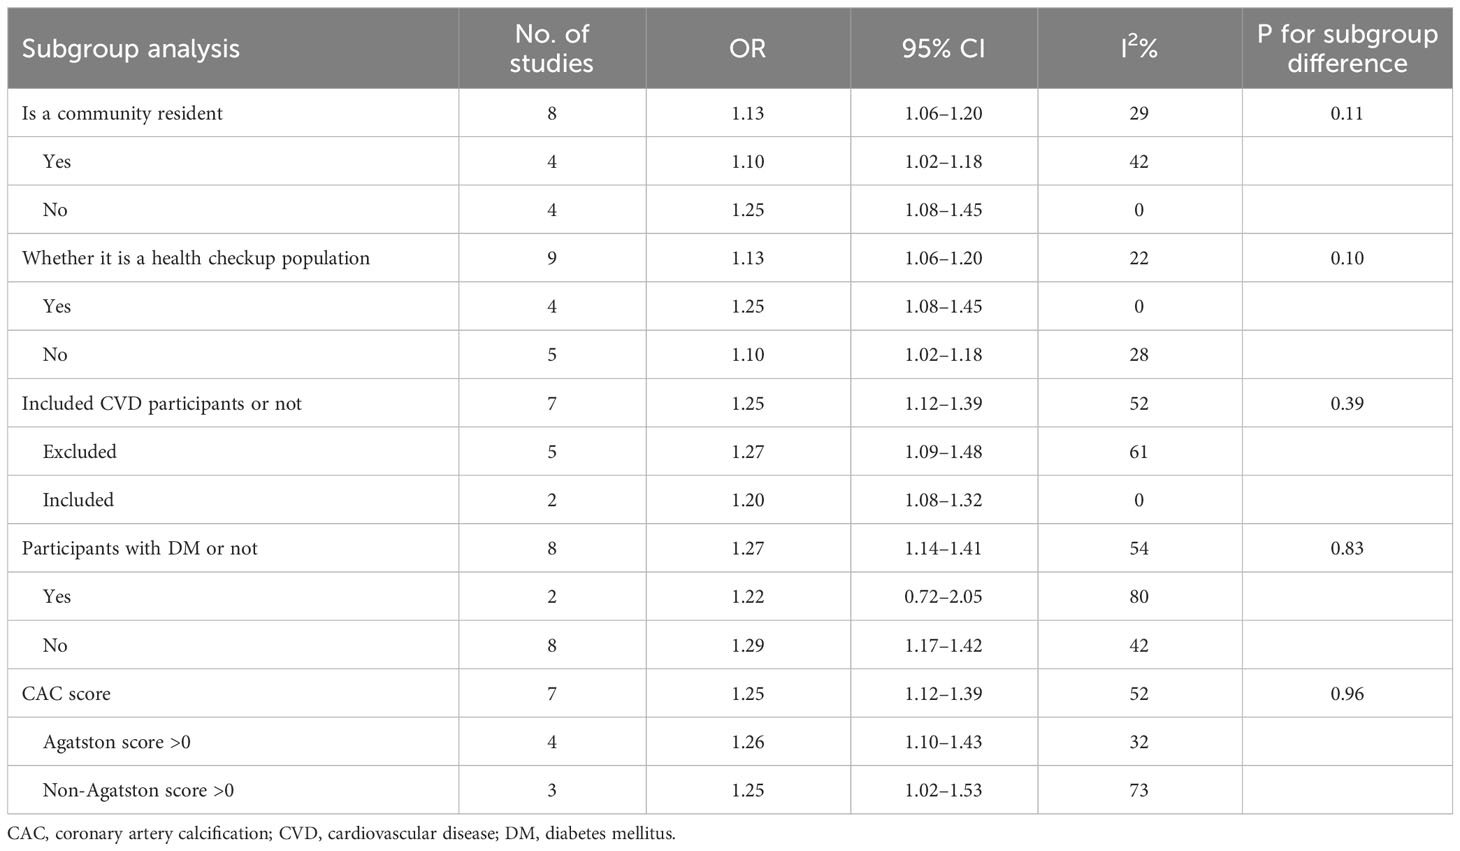
Table 4 Risk of CAC according to different characteristics of included studies.
We conducted a risk factor analysis for CVD. Our analysis included examining whether participants with CVD were excluded from the study population. When HOMA-IR was used as a continuous variable, there was no statistical difference in subgroups between complete exclusion and partial exclusion/no exclusion of participants with CVD (P > 0.05). When HOMA-IR was used as a categorical variable, one study did not exclude patients with CVD from the population (38). However, our sensitivity analysis in Table 2 showed that excluding this study did not significantly change the results. Considering that IR might differ in diabetes, we performed subgroup analyses according to whether participants had diabetes or not. The results showed that the association between IR and CAC was statistically significant only among the non-diabetic subgroup (OR: 1.29, 95% CI: 1.17–1.42) but not in the diabetes subgroup (OR: 1.22, 95% CI: 0.72–2.05).
Due to data limitations, subgroup analyses for people with or without hypertension and different lipid profiles could not be performed. However, out of all the studies in the multifactorial analysis, only one did not adjust for hypertension/blood pressure (36) and the other did not adjust for lipid status (23). Notably, excluding these two studies from the sensitivity analysis did not affect the overall combined-OR value.
In addition, differences in CAC prevalence evaluation criteria among the included studies were considered. Subgroup analysis showed that an Agatston score >0 did not show a difference from the subgroup with a non-Agatston score > 0.
HOMA-IR and CAC progression
A meta-analysis of two longitudinal cohort research (14, 31) showed that HOMA-IR was statistically related to CAC progression when used as a categorical variable (OR: 1.44, 95% CI 1.04–2.01, I2 = 21%, P < 0.05). In addition, a cohort study (15) of community residents investigating HOMA-IR as a continuous variable identified its independent relationship with CAC progression (OR: 1.25, 95% CI: 1.01–1.55, P < 0.05).
Publication bias
In order to evaluate the probability of publication bias, we employed funnel plots. The scatter on the funnel plot displayed a visually balanced distribution, thereby suggesting a reduced likelihood of publication bias (Figure 3). Additionally, the outcomes from the Egger regression analysis remained consistent when examining HOMA-IR as both a categorical and continuous variable (P =0.149 and 0.297, respectively).
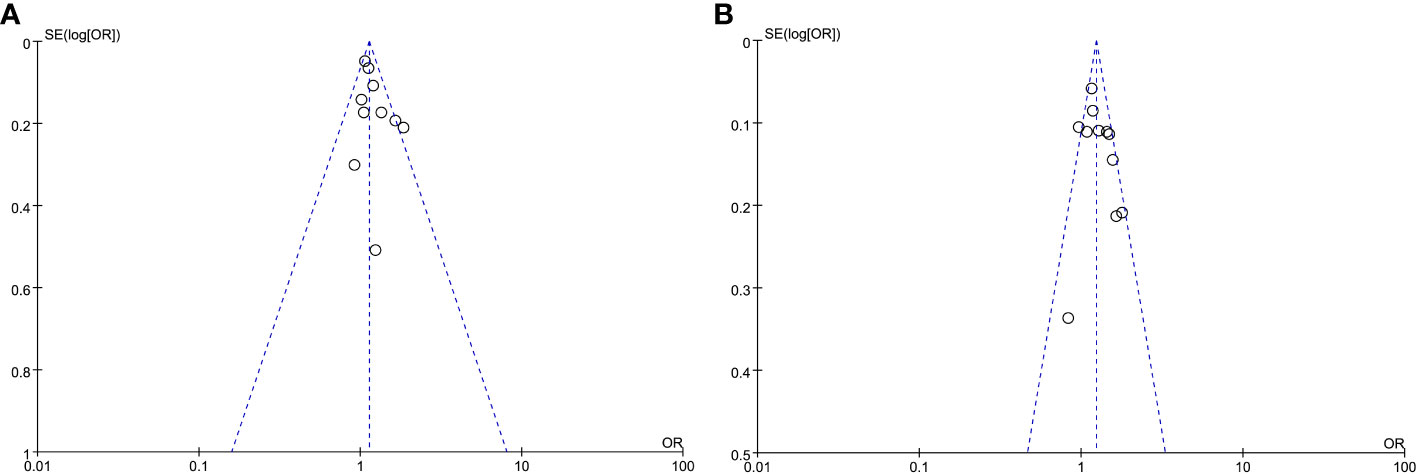
Figure 3 Meta-analysis funnel plots of the HOMA-IR with CAC prevalence. (A) HOMA-IR was applied as a categorical variable. (B) HOMA-IR was applied as a continuous variable.
Overall body of evidence quality
Of the downgrading factors regarding the CAC prevalence, in terms of study limitations and indirectness, the included studies have a broad representation of the population and use standard measurement methods for both exposure and outcome indicators, which reduces potential concerns. At the same time, the point estimates of the included studies show high similarity, with overlapping confidence intervals in most studies. Additionally, there was low to moderate heterogeneity among the included studies, all of these indicating consistencies. The study’s large sample size also mitigates concerns about imprecision. Furthermore, there is no evidence of publication bias, eliminating any concern in this regard. However, the quality of evidence cannot be upgraded as the pooled OR values are all less than 2. Confounding factors pose a challenge as not all studies excluded patients with cardiovascular disease and only some considered insulin/hyperglycemic drugs. These factors prevent us from eliminating concerns about plausible residual biases. Furthermore, the inability to evaluate the dose–response relationship also hinders its upgrade. Regarding CAC progression, we have concerns about potential bias in outcome measures because of the use of different Agatston method-based evaluation methods in each of the three included studies. Therefore, the quality of evidence rating will directly be very low.
Discussion
In the present meta-analysis of observational studies, we investigated the correlation between IR and CAC, as evaluated by the HOMA-IR method. The findings revealed a noteworthy correlation between HOMA-IR and the prevalence and progression of CAC. Regarding CAC prevalence, comparable outcomes were observed regardless of whether HOMA-IR was analyzed as a categorical variable or continuous. In relation to CAC progression, the pooled analysis indicated that HOMA-IR was also positively linked with CAC progression when analyzed as a categorical variable. Sensitivity analyses and subgroup analyses based on different clinical characteristics confirmed the stability of these results. The level of evidence for the link of HOMA-IR with CAC prevalence and CAC progression was rated as low and very low, respectively.
CAC is significantly linked to various cardiovascular and cerebrovascular disorders. The degree of calcification serves as a dependable marker for coronary atherosclerosis, and the CAC score provides valuable information that surpasses conventional risk factors for heart disease (40). In asymptomatic populations, the CAC score is even the most effective predictor of cardiovascular incidents (41). It can enhance the risk prediction of individuals with borderline or moderate risks. Qualitative assessment of CAC is essential for the earlier identification of coronary atherosclerosis (42). As per the ACC/AHA guidelines (43), individuals with a CAC score exceeding 100 or who place within the 75th percentile are at heightened risk for unfavorable cardiovascular events and, thus, are advised to undergo statin therapy. On the other hand, subjects with a CAC score of 0 displayed a decreased occurrence of cardiovascular events and a substantially lower mortality rate from the disease (44–46). Therefore, identifying the risk factors associated with CAC and screening out potentially high-risk groups may help facilitate early clinical warning.
Research studies have indicated that surrogate markers of IR, such as the metabolic score for IR and the triglyceride glucose index, are linked with a higher risk of CAC (47–49). In particular, the triglyceride glucose index has attracted considerable attention among researchers. However, a review by Solis et al. reveals that the evidence that upholds the application of the index for assessing IR is of moderate-to-low quality (50). As such, the diagnostic efficacy of these alternative indicators for assessing IR requires further rigorous validation.
The assessment of IR through the HOMA-IR model (8, 51) stands as the prevailing approach within clinical research. Its extensive validation has solidified its reliability in evaluating IR (52). In their study, González-González et al. showcased a strong association between the HOMA-IR and a multitude of health outcomes (53). However, the progression of asymptomatic individuals to severe cardiovascular disease often takes decades. Therefore, investigating whether there is a correlation between HOMA-IR and CAC during this period warrants attention.
As far as we are aware, this meta-analysis is the first examination of the correlation between HOMA-IR and CAC. Our discoveries indicate that HOMA-IR exhibits a positive association with CAC for individuals with elevated HOMA-IR, showcasing a 1.13- and 1.27-fold increased likelihood of developing CAC prevalence. These findings hold regardless of whether HOMA-IR was examined as a categorical or continuous variable. The HOMA-IR method was employed in all included studies to evaluate IR. In contrast, the Agatston method was utilized to assess CAC, which is widely accepted in clinical practice and recognized as the gold standard for calcification (11). Thus, the included studies had good homogeneity in their evaluation methods.
Subgroup and sensitivity analyses were performed to account for potential interference from cardiovascular factors. These analyses were based on whether patients with cardiovascular disease were excluded from the baseline data and whether variables such as hypertension or blood pressure and lipid status were adjusted for in the multifactorial analysis. Subgroup analyses were also conducted based on different sources of the study population, the presence of diabetes, and different coronary artery calcification scoring criteria. Despite differences in these factors, our analyses showed similar and robust results across subgroups, except in the diabetes cohort. It should be noted that in the diabetes subgroup, there were only two studies with 716 people. Li et al.’s survey of 1,516 participants with coronary artery disease showed that IR based on triglyceride-glucose index assessment was closely related to coronary artery disease regardless of whether they had diabetes (54). The limited sample size may have reduced statistical power in the subgroup. Additional research is essential to investigating further the association between IR and CAC among individuals with diabetes.
Among the factors for which the overall quality of the evidence was upgraded, large effect sizes and dose–response relationships were not detected. At the same time, concerns were raised about potential confounders, which included glucose/lipid-lowering medication use and the failure of some of the included studies to adequately consider potential cardiovascular as well as diabetic risk factors, a concern reinforced by inconsistent findings based on diabetic subgroups. Thus, the evidence for an association between HOMA-IR and CAC prevalence was not upgraded.
Within a 5.1-year investigation conducted by Lehmann et al., involving a cohort of 3,281 participants, a significant association was discovered between the CAC progression and onset of coronary and cardiovascular events (55). This study is supported by similar findings reported by Budoff et al., wherein CAC progression was identified as an indicator of future events related to coronary heart disease (56). Therefore, we further analyzed the association between HOMA-IR and CAC progression. Three cohort studies examined the link between HOMA-IR and CAC progression (14, 15, 31), and two of these studies utilized HOMA-IR as a categorical variable. Pooled analysis demonstrated a substantial positive correlation between HOMA-IR and CAC progression. The third study presented HOMA-IR as a continuous variable and identified an independent connection between HOMA-IR and CAC progression similarly. The included studies had different definitions of CAC progression, which raises concerns about the risk of bias and indicates that the quality of the evidence is extremely low. In order to further validate the association between CAC progression and IR, it is necessary to develop more standardized evaluation methods in future research.
This study has the following limitations: Firstly, due to the limited data reported in the included studies, it was not possible to analyze the correlation between HOMA-IR and distinct levels of CAC scores. It may be worthwhile to explore what kind of association would be presented at different levels of CAC scores and whether there is a linear association between the two. Secondly, the majority of the included original research comprised cross-sectional studies (10 out of 15). Given the constraints inherent in observational study designs, establishing a causal relationship between IR and CAC becomes unattainable. It is imperative to conduct additional cohort studies with sizeable sample populations. Thirdly, limited to the disadvantages of observational studies, some unobserved confounding variables are likely to bias the results. Although we considered relevant cardiovascular risk factors as much as possible, there may still be variables that were not considered. Fourth, limitations of the available study data prevented us from analyzing the effect of additional factor states, such as different metabolic states, and the effect of drug use, including antihypertensive, hypoglycemic, and lipid-lowering agents, on the connection between HOMA-IR and CAC. Fifth, there were a number of papers with incomplete data that were excluded from the meta-analysis. Although we contacted these authors, no response was received, which may add to the uncertainty of the pooled results. Finally, the current meta-analysis is not registered and may have a minor bias, but we still followed the steps of the systematic review rigorously to produce the research.
Conclusions
HOMA-IR is a commonly used method in clinical settings to assess IR. This research examined the relationship between IR and CAC based on the HOMA-IR method. The findings of this research propose a noteworthy connection between increased HOMA-IR values and both the prevalence and progression of CAC with low and very low-quality evidence, respectively. It is essential to note that the majority of the original studies included in this research were cross-sectional. As a result, it is imperative to exercise caution when interpreting these findings, and extensive population-based longitudinal studies are imperative to authenticate and corroborate these outcomes in forthcoming research endeavors.
Data availability statement
The original contributions presented in the study are included in the article/Supplementary Material. Further inquiries can be directed to the corresponding author.
Author contributions
LL: Methodology, Conceptualization, Formal analysis, Visualization, Writing – original draft. HZ: Methodology, Conceptualization, Formal analysis, Validation, Visualization, Writing – review & editing. YS: Supervision, Conceptualization, Validation, Funding acquisition, Writing – review & editing. YH: Data curation, Methodology, Formal analysis, Visualization, Writing – review & editing. XZ: Data curation, Methodology, Formal analysis, Visualization, Writing – review & editing. DL: Data curation, Formal analysis, Software, Writing – review & editing.
Funding
The author(s) declare financial support was received for the research, authorship, and/or publication of this article. This study was supported by grants from the Hubei Provincial Health Commission (WJ2021M050), the Hubei Provincial Department of Education (18D070, 22D092), and the Shiyan Science and Technology Bureau (22Y31).
Conflict of interest
The authors declare that the research was conducted in the absence of any commercial or financial relationships that could be construed as a potential conflict of interest.
Publisher’s note
All claims expressed in this article are solely those of the authors and do not necessarily represent those of their affiliated organizations, or those of the publisher, the editors and the reviewers. Any product that may be evaluated in this article, or claim that may be made by its manufacturer, is not guaranteed or endorsed by the publisher.
Supplementary material
The Supplementary Material for this article can be found online at: https://www.frontiersin.org/articles/10.3389/fendo.2023.1271857/full#supplementary-material
References
1. Lebovitz HE. Insulin resistance: definition and consequences. Exp Clin Endocrinol Diabetes (2001) 109(Suppl 2):S135–48. doi: 10.1055/s-2001-18576
2. Adeva-Andany MM, Martínez-Rodríguez J, González-Lucán M, Fernández-Fernández C, Castro-Quintela E. Insulin resistance is a cardiovascular risk factor in humans. Diabetes Metab Syndr (2019) 13(2):1449–55. doi: 10.1016/j.dsx.2019.02.023
3. Chen W, Wang S, Lv W, Pan Y. Causal associations of insulin resistance with coronary artery disease and ischemic stroke: a Mendelian randomization analysis. BMJ Open Diabetes Res Care (2020) 8(1):e001217. doi: 10.1136/bmjdrc-2020-001217
4. Farhan S, Redfors B, Maehara A, McAndrew T, Ben-Yehuda O, De Bruyne B, et al. Relationship between insulin resistance, coronary plaque, and clinical outcomes in patients with acute coronary syndromes: an analysis from the PROSPECT study. Cardiovasc Diabetol (2021) 20(1):10. doi: 10.1186/s12933-020-01207-0
5. Wu Z, Liu L, Wang W, Cui H, Zhang Y, Xu J, et al. Triglyceride-glucose index in the prediction of adverse cardiovascular events in patients with premature coronary artery disease: a retrospective cohort study. Cardiovasc Diabetol (2022) 21(1):142. doi: 10.1186/s12933-022-01576-8
6. Adeva-Andany MM, Ameneiros-Rodríguez E, Fernández-Fernández C, Domínguez-Montero A, Funcasta-Calderón R. Insulin resistance is associated with subclinical vascular disease in humans. World J Diabetes (2019) 10(2):63–77. doi: 10.4239/wjd.v10.i2.63
7. Zhong H, Shao Y, Guo G, Zhan Y, Liu B, Shao M, et al. Association between the triglyceride-glucose index and arterial stiffness: A meta-analysis. Medicine (2023) 102(10):e33194. doi: 10.1097/MD.0000000000033194
8. Matthews DR, Hosker JP, Rudenski AS, Naylor BA, Treacher DF, Turner RC. Homeostasis model assessment: insulin resistance and beta-cell function from fasting plasma glucose and insulin concentrations in man. Diabetologia (1985) 28(7):412–9. doi: 10.1007/BF00280883
9. Katsuki A, Sumida Y, Gabazza EC, Murashima S, Furuta M, Araki-Sasaki R, et al. Homeostasis model assessment is a reliable indicator of insulin resistance during follow-up of patients with type 2 diabetes. Diabetes Care (2001) 24(2):362–5. doi: 10.2337/diacare.24.2.362
10. Yahagi K, Kolodgie FD, Lutter C, Mori H, Romero ME, Finn AV, et al. Pathology of human coronary and carotid artery atherosclerosis and vascular calcification in diabetes mellitus. Arterioscler Thromb Vasc Biol (2017) 37(2):191–204. doi: 10.1161/ATVBAHA.116.306256
11. Mori H, Torii S, Kutyna M, Sakamoto A, Finn AV, Virmani R. Coronary Artery Calcification and its Progression: What Does it Really Mean? JACC Cardiovasc Imaging (2018) 11(1):127–42. doi: 10.1016/j.jcmg.2017.10.012
12. Lee JW, Kim JY, Han K, Im DJ, Lee KH, Kim TH, et al. Coronary CT angiography CAD-RADS versus coronary artery calcium score in patients with acute chest pain. Radiology (2021) 301(1):81–90. doi: 10.1148/radiol.2021204704
13. Budoff MJ, Lakshmanan S, Toth PP, Hecht HS, Shaw LJ, Maron DJ, et al. Cardiac CT angiography in current practice: An American society for preventive cardiology clinical practice statement. Am J Prev Cardiol (2022) 9:100318. doi: 10.1016/j.ajpc.2022.100318
14. Sung KC, Ryu S, Lee JY, Lee SH, Cheong ES, Wild SH, et al. Fatty liver, insulin resistance, and obesity: relationships with increase in coronary artery calcium over time. Clin Cardiol (2016) 39(6):321–8. doi: 10.1002/clc.22529
15. Yamazoe M, Hisamatsu T, Miura K, Kadowaki S, Zaid M, Kadota A, et al. Relationship of insulin resistance to prevalence and progression of coronary artery calcification beyond metabolic syndrome components: shiga epidemiological study of subclinical atherosclerosis. Arterioscler Thromb Vasc Biol (2016) 36(8):1703–8. doi: 10.1161/ATVBAHA.116.307612
16. Arad Y, Newstein D, Cadet F, Roth M, Guerci AD. Association of multiple risk factors and insulin resistance with increased prevalence of asymptomatic coronary artery disease by an electron-beam computed tomographic study. Arterioscler Thromb Vasc Biol (2001) 21(12):2051–8. doi: 10.1161/hq1201.100257
17. Bertoni AG, Wong ND, Shea S, Ma S, Liu K, Preethi S, et al. Insulin resistance, metabolic syndrome, and subclinical atherosclerosis: the Multi-Ethnic Study of Atherosclerosis (MESA). Diabetes Care (2007) 30(11):2951–6. doi: 10.2337/dc07-1042
18. Blaha MJ, DeFilippis AP, Rivera JJ, Budoff MJ, Blankstein R, Agatston A, et al. The relationship between insulin resistance and incidence and progression of coronary artery calcification: the Multi-Ethnic Study of Atherosclerosis (MESA). Diabetes Care (2011) 34(3):749–51. doi: 10.2337/dc10-1681
19. Agatston AS, Janowitz WR, Hildner FJ, Zusmer NR, Viamonte M Jr, Detrano R. Quantification of coronary artery calcium using ultrafast computed tomography. J Am Coll Cardiol (1990) 15(4):827–32. doi: 10.1016/0735-1097(90)90282-t
20. Page MJ, McKenzie JE, Bossuyt PM, Boutron I, Hoffmann TC, Mulrow CD, et al. The PRISMA 2020 statement: an updated guideline for reporting systematic reviews. BMJ (2021) 372:n71. doi: 10.1136/bmj.n71
21. Stang A. Critical evaluation of the Newcastle-Ottawa scale for the assessment of the quality of nonrandomized studies in meta-analyses. Eur J Epidemiol (2010) 25(9):603–5. doi: 10.1007/s10654-010-9491-z
22. Jung CH, Rhee EJ, Kim KJ, Kim BY, Park SE, Chang Y, et al. Relationship of glycated hemoglobin A1c, coronary artery calcification and insulin resistance in males without diabetes. Arch Med Res (2015) 46(1):71–7. doi: 10.1016/j.arcmed.2014.11.011
23. He J, Reilly M, Yang W, Chen J, Go AS, Lash JP, et al. Risk factors for coronary artery calcium among patients with chronic kidney disease (from the Chronic Renal Insufficiency Cohort Study). Am J Cardiol (2012) 110(12):1735–41. doi: 10.1016/j.amjcard.2012.07.044
24. Deeks JJ, Higgins JPT, Altman DG. Chapter 10: Analysing data and undertaking meta-analyses, in: Cochrane Handbook for Systematic Reviews of Interventions version 6.3 . Available at: https://training.cochrane.org/handbook/current/chapter-10#section-10-10 (Accessed September 22, 2023).
25. Higgins JP, Thompson SG. Quantifying heterogeneity in a meta-analysis. Stat Med (2002) 21(11):1539–58. doi: 10.1002/sim.1186
26. Patsopoulos NA, Evangelou E, Ioannidis JP. Sensitivity of between-study heterogeneity in meta-analysis: proposed metrics and empirical evaluation. Int J Epidemiol (2008) 37(5):1148–57. doi: 10.1093/ije/dyn065
27. Balshem H, Helfand M, Schünemann HJ, Oxman AD, Kunz R, Brozek J, et al. GRADE guidelines: 3. Rating the quality of evidence. J Clin Epidemiol (2011) 64(4):401–6. doi: 10.1016/j.jclinepi.2010.07.015
28. Guyatt GH, Oxman AD, Sultan S, Glasziou P, Akl EA, Alonso-Coello P, et al. GRADE guidelines: 9. Rating up the quality of evidence. J Clin Epidemiol (2011) 64(12):1311–6. doi: 10.1016/j.jclinepi.2011.06.004
29. Guyatt G, Oxman AD, Akl EA, Kunz R, Vist G, Brozek J, et al. GRADE guidelines: 1. Introduction-GRADE evidence profiles and summary of findings tables. J Clin Epidemiol (2011) 64(4):383–94. doi: 10.1016/j.jclinepi.2010.04.026
30. Sung KC, Wild SH, Kwag HJ, Byrne CD. Fatty liver, insulin resistance, and features of metabolic syndrome: relationships with coronary artery calcium in 10,153 people. Diabetes Care (2012) 35(11):2359–64. doi: 10.2337/dc12-0515
31. Cho YK, Lee J, Kim HS, Kim EH, Lee MJ, Yang DH, et al. Triglyceride glucose-waist circumference better predicts coronary calcium progression compared with other indices of insulin resistance: a longitudinal observational study. J Clin Med (2020) 10(1):92. doi: 10.3390/jcm10010092
32. Echouffo-Tcheugui JB, Chen H, Kalyani RR, Sims M, Simpson S, Effoe VS, et al. Glycemic markers and subclinical cardiovascular disease: the jackson heart study. Circ Cardiovasc Imaging (2019) 12(3):e008641. doi: 10.1161/CIRCIMAGING.118.008641
33. Fakhrzadeh H, Sharifi F, Alizadeh M, Arzaghi SM, Tajallizade-Khoob Y, Tootee A, et al. Relationship between insulin resistance and subclinical atherosclerosis in individuals with and without type 2 diabetes mellitus. J Diabetes Metab Disord (2016) 15:41. doi: 10.1186/s40200-016-0263-5
34. Jorge-Galarza E, Posadas-Romero C, Torres-Tamayo M, Medina-Urrutia AX, Rodas-Díaz MA, Posadas-Sánchez R, et al. Insulin resistance in adipose tissue but not in liver is associated with aortic valve calcification. Dis Markers (2016) 2016:9085474. doi: 10.1155/2016/9085474
35. Mehta NN, Krishnamoorthy P, Martin SS, St. Clair C, Schwartz S, Iqbal N, et al. Usefulness of insulin resistance estimation and the metabolic syndrome in predicting coronary atherosclerosis in type 2 diabetes mellitus. Am J Cardiol (2011) 107(3):406–11. doi: 10.1016/j.amjcard.2010.09.035
36. Reilly MP, Wolfe ML, Rhodes T, Girman C, Mehta N, Rader DJ. Measures of insulin resistance add incremental value to the clinical diagnosis of metabolic syndrome in association with coronary atherosclerosis. Circulation (2004) 110(7):803–9. doi: 10.1161/01.CIR.0000138740.84883.9C
37. Sung KC, Choi JH, Gwon HC, Choi SH, Kim BS, Kwag HJ, et al. Relationship between insulin resistance and coronary artery calcium in young men and women. PloS One (2013) 8(1):e53316. doi: 10.1371/journal.pone.0053316
38. Ke Z, Huang R, Xu X, Liu W, Wang S, Zhang X, et al. Long-term high level of insulin resistance is associated with an increased prevalence of coronary artery calcification: the CARDIA study. J Am Heart Assoc (2023) 12(11):e028985. doi: 10.1161/JAHA.122.028985
39. Kim MK, Ahn CW, Kang S, Nam JS, Kim KR, Park JS. Relationship between the triglyceride glucose index and coronary artery calcification in Korean adults. Cardiovasc Diabetol (2017) 16(1):108. doi: 10.1186/s12933-017-0589-4
40. Nasir K, Cainzos-Achirica M. Role of coronary artery calcium score in the primary prevention of cardiovascular disease. BMJ (2021) 373:n776. doi: 10.1136/bmj.n776
41. Playford D, Hamilton-Craig C, Dwivedi G, Figtree G. Examining the potential for coronary artery calcium (CAC) scoring for individuals at low cardiovascular risk. Heart Lung Circ (2021) 30(12):1819–28. doi: 10.1016/j.hlc.2021.04.026
42. Sakamoto A, Virmani R, Finn AV. Coronary artery calcification: recent developments in our understanding of its pathologic and clinical significance. Curr Opin Cardiol (2018) 33(6):645–52. doi: 10.1097/HCO.0000000000000558
43. Arnett DK, Blumenthal RS, Albert MA, Buroker AB, Goldberger ZD, Hahn EJ, et al. 2019 ACC/AHA guideline on the primary prevention of cardiovascular disease: a report of the american college of cardiology/american heart association task force on clinical practice guidelines. Circulation (2019) 140(11):e596–646. doi: 10.1161/CIR.0000000000000678
44. Kapoor K, Cainzos-Achirica M, Nasir K. The evolving role of coronary artery calcium in preventive cardiology 30 years after the Agatston score. Curr Opin Cardiol (2020) 35(5):500–7. doi: 10.1097/HCO.0000000000000771
45. Gupta A, Bera K, Kikano E, Pierce JD, Gan J, Rajdev M, et al. Coronary artery calcium scoring: current status and future directions. Radiographics (2022) 42(4):947–67. doi: 10.1148/rg.210122
46. Abuzaid A, Saad M, Addoumieh A, Ha LD, Elbadawi A, Mahmoud AN, et al. Coronary artery calcium score and risk of cardiovascular events without established coronary artery disease: a systemic review and meta-analysis. Coron Artery Dis (2021) 32(4):317–28. doi: 10.1097/MCA.0000000000000974
47. Wang Z, Hui X, Huang X, Li J, Liu N. Relationship between a novel non-insulin-based metabolic score for insulin resistance (METS-IR) and coronary artery calcification. BMC Endocr Disord (2022) 22(1):274. doi: 10.1186/s12902-022-01180-7
48. Song S, Choi SY, Park HE, Han HW, Park SH, Sung J, et al. Incremental prognostic value of triglyceride glucose index additional to coronary artery calcium score in asymptomatic low-risk population. Cardiovasc Diabetol (2022) 21(1):193. doi: 10.1186/s12933-022-01620-7
49. Won K-B, Park EJ, Han D, Lee JH, Choi S-Y, Chun EJ, et al. Triglyceride glucose index is an independent predictor for the progression of coronary artery calcification in the absence of heavy coronary artery calcification at baseline. Cardiovasc Diabetol (2020) 19(1):34. doi: 10.1186/s12933-020-01008-5
50. Solis RC. Diagnostic accuracy of the triglyceride and glucose index for insulin resistance: a systematic review. Int J Endocrinol (2020) 2020:4678526. doi: 10.1155/2020/4678526
51. Shao Y, Li L, Zhong H, Wang X, Hua Y, Zhou X. Anticipated correlation between lean body mass to visceral fat mass ratio and insulin resistance: NHANES 2011-2018. Front Endocrinol (2023) 14:1232896. doi: 10.3389/fendo.2023.1232896
52. Wallace TM, Levy JC, Matthews DR. Use and abuse of HOMA modeling. Diabetes Care (2004) 27(6):1487–95. doi: 10.2337/diacare.27.6.1487
53. González-González JG, Violante-Cumpa JR, Zambrano-Lucio M, Burciaga-Jimenez E, Castillo-Morales PL, Garcia-Campa M, et al. HOMA-IR as a predictor of health outcomes in patients with metabolic risk factors: a systematic review and meta-analysis. High Blood Press Cardiovasc Prev (2022) 29(6):547–64. doi: 10.1007/s40292-022-00542-5
54. Li J, Dong Z, Wu H, Liu Y, Chen Y, Li S, et al. The triglyceride-glucose index is associated with atherosclerosis in patients with symptomatic coronary artery disease, regardless of diabetes mellitus and hyperlipidaemia. Cardiovasc Diabetol (2023) 22(1):224. doi: 10.1186/s12933-023-01919-z
55. Lehmann N, Erbel R, Mahabadi AA, Rauwolf M, Mohlenkamp S, Moebus S, et al. Value of progression of coronary artery calcification for risk prediction of coronary and cardiovascular events: result of the HNR study (Heinz nixdorf recall). Circulation (2018) 137(7):665–79. doi: 10.1161/CIRCULATIONAHA.116.027034
Keywords: insulin resistance, homeostasis model assessment, HOMA-IR, coronary artery calcification, CAC, meta-analysis
Citation: Li L, Zhong H, Shao Y, Hua Y, Zhou X and Luo D (2023) Association between the homeostasis model assessment of insulin resistance and coronary artery calcification: a meta-analysis of observational studies. Front. Endocrinol. 14:1271857. doi: 10.3389/fendo.2023.1271857
Received: 03 August 2023; Accepted: 06 November 2023;
Published: 27 November 2023.
Edited by:
Lingfang Zeng, King’s College London, United KingdomReviewed by:
Amirmohammad Khalaji, Tehran University of Medical Sciences, IranStefan Kabisch, Charité University Medicine Berlin, Germany
Copyright © 2023 Li, Zhong, Shao, Hua, Zhou and Luo. This is an open-access article distributed under the terms of the Creative Commons Attribution License (CC BY). The use, distribution or reproduction in other forums is permitted, provided the original author(s) and the copyright owner(s) are credited and that the original publication in this journal is cited, in accordance with accepted academic practice. No use, distribution or reproduction is permitted which does not comply with these terms.
*Correspondence: Ya Shao, c2hhb3lhQHRhaWhlaG9zcGl0YWwuY29t
†These authors have contributed equally to this work