 Kwang-Eon Choi
 Chanmin Joung2
 Ki Joo Pahk
 Kisoo Pahk
- 1Department of Ophthalmology, Korea University College of Medicine, Seoul, Republic of Korea
- 2Graduate School of Biomedical Sciences, University of Texas Southwestern Medical Center, Dallas, TX, United States
- 3Department of Biomedical Engineering, Kyung Hee University, Yongin, Republic of Korea
- 4Department of Nuclear Medicine, Korea University College of Medicine, Seoul, Republic of Korea
Background: Obesity is known to increase the risk and severity of age-related macular degeneration (AMD). Increased inflamed metabolic activity of visceral adipose tissue (VAT) is considered as a crucial underlying mechanism for the harmful effects of obesity. In this study, we aimed to investigate the inflamed metabolic activity of VAT with 18F-fluorodeoxyglucose (FDG) positron emission tomography/computed tomography (PET/CT) and their association with AMD.
Materials and methods: A total of 57 elderly participants (aged ≥ 50 years) who underwent 18F-FDG PET/CT for health screening and subsequent fundoscopic exam for complaint of recently impaired vision were enrolled. The metabolic activity of VAT was measured from the maximum standardized uptake value (SUVmax) of VAT. The early AMD participant was defined as the participant with either eye satisfying AMD and without any sign of advanced AMD (neovascular AMD or geographic atrophy). The late AMD participant was defined as the participant with either eye satisfying advanced AMD.
Results: VAT SUVmax was highest in participants with late AMD, intermediate in early AMD, and lowest in non-AMD participants. The levels of systemic inflammation surrogate markers were also highest in late AMD group. Furthermore, VAT SUVmax was positively correlated with systemic inflammation surrogate markers and independently associated with the late AMD.
Conclusions: The metabolic activity of VAT evaluated by 18F-FDG PET/CT was associated with the severity of AMD and synchronized with the level of systemic inflammation. Thus, VAT SUVmax could be potentially employed as a surrogate marker of obesity-driven VAT inflammation associated with AMD.
Introduction
Age-related macular degeneration (AMD) is the leading major cause of visual impairment and blindness worldwide (1). It affects more than 25% of elderly persons aged ≥ 55 years and imposes a substantial economic health burden on the United States ($24.4 billion per year) and the European Union (€89.5 billion per year) (2, 3). Furthermore, until 2050, AMD incidence and prevalence are estimated to increase by 75% and 15%, respectively (4).
Several large population-based cross-sectional studies suggest that obesity contributes to increased AMD incidence and severity in elderly people (5–7). Inflamed visceral adipose tissue (VAT) is one of the key regulators of pathophysiology underlying obesity and AMD (8, 9). Inflamed VAT as a metabolically active endocrine organ secretes proinflammatory cytokines such as interleukin-6 (IL-6), monocyte chemotactic protein-1 (MCP-1), and tumor necrosis factor-alpha (TNF-α), thereby promoting inflammatory cells, mainly macrophages, to infiltrate into VAT, which leads to aggravation of VAT inflammation (10–12). Deteriorated VAT inflammation accelerates increasing systemic circulating proinflammatory cytokines, thereby inducing retinal pigment epithelium injury and photoreceptor death, which eventually lead to AMD (8, 9, 13). Furthermore, normal aging is known to increase systemic inflammation, and VAT is regarded as a key organ associated with the establishment of age-related systemic inflammation (14, 15).
Accumulating studies have shown that 18F-fluorodeoxyglucose (FDG) positron emission tomography/computed tomography (PET/CT) is a suitable non-invasive imaging modality for the assessment of metabolic activity of VAT in humans (16–20). Furthermore, in a recent animal study, the metabolic activity of VAT assessed by 18F-FDG PET/CT was increased in a mouse model with obesity and could reflect the inflammatory activity of macrophage, which is elevated in inflamed VAT (21). In further clinical studies, we also found that the increased metabolic activity of VAT has been found to be associated with increased tumor aggressiveness and severity of coronary artery disease, for which obesity, especially inflamed VAT, is a well-known risk factor (16–18, 20). Based on these findings, we hypothesized that the metabolic activity of VAT could also be related with the severity of AMD.
In the present study, we aimed to investigate the association between the metabolic activity of VAT as assessed by 18F-FDG PET/CT and the severity of AMD in elderly participants who visited a general health screening center.
Materials and methods
Study population
Elderly participants (age ≥ 50) who underwent 18F-FDG PET/CT for health screening and subsequent fundoscopic exam at an ophthalmologic clinic for complaint of recently impaired vision at Korea University Ansan Hospital from January 2019 to December 2021 were enrolled in this study (Figure 1). Participants with a malignancy, those who had retinal vascular disease, glaucoma, other macular disease, significant media opacities, diagnosed with stroke or neurologic disease, received vitreoretinal surgery or laser treatment on retina, received abdominal surgery, had any symptom of infection, active fever or systemic inflammatory comorbidity, and those who were taking any medication that might affect the level of systemic inflammation within 6 months before taking 18F-FDG PET/CT were excluded. Finally, a total of 57 participants were enrolled in this study. This study conformed to the guidelines of the Declaration of Helsinki and was approved by the Institutional Review Board of Korea University Ansan Hospital (approval no. 2023AS0139). The requirement of informed consent was waived by the Institutional Review Board due to the study’s retrospective design.
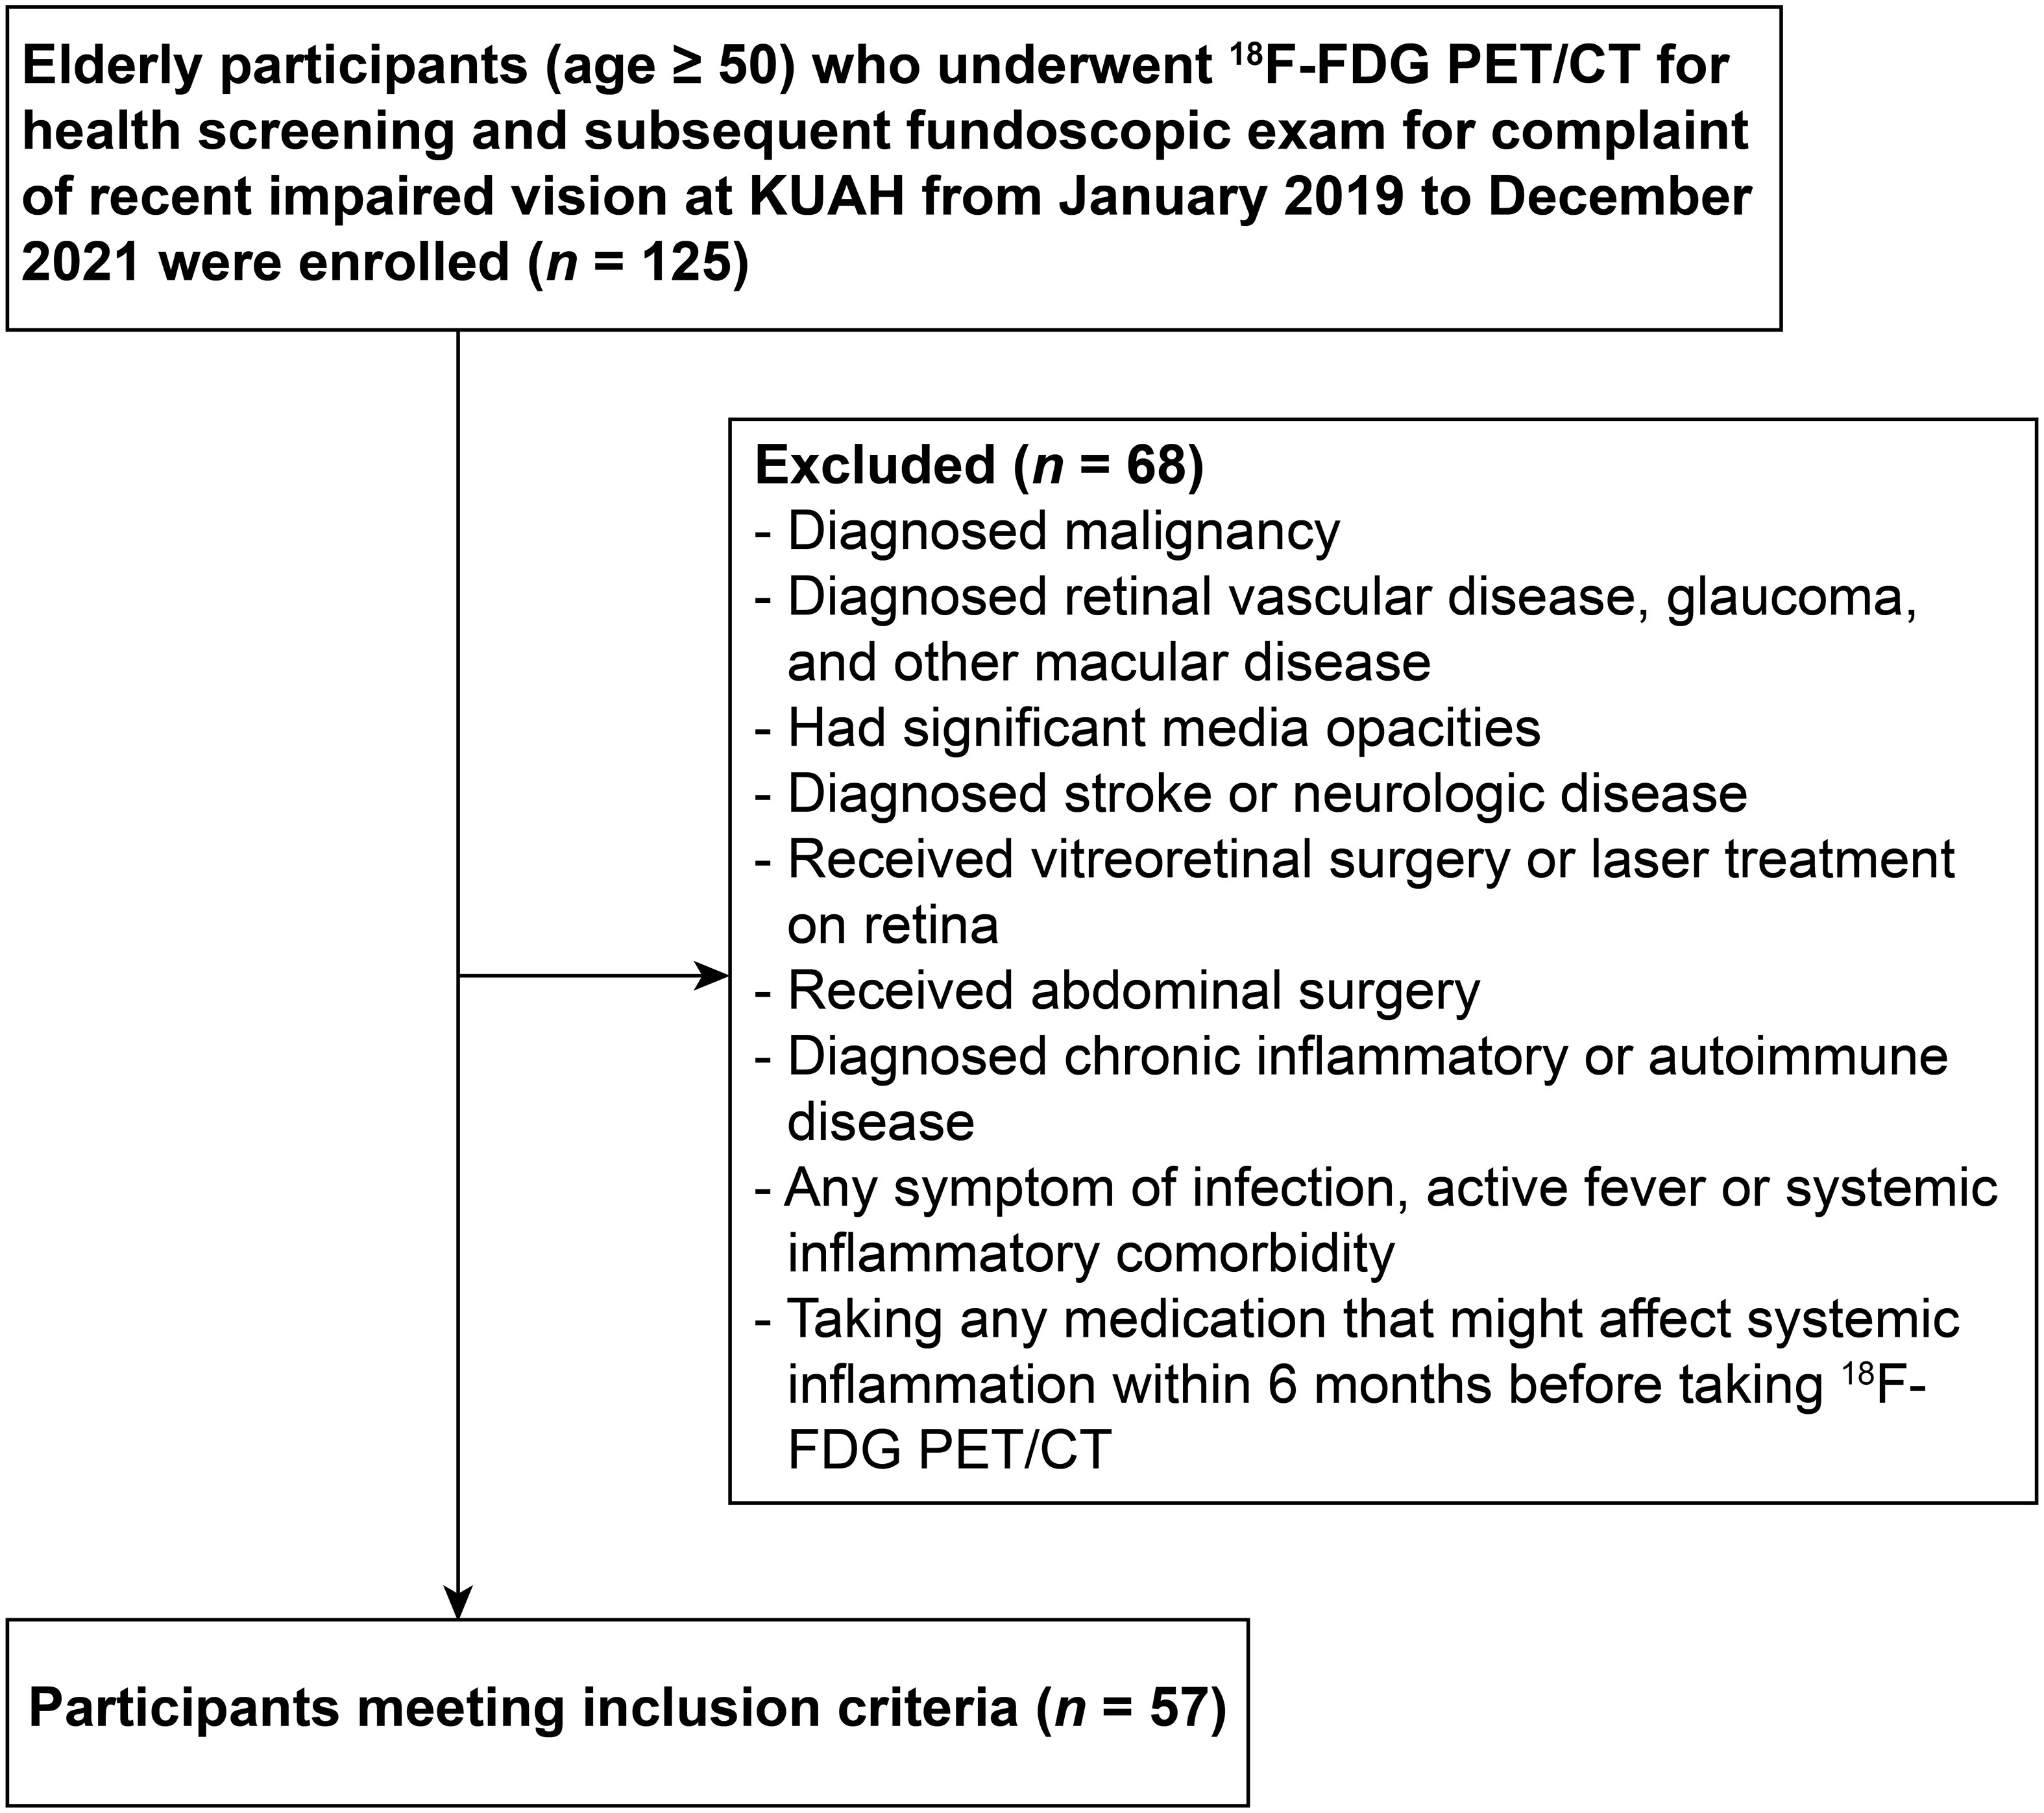
Figure 1 Flowchart showing the enrollment process. 18F-FDG PET/CT, 18F-fluorodeoxyglucose positron emission tomography/computed tomography; KUAH, Korea University Ansan Hospital.
Assessment of AMD
The presence of AMD was determined as follows, according to the Beckman Classification (22): non-AMD: no drusen or small drusen (≤ 63 µm) and no pigmentary abnormalities, early AMD: medium-sized drusen (> 63 and ≤ 125 µm) and no pigmentary abnormalities, intermediate AMD: large-sized drusen (> 125 µm) and/or pigmentary abnormalities, and advanced AMD: neovascular AMD or geographic atrophy.
Although the definition of non-AMD or advanced AMD was consistent across studies, the definition of early and intermediate AMD differed between researchers (23, 24). Thus, to overcome these differences, all non-advanced AMD stages were combined in this study, and the cases were categorized into three clinical stages —non-AMD, early AMD, and late AMD —as previously described (23, 24). Early AMD was defined as participants with either eye satisfying AMD and without any sign of advanced AMD (including early and intermediate AMD). Late AMD was defined as participants with either eye satisfying advanced AMD. All assessments of AMD were performed by a fully experienced retinal specialist (KC).
Anthropometric and laboratory parameters
Body mass index (BMI) was measured as weight (kg)/height squared (m2). All blood samples were gained after 12-h overnight fasting. The levels of total cholesterol, triglycerides, and high-density lipoprotein cholesterol were analyzed using a chemistry analyzer (Hitachi 747, Hitachi, Tokyo, Japan). Low-density lipoprotein cholesterol was measured by the Friedewald formula (25). The levels of high-sensitivity C-reactive protein (hsCRP) were measured by using a chemiluminescence immunoassay (Beckman Coulter, Brea, CA, USA).
18F-FDG PET/CT protocol
All participants fasted overnight (> 6 h) before undergoing 18F-FDG PET/CT. Imaging acquisition was started 1 h after 18F-FDG injection at a dose of 5.29 MBq/kg with a dedicated PET/CT scanner (Discovery 710, GE Healthcare, Milwaukee, WI, USA) from the skull vertex to the proximal thigh. The CT scan was performed and immediately followed with a 128-slice PET scan (120 kVp, 60 mA, 2.5 mm thickness) for attenuation correction. All PET images were reconstructed by 3D-ordered subset expectation maximization (two iterations with 16 subsets).
Image analysis
Image analysis was caried out by two experienced nuclear medicine radiologists (HK and KP) blinded to clinical data using a commercially available workstation (Advantage Workstation version 4.6, GE Healthcare, Milwaukee, WI, USA).
First, both VAT and subcutaneous adipose tissue (SAT) were identified through the predefined Hounsfield units (ranging from −70 to −110) as previously described (16–20). Next, a region of interest (ROI) was located, and a corresponding standardized uptake value (SUV) was acquired as follows:
For the measurement of metabolic activity of VAT, a total of 10 ROIs were located along the intra-abdominal fat boundaries on three consecutive axial slices (between the spine level of L4 and L5) and carefully adjusted to exclude overspill tracer (18F-FDG) uptake in the intestine, vessel, and muscle as previously described (16–20). VAT SUVmax was calculated as the averaged maximum SUV from those 10 ROIs. For the assessment of metabolic activity SAT, a total of 10 ROIs were also placed on the buttock and anterior abdominal wall on three consecutive axial slices between L4 and L5 spine levels as previously described (16–20). SAT SUVmax was defined as the averaged maximum SUV from those 10 ROIs.
Heightened 18F-FDG uptake of both spleen and bone marrow (BM) is well known to reflect increased myeloid activity, which is closely related with heightened systemic inflammation and thereby useful as a surrogate marker of systemic inflammation (26, 27). For the evaluation of metabolic activity of spleen and BM, ROIs were located on the spleen at whole axial slices and BM of L3 to L5 spine, respectively (26). The averaged SUVmax from those ROIs were defined as spleen SUVmax and BM SUVMax, respectively. In this study, both intra- and interobserver correlation coefficient of the measured SUVs showed excellent reproducibility (coefficient > 0.9).
Statistical analysis
All data are presented as mean ± standard deviation. Pearson chi-squared (χ2) test was used for categorical variables. Shapiro–Wilk test was employed to test data normality. One-way analysis of variance (ANOVA) with post-hoc Tukey test was used for parametric continuous variables, and Kruskal–Wallis test with post-hoc Dunn’s test was used for non-parametric continuous variables. Spearman’s correlation analysis, receiver operating characteristic (ROC) curve analysis, and multiple logistic regression analysis were also performed as statistical methods. MedCalc software version 18.5 (MedCalc Software Ltd., Ostend, Belgium) and SPSS software version 17.0 (SPSS Inc., Chicago, IL, USA) were used for statistical analysis. A p-value less than 0.05 was considered statistically significant.
Results
Of the 57 participants, 23 were in the late AMD group, 19 were in the early AMD group, and 15 were in the non-AMD group. Participants with AMD had a significantly older age than the non-AMD group as expected. The clinical characteristics of all participants are presented in Table 1.
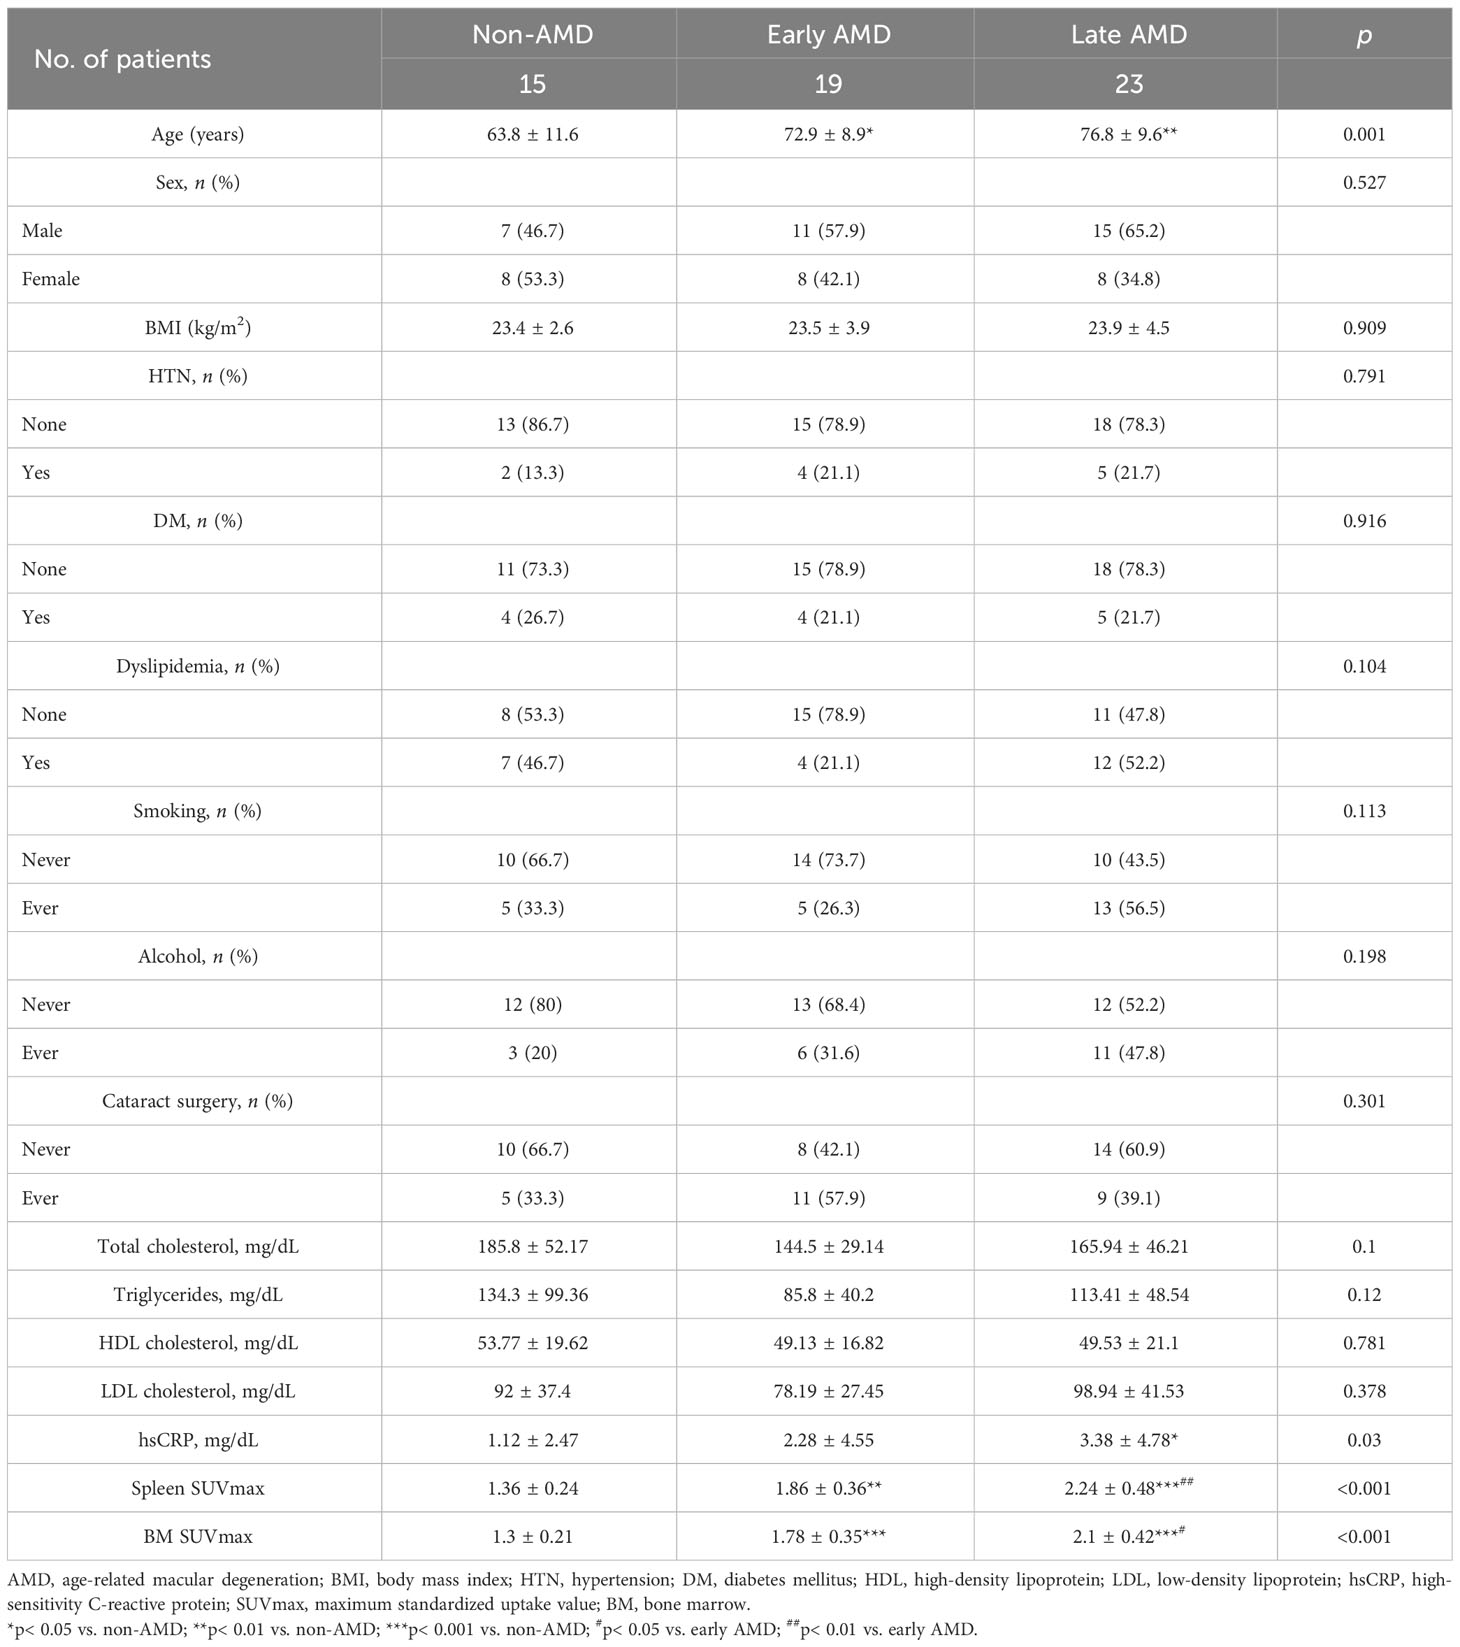
Table 1 Patients’ characteristics.
Metabolic activity of VAT is increased in AMD
We first investigated whether the metabolic activity of VAT was increased in the AMD group. As shown in Figures 2 and 3A, VAT SUVmax was highest in the late AMD group, intermediate in the early AMD group, and lowest in the non-AMD group (1.34 ± 0.52 vs. 1 ± 0.22 vs. 0.76 ± 0.26, p< 0.001, respectively). The late AMD group showed a significantly higher VAT SUVmax than the early AMD and non-AMD groups (p< 0.01 and p< 0.001, respectively). Furthermore, the early AMD group also presented a significantly higher VAT SUVmax than the non- AMD group (p< 0.05). In contrast, SAT SUVmax showed no significant difference among the three groups (late AMD: 0.64 ± 0.11, early AMD: 0.67 ± 0.17, and non-AMD: 0.69 ± 0.16; p = 0.455; Figure 3B). Furthermore, there was no statistically significant difference between the VAT SUVmax and SAT SUVmax of male and female participants in non-AMD (0.71 ± 0.33 vs. 0.81 ± 0.19, p = 0.47; 0.64 ± 0.17 vs. 0.74 ± 0.16, p = 0.26, respectively), early AMD (0.97 ± 0.24 vs. 1.06 ± 0.18, p = 0.398; 0.68 ± 0.22 vs. 0.65 ± 0.03, p = 0.7, respectively), and late AMD groups (1.42 ± 0.6 vs. 1.18 ± 0.31, p = 0.42; 0.65 ± 0.13 vs. 0.61 ± 0.09, p = 0.38, respectively) (Supplementary Figure 1).
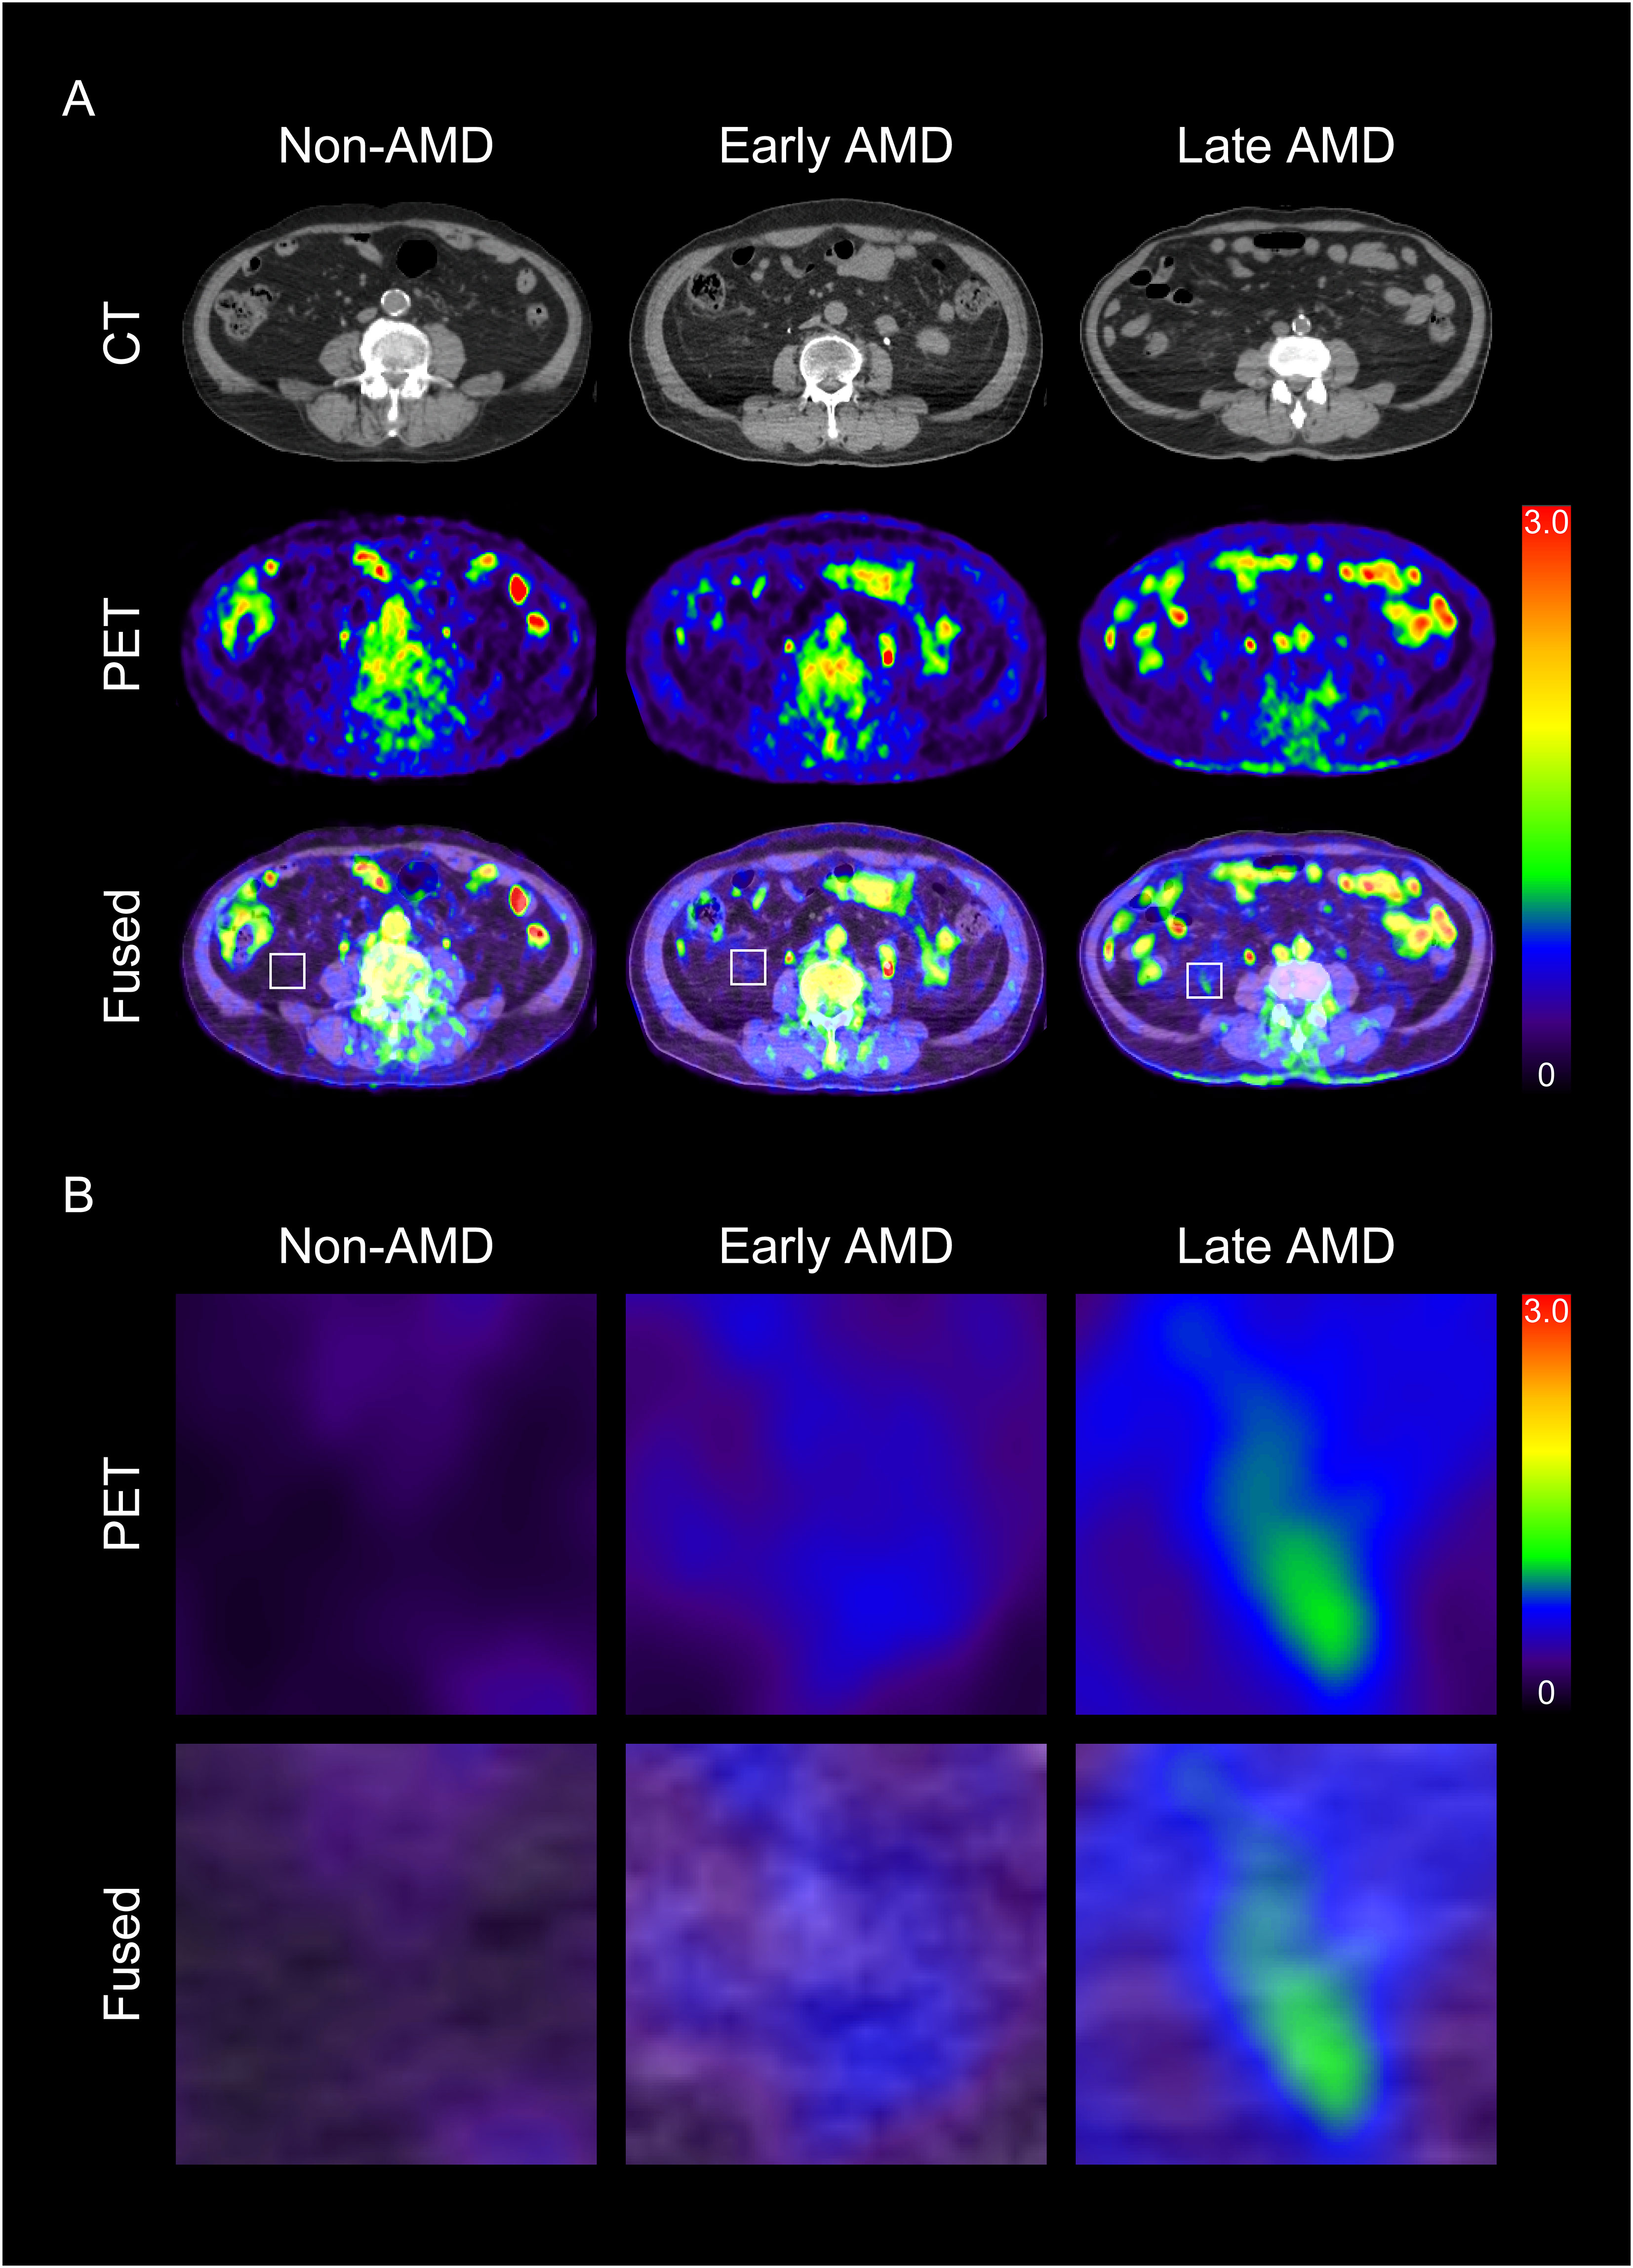
Figure 2 Representative images of visceral adipose tissue (VAT) metabolic activity according to the severity of age-related macular degeneration (AMD) (A) and their corresponding magnified images (B). CT, computed tomography; PET, positron emission tomography.
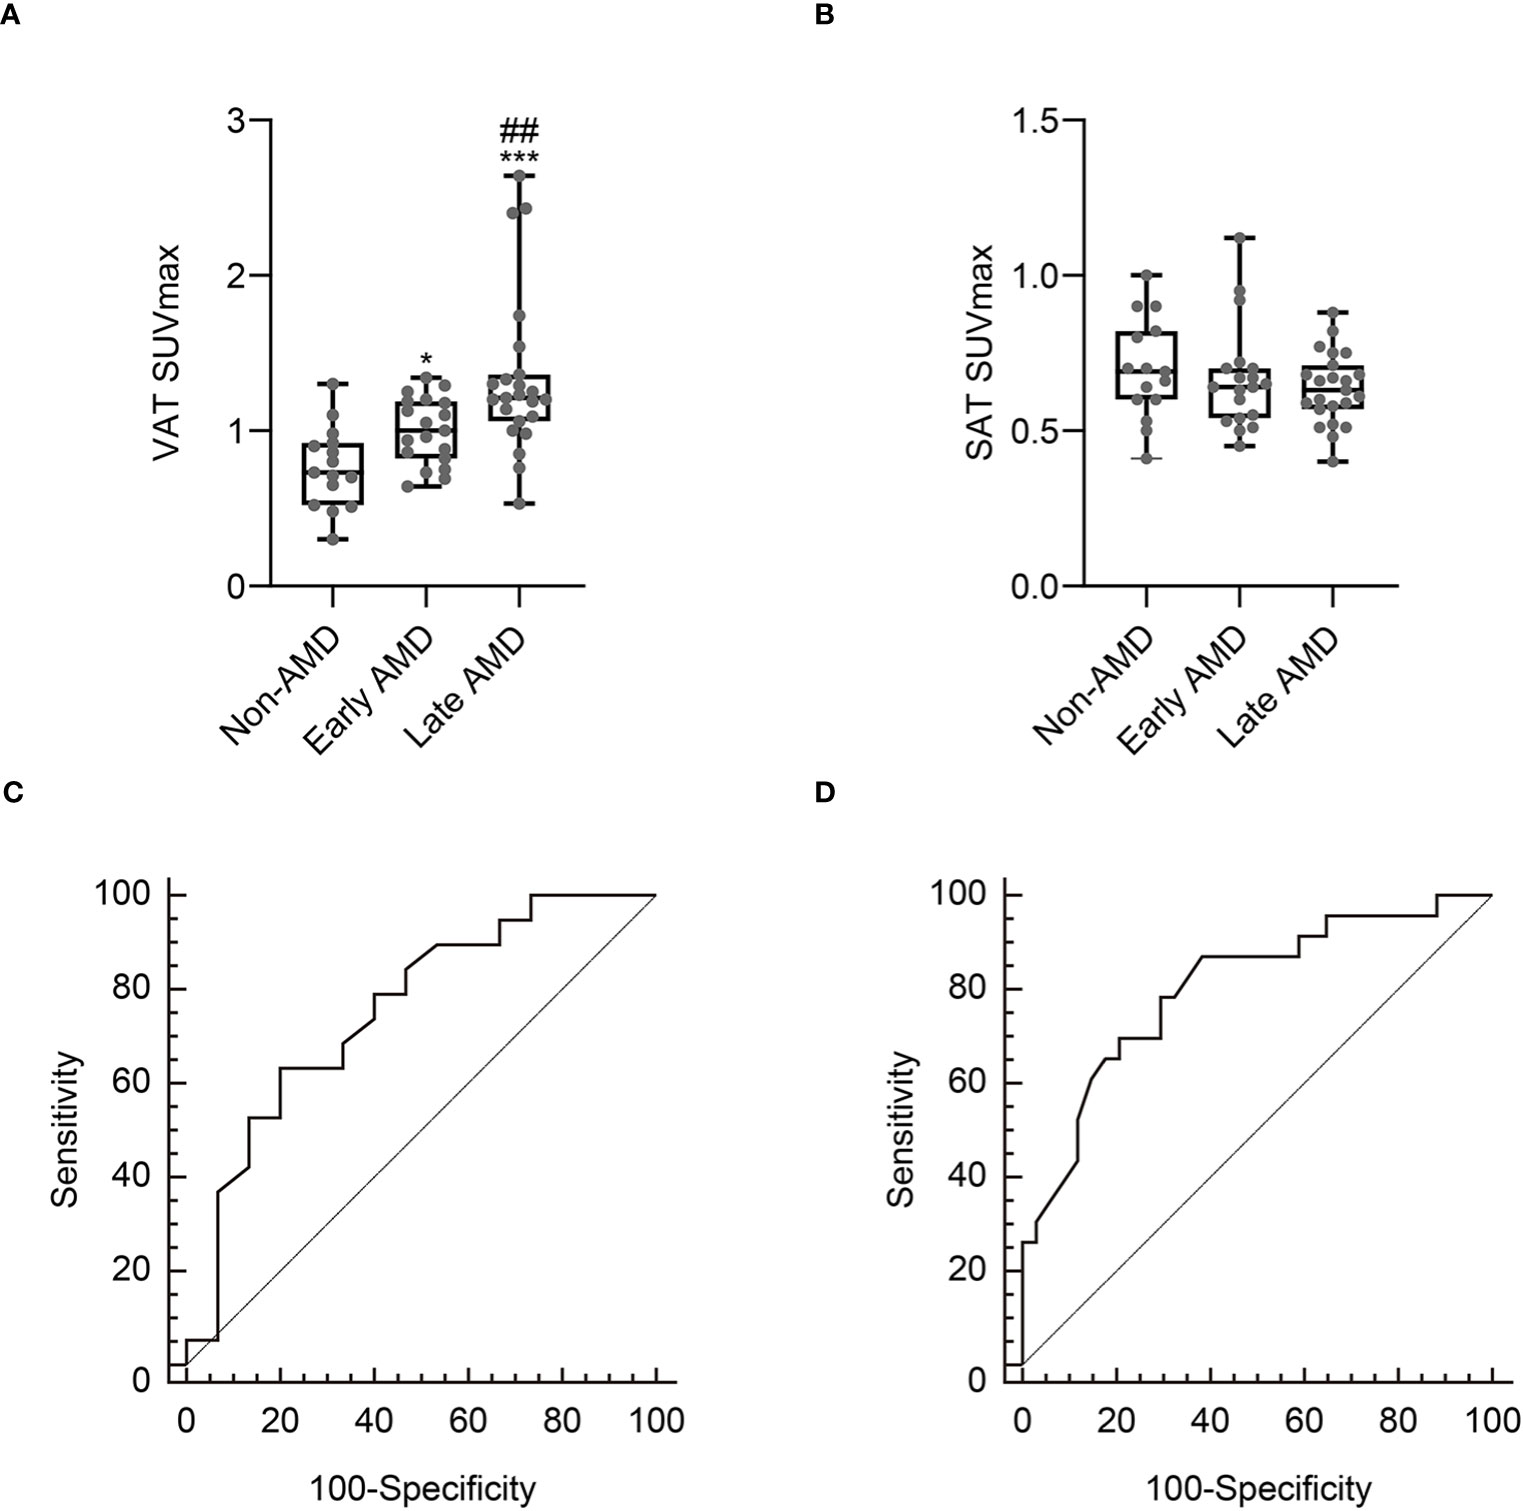
Figure 3 Comparison of VAT SUVmax (A) and SAT SUVmax (B) according to the severity of age-related macular degeneration (AMD). Receiver operating characteristic curve analysis to identify early AMD (C) and late AMD (D). Non-AMD, n = 15; early AMD, n = 19; late AMD, n = 23. SUVmax, standardized uptake value; SAT, subcutaneous adipose tissue. *p< 0.05 vs. non-AMD; ***p< 0.001 vs. non- AMD; ##p< 0.01 vs. early AMD.
Relation between the metabolic activity of VAT and systemic inflammation
Next, we explored whether systemic inflammation was elevated in participants with AMD. As shown in Table 1, the levels of systemic inflammation surrogate markers such as hsCRP, spleen SUVmax, and BM SUVmax were significantly increased in participants with AMD than those without AMD. In addition, these levels of systemic inflammation surrogate markers showed a stepwise elevation from the non-AMD group to the early AMD group to the late AMD group. In a further correlation analysis, VAT SUVmax showed a significantly positive correlation with surrogate markers for systemic inflammation, whereas SAT SUVmax showed no significant correlation (Table 2).
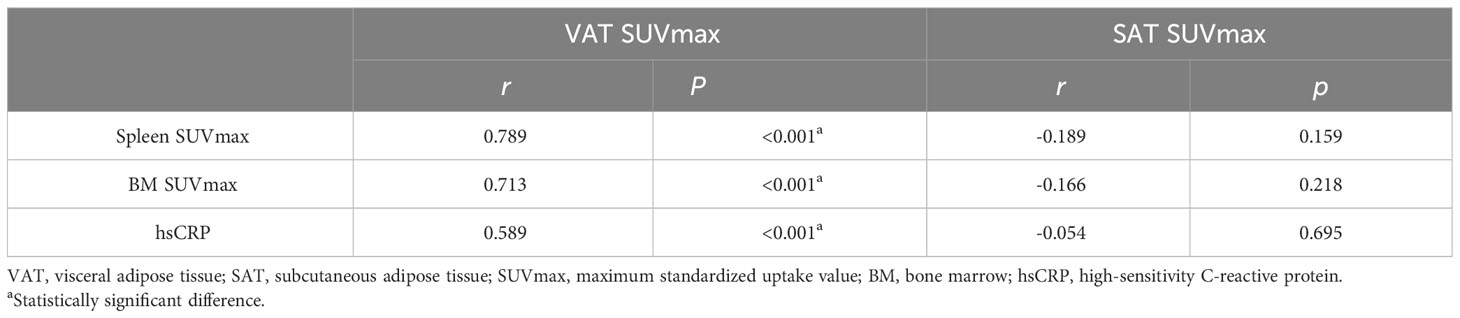
Table 2 Spearman’s correlation analysis.
Association between the metabolic activity of VAT and early AMD
According to the ROC curve analysis, as shown in Figure 3C, the optimal cut-off VAT SUVmax to identify early AMD was 0.92, with a sensitivity of 63.2% and a specificity of 80% (Figure 3C). The area under the curve (AUC) was 0.756 (95% confidence interval: 0.579–0.886; standard error: 0.0867; p = 0.003).
Next, we conducted univariate and multivariate logistic regression analyses to investigate the association between VAT SUV max and early AMD using the optimal cut-off value of VAT SUVmax. The univariate analysis revealed that older age and higher VAT SUVmax were significantly associated with early AMD (Table 3). In a further multivariate analysis, both older age and higher VAT SUVmax were associated with early AMD, though with marginal significance (p = 0.074 and p = 0.056, respectively; Table 3).
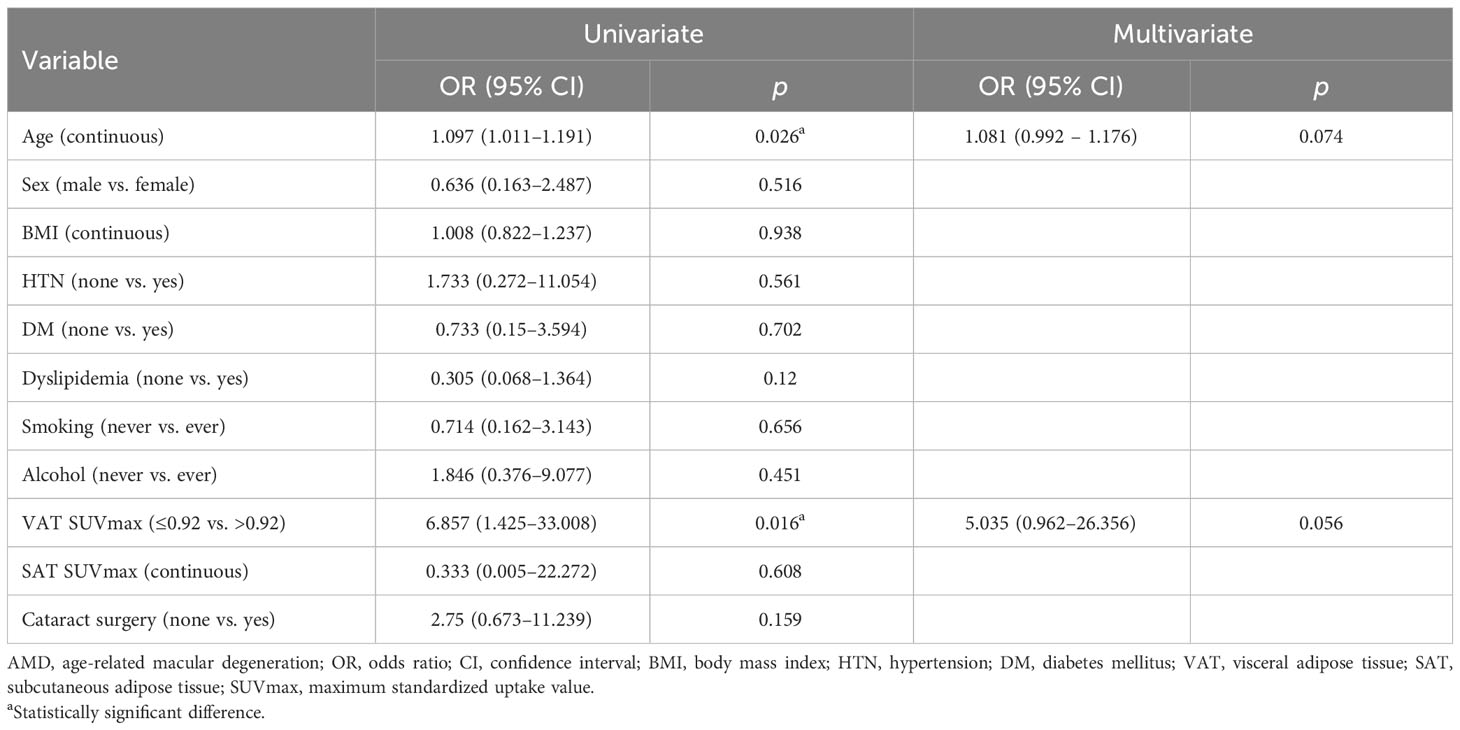
Table 3 Univariate and multivariate analysis for early AMD.
Metabolic activity of VAT is independently associated with late AMD
To determine the association between the metabolic activity of VAT and late AMD, we first performed a ROC curve analysis to define the optimal cut-off VAT SUVmax to identify late AMD. According to the ROC curve analysis, as shown in Figure 3D, the optimal cut-off VAT SUVmax to identify late AMD was 1.13, with a sensitivity of 69.6% and a specificity of 79.4% (Figure 3D). The AUC was 0.803 (95% confidence interval: 0.676–0.897; standard error: 0.06; p < 0.001).
Next, we performed univariate and multivariate logistic regression analyses to investigate the association between VAT SUVmax and late AMD using the optimal cut-off value of VAT SUVmax. The univariate analysis showed that older age, ever smoking, and higher VAT SUVmax were significantly associated with late AMD (Table 4). In a further multivariate analysis, both older age and higher VAT SUVmax were independently associated with late AMD, and VAT SUVmax had the highest odds ratio compared with all other variables (Table 4).
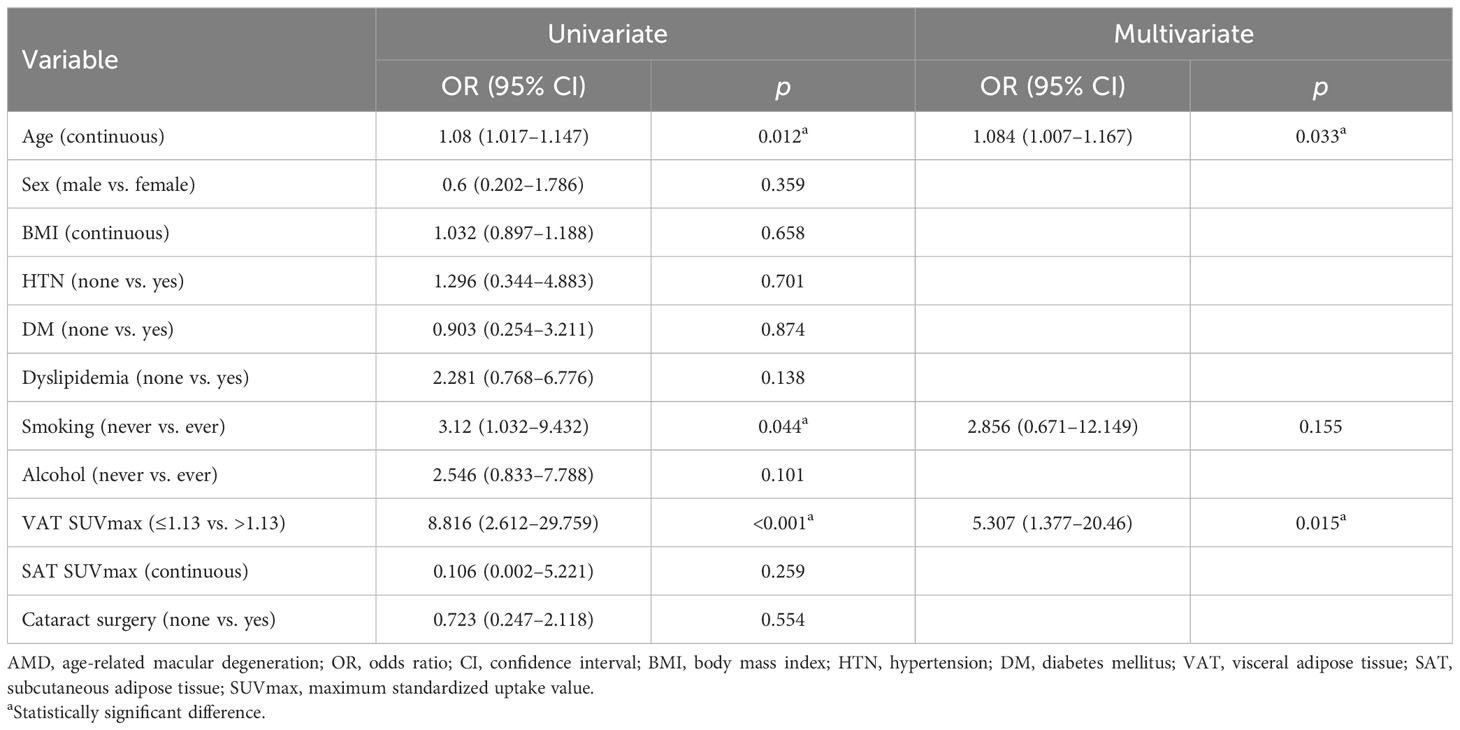
Table 4 Univariate and multivariate analysis for late AMD.
Discussion
To the best of our knowledge, this is the first human study to investigate the association between the metabolic activity of VAT and the severity of AMD in elderly participants using 18F-FDG PET/CT. In the present study, we found that the metabolic activity of VAT defined as VAT SUVmax was highest in participants with late AMD, intermediate in participants with early AMD, and lowest in non-AMD participants. VAT SUVmax presented a significant correlation with systemic inflammation. In addition, it was independently associated with late AMD even after adjusting for all other risk factors.
AMD has been associated with increased serum inflammation markers, including IL-6, IL-1β, CRP, and TNF-α (8, 28, 29). Furthermore, AMD-related genetic risk factors, such as single-nucleotide polymorphisms in both matrix metalloproteinases (MMPs) and complement factor H, are also associated with increased systemic inflammation (30, 31). In both animals and humans, increased VAT inflammation is known to affect the level of systemic inflammation (20, 21). In a recent study, Hata et al. (32) report that macrophages in inflamed VAT could migrate to the distant eye, where they promote an inflammatory cascade that exacerbates the progression of AMD. Therefore, these previous results, in combination with our own, indicate that inflamed VAT is associated with an increased severity of AMD.
In this study, we found that smoking is associated with late AMD, which is consistent with a previous population-based cohort study (33). However, we could not find a significant association between BMI and late AMD. Although BMI is an easily obtainable marker of obesity, it is a crude anthropometric measurement (8, 18). Furthermore, BMI could not fully reflect the inflamed metabolic activity of VAT, a crucial underlying mechanism of harmful consequences of obesity (34, 35). In contrast, 18F-FDG PET/CT could reflect the metabolic activity of macrophages, which are a major inflammatory cell type in inflamed VAT (21). Thus, these preceding findings, along with our own, suggest that VAT SUVmax evaluated by 18F-FDG PET/CT could be used as a surrogate marker of inflamed metabolic activity of VAT related to the development of AMD besides BMI.
In late AMD, especially neovascular AMD, anti-VEGF treatment is currently recommended as a first-line therapy to prevent vision loss (36). However, it shows limited therapeutic efficacy —only about 30% of patients achieve a substantial vision improvement (37, 38). In addition, approximately 10% of patients exhibited a persistent decline in visual acuity following intravitreal anti-VEFG treatment (39). Thus, there is a significantly unmet treatment need for neovascular AMD. Recently, several population-based multi-cohort studies have reported that high levels of physical activity and exercise can have a protective effect against AMD progression (23, 24, 40). Furthermore, a recent study involving human subjects and animals reports that the beneficial effect of exercise on AMD could be attributed, in part, to its anti-inflammatory effects, particularly in attenuating VAT inflammation (41). Notably, in a previous study, we observed a reduction in VAT SUVmax after 3 months of exercise in women with obesity (19). Therefore, we believe that using VAT SUVmax assessed by 18F-FDG PET/CT can be useful to evaluate the therapeutic efficacy of interventions against inflamed VAT in AMD patients.
In this study, we observed that there was no significant difference in VAT SUVmax between male and female subjects in all AMD and non-AMD groups. Hence, gender status seems to have a lesser impact on VAT SUVmax. However, given the varied modulation of VAT biology and metabolism by sex differences (42), a comprehensive study is warranted to further explore the detailed mechanisms underlying the association between VAT inflammation and sex differences.
This study has several limitations. First, this study was retrospective and carried out at a single center, potentially leading to a selection bias. A subsequent extensive prospective study is needed to confirm the results of this investigation. Second, in addition to aging, various factors, including an unfavorable genotype, differences in stress response axes, and lifestyle factors such as physical activity and dietary habits, could influence both VAT SUVmax and the metabolic activity of BM and spleen (12). Third, while 18F-FDG PET/CT is a widely recognized imaging modality for assessing the metabolic activity of VAT, we were unable to conduct a histological examination of VAT tissue samples, which could substantiate our observations. Fourth, we were unable to manage every conceivable factor that could influence the absorption of FDG, such as plasma glucose and insulin levels, and the interval after tracer injection until image acquisition. In addition, we were unable to control the temperature before and during the PET scan, which might activate thermogenesis in brown/beige adipocytes, potentially influencing the uptake of 18F-FDG. Finally, although there was no statistical difference in age between the early AMD and late AMD groups (Table 1), the late AMD group showed a significantly increased VAT SUVmax compared to the early AMD group (Figure 3A). Thus, the confounding factor of age could be minimized in the AMD group. However, both AMD groups showed a significantly higher age than the non-AMD group and a significantly higher VAT SUVmax than the non-AMD group (Figure 3A). Therefore, as AMD typically occurs in elderly individuals rather than in younger people, it is difficult to completely exclude the confounding effect of age on VAT SUVmax between the AMD and non-AMD groups. Nevertheless, our novel findings mitigated these limitations by employing an exceptional non-invasive imaging technique to investigate the association between the metabolic activity of VAT and the severity of AMD.
Taken together, our findings highlight that the metabolic activity of VAT assessed by 18F-FDG PET/CT was associated with the severity of AMD and synchronized with the systemic inflammation which may promote AMD progression. Hence, VAT SUVmax could potentially serve as a surrogate marker of VAT inflammation linked to AMD. Moreover, our findings may offer valuable perspectives on investigating the intricate relationship between inflamed VAT and the severity of AMD.
Data availability statement
The original contributions presented in the study are included in the article/Supplementary Material. Further inquiries can be directed to the corresponding author.
Ethics statement
The studies involving humans were approved by the Institutional Review Board of Korea University Ansan Hospital (approval no. 2023AS0139). The studies were conducted in accordance with the local legislation and institutional requirements. The ethics committee/institutional review board waived the requirement of written informed consent for participation from the participants or the participants’ legal guardians/next of kin because the requirement of informed consent was waived by the Institutional Review Board due to the study’s retrospective design.
Author contributions
KC: Conceptualization, Formal analysis, Investigation, Methodology, Writing – original draft. CJ: Formal analysis, Methodology, Visualization, Writing – original draft. KJP: Formal analysis, Writing – original draft. HK: Formal analysis, Writing – original draft. KP: Conceptualization, Formal analysis, Investigation, Methodology, Supervision, Visualization, Writing – original draft, Writing – review & editing.
Funding
The author(s) declare financial support was received for the research, authorship, and/or publication of this article. This research was supported by the Basic Science Research Program through the National Research Foundation of Korea (NRF) funded by the Ministry of Education (RS-2023-00239185). This research was also supported by grants of Korea University (K2305211, K2305221, and K2327201) and Korea University Ansan Hospital (O2310641).
Conflict of interest
The authors declare that the research was conducted in the absence of any commercial or financial relationships that could be construed as a potential conflict of interest.
Publisher’s note
All claims expressed in this article are solely those of the authors and do not necessarily represent those of their affiliated organizations, or those of the publisher, the editors and the reviewers. Any product that may be evaluated in this article, or claim that may be made by its manufacturer, is not guaranteed or endorsed by the publisher.
Supplementary material
The Supplementary Material for this article can be found online at: https://www.frontiersin.org/articles/10.3389/fendo.2023.1322326/full#supplementary-material
Supplementary Figure 1 | Comparison of VAT SUVmax (A) and SAT SUVmax (B) in male and female participants according to the severity of age-related macular degeneration (AMD). Non-AMD, n = 15; early AMD, n = 19; late AMD, n = 23. SUVmax, standardized uptake value; VAT, visceral adipose tissue; SAT, subcutaneous adipose tissue.
References
1. Lim LS, Mitchell P, Seddon JM, Holz FG, Wong TY. Age-related macular degeneration. Lancet (2012) 379:1728–38. doi: 10.1016/S0140-6736(12)60282-7
2. Brown GC, Brown MM, Sharma S, Stein JD, Roth Z, Campanella J, et al. The burden of age-related macular degeneration: a value-based medicine analysis. Trans Am Ophthalmol Soc (2005) 103:173–84. doi: 10.1016/S0008-4182(05)80070-5
3. Jaki Mekjavić P, Jūratė Balčiūnienė V, Ćeklić L, Ernest J, Jamrichova Z, Zsolt Nagy Z, et al. The burden of macular diseases in central and eastern Europe—implications for healthcare systems. Value Health Reg Issues (2019) 19:1–6. doi: 10.1016/j.vhri.2018.11.002
4. Li JQ, Welchowski T, Schmid M, Mauschitz MM, Holz FG, Finger RP. Prevalence and incidence of age-related macular degeneration in Europe: a systematic review and meta-analysis. Br J Ophthalmol (2020) 104:1077–84. doi: 10.1136/bjophthalmol-2019-314422
5. Smith W, Mitchell P, Leeder SR, Wang JJ. Plasma fibrinogen levels, other cardiovascular risk factors, and age-related maculopathy: the Blue Mountains Eye Study. Arch Ophthalmol (1998) 116:583–7. doi: 10.1001/archopht.116.5.583
6. Age-Related Eye Disease Study Research Group. Risk factors associated with age-related macular degeneration. A case-control study in the age-related eye disease study: Age-Related Eye Disease Study Report Number 3. Ophthalmology (2000) 107:2224–32. doi: 10.1016/s0161-6420(00)00409-7
7. Delcourt C, Michel F, Colvez A, Lacroux A, Delage M, Vernet MH, POLA Study Group. Associations of cardiovascular disease and its risk factors with age-related macular degeneration: the POLA study. Ophthalmic Epidemiol (2001) 8:237–49. doi: 10.1076/opep.8.4.237.1613
8. Haas P, Kubista KE, Krugluger W, Huber J, Binder S. Impact of visceral fat and pro-inflammatory factors on the pathogenesis of age-related macular degeneration. Acta Ophthalmol (2015) 93:533–8. doi: 10.1111/aos.12670
9. Sterling JK, Baumann B, Foshe S, Voigt A, Guttha S, Alnemri A, et al. Inflammatory adipose activates a nutritional immunity pathway leading to retinal dysfunction. Cell Rep (2022) 39:110942. doi: 10.1016/j.celrep.2022.110942
10. Després JP, Lemieux I. Abdominal obesity and metabolic syndrome. Nature (2006) 444:881–7. doi: 10.1038/nature05488
11. Fuster JJ, Ouchi N, Gokce N, Walsh K. Obesity-induced changes in adipose tissue microenvironment and their impact on cardiovascular disease. Circ Res (2016) 118:1786–807. doi: 10.1161/CIRCRESAHA.115.306885
12. Tchernof A, Després JP. Pathophysiology of human visceral obesity: an update. Physiol Rev (2013) 93:359–404. doi: 10.1152/physrev.00033.2011
13. Hanus J, Anderson C, Wang S. RPE necroptosis in response to oxidative stress and in AMD. Ageing Res Rev (2015) 24:286–98. doi: 10.1016/j.arr.2015.09.002
14. Cevenini E, Caruso C, Candore G, Capri M, Nuzzo D, Duro G, et al. Age-related inflammation: the contribution of different organs, tissues and systems. How to face it for therapeutic approaches. Curr Pharm Des (2010) 16:609–18. doi: 10.2174/138161210790883840
15. Shin JA, Jeong SI, Kim M, Yoon JC, Kim HS, Park EM. Visceral adipose tissue inflammation is associated with age-related brain changes and ischemic brain damage in aged mice. Brain Behav Immun (2015) 50:221–31. doi: 10.1016/j.bbi.2015.07.008
16. Pahk K, Rhee S, Kim S, Choe JG. Predictive role of functional visceral fat activity assessed by preoperative F-18 FDG PET/CT for regional lymph node or distant metastasis in patients with colorectal cancer. PloS One (2016) 11:e0148776. doi: 10.1371/journal.pone.0148776
17. Pahk K, Choi S, Kim S. Functional visceral fat activity evaluated by preoperative F-18 FDG PET/CT predicts regional lymph node metastasis in differentiated thyroid cancer. Clin Endocrinol (Oxf) (2018) 88:963–8. doi: 10.1111/cen.13604
18. Pahk K, Joung C, Kim S. Visceral fat metabolic activity evaluated by preoperative 18F-FDG PET/CT significantly affects axillary lymph node metastasis in postmenopausal luminal breast cancer. Sci Rep (2020) 10:1348. doi: 10.1038/s41598-020-57937-4
19. Pahk K, Kim EJ, Joung C, Seo HS, Kim S. Exercise training reduces inflammatory metabolic activity of visceral fat assessed by 18 F-FDG PET/CT in obese women. Clin Endocrinol (Oxf) (2020) 93:127–34. doi: 10.1111/cen.14216
20. Pahk K, Kim EJ, Joung C, Seo HS, Kim S. Association of glucose uptake of visceral fat and acute myocardial infarction: a pilot 18F-FDG PET/CT study. Cardiovasc Diabetol (2020) 19:145. doi: 10.1186/s12933-020-01115-3
21. Pahk K, Lee SG, Joung C, Kim EO, Kwon HW, Kim DH, et al. SP-1154, a novel synthetic TGF-β inhibitor, alleviates obesity and hepatic steatosis in high-fat diet-induced mice. BioMed Pharmacother (2022) 145:112441. doi: 10.1016/j.biopha.2021.112441
22. Ferris FL 3rd, Wilkinson CP, Bird A, Chakravarthy U, Chew E, Csaky K, et al. Clinical classification of age-related macular degeneration. Ophthalmology (2013) 120:844–51. doi: 10.1016/j.ophtha.2012.10.036
23. McGuinness MB, Le J, Mitchell P, Gopinath B, Cerin E, Saksens NTM, et al. Physical activity and age-related macular degeneration: A systematic literature review and meta-analysis. Am J Ophthalmol (2017) 180:29–38. doi: 10.1016/j.ajo.2017.05.016
24. Mauschitz MM, Schmitz MT, Verzijden T, Schmid M, Thee EF, Colijn JM, et al. Physical activity, incidence, and progression of age-related macular degeneration: A multicohort study. Am J Ophthalmol (2022) 236:99–106. doi: 10.1016/j.ajo.2021.10.008
25. Friedewald WT, Levy RI, Fredrickson DS. Estimation of the concentration of low-density lipoprotein cholesterol in plasma, without use of the preparative ultracentrifuge. Clin Chem (1972) 18:499–502. doi: 10.1093/clinchem/18.6.499
26. Kim EJ, Kim S, Kang DO, Seo HS. Metabolic activity of the spleen and bone marrow in patients with acute myocardial infarction evaluated by 18f-fluorodeoxyglucose positron emission tomograpic imaging. Circ Cardiovasc Imaging (2014) 7:454–60. doi: 10.1161/CIRCIMAGING.113.001093
27. Emami H, Singh P, MacNabb M, Vucic E, Lavender Z, Rudd JH, et al. Splenic metabolic activity predicts risk of future cardiovascular events: demonstration of a cardiosplenic axis in humans. JACC Cardiovasc Imaging (2015) 8:121–30. doi: 10.1016/j.jcmg.2014.10.009
28. Klein R, Myers CE, Cruickshanks KJ, Gangnon RE, Danforth LG, Sivakumaran TA, et al. Markers of inflammation, oxidative stress, and endothelial dysfunction and the 20-year cumulative incidence of early age-related macular degeneration: the Beaver Dam Eye Study. JAMA Ophthalmol (2014) 132:446–55. doi: 10.1001/jamaophthalmol.2013.7671
29. Nassar K, Grisanti S, Elfar E, Lüke J, Lüke M, Grisanti S. Serum cytokines as biomarkers for age-related macular degeneration. Graefes Arch Clin Exp Ophthalmol (2015) 253:699–704. doi: 10.1007/s00417-014-2738-8
30. Budiene B, Liutkeviciene R, Gustiene O, Ugenskiene R, Laukaitiene D, Savukaityte A, et al. The association of matrix metalloproteinases polymorphisms and interleukins in advanced age-related macular degeneration. Ophthalmic Genet (2018) 39:463–72. doi: 10.1080/13816810.2018.1484928
31. Cao S, Ko A, Partanen M, Pakzad-Vaezi K, Merkur AB, Albiani DA, et al. Relationship between systemic cytokines and complement factor H Y402H polymorphism in patients with dry age-related macular degeneration. Am J Ophthalmol (2013) 156:1176–83. doi: 10.1016/j.ajo.2013.08.003
32. Hata M, Andriessen EMMA, Hata M, Diaz-Marin R, Fournier F, Crespo-Garcia S, et al. Past history of obesity triggers persistent epigenetic changes in innate immunity and exacerbates neuroinflammation. Science (2023) 379:45–62. doi: 10.1126/science.abj8894
33. Tan JS, Mitchell P, Kifley A, Flood V, Smith W, Wang JJ. Smoking and the long-term incidence of age-related macular degeneration: the Blue Mountains Eye Study. Arch Ophthalmol (2007) 125:1089–95. doi: 10.1001/archopht.125.8.1089
34. Després JP. Body fat distribution and risk of cardiovascular disease: an update. Circulation (2012) 126:1301–13. doi: 10.1161/CIRCULATIONAHA.111.067264
35. Quail DF, Dannenberg AJ. The obese adipose tissue microenvironment in cancer development and progression. Nat Rev Endocrinol (2019) 15:139–54. doi: 10.1038/s41574-018-0126-x
36. CATT Research Group, Martin DF, Maguire MG, Ying GS, Grunwald JE, Fine SL, Jaffe GJ. Ranibizumab and bevacizumab for neovascular age-related macular degeneration. N Engl J Med (2011) 364:1897–908. doi: 10.1056/NEJMoa1102673
37. Comparison of Age-related Macular Degeneration Treatments Trials (CATT) Research Group, Maguire MG, Martin DF, Ying GS, Jaffe GJ, Daniel E, Grunwald JE, et al. Five-year outcomes with anti-vascular endothelial growth factor treatment of neovascular age-related macular degeneration: the comparison of age-related macular degeneration treatments trials. Ophthalmology (2016) 123:1751–61. doi: 10.1016/j.ophtha.2016.03.045
38. Mettu PS, Allingham MJ, Cousins SW. Incomplete response to Anti-VEGF therapy in neovascular AMD: Exploring disease mechanisms and therapeutic opportunities. Prog Retin Eye Res (2021) 82:100906. doi: 10.1016/j.preteyeres.2020.100906
39. Ying GS, Kim BJ, Maguire MG, Huang J, Daniel E, Jaffe GJ, et al. Sustained visual acuity loss in the comparison of age-related macular degeneration treatments trials. JAMA Ophthalmol (2014) 132:915–21. doi: 10.1001/jamaophthalmol.2014.1019
40. Knudtson MD, Klein R, Klein BE. Physical activity and the 15-year cumulative incidence of age-related macular degeneration: the Beaver Dam Eye Study. Br J Ophthalmol (2006) 90:1461–3. doi: 10.1136/bjo.2006.103796
41. Cui B, Guo X, Zhou W, Zhang X, He K, Bai T, et al. Exercise alleviates neovascular age-related macular degeneration by inhibiting AIM2 inflammasome in myeloid cells. Metabolism (2023) 144:155584. doi: 10.1016/j.metabol.2023.155584
Keywords: obesity, age-related macular degeneration, inflammation, visceral adipose tissue, positron-emission tomography
Citation: Choi K-E, Joung C, Pahk KJ, Kim H and Pahk K (2024) Metabolic activity of visceral adipose tissue is associated with age-related macular degeneration: a pilot 18F-FDG PET/CT study. Front. Endocrinol. 14:1322326. doi: 10.3389/fendo.2023.1322326
Received: 16 October 2023; Accepted: 12 December 2023;
Published: 08 January 2024.
Edited by:
Maria Conte, University of Bologna, ItalyReviewed by:
Stefano Salvioli, University of Bologna, ItalyFlorencia Maria Barbé-Tuana, Pontifical Catholic University of Rio Grande do Sul, Brazil
Endre Károly Kristóf, University of Debrecen, Hungary
Copyright © 2024 Choi, Joung, Pahk, Kim and Pahk. This is an open-access article distributed under the terms of the Creative Commons Attribution License (CC BY). The use, distribution or reproduction in other forums is permitted, provided the original author(s) and the copyright owner(s) are credited and that the original publication in this journal is cited, in accordance with accepted academic practice. No use, distribution or reproduction is permitted which does not comply with these terms.
*Correspondence: Kisoo Pahk, a2lzdTk5QGtvcmVhLmFjLmty