 Na Li
Na Li Hong Zhou
- Department of Endocrinology, the Second Hospital of Hebei Medical University, Shijiazhuang, Hebei, China
Background: We aimed to explore the intricate interplay between glycated hemoglobin (HbA1C) levels, disease duration, and left ventricular diastolic dysfunction in patients with type 2 diabetes mellitus (T2DM) characterized by preserved ejection fraction.
Methods: A cross-sectional study was conducted at the Second Affiliated Hospital of Hebei Medical University from January 2022 to December 2022. A total of 114 inpatients from the Department of Endocrinology were randomly selected based on the inclusion and exclusion criteria. Patients with T2DM were stratified into three subgroups, each comprising 38 patients, based on disease duration and HbA1C levels. A sub-analysis was conducted to explore variations among these three distinct groups. A control group comprised 38 age, gender, body mass index (BMI), and smoking habit-matched healthy volunteers form the Physical Examination Center of the same hospital. General demographic information, biochemical results, and echocardiographic data were collected, and correlation and linear regression analyses were performed.
Results: Diabetic patients exhibited lower E/A values (0.85 (0.72, 1.17) vs. 1.20 (0.97, 1.30)) and elevated E/e’ values (9.50 (8.75, 11.00) vs. 9.00 (7.67, 9.85)) compared to their normal controls. In the subgroup analysis, patients with a disease duration exceeding 2 years displayed reduced E/A values (0.85 (0.75, 1.10) vs. 1.10 (0.80, 1.30)) and elevated E/e’ values (9.80 (9.20, 10.80) vs. 8.95 (7.77, 9.50)) in comparison to those with a disease duration of ≤2 years, p<0.05. Among patients with a disease duration surpassing 2 years, those with higher HbA1C levels exhibited lower E/A values (0.80 (0.70, 0.90) vs. (0.85 (0.75, 1.10)) and higher E/e’ values (11.00 (9.87, 12.15) vs. 9.80 (9.20, 10.80)) in contrast to patients with low HbA1C levels, p<0.05. Multiple linear regression analysis identified HbA1C (β=0.294, p<0.001) and disease duration (β=0.319, p<0.001) as independent risk factors for the E/A value in diabetes patients. Furthermore, HbA1C (β=0.178, p=0.015) and disease duration (β=0.529, p<0.001) emerged as independent risk factors for the E/e’ value in diabetic patients.
Conclusions: In individuals with T2DM exhibiting preserved ejection fraction, the presence of left ventricular diastolic dysfunction is significantly associated with HbA1C levels and the duration of diabetes.
Introduction
Diabetes stands as an independent risk factor for both left ventricular hypertrophy and congestive heart failure (HF), with diabetic patients experiencing a more adverse prognosis in heart failure compared to their non-diabetic counterparts (1). The trajectory of diabetic cardiomyopathy (DCM) unfolds as diabetes initiates diastolic dysfunction, progresses to systolic dysfunction, and culminates in refractory HF, unrelated to hypertension, coronary heart disease, or valvular disease. Numerous studies affirm that diabetes not only alters the structure and function of the myocardium bot also heightens the risk of cardiovascular events for affected individuals (2–4). In its early stages, DCM may manifest as a symptomatic diastolic dysfunction with preserved ejection fraction (EF), revealing itself through subtle left ventricular stiffness and cardiac hypertrophy (5, 6). Typically, the initial signs of diabetic left ventricular diastolic dysfunction include delayed left ventricular filling and diastole, often unaccompanied by impaired cardiac systolic function (7). Studies report that the incidence of left ventricular diastolic dysfunction in patients with type 2 diabetes mellitus (T2DM) ranges from 35% to 60% (8–10). Despite this prevalence, diastolic function is not routinely assessed in clinical practice, even though it represents an early feature of DCM (11). Cardiac complications in patients with diabetes often raise concerns only when overt symptomatic heart failure manifests. While cardiac magnetic resonance imaging (CMRI) is considered the gold standard for assessing ventricular diastolic function (1, 12), its use remains limited in clinical settings. Recent advancements in echocardiography technology position it as the primary choice for most clinical practices. Current guidelines from the American Society of Cardiac Ultrasound and the European Society of Cardiovascular Imaging emphasize that Doppler flow imaging parameters can effectively assess diastolic function (7). Notably, several factors, including higher HbA1C levels, are associated with an increased risk of worsening diastolic function in DM2 patients (13, 14). However, conflicting results emerge from studies assessing whether intensive glycemic control significantly reduces the risk of cardiovascular events and heart failure in patients with diabetes (15). This discrepancy underscores the need for further investigation into the control of HbA1C levels and its potential impact on left ventricular diastolic function and its relationship with DCM. Therefore, our study aimed to elucidate the intricate association between glycated hemoglobin levels, diabetes duration, and left ventricular diastolic dysfunction in patients with T2DM and preserved ejection fraction. The anticipated findings aspire to enhance the monitoring and evaluation of cardiac function, enabling the early detection of cardiovascular complications in individuals with T2DM.
Methods
A cross-sectional study was conducted at the Second Affiliated Hospital of Hebei Medical University from January 2022 to December 2022, designed and implemented in strict adherence to the Declaration of Helsinki and International Ethical Guidelines for Biomedical Studies Involving Human Subjects. The protocol received approval from the Ethics Committee of the Second Affiliated Hospital of Hebei Medical University. In this study, patient consent was not required as it was approved under a waiver.
Patients and grouping
A total of 114 hospitalized patients diagnosed with T2DM at the Department of Endocrinology of the Second Affiliated Hospital of Hebei Medical University were included and avoiding key exclusion criteria (16). Exclusion criteria comprised: (1) Previous or current diagnoses of hypertension, coronary heart disease, rheumatic heart disease, or other heart conditions; (2) Occurrence of diabetic ketoacidosis or hyperosmolar coma within the past 3 months; (3) Severe liver dysfunction, with transaminase levels 2.5 times higher than the normal value;(4) Urinary Albumin-to-creatinine ratio (ACR) ≥ 300mg/g or/and Estimated Glomerular Filtration Rate (eGFR)≤ 60ml/min/1.73m2 (5) Left ventricular ejection fraction (LVEF)<50%.
Participants were grouped based on disease duration and HbA1C levels: patients with a disease duration of ≤2 years (initial diabetes, ID group); patients with a disease duration of >2 years and HbA1C>7.5% (higher-HbA1C diabetes, HD group); patients with a disease duration of >2 years and HbA1C ≤ 7.5% (lower-HbA1C diabetes, LD group). Additionally, 38 healthy volunteers undergoing simultaneous physical examinations at the same hospital served as normal controls. Age, gender, body mass index (BMI), smoking, and hypoglycemic drug usage were matched using a propensity score of 1:1 among these subgroups.
Collected information
General information, including diabetes duration, smoking history, gender, age, BMI, medication usage, and systolic and diastolic pressures, was extracted from the electronic medical record system. Biochemical indicators, such as HbA1C, C-reactive protein (CPR), creatinine (Cr), total cholesterol (TC), triglycerides (TG), high-density lipoprotein cholesterol (HDL-C), uric acid (UA), and low-density lipoprotein cholesterol (LDL-C), were meticulously recorded.
Echocardiography examination
The ultrasound instrument, ARIETTA 60 produced by Hitachi in Japan, with a probe frequency of 4.0 Hz, was used for the echocardiography assessment of patients included in the study. Each examination was performed three times. The LVEF was verified twice using two-dimensional M-mode ultrasound and the biplane Simpson method (17, 18). Left ventricular end- systolic volume (LVESV) and left ventricular end-diastolic volume (LVEDV) were measured at the left ventricular long- axis section. The E/A and E/e’ values were calculated based on the ratios of E peak (maximum early diastolic blood flow velocity of the mitral valve), A peak (maximum atrial systolic blood flow velocity), and e’ peak (early diastolic motion velocity of the mitral annulus).
Statistical analysis
Statistical analysis was conducted using SPSS 26.0. The normality of continuous data was assessed using the Kolmogorov-Smirnov test. Normally distributed measurement data were presented as mean ± standard deviation.Single- factor analysis of variance was applied for comparisons among multiple groups, with LSD tests for inter-group comparisons. Non-parametric data were presented as median and interquartile range, and the Kruskal-Wallis test was employed for inter-group comparisons of nonparametric continuous variables. Counting data were expressed as the number of cases, and inter-group comparisons were conducted using the Chi-squared test. Correlation analyses for measurement and counting data were done using Pearson’s correlation for normally distributed variables and Spearman’s correlation for non-normally distributed variables. Multivariable linear regression analysis was performed to identify independent predictors of cardiac diastolic function. A significance level of P<0.05 was considered statistically significant, and all comparisons and correlations were two-tailed.
Results
Clinical characteristics in each group
A total of 152 patients were enrolled and divided into the T2DM (n=114) and control groups (n=38) (Figure 1). Within the T2DM group, patients were further categorized into three subgroups: T2DM with a disease duration of ≤2 years (ID group, n=38); T2DM with a disease duration of >2 years and HbA1C>7.5% (HD group, n=38); patients with a disease duration of >2 years and HbA1C ≤ 7.5% (LD group, n=38). T2DM patients had significantly higher levels of TG, CRP, and HbA1C compared to controls (p< 0.05). Moreover, both ID and HD patients displayed elevated TG and HbA1C levels compared to controls and the LD group. There were no significant differences in CRP among the three subgroups within the T2DM population, as shown in Table 1.
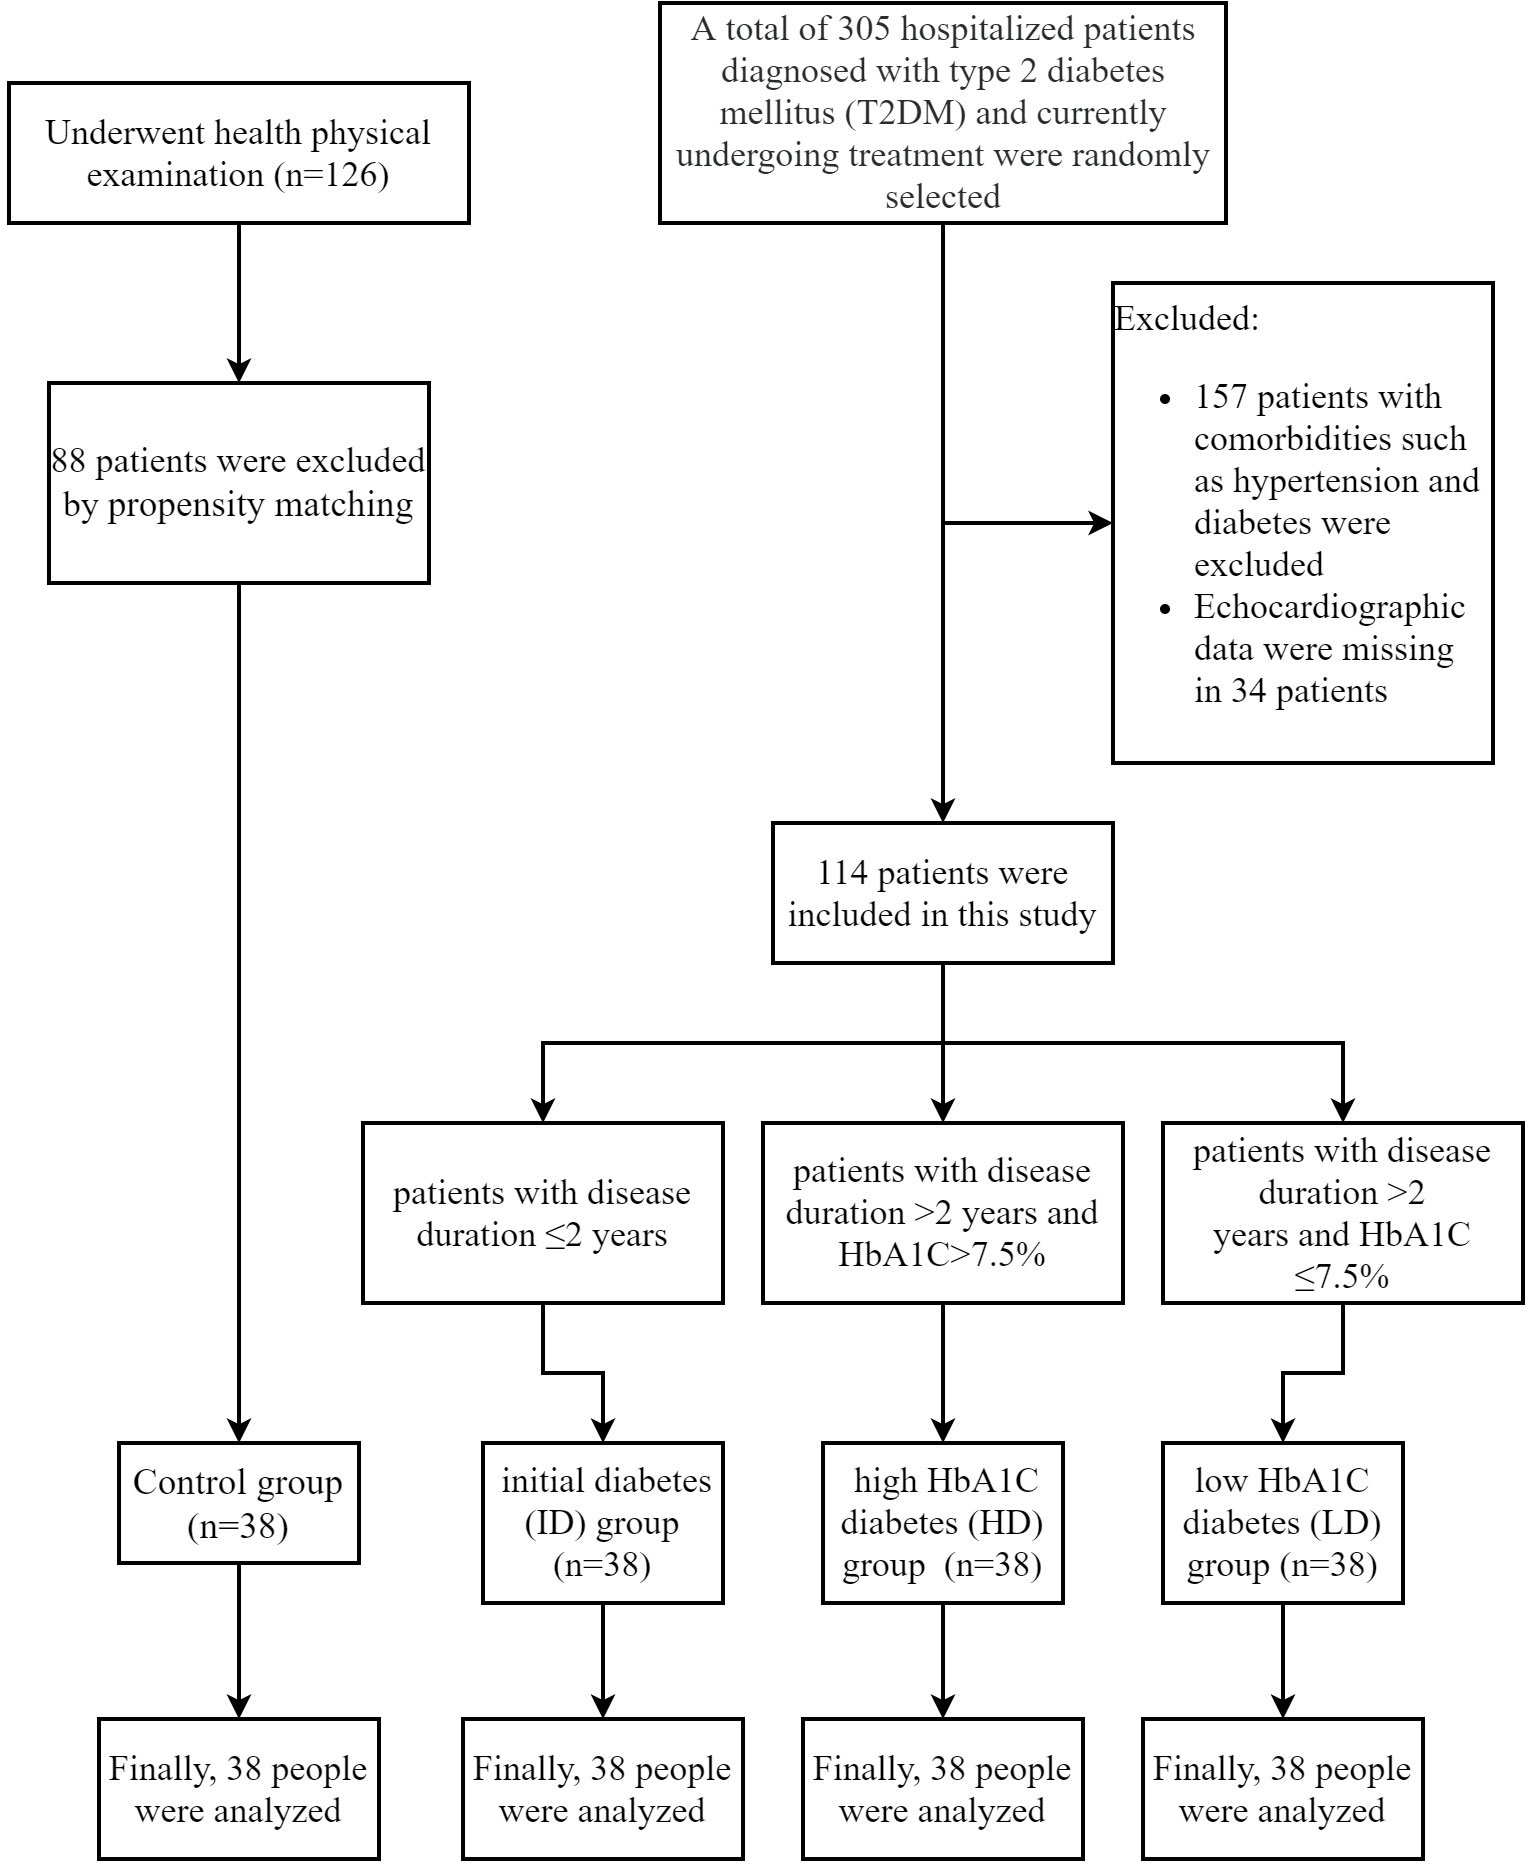
Figure 1 Flow chart of the inclusion process.
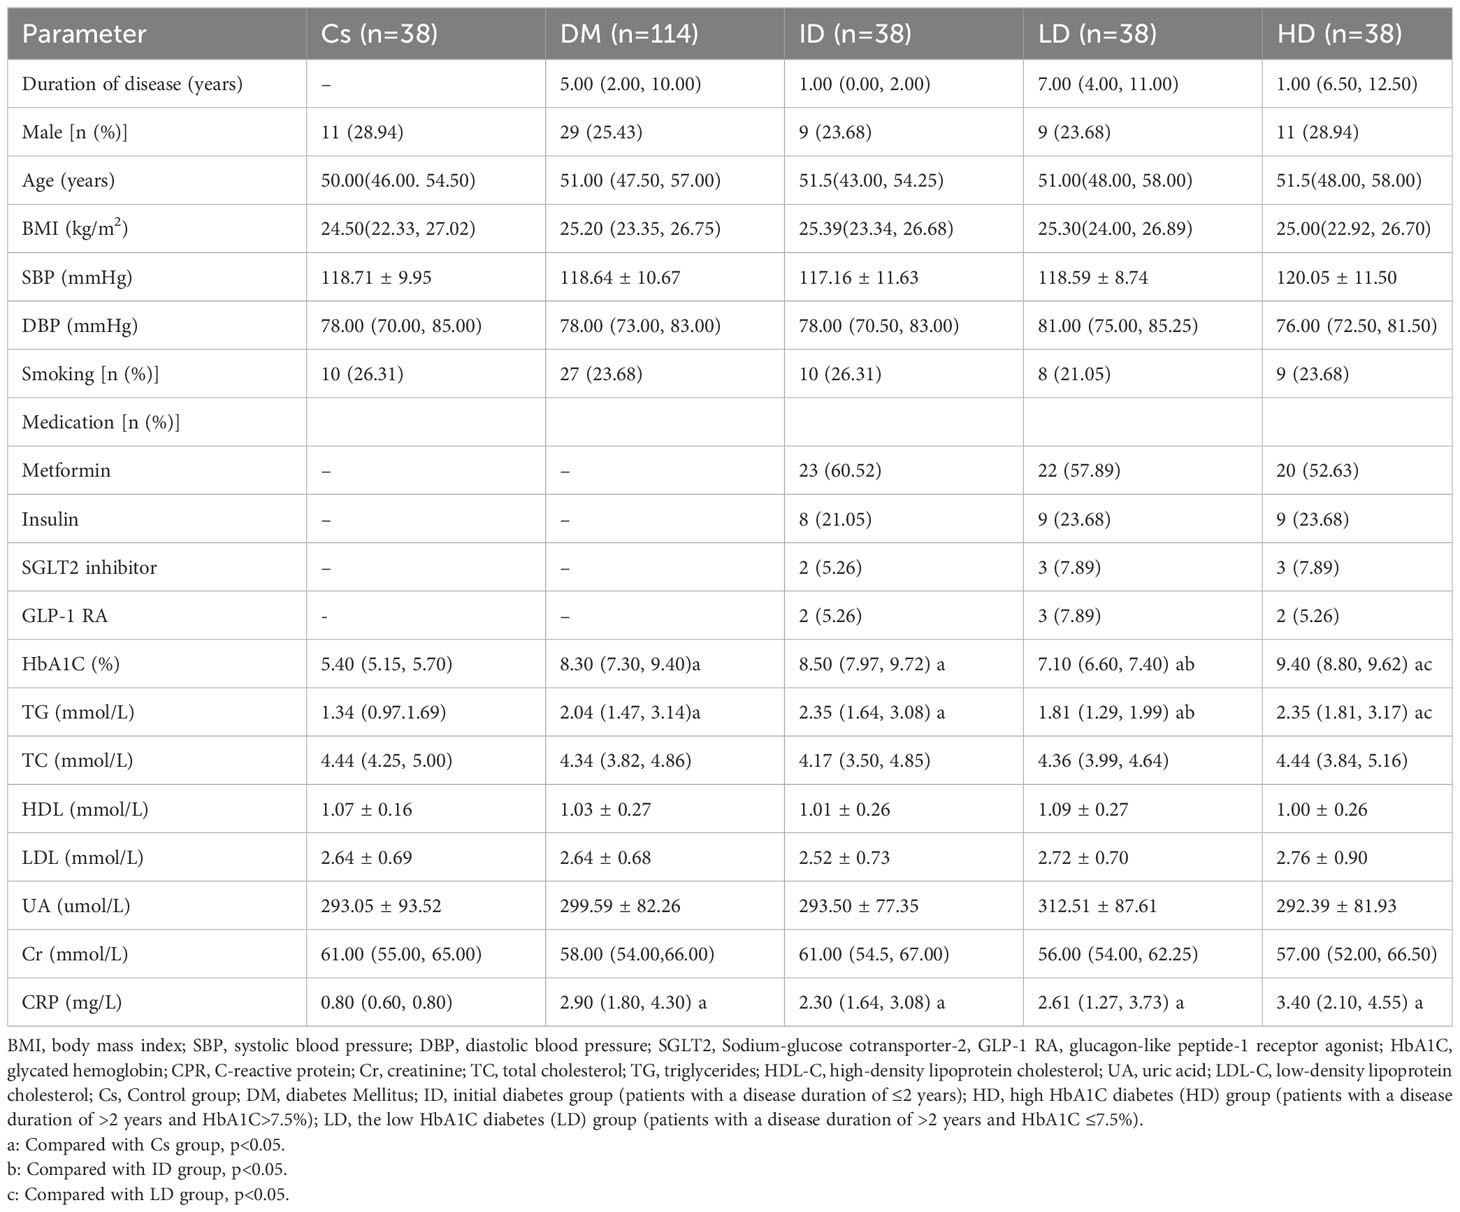
Table 1 Clinical characteristics in each group.
Echocardiography evaluation of cardiac systolic and diastolic function in each group
T2DM patients exhibited significantly higher E/e’ values and lower E/A index values compared to controls (p<0.05). Both the LD and HD groups displayed increased E/e’ values and decreased E/A index values compared to controls and the ID group (p<0.05). Notably, the HD group demonstrated a higher E/e’ and a lower E/A compared to the LD group. However, there were no significant differences between the T2DM and control groups in terms of LVEF values (65.66 ± 4.3 vs. 66.62 ± 4.51; p=0.25). Additionally, there were no significant differences in LVEF values among three subgroups within the T2DM patients (all p>0.05). Other functional parameters also showed no significant differences between T2DM patients and controls (Table 2).
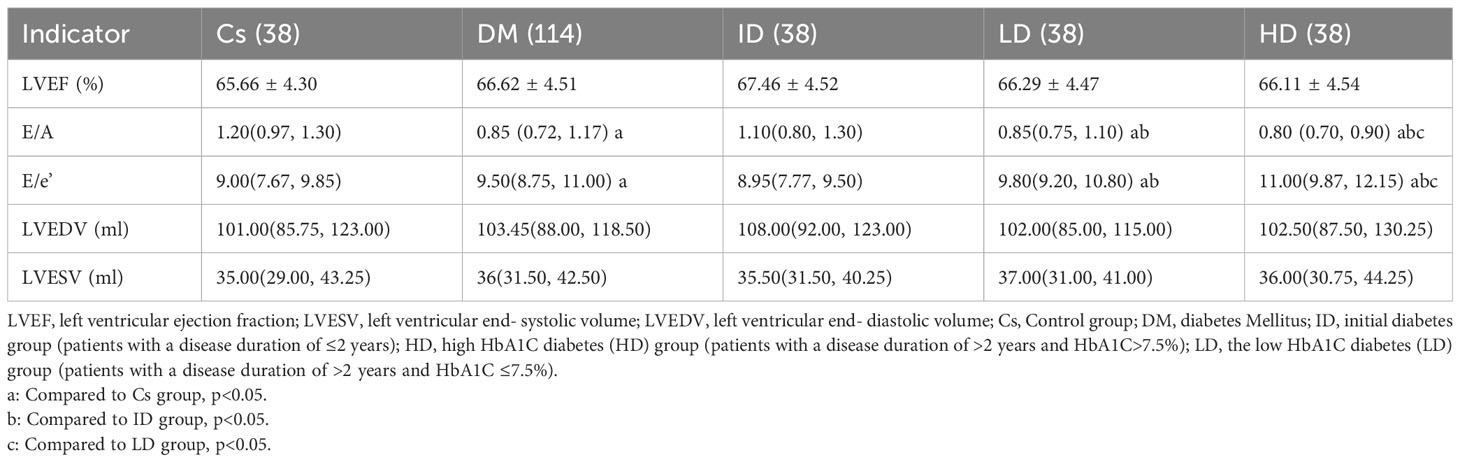
Table 2 Cardiac systolic and diastolic functional parameters in each subject.
Correlation analysis and multivariate regression analysis of E/A, E/e’, and other clinical indicators
The univariate correlation coefficients between E/A, E/e’ values, and clinical indexes in T2DM patients were summarized in Table 3.
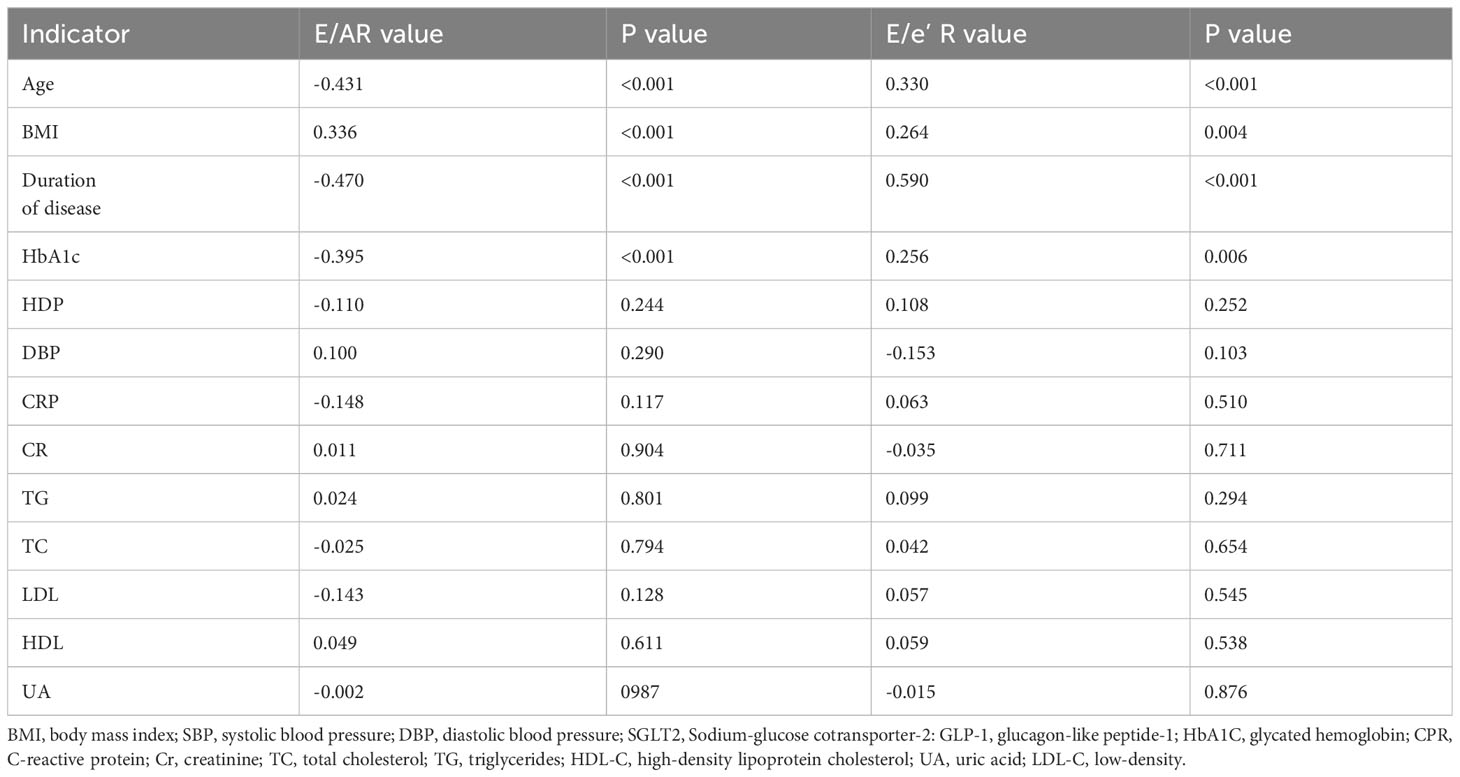
Table 3 Correlation analysis of E/A, E/e’ and other clinical indicators.
Notably, both E/A and E/e’ values demonstrated significant correlations with key clinical factors, including HbA1C, age, disease duration, and BMI values. However, no significant associations were observed between E/A and E/e’ values and other clinical parameters, such as TG and HBP. Multivariable linear analysis revealed that HbA1C (β= 0.294, p<0.001) and disease duration (β =0.319, p<0.001) could predict reduced E/A (model R2 = 0.381, Table 4). Furthermore, HbA1C (β =0.178, p=0.015) and disease duration (β =0.529, p<0.001) were identified as predictor of increased E/e’ (model R2 = 0.436, Table 5).

Table 4 Multivariate regression analysis for E/A in T2DM patients.

Table 5 Multivariate regression analysis for E/e’ in T2DM patients.
Discussion
This study depicted that echocardiographic assessment in patients with diabetes revealed diminished E/A values and heightened E/e’ values compared to healthy controls. Subgroup analysis within the diabetic population indicated that patients with a disease duration exceeding 2 years exhibited lower E/A values and higher E/e’ values in comparison to those with a disease duration of 2 years or less. Among patients with a disease duration exceeding 2 years, those with elevated HbA1C levels demonstrated lower E/A values and higher E/e’ values compared to those with lower HbA1C levels. Multivariable linear regression analysis identified HbA1C and diabetes duration as independent risk factors for reduced E/A values and elevated E/e’ values on echocardiography among patients with diabetes, respectively. To accurately evaluate changes in cardiac function in diabetic cardiomyopathy, this study excluded patients with hypertension, coronary heart disease, and valvular disease. Patients with T2DM were matched with healthy individuals based on BMI, gender, age, and smoking status to minimize the impact of these factors on cardiac function (19, 20). The findings underscored impaired diastolic function in patients with T2DM.
In accordance with the latest guidelines from the American Society of Cardiac Ultrasound and the European Society of Cardiovascular Imaging, the assessment of cardiac diastolic function involves parameters measured through Doppler blood flow imaging, including E wave, E’, A wave, and A’. Previous studies have reported various indicators such as prolonged cardiac deceleration time, decreased e’, increased E/e’, reduced E/A, and prolonged isovolumic relaxation time in diabetic patients with normal left ventricular systolic function (21, 22). Additionally, global longitudinal strain of the left ventricle, speckle tracking echocardiography, and strain rate imaging have all confirmed early diastolic dysfunction in patients with diabetes, signifying the apparent progression from diastolic dysfunction to left ventricular systolic dysfunction in diabetic cardiomyopathy (23, 24). Our study substantiates these findings by confirming that diabetic patients with normal ejection fraction exhibit decreased E/A values and increased E/e’ values, highlighting the occurrence of diastolic dysfunction in the early stages of diabetes. Subgroup analysis based on diabetes duration and HbA1C levels further dissected cardiac function. The results indicated that patients with long-standing diabetes and diastolic dysfunction experienced worse outcomes compared to patients with initial-onset diabetes but no systolic dysfunction. Correlation analysis revealed a negative association between the E/A parameter and disease duration, while E/e’ exhibited a positive correlation with disease duration. These findings suggest that diabetic cardiomyopathy gradually develops and progresses with the duration of diabetes, while no changes in cardiac function were observed in patients with initial-onset diabetes. Advanced cardiac magnetic resonance imaging (CMRI) technology, as explored by Japanese researchers, has provided insights into cardiac conditions in young patients with T2DM (under 40 years of age). Their findings revealed a close relationship between early diastolic dysfunction and the duration of diabetes (25). Furthermore, Shah et al. observed geometric changes in cardiac remodeling and significant reductions in myocardial diastolic function in obese adolescents with T2DM, suggesting an increased risk of early heart failure in this population (26). CMRI studies have consistently demonstrated lower early diastolic peak strain rate in young individuals with T2DM (18-40 years old) compared to normal subjects, indicating the presence of subclinical diastolic dysfunction in the early stages of diabetes and a susceptibility to heart failure (27), aligning with the observations from our study.
Persistent hyperglycemia can induce diastolic dysfunction through various mechanisms, including abnormal glucose and lipid metabolism, inflammation, oxidative stress, activation of the renin-angiotensin-aldosterone system (RAAS), and myocardial microvasculopathy. These processes lead to cardiomyocyte apoptosis, hypertrophy, and fibrosis (5, 28). The severity of myocardial diastolic dysfunction is notably higher in patients with poorly controlled blood glucose levels, HbA1C levels surpassing 7.5%, and extended disease durations. Correlation analysis demonstrated a negative association between HbA1C and the diastolic function parameter E/A, while a positive correlation was found between HbA1C and E/e’. Increased HbA1C levels and of glucose and lipid metabolism contribute to cardiac dysfunction. Meta-analyses consistently indicate a significant association between higher HbA1C levels and an increased incidence of congestive heart failure (27). Recent studies have identified HbA1C as an independent predictor of left ventricular myocardial deformation and tissue abnormalities in patients with T2DM and preserved ejection fraction (29). However, Shun Yokota suggested that left ventricular diastolic function is more strongly associated with hyperglycemic variability rather than HbA1C levels in T2DM (30). Larger patient cohorts are necessary for further investigation to validate these differences. Consistent with our findings, obesity and smoking in adolescents have been linked to increased left ventricular volume and reduced myocardial diastolic function (20, 31, 32). Our study also depicted the impact of BMI on cardiac function, but no significant correlation was seen between smoking and cardiac function parameters, potentially due to the limited number of smokers included in our study. Importantly, our results highlighted age as a key clinical factor significantly correlated with T2DM. Nearly half of people with diabetes are middle-aged and elderly, making this group particularly vulnerable (33). Factors such as age and T2DM contribute to increased frailty in this population (34, 35). Furthermore, insulin resistance is prevalent among frail elderly individuals, adding complexity to the clinical treatment of elderly patients with diabetes and heart failure (36, 37). Urgent attention is required for the development of treatment programs and antidiabetic drugs that can effectively reduce glucose levels and provide cardiac protection. Several studies have explored these areas (38, 39), which will be a focus of our future research. Admittedly, this study has several limitations that should be acknowledged: Firstly, the study is constrained by a short follow-up period and a narrow window for the cross-sectional study, potential introducing observation bias. Secondly, there is an inadequacy of research regarding the potential enhancement of diastolic dysfunction through antidiabetic medications. Thirdly, insufficient attention has been given to dietary control and the impact of other blood sugar management approaches, such as exercise.
Conclusions
This study offers compelling evidence of early diastolic dysfunction in diabetic cardiomyopathy, observable in patients with preserved ejection fraction during the early stages of diabetes. Moreover, cardiac diastolic function demonstrated significant associations with diabetes duration and HbA1C levels. This emphasizes the importance of early echocardiography assessment and screening of E/A and E/e’ in newly diagnosed diabetes patients for the prompt detection and monitoring of diabetic cardiomyopathy progression.
Data availability statement
The raw data supporting the conclusions of this article will be made available by the authors, without undue reservation.
Ethics statement
The protocol has been reviewed and approved by the Ethics Committee of the Second Affiliated Hospital of Hebei Medical University. The studies were conducted in accordance with the local legislation and institutional requirements. The participants provided their written informed consent to participate in this study.
Author contributions
NL: Conceptualization, Writing – original draft. MZ: Data curation, Formal analysis, Writing – review & editing. LY: Data curation, Formal analysis, Writing – review & editing. YC: Data curation, Formal analysis, Writing – review & editing. HZ: Conceptualization, Writing – review & editing.
Funding
The author(s) declare financial support was received for the research, authorship, and/or publication of this article. This study was funded by Health Commission of Hebei Province (No.20210196) and the Natural Science Funds for Young Scholar of Hebei, China (No. 2020206108).
Conflict of interest
The authors declare that the research was conducted in the absence of any commercial or financial relationships that could be construed as a potential conflict of interest.
Publisher’s note
All claims expressed in this article are solely those of the authors and do not necessarily represent those of their affiliated organizations, or those of the publisher, the editors and the reviewers. Any product that may be evaluated in this article, or claim that may be made by its manufacturer, is not guaranteed or endorsed by the publisher.
References
1. Halabi A, Potter E, Yang H, Wright L, Sacre JW, Shaw JE, et al. Association of biomarkers and risk scores with subclinical left ventricular dysfunction in patients with type 2 diabetes mellitus. Cardiovasc Diabetol (2022) 21(1):278. doi: 10.1186/s12933-022-01711-5
2. Cho NH, Shaw JE, Karuranga S, Huang Y, da Rocha Fernandes JD, Ohlrogge AW, et al. IDF Diabetes Atlas: Global estimates of diabetes prevalence for 2017 and projections for 2045. Diabetes Res Clin Pract (2018) 138:271–81. doi: 10.1016/j.diabres.2018.02.023
3. Jankauskas SS, Kansakar U, Varzideh F, Wilson S, Mone P, Lombardi A, et al. Heart failure in diabetes. Metabolism (2021) 125:154910. doi: 10.1016/j.metabol.2021.154910
4. Sardu C, De Lucia C, Wallner M, Santulli G. Diabetes mellitus and its cardiovascular complications: new insights into an old disease. J Diabetes Res (2019) 2019:1905194. doi: 10.1155/2019/1905194
5. Jia G, Hill MA, Sowers JR. Diabetic cardiomyopathy: an update of mechanisms contributing to this clinical entity. Circ Res (2018) 122(4):624–38. doi: 10.1161/CIRCRESAHA.117.311586
6. Liu X, Yang ZG, Gao Y, Xie LJ, Jiang L, Hu BY, et al. Left ventricular subclinical myocardial dysfunction in uncomplicated type 2 diabetes mellitus is associated with impaired myocardial perfusion: a contrast-enhanced cardiovascular magnetic resonance study. Cardiovasc Diabetol (2018) 17(1):139. doi: 10.1186/s12933-018-0782-0
7. Nagueh SF, Smiseth OA, Appleton CP, Byrd BF, Dokainish H, Edvardsen T, et al. Recommendations for the evaluation of left ventricular diastolic function by echocardiography: an update from the american society of echocardiography and the european association of cardiovascular imaging. J Am Soc Echocardiogr Off Publ Am Soc Echocardiogr (2016) 29(4):277–314. doi: 10.1016/j.echo.2016.01.011
8. Poirier P, Bogaty P, Garneau C, Marois L, Dumesnil JG. Diastolic dysfunction in normotensive men with well-controlled type 2 diabetes: importance of maneuvers in echocardiographic screening for preclinical diabetic cardiomyopathy. Diabetes Care (2001) 24(1):5–10. doi: 10.2337/diacare.24.1.5
9. Patil VC, Patil HV, Shah KB, Vasani JD, Shetty P. Diastolic dysfunction in asymptomatic type 2 diabetes mellitus with normal systolic function. J Cardiovasc Dis Res (2011) 2(4):213–22. doi: 10.4103/0975-3583.89805
10. Boonman-de Winter LJM, Rutten FH, Cramer MJM, Landman MJ, Liem AH, Rutten GEHM, et al. High prevalence of previously unknown heart failure and left ventricular dysfunction in patients with type 2 diabetes. Diabetologia (2012) 55(8):2154–62. doi: 10.1007/s00125-012-2579-0
11. Hammoudi N, Jeong D, Singh R, Farhat A, Komajda M, Mayoux E, et al. Empagliflozin improves left ventricular diastolic dysfunction in a genetic model of type 2 diabetes. Cardiovasc Drugs Ther (2017) 31(3):233–46. doi: 10.1007/s10557-017-6734-1
12. Ritchie RH, Abel ED. Basic mechanisms of diabetic heart disease. Circ Res (2020) 126(11):1501–25. doi: 10.1161/CIRCRESAHA.120.315913
13. Bergerot C, Davidsen ES, Amaz C, Thibault H, Altman M, Bellaton A, et al. Diastolic function deterioration in type 2 diabetes mellitus: predictive factors over a 3-year follow-up. Eur Heart J Cardiovasc Imaging (2018) 19(1):67–73. doi: 10.1093/ehjci/jew331
14. Erqou S, Lee CTC, Suffoletto M, Echouffo-Tcheugui JB, de Boer RA, van Melle JP, et al. Association between glycated hemoglobin and the risk of congestive heart failure in diabetes mellitus: systematic review and meta-analysis. Eur J Heart Fail (2013) 15(2):185–93. doi: 10.1093/eurjhf/hfs156
15. Zhan J, Chen C, Wang DW, Li H. Hyperglycemic memory in diabetic cardiomyopathy. Front Med (2022) 16(1):25–38. doi: 10.1007/s11684-021-0881-2
16. ElSayed NA, Aleppo G, Aroda VR, Bannuru RR, Brown FM, Bruemmer D, et al. Classification and diagnosis of diabetes: standards of care in diabetes-2023. Diabetes Care (2023) 46(Suppl 1):S19–40. doi: 10.2337/dc23-S002
17. Lopez L, Colan SD, Frommelt PC, Ensing GJ, Kendall K, Younoszai AK, et al. Recommendations for quantification methods during the performance of a pediatric echocardiogram: a report from the Pediatric Measurements Writing Group of the American Society of Echocardiography Pediatric and Congenital Heart Disease Council. J Am Soc Echocardiogr Off Publ Am Soc Echocardiogr (2010) 23(5):465–95. doi: 10.1016/j.echo.2010.03.019
18. Lang RM, Badano LP, Mor-Avi V, Afilalo J, Armstrong A, Ernande L, et al. Recommendations for cardiac chamber quantification by echocardiography in adults: an update from the American Society of Echocardiography and the European Association of Cardiovascular Imaging. J Am Soc Echocardiogr Off Publ Am Soc Echocardiogr (2015) 28(1):1–39.e14. doi: 10.1093/ehjci/jew041
19. Wu Y, Li Z, Du B, Ye Y, Wang H, Niu Y, et al. Different associations of systolic blood pressure and body mass index with cardiac structure and function in young children. Hypertens Dallas Tex (2022) 79(11):2583–92. doi: 10.1161/HYPERTENSIONAHA.122.19396
20. Batista ANR, Garcia T, Franco EAT, Azevedo PS, Barbosa MF, Zornoff LAM, et al. Comparison of morphometry and ventricular function of healthy and smoking young people. BMC Cardiovasc Disord (2020) 20(1):66. doi: 10.1186/s12872-020-01372-w
21. Grigorescu ED, Lacatusu CM, Floria M, Mihai BM, Cretu I, Sorodoc L. Left ventricular diastolic dysfunction in type 2 diabetes-progress and perspectives. Diagn Basel Switz (2019) 9(3):121. doi: 10.3390/diagnostics9030121
22. Fang ZY, Yuda S, Anderson V, Short L, Case C, Marwick TH. Echocardiographic detection of early diabetic myocardial disease. J Am Coll Cardiol (2003) 41(4):611–7. doi: 10.1016/S0735-1097(02)02869-3
23. Ernande L, Rietzschel ER, Bergerot C, De Buyzere ML, Schnell F, Groisne L, et al. Impaired myocardial radial function in asymptomatic patients with type 2 diabetes mellitus: a speckle-tracking imaging study. J Am Soc Echocardiogr Off Publ Am Soc Echocardiogr (2010) 23(12):1266–72. doi: 10.1016/j.echo.2010.09.007
24. Enomoto M, Ishizu T, Seo Y, Kameda Y, Suzuki H, Shimano H, et al. Myocardial dysfunction identified by three-dimensional speckle tracking echocardiography in type 2 diabetes patients relates to complications of microangiopathy. J Cardiol (2016) 68(4):282–7. doi: 10.1016/j.jjcc.2016.03.007
25. Khan JN, Wilmot EG, Leggate M, Singh A, Yates T, Nimmo M, et al. Subclinical diastolic dysfunction in young adults with Type 2 diabetes mellitus: a multiparametric contrast-enhanced cardiovascular magnetic resonance pilot study assessing potential mechanisms. Eur Heart J Cardiovasc Imaging (2014) 15(11):1263–9. doi: 10.1093/ehjci/jeu121
26. Shah AS, Khoury PR, Dolan LM, Ippisch HM, Urbina EM, Daniels SR, et al. The effects of obesity and type 2 diabetes mellitus on cardiac structure and function in adolescents and young adults. Diabetologia (2011) 54(4):722–30. doi: 10.1007/s00125-010-1974-7
27. Htike ZZ, Yates T, Brady EM, Webb D, Gray LJ, Swarbrick D, et al. Rationale and design of the randomized controlled trial to assess the impact of liraglutide on cardiac function and structure in young adults with type 2 diabetes (the LYDIA study). Cardiovasc Diabetol (2016) 15(1):102. doi: 10.1186/s12933-016-0421-6
28. Hwang YC, Jee JH, Kang M, Rhee EJ, Sung J, Lee MK. Metabolic syndrome and insulin resistance are associated with abnormal left ventricular diastolic function and structure independent of blood pressure and fasting plasma glucose level. Int J Cardiol (2012) 159(2):107–11. doi: 10.1016/j.ijcard.2011.02.039
29. Li Z, Han D, Qi T, Deng J, Li L, Gao C, et al. Hemoglobin A1c in type 2 diabetes mellitus patients with preserved ejection fraction is an independent predictor of left ventricular myocardial deformation and tissue abnormalities. BMC Cardiovasc Disord (2023) 23(1):49. doi: 10.1186/s12872-023-03082-5
30. Yokota S, Tanaka H, Mochizuki Y, Soga F, Yamashita K, Tanaka Y, et al. Association of glycemic variability with left ventricular diastolic function in type 2 diabetes mellitus. Cardiovasc Diabetol (2019) 18(1):166. doi: 10.1186/s12933-019-0971-5
31. von der Born J, Baberowski S, Memaran N, Grams L, Homeyer D, Borchert-Mörlins B, et al. Impact of sex and obesity on echocardiographic parameters in children and adolescents. Pediatr Cardiol (2022) 43(7):1502–16. doi: 10.1007/s00246-022-02876-2
32. Burden S, Weedon B, Whaymand L, Rademaker J, Dawes H, Jones A. The effect of overweight/obesity on diastolic function in children and adolescents: A meta-analysis. Clin Obes (2021) 11(5):e12476. doi: 10.1111/cob.12476
33. Bellary S, Kyrou I, Brown JE, Bailey CJ. Type 2 diabetes mellitus in older adults: clinical considerations and management. Nat Rev Endocrinol (2021) 17(9):534–48. doi: 10.1038/s41574-021-00512-2
34. Mone P, De Gennaro S, Frullone S, Marro A, Santulli G. Hyperglycemia drives the transition from pre-frailty to frailty: The Monteforte study. Eur J Intern Med (2023) 111:135–7. doi: 10.1016/j.ejim.2023.01.006
35. Li G, Prior JC, Leslie WD, Thabane L, Papaioannou A, Josse RG, et al. Frailty and risk of fractures in patients with type 2 diabetes. Diabetes Care (2019) 42(4):507–13. doi: 10.2337/dc18-1965
36. Mone P, De Gennaro S, Moriello D, Frullone S, D’Amelio R, Ferrante MNV, et al. Insulin resistance drives cognitive impairment in hypertensive pre-diabetic frail elders: the CENTENNIAL study. Eur J Prev Cardiol (2023) 30(12):1283–8. doi: 10.1093/eurjpc/zwad173
37. Jankauskas SS, Mone P, Avvisato R, Varzideh F, De Gennaro S, Salemme L, et al. miR-181c targets Parkin and SMAD7 in human cardiac fibroblasts: Validation of differential microRNA expression in patients with diabetes and heart failure with preserved ejection fraction. Mech Ageing Dev (2023) 212:111818. doi: 10.1016/j.mad.2023.111818
38. Santulli G, Varzideh F, Forzano I, Wilson S, Salemme L, de Donato A, et al. Functional and clinical importance of SGLT2-inhibitors in frailty: from the kidney to the heart. Hypertension (2023) 80(9):1800–9. doi: 10.1161/HYPERTENSIONAHA.123.20598
Keywords: glycated hemoglobin, diabetic duration, type 2 diabetes mellitus, ventricular diastolic dysfunction, risk factors
Citation: Li N, Zhao M, Yuan L, Chen Y and Zhou H (2023) Association between glycosylated hemoglobin levels, diabetes duration, and left ventricular diastolic dysfunction in patients with type 2 diabetes and preserved ejection fraction: a cross-sectional study. Front. Endocrinol. 14:1326891. doi: 10.3389/fendo.2023.1326891
Received: 24 October 2023; Accepted: 01 December 2023;
Published: 20 December 2023.
Edited by:
Pasquale Mone, University of Molise, ItalyReviewed by:
Imma Forzano, University of Naples Federico II, ItalyAntonio de Donato, BioGem Institute, Italy
Copyright © 2023 Li, Zhao, Yuan, Chen and Zhou. This is an open-access article distributed under the terms of the Creative Commons Attribution License (CC BY). The use, distribution or reproduction in other forums is permitted, provided the original author(s) and the copyright owner(s) are credited and that the original publication in this journal is cited, in accordance with accepted academic practice. No use, distribution or reproduction is permitted which does not comply with these terms.
*Correspondence: Hong Zhou, emhvdWhvbmdAaGIyaC5jb20=