 Xin Yan
 Jianrui Jia†
 Wei Zheng
 Xianxian Yuan
 Guanghui Li
- Division of Endocrinology and Metabolism, Department of Obstetrics, Beijing Obstetrics and Gynecology Hospital, Capital Medical University. Beijing Maternal and Child Health Care Hospital, Beijing, China
Objective: To examine the effects of gestational weight gain on pregnancy outcomes and determine the optimal range of weight gain during pregnancy for Chinese women with type 2 diabetes mellitus.
Methods: This retrospective cohort study included 691 Chinese women with type 2 diabetes mellitus from 2012 to 2020. The study utilized a statistical-based approach to determine the optimal range of gestational weight gain. Additionally, multivariate logistic regression analysis was conducted to assess the impact of gestational weight gain on pregnancy outcomes.
Results: (1) In the obese subgroup, gestational weight gain below the recommendations was associated with decreased risks of large for gestational age (adjusted odds ratio [aOR] 0.19; 95% confidence interval [CI] 0.06-0.60) and macrosomia (aOR 0.18; 95% CI 0.05-0.69). In the normal weight subgroup, gestational weight gain below the recommendations of the Institute of Medicine was associated with decreased risks of preeclampsia (aOR 0.18; 95% CI 0.04-0.82) and neonatal hypoglycemia (aOR 0.38; 95% CI 0.15-0.97). (2) In the normal weight subgroup, gestational weight gain above the recommendations of the Institute of Medicine was associated with an increased risk of large for gestational age (aOR 4.56; 95% CI 1.54-13.46). In the obese subgroup, gestational weight gain above the recommendations was associated with an increased risk of preeclampsia (aOR 2.74; 95% CI 1.02, 7.38). (3) The optimal ranges of gestational weight gain, based on our study, were 9-16 kg for underweight women, 9.5-14 kg for normal weight women, 6.5-12 kg for overweight women, and 3-10 kg for obese women. (4) Using the optimal range of gestational weight gain identified in our study seemed to provide better prediction of adverse pregnancy outcomes.
Conclusion: For Chinese women with type 2 diabetes, inappropriate gestational weight gain is associated with adverse pregnancy outcomes, and the optimal range of gestational weight gain may differ from the Institute of Medicine recommendations.
Introduction
With the trend of delayed childbearing and the increasing prevalence of obesity, the worldwide prevalence of type 2 diabetes mellitus in pregnant women has been rapidly increasing (1). Between 1998 and 2013 in Scotland, as well as between 1998 and 2012 in Sweden, there was a significant increase in the number of pregnancies complicated by type 2 diabetes, with a respective rise of 90% and 111% (2, 3). A population-based cohort study conducted in China, which encompassed 6.4 million women aged 20-49 years old from 2010 to 2016, estimated the incidence of diabetes mellitus to be 1.18% (4). Diabetes mellitus was found to be associated with an increased risk of adverse maternal and neonatal outcomes, including hypertensive disorders of pregnancy, cesarean delivery, large for gestational age, macrosomia, congenital anomalies, stillbirth, and perinatal mortality (5–8). Furthermore, intrauterine exposure to diabetes increases the risk of developing obesity and diabetes in adulthood (9).
Previous research studies have reported that both gestational weight gain (GWG) and pre-pregnancy body mass index (BMI) are modifiable risk factors that can contribute to adverse pregnancy outcomes and have a direct influence on fetal development (8, 10, 11). Gestational weight gain has been found to be associated with a range of adverse pregnancy outcomes, including preterm delivery, cesarean section, hypertensive disorders of pregnancy, small for gestational age, large for gestational age, and macrosomia (11–13). According to the World Health Organization, global obesity rates nearly tripled from 1975 to 2016 and in 2016, over half of women aged 18 and older were overweight (40%) or obese (15%) (14). Pre-pregnancy obesity is strongly associated with adverse outcomes for both mothers and infants (15, 16). In 2009, the Institute of Medicine (IOM) updated GWG recommendations across BMI categories, of which gestational weight gain for underweight, normal weight, overweight, and obese women was 12.5–18, 11.5–16, 7–11.5, and 5–9 kg respectively (17). Population-based data from the Pregnancy Risk Assessment Monitoring System revealed that, according to the 2009 Institute of Medicine (IOM) recommendations, 20.9% of American women gained inadequate gestational weight, 32.0% gained adequate weight, and 47.2% gained excessive weight during pregnancy (18). However, it is important to note that the 2009 Institute of Medicine (IOM) recommendations have some limitations as they do not specifically address the optimal gestational weight gain (GWG) range for women with type 2 diabetes. While evidence suggests that the IOM guidelines are applicable to women with type 2 diabetes enrolled in California (19), it remains uncertain whether these guidelines are suitable for other populations, including Chinese women. Therefore, there is a need for information on the optimal GWG across maternal BMI categories for Chinese women with type 2 diabetes.
The objective of this study was to examine the effects of gestational weight gain on pregnancy outcomes and determine the optimal range of weight gain during pregnancy for Chinese women with type 2 diabetes mellitus.
Materials and methods
Study design and participants
This is a retrospective cohort study of women with type 2 diabetes mellitus who received perinatal care and gave birth at Beijing Obstetrics and Gynecology Hospital between January 1, 2012, and December 31, 2020. Participants were included in the study if they: (1) were aged between 18 and 45 years; (2) had a singleton pregnancy; (3) were diagnosed with type 2 diabetes mellitus (an established diagnosis of type 2 diabetes mellitus before pregnancy; or fasting glucose ≥ 7.0 mmol/L; or 2-hour plasma glucose ≥ 11.1 mmol/L during oral glucose tolerance test, or HbA1c ≥ 6.5%; or in a patient with classic symptoms of hyperglycemia or hyperglycemic crisis, a random plasma glucose ≥ 11.1 mmol/L) (20, 21); (4) delivered after 28 weeks of gestation. Participants were excluded if they had incomplete clinical data of gestational weight gain. A doctor thoroughly explained the informed consent form to the patient and answered all their questions and all participants signed informed consent documents prior to participation. This study was approved by the ethics committee of Beijing Obstetrics and Gynecology Hospital, Capital Medical University (2018-ky-009-01) and was carried out in accordance with the principles of the Declaration of Helsinki as revised in 2008. This manuscript was prepared according to STROBE statement (Supplementary File 1).
Data collection
The electronic medical record system of Beijing Obstetrics and Gynecology Hospital was used to collect data, such as maternal demographic information (age, pre-pregnancy BMI, parity, and smoking status); medical history (chronic hypertension, thyroid disorders, and type 2 diabetes); complications and information during pregnancy (gestational weight gain, insulin therapy, hypertensive disorders of pregnancy, intrahepatic cholestasis of pregnancy and diabetic ketoacidosis); maternal and neonatal outcomes (placental abruption, delivery mode, postpartum hemorrhage, preterm birth, premature rupture of membrane, fetal distress, shoulder dystocia, neonatal sex, neonatal birthweight, neonatal intensive care unit admission, neonatal hypoglycemia, neonatal jaundice, and neonatal respiratory distress syndrome); and laboratory data.
Definitions and protocols
All women followed up in our hospital were asked to provide their pre-pregnancy weight. Their heights were measured by a registered nurse at the first prenatal visit before 16 weeks of gestation. During pregnancy, all women were followed up every 4 weeks until 28 weeks of gestation, then every 2 weeks until 36 weeks of gestation, then weekly until delivery. At each prenatal visit, a registered nurse measured and recorded the patients’ weight and blood pressure. Women who were diagnosed with type 2 diabetes attended the hospital-based “one-day diabetes clinic,” which involved spending an entire day in the hospital for theory learning and practical training. Along with attending theoretical classes, they were also provided with a standard low glycemic index diet, participated in aerobics classes, and learned how to monitor their blood glucose levels on their own. Additionally, they were required to visit diabetes doctors every two weeks until delivery. Pre-pregnancy BMI, calculated as self-reported pre-pregnancy weight (in kilograms) divided by squared height (in meters), was categorized based on the World Health Organization recommendations as underweight (BMI, <18.5 kg/m2), normal weight (BMI, 18.5-24.9 kg/m2), overweight (BMI, 25-29.9 kg/m2), and obese (BMI, ≥30 kg/m2).
Exposure
Overall GWG, calculated as weight before delivery minus the pre-pregnancy weight, was classified based on the Institute of Medicine (IOM) recommendations. Gestational weight gain below or above the recommendations was defined as inadequate or excessive weight gain.
Outcomes
The primary outcome was large for gestational age (birthweight above the 90th centile by gestational age and gender) (22). The secondary outcomes included hypertensive disorders (gestational hypertension and preeclampsia), delivery mode (cesarean section, assisted vaginal delivery, and vaginal delivery), preterm birth (<37 weeks), macrosomia (birthweight ≥ 4000g), small for gestational age (birthweight below the 10th centile by gestational age and gender) (22), premature rupture of membranes, postpartum hemorrhage, neonatal hypoglycemia (<2.6mmol/L), neonatal jaundice (requiring phototherapy), neonatal respiratory distress syndrome, and neonatal intensive care unit admission.
Determination of optimal GWG and GWG rate in the 2nd and 3rd trimesters
We used the statistical-based approach to determine the optimal range of GWG in women with type 2 diabetes mellitus.
The statistical-based approach was based on the distribution of GWG or GWG rate in the 2nd and 3rd trimesters in the “No complications subgroup”. The GWG rate in the 2nd and 3rd trimesters was calculated as weight gain after 16 weeks of gestation divided by number of weeks from the 16 weeks of gestation to delivery. Women were divided into the “No complications subgroup” if they: (1) delivered at ≥37 weeks of gestation, (2) infant birth weight between 10th-90th centile, (3) no maternal medical conditions (chronic hypertension and thyroid disorders), and no pregnancy complications (gestational hypertensive disorders, placental abruption, and intrahepatic cholestasis of pregnancy). Otherwise, women were defined as the “Complications subgroup”. In the “No complications subgroup”, the normal range of GWG or the GWG rate in the 2nd and 3rd trimesters was defined as the interquartile range (IQR) of GWG or the GWG rate (25th to 75th centile of GWG or the GWG rate), which we considered reflecting the optimal range of GWG or GWG rate for women in our study. The distribution of gestational weight gain (GWG) and GWG rate were compared between two subgroups: the “No complications subgroup” and the “Complications subgroup”.
Data analysis
All data were analyzed using the SPSS 26.0 software. Categorical variables of baseline characteristics and outcomes in the cohort stratified by pre-pregnancy BMI were expressed as numbers (percentages) and were compared using the Chi-square test or Fisher exact test. Continuous variables that did not conform to the normal distribution were expressed as median (P25, P75) and were compared using the Kruskal-Wallis test. Multivariable logistic regression analysis was used to assess the association of GWG below or above the optimal range with pregnancy outcomes, adjusting for the following confounders: maternal age, nulliparity, gestational age at delivery, chronic hypertension, type 2 diabetes diagnosed before or after pregnancy, HbA1c before 16 weeks of gestation, and the daily dose of insulin before delivery. Two-sided tests were employed for statistical evaluations, and P-values < 0.05 were considered statistically significant.
Results
Characteristics and outcomes of the study groups
From 2012 to 2020, a total of 702 women with type 2 diabetes gave birth after 28 weeks of gestation at our hospital, and 11 patients who did not meet the included criteria were excluded (3 with age <18 or >45 and 8 with incomplete clinical data of gestational weight gain), then 691 women were finally included in this study. The 691 patients were classified into two subgroups: the “No complications subgroup” consisting of 263 patients, and the “Complications subgroup” consisting of 428 patients (Figure 1).
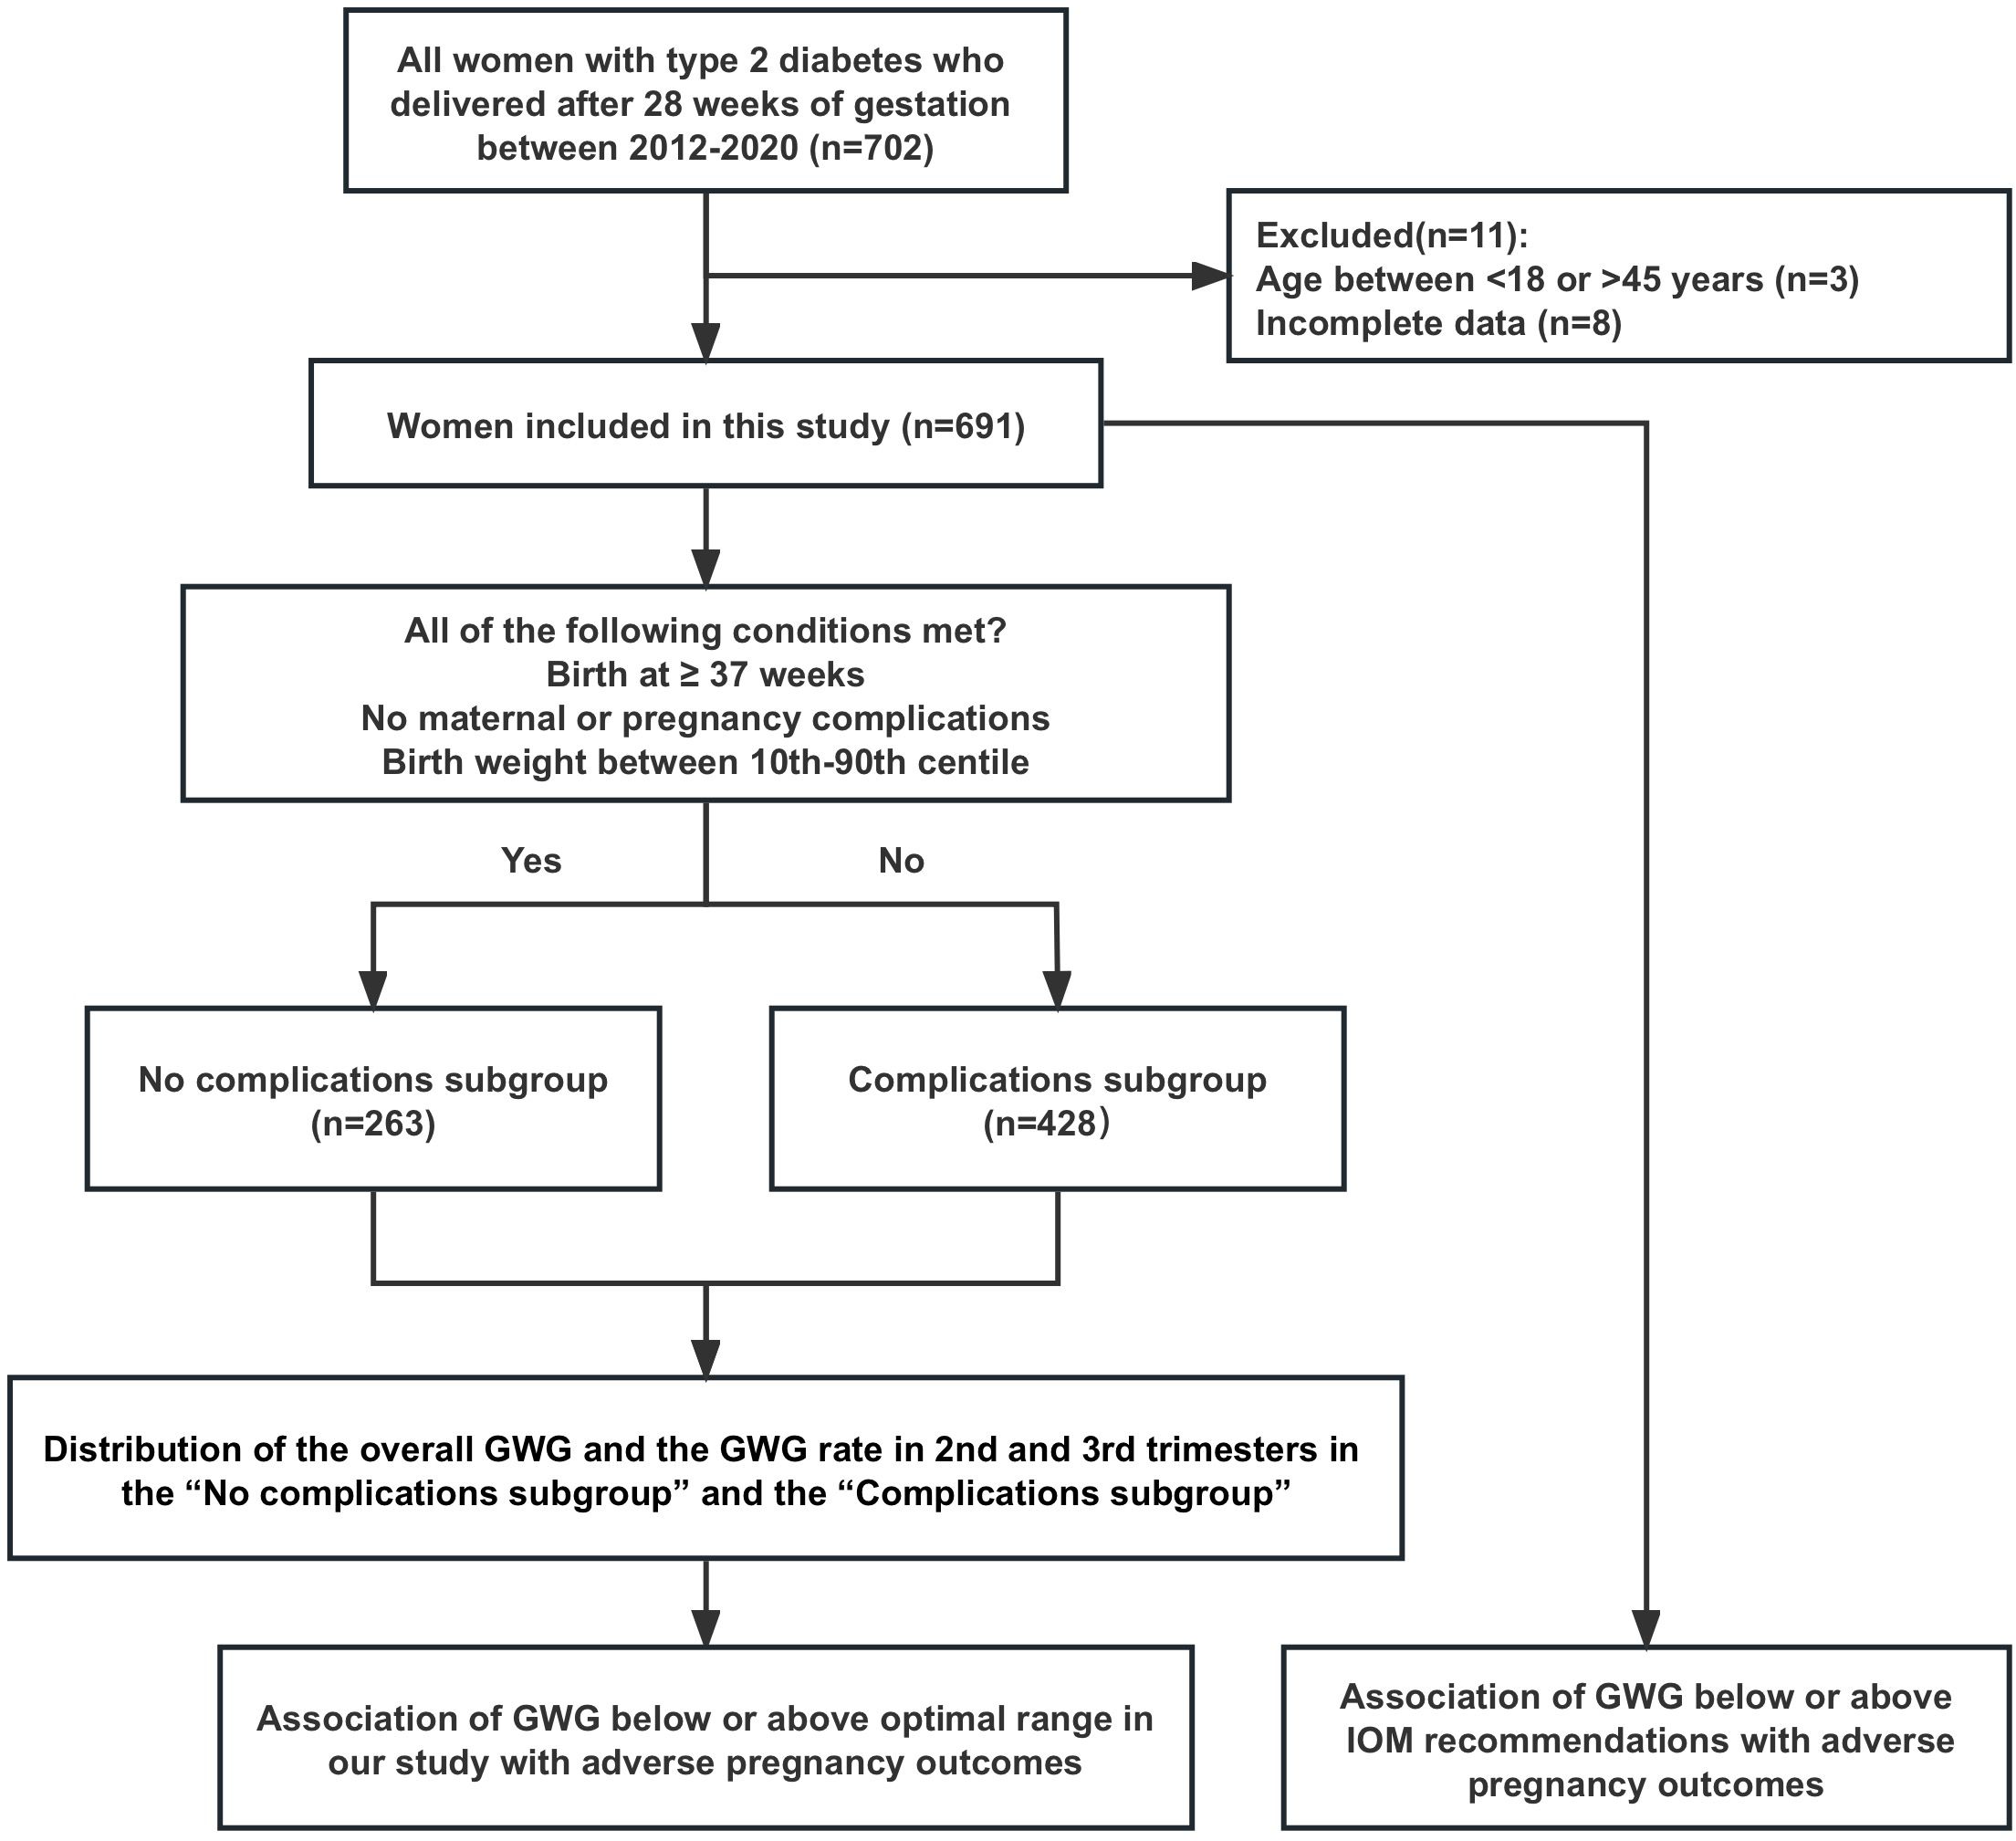
Figure 1 Flow chart for patient recruitment.
The baseline characteristics and outcomes of the overall cohort, stratified by pre-pregnancy BMI, were presented in Table 1. Among the 691 patients, 11 (1.59%) were underweight, 208 (30.10%) were of normal weight, 259 (37.48%) were overweight, and 213 (30.82%) were obese. There were 225(32.56%), 275(39.80%), and 191(27.64%) patients whose GWG was below, within, and above the 2009 IOM recommendations, respectively. Additionally, there were statistical differences in GWG among the pre-pregnancy BMI groups (P<0.001). The underweight group was the youngest, and the rate of advanced age was highest in the normal weight group (P=0.002 and P=0.007, respectively). The rates of type 2 diabetes diagnosed during pregnancy and cesarean section increased with higher pre-pregnancy BMI (both P<0.001), while the rate of vaginal delivery decreased (P=0.002). The rates of chronic hypertension and chronic hypertension with superimposed preeclampsia were lowest in the normal weight group and highest in the obese group (both P<0.001). The rate of small for gestational age was the highest in the underweight group and lowest in the overweight group (P=0.015). No significant statistical differences were observed in the other variables across the groups.
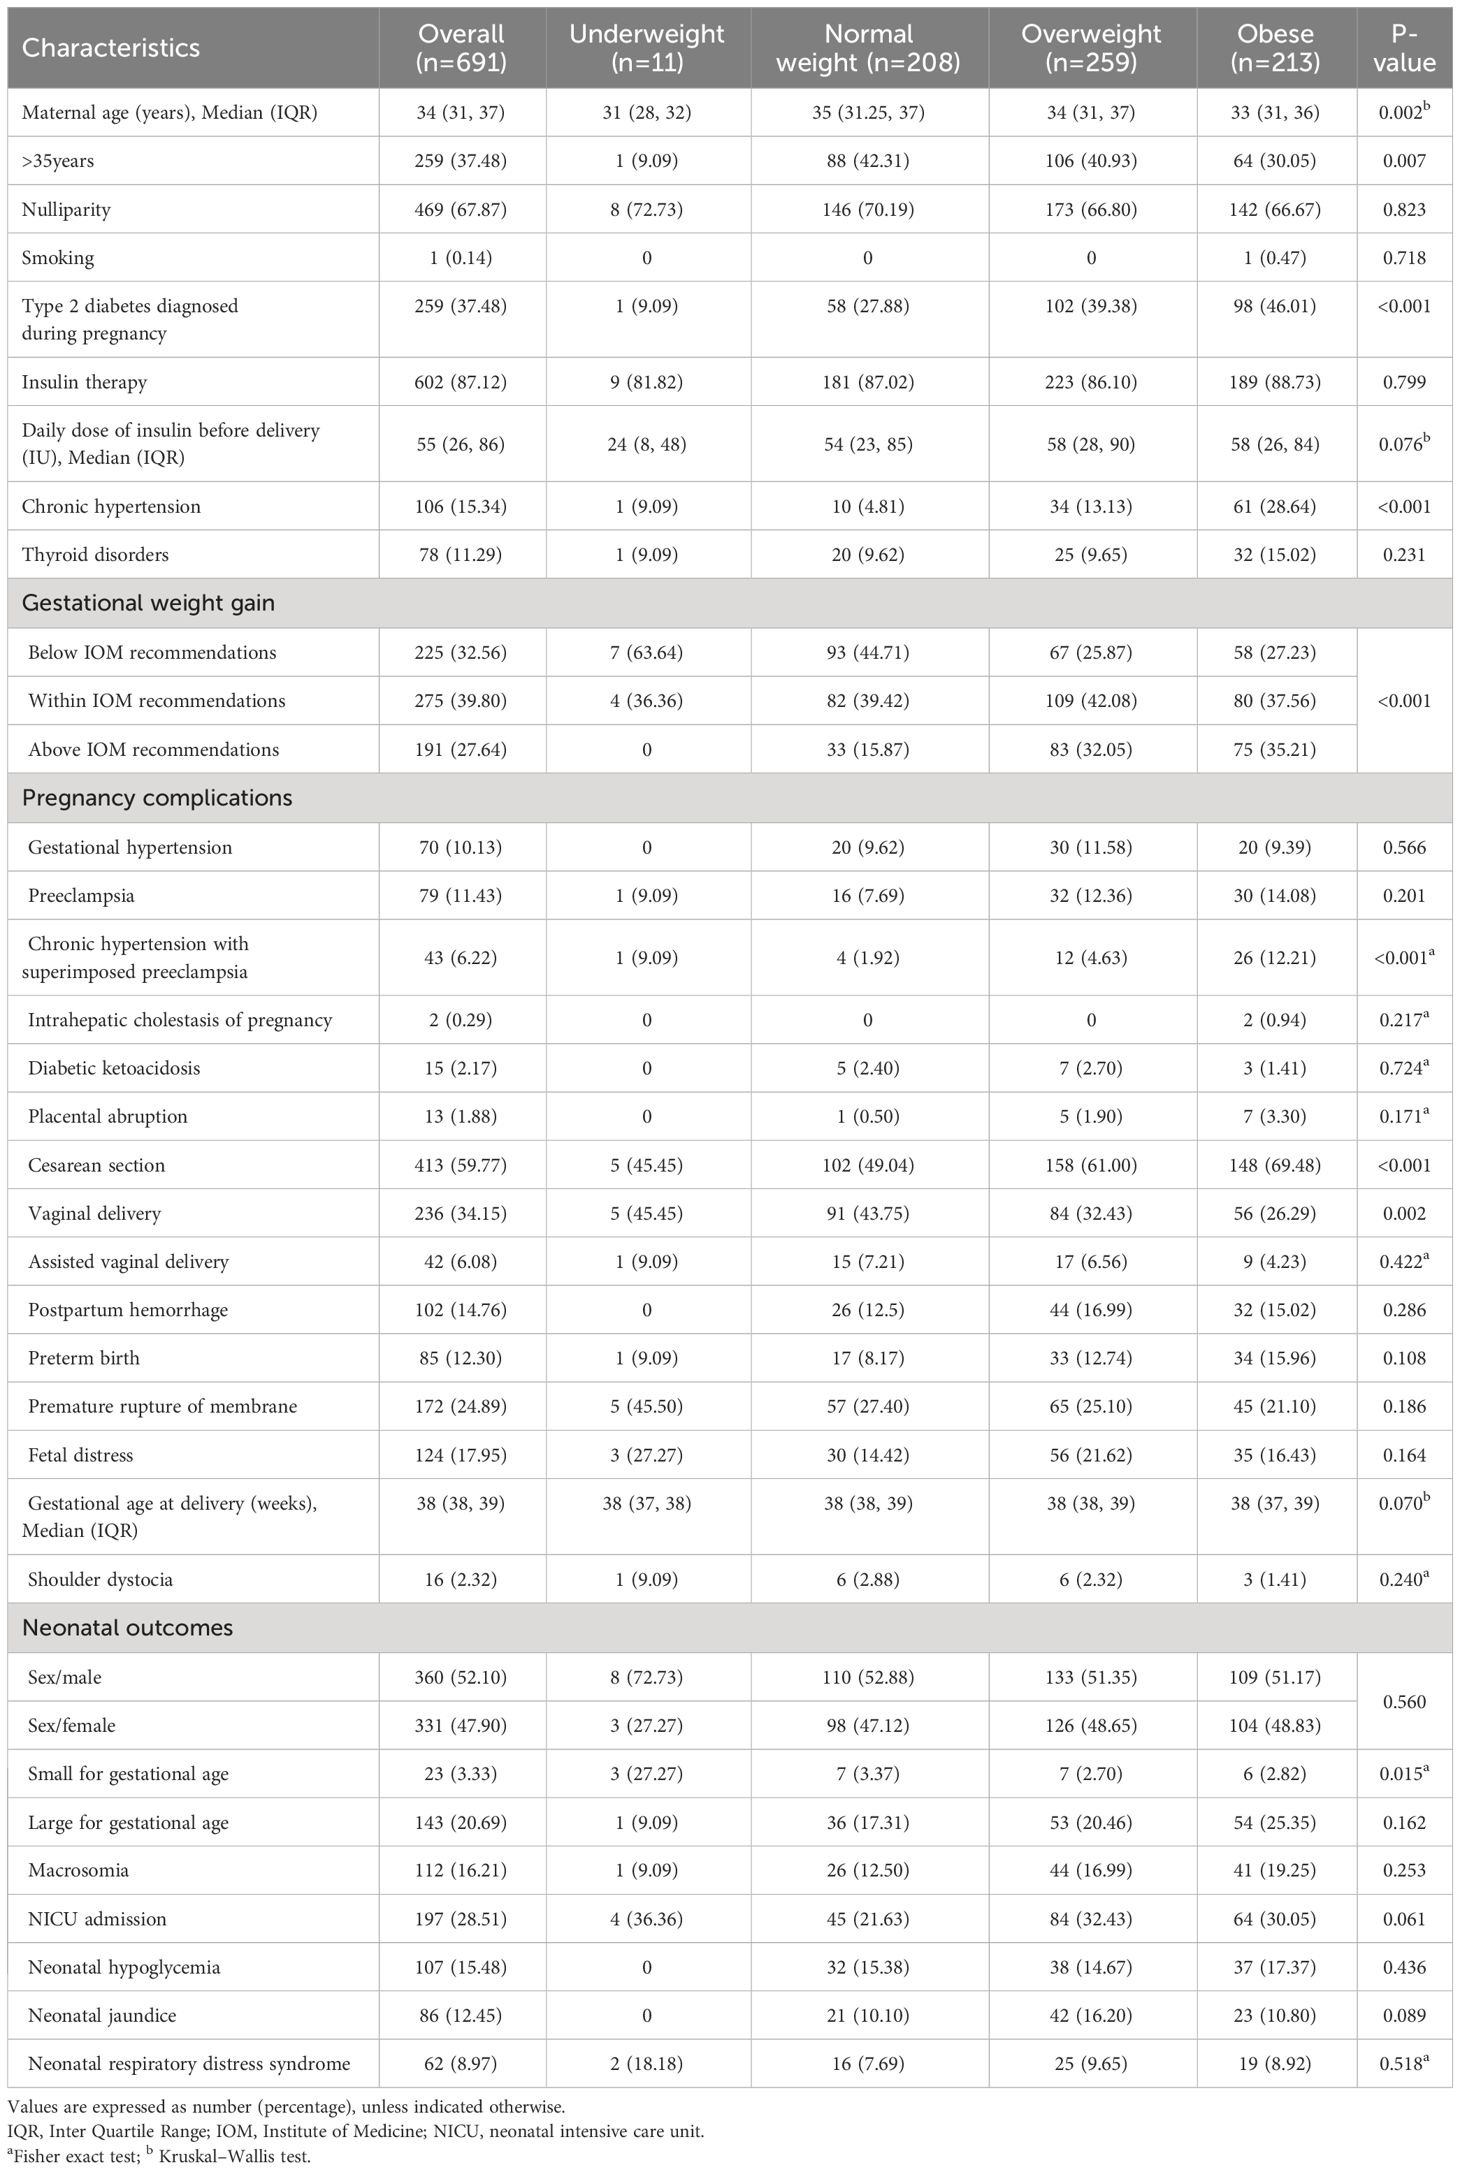
Table 1 Baseline characteristics and outcomes of the overall cohort stratified by pre-pregnancy BMI.
Association of GWG below or above IOM recommendations with adverse pregnancy outcomes
The underweight group was not analyzed because of the small sample size. In the obese subgroup, GWG below the IOM recommendations was associated with lower risks of large for gestational age (OR 0.19; 95%CI 0.06-0.60) and macrosomia (OR 0.18; 95%CI 0.05-0.69) (Table 2). GWG below the IOM recommendations in the normal weight subgroup was associated with lower risks of preeclampsia (OR 0.18; 95%CI 0.04-0.82) and neonatal hypoglycemia (OR 0.38; 95%CI 0.15-0.97). In addition, GWG above the IOM recommendations in the normal weight subgroup was associated with higher risk of large for gestational age (OR 4.56; 95%CI 1.54-13.46) (Table 2).
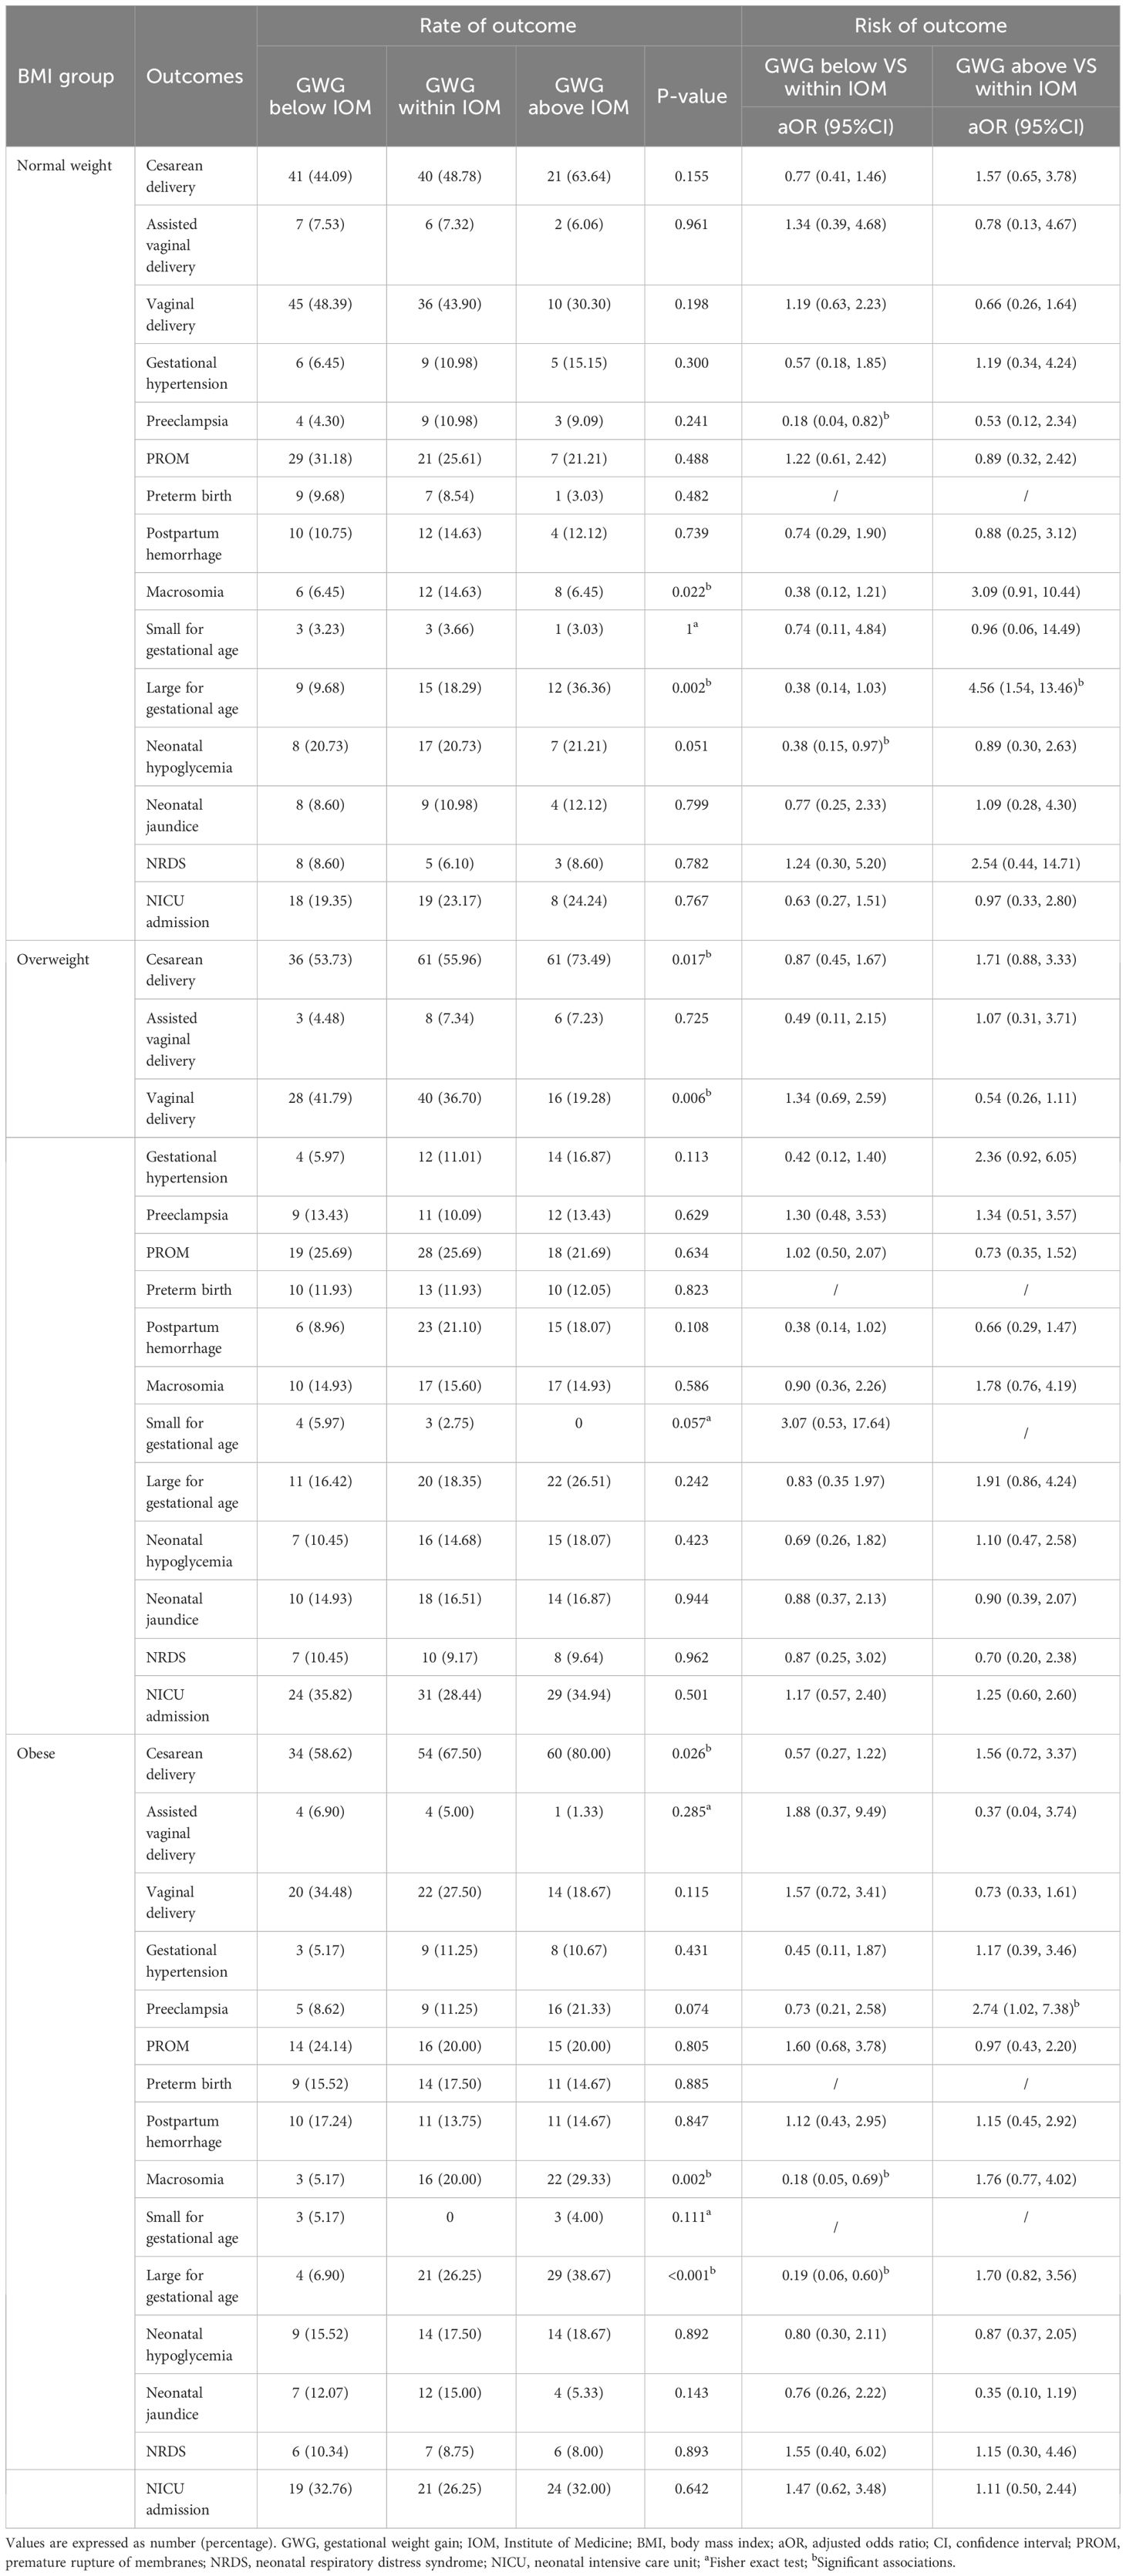
Table 2 Association of GWG below and above the 2009 IOM recommendations with adverse pregnancy outcomes.
Optimal overall GWG and GWG rate in the 2nd and 3rd trimesters: a statistical-based approach
In order to determine the optimal range of GWG and GWG rates in the 2nd and 3rd trimesters for our study, we analyzed the distribution of overall GWG and GWG rates specifically in the “No complications subgroup” and the “Complications subgroup” (Figure 2).
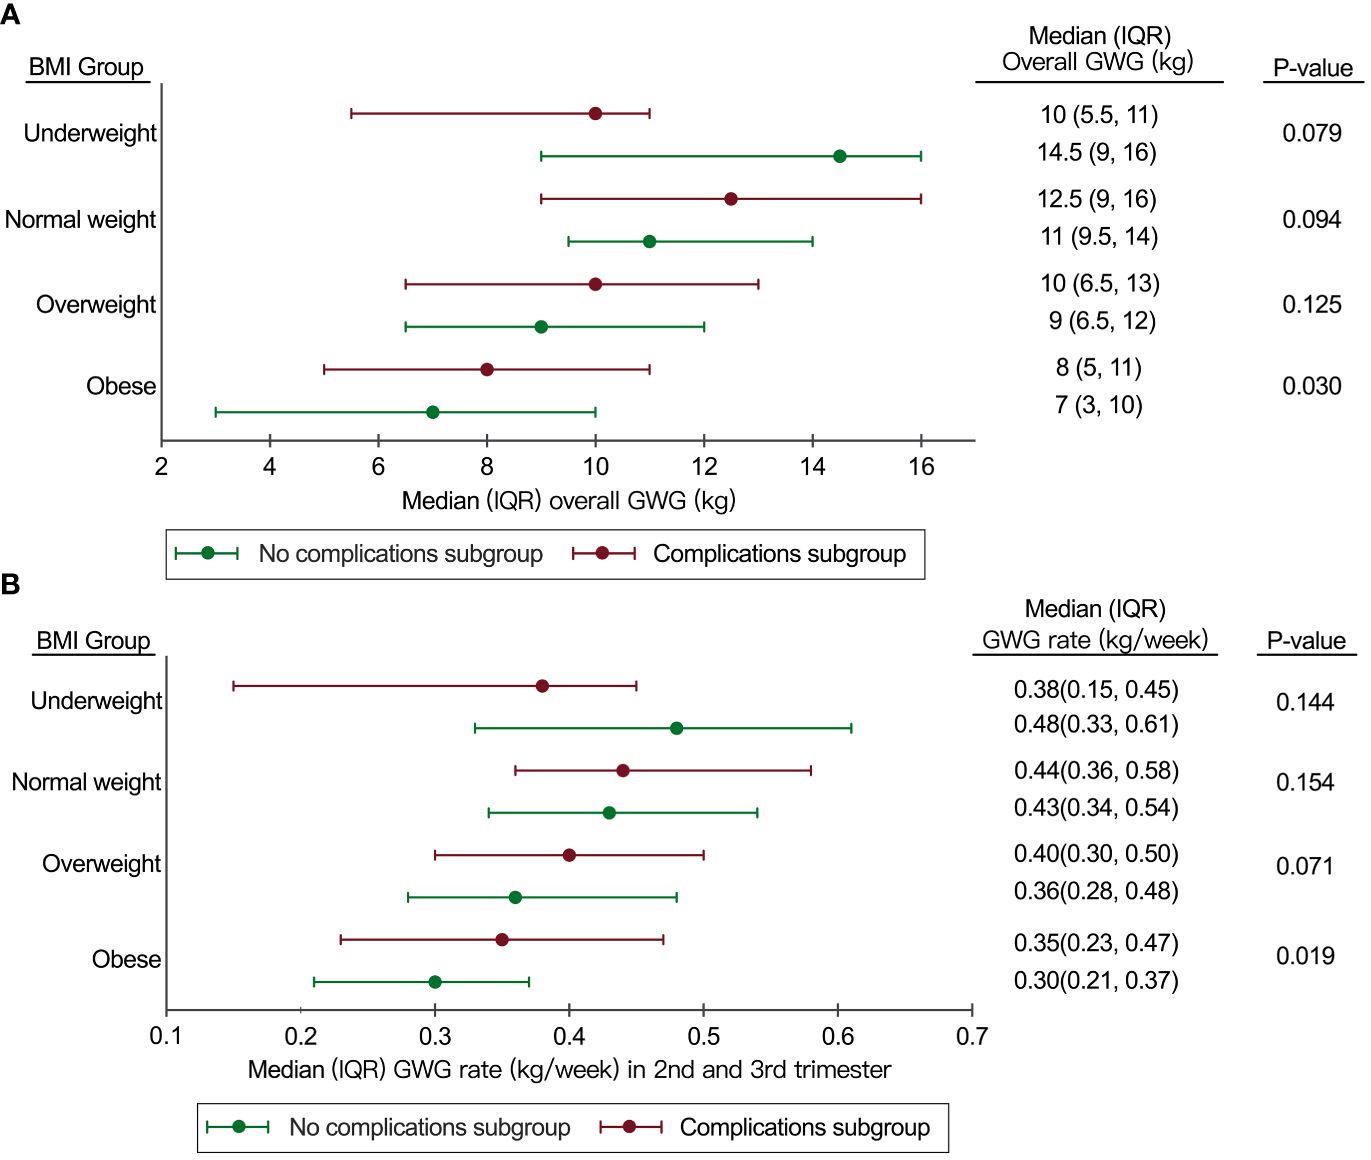
Figure 2 Distribution of overall GWG and GWG rate in 2nd and 3rd trimesters in the “No complications subgroup” and the “Complications subgroup”. (A) Distribution of overall GWG in the “No complications subgroup” and the “Complications subgroup”; (B) Distribution of GWG rate in the 2nd and 3rd trimesters in the “No complications subgroup” and the “Complications subgroup”. BMI, body mass index; GWG, gestational weight gain; IQR, interquartile range.
The IQR of GWG for the overweight group in this study was similar to the IOM recommendations (6.5-12kg in our study vs 7-11.5kg in the IOM recommendations), but the IQR of GWG for the underweight group (9-16kg in our study vs 12.5-18kg in the IOM recommendations) and the normal weight group (9.5-14kg in our study vs 11.5-16kg in the IOM recommendations) in our study was lower than the IOM recommendations (Figure 2A).
Compared to the IOM recommendations, the IQR of GWG rate in the 2nd and 3rd trimesters in the normal weight group was similar (0.34-0.54kg/week in our study vs 0.35-0.50kg/week in the IOM recommendations). However, the IQR of GWG rate in 2nd and 3rd trimesters for the overweight group (0.28-0.48kg/week in our study vs 0.23-0.33kg/week in the IOM recommendations) and the obese group (0.21-0.37 kg/week in our study vs 0.17-0.27 kg/week in the IOM recommendations) in our study was higher than the IOM recommendations (Figure 2B).
Association of GWG below or above recommendations in our study with adverse pregnancy outcomes
The underweight group was not analyzed because of the small sample size. There were 48.91% of women who gained inappropriate GWG compared to the optimal range of GWG in our study (22.00% below the optimal range and 26.91% above the optimal range, respectively).
In the overweight subgroup, GWG above the optimal range of GWG in our study was associated with increased risks of large for gestational age (OR 2.38; 95%CI 1.06-5.36), macrosomia (OR 2.48; 95%CI 1.03-5.96), and gestational hypertension (OR 2.73; 95%CI 1.07, 6.98), which was not observed when IOM recommendations were used to define excessive GWG. In the obese subgroup, GWG above the optimal range of GWG in our study was associated with increased risks of large for gestational age (OR 3.27; 95%CI 1.55-6.89), macrosomia (OR 3.30; 95%CI 1.45-7.55), cesarean section (OR 3.31; 95%CI 1.40-7.84), and preeclampsia (OR 4.12; 95%CI 1.58-10.75), but a decreased rate of vaginal delivery (OR 0.33, 95%CI 0.14-0.82), which was not observed when IOM recommendations were used to define excessive GWG (Table 3). In the normal weight subgroup, GWG above the optimal range of GWG in our study was associated with increased risks of macrosomia (OR 4.74; 95%CI 1.48-15.17) and neonatal respiratory distress syndrome (OR 7.18; 95%CI 1.24-41.61), which was not observed when IOM recommendations were used to define excessive GWG.
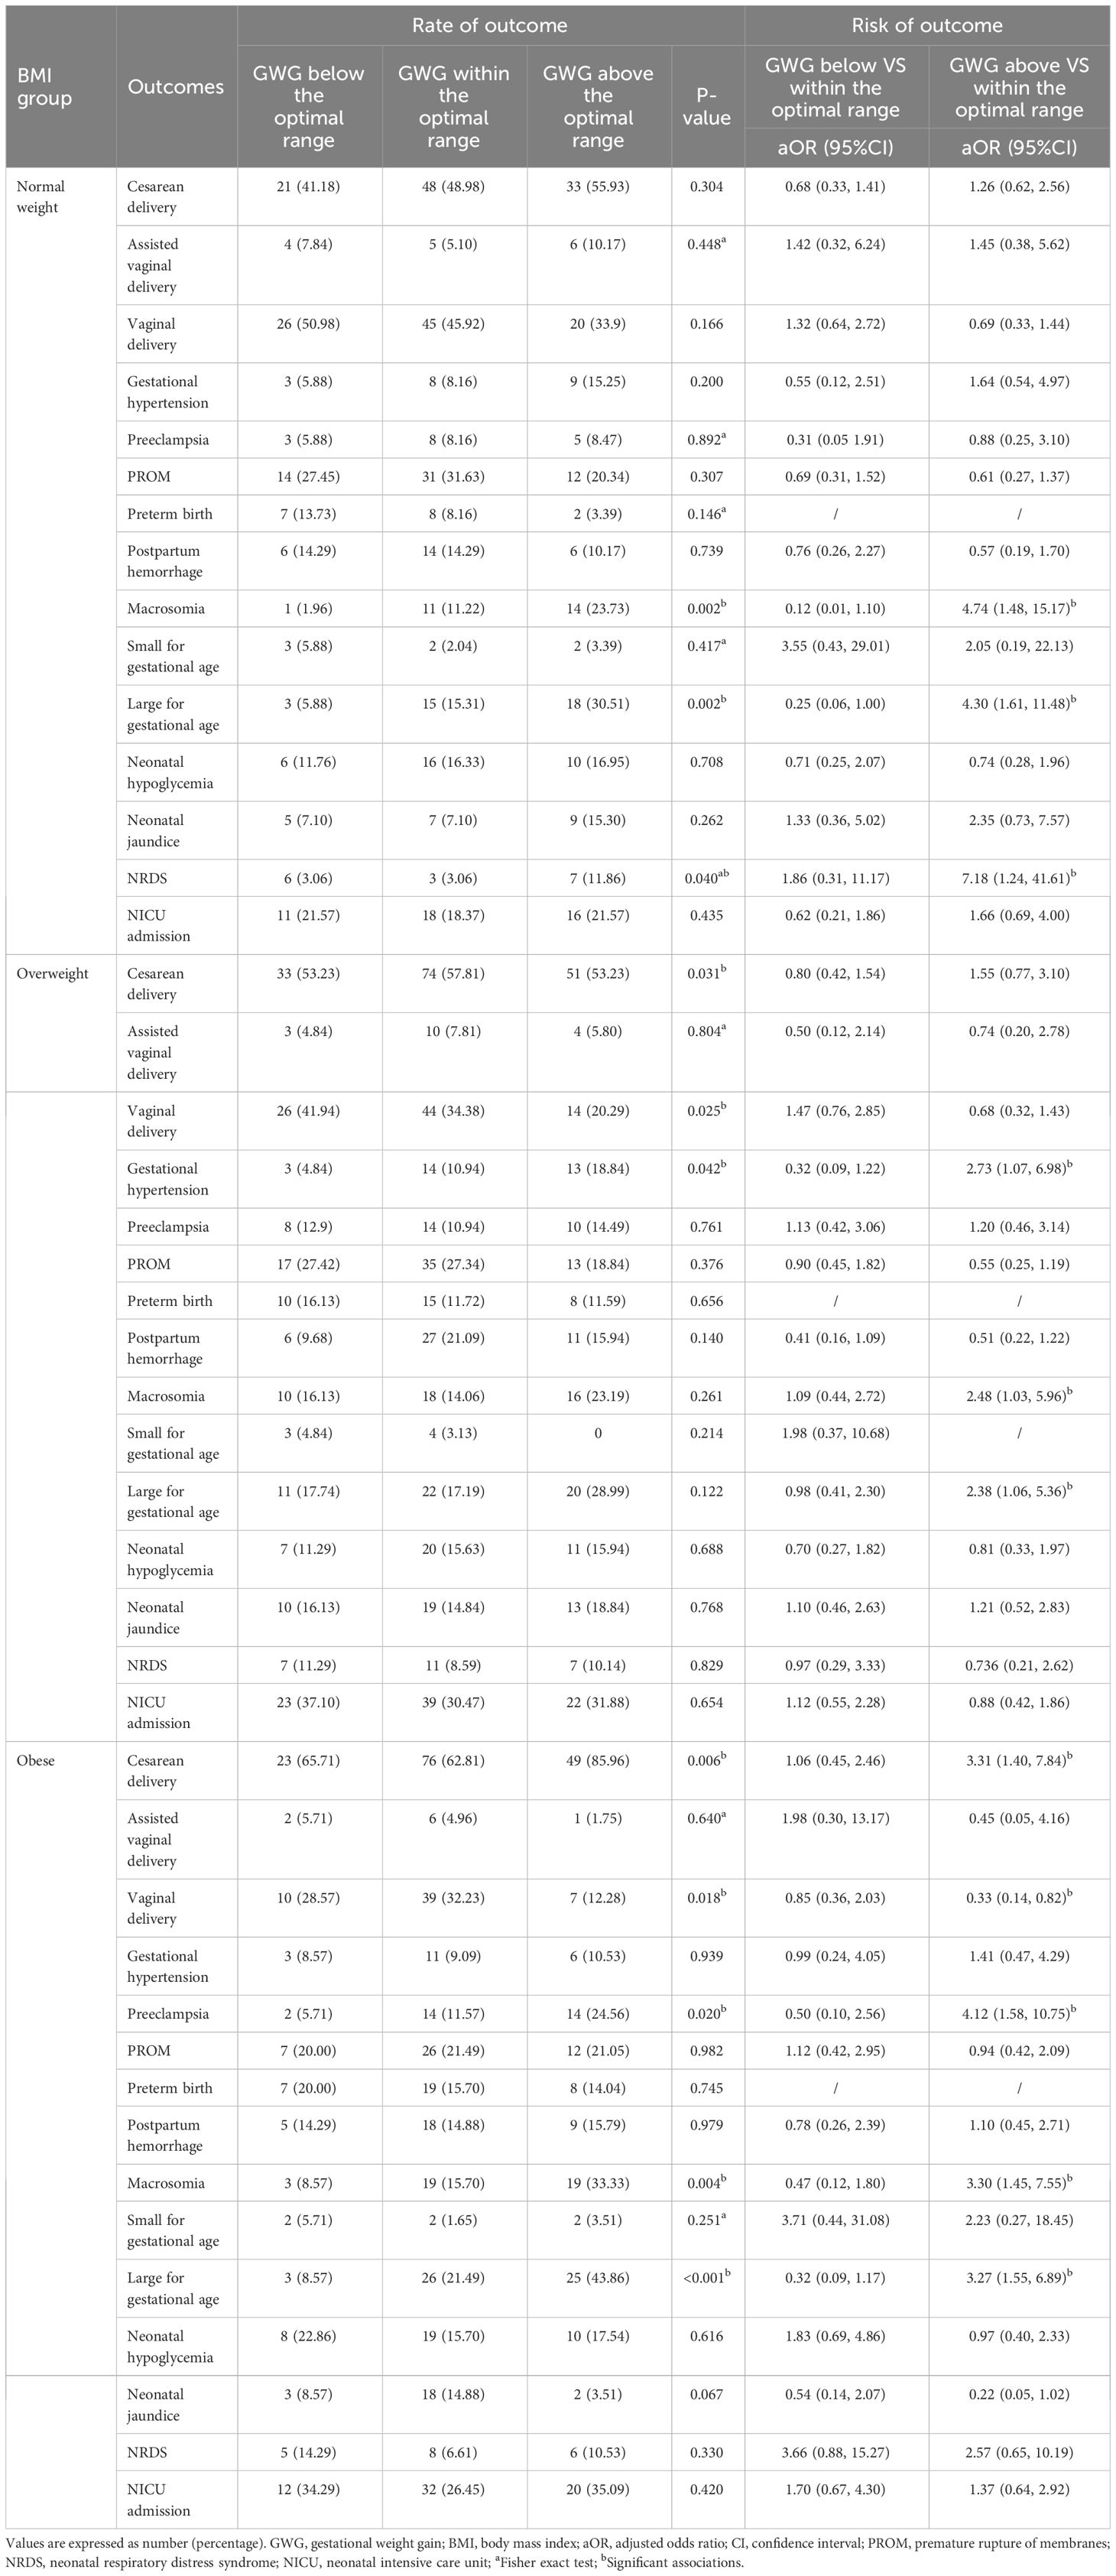
Table 3 Association of GWG below and above the optimal range in the current study with adverse pregnancy outcomes.
Discussion
In our study, more than half of the women with type 2 diabetes experienced inappropriate GWG compared to the 2009 IOM recommendations, which was consistent with previous research (23). We found that GWG below the IOM recommendations in women with type 2 diabetes was associated with lower risks of large for gestational age, macrosomia, and preeclampsia, which was consistent with prior studies (24, 25). Previous studies found that GWG above IOM recommendations increased the risk of neonatal hypoglycemia (26). However, we found GWG below the IOM recommendations was associated with lower risk of neonatal hypoglycemia. In the general population, GWG above IOM recommendations decreased the risk of small for gestational age (12). Nevertheless, in our study, excessive GWG in women with type 2 diabetes was not a protective factor for small for gestational age, which was consistent with previous studies (19, 24, 27).
It is worth noting that the optimal range of GWG for Chinese women with type 2 diabetes in our study is different from the IOM recommendations. In September 2022, the Chinese Center for Disease Control and Prevention released the standard of recommendation for weight gain during pregnancy based on data including more than 100 000 singleton pregnant Chinese women, in which the GWG recommendations for underweight (BMI, <18.5 kg/m (2)), normal weight (BMI, 18.5-24 kg/m2), overweight (BMI, 24-28 kg/m2) and obese women (BMI, ≥28 kg/m2) were 11-16kg, 8-14kg, 7-11 kg, and 5-9kg, respectively (28). The Chinese recommendations for underweight women and normal-weight women are lower than the IOM recommendations, which is roughly consistent with the results of this study. And a systematic review and meta-analysis evaluating GWG across continents and ethnicity indicated that IOM guidelines might not be suitable for Asian women (29). This partly explains why using the optimal range of GWG from our study to define excessive GWG seems to predict adverse pregnancy outcomes in Chinese women with type 2 diabetes better than the IOM recommendations.
GWG is a significant and modifiable risk factor for pregnancy outcomes in pregnant women with type 2 diabetes. The physiologic mechanisms that inappropriate gestational weight gain in women with type 2 diabetes might cause adverse pregnancy outcomes were under research, and there were plausible mechanisms, such as adverse effects of hyperglycemia, insulin resistance, and high pre-pregnancy BMI (30–33). However, the specific regulatory mechanisms between GWG in women with type 2 diabetes and adverse pregnancy outcomes need to be further studied. We determined an optimal range of GWG for women with type 2 diabetes in our study, however, whether this optimal range is suitable for Chinese women with type 2 diabetes still needs to be further confirmed by higher-quality, large-sample, and multi-center research. Determining the optimal GWG for women with type 2 diabetes is essential for avoiding adverse pregnancy outcomes (34).
Strengths and limitations
To our knowledge, this is the first research to evaluate the overall GWG and the GWG rate in the 2nd and 3rd trimesters in women with type 2 diabetes, and this study is also the first research to investigate the relationship between GWG according to the IOM recommendations and pregnancy outcomes in Chinese women with type 2 diabetes. We recognize that our study did not include variables such as diet and physical exercise, which represents a significant limitation in assessing the impacts of GWG in women with type 2 diabetes. Diet and physical exercise are known to critically influence weight gain and glycemic control during pregnancy. These factors could significantly modulate the relationship between GWG and pregnancy outcomes in women with type 2 diabetes. Therefore, the effects of diet and physical exercise on GWG during pregnancy in this specific population, as well as their interactions, warrant further in-depth research and exploration. Future studies should prioritize these variables to comprehensively understand the complex mechanisms by which GWG affects pregnancy outcomes. Additionally, while we have utilized a data span of 8 years, only 691 individuals met the criteria for our study. The limited sample size restricts the generalizability of our research findings. It is necessary to conduct multicenter, large-sample studies to validate the findings regarding gestational weight gain in this specific population.
Conclusion
Our study suggests that a large proportion of Chinese women with type 2 diabetes experienced inappropriate GWG and it is associated with adverse pregnancy outcomes. For Chinese women with type 2 diabetes, the optimal range of GWG might be different from IOM recommendations. Further studies are needed to validate the findings regarding gestational weight gain in this specific population.
Data availability statement
The original contributions presented in the study are included in the article/Supplementary Materials, further inquiries can be directed to the corresponding author/s.
Ethics statement
The studies involving humans were approved by the ethics committee of Beijing Obstetrics and Gynecology Hospital, Capital Medical University (2018-ky-009-01). The studies were conducted in accordance with the local legislation and institutional requirements. The participants provided their written informed consent to participate in this study.
Author contributions
XY: Conceptualization, Formal analysis, Investigation, Software, Writing – original draft. JJ: Conceptualization, Formal analysis, Investigation, Software, Writing – original draft. WZ: Methodology, Writing – review & editing. XXY: Methodology, Writing – review & editing. JW: Data curation, Writing – review & editing. LZ: Data curation, Writing – review & editing. GL: Funding acquisition, Investigation, Project administration, Supervision, Writing – review & editing.
Funding
The author(s) declare financial support was received for the research, authorship, and/or publication of this article. This work was supported by Beijing Hospitals Authority’ Ascent Plan (DFL20191402) and High-level construction project of public health technical personnel in Beijing Municipal Health System (No. Lingjunrencai-02-02).
Acknowledgments
We would like to express our gratitude to all the staff members who worked diligently during the cohort follow-up. We also extend our heartfelt appreciation to all the patients and their families for their participation and cooperation in this study.
Conflict of interest
The authors declare that the research was conducted in the absence of any commercial or financial relationships that could be construed as a potential conflict of interest.
Publisher’s note
All claims expressed in this article are solely those of the authors and do not necessarily represent those of their affiliated organizations, or those of the publisher, the editors and the reviewers. Any product that may be evaluated in this article, or claim that may be made by its manufacturer, is not guaranteed or endorsed by the publisher.
Supplementary material
The Supplementary Material for this article can be found online at: https://www.frontiersin.org/articles/10.3389/fendo.2024.1348382/full#supplementary-material
Supplementary File 1 | STROBE Statement—checklist of items that should be included in reports of observational studies.
References
1. Alexopoulos AS, Blair R, Peters AL. Management of preexisting diabetes in pregnancy: A review. Jama. (2019) 321:1811–9. doi: 10.1001/jama.2019.4981
2. Mackin ST, Nelson SM, Kerssens JJ, Wood R, Wild S, Colhoun HM, et al. Diabetes and pregnancy: national trends over a 15 year period. Diabetologia. (2018) 61:1081–8. doi: 10.1007/s00125-017-4529-3
3. Fadl HE, Simmons D. Trends in diabetes in pregnancy in Sweden 1998–2012. BMJ Open Diabetes Res Care. (2016) 4:e000221. doi: 10.1136/bmjdrc-2016-000221
4. Wei Y, Xu Q, Yang H, Yang Y, Wang L, Chen H, et al. Preconception diabetes mellitus and adverse pregnancy outcomes in over 6.4 million women: A population-based cohort study in China. PloS Med. (2019) 16:e1002926. doi: 10.1371/journal.pmed.1002926
5. Klingensmith GJ, Pyle L, Nadeau KJ, Barbour LA, Goland RS, Willi SM, et al. Pregnancy outcomes in youth with type 2 diabetes: the TODAY study experience. Diabetes Care. (2016) 39:122–9. doi: 10.2337/dc15-1206
6. Deputy NP, Kim SY, Conrey EJ, Bullard KM. Prevalence and changes in preexisting diabetes and gestational diabetes among women who had a live birth - United States, 2012-2016. MMWR Morb Mortal Wkly Rep. (2018) 67:1201–7. doi: 10.15585/mmwr.mm6743a2
7. Clausen TD, Mathiesen E, Ekbom P, Hellmuth E, Mandrup-Poulsen T, Damm P. Poor pregnancy outcome in women with type 2 diabetes. Diabetes Care. (2005) 28:323–8. doi: 10.2337/diacare.28.2.323
8. Murphy HR, Howgate C, O'Keefe J, Myers J, Morgan M, Coleman MA, et al. Characteristics and outcomes of pregnant women with type 1 or type 2 diabetes: a 5-year national population-based cohort study. Lancet Diabetes Endocrinol. (2021) 9:153–64. doi: 10.1016/S2213-8587(20)30406-X
9. Dabelea D, Hanson RL, Lindsay RS, Pettitt DJ, Imperatore G, Gabir MM, et al. Intrauterine exposure to diabetes conveys risks for type 2 diabetes and obesity: a study of discordant sibships. Diabetes. (2000) 49:2208–11. doi: 10.2337/diabetes.49.12.2208
10. Champion ML, Harper LM. Gestational weight gain: update on outcomes and interventions. Curr Diabetes Rep. (2020) 20:11. doi: 10.1007/s11892-020-1296-1
11. Kominiarek MA, Peaceman AM. Gestational weight gain. Am J Obstet Gynecol. (2017) 217:642–51. doi: 10.1016/j.ajog.2017.05.040
12. Goldstein R, Abell S, Ranasinha S, Misso M, Boyle J, Black M, et al. Association of gestational weight gain with maternal and infant outcomes: A systematic review and meta-analysis. JAMA. (2017) 317:2207–25. doi: 10.1001/jama.2017.3635
13. Voerman E, Santos S, Inskip H, Amiano P, Barros H, Charles MA, et al. Association of gestational weight gain with adverse maternal and infant outcomes. Jama. (2019) 321:1702–15. doi: 10.1001/jama.2019.3820
14. WHO. Obesity and overweight. Available online at: https://www.who.int/news-room/fact-sheets/detail/obesity-and-overweight (Accessed 1 March).
15. Kalliala I, Markozannes G, Gunter MJ, Paraskevaidis E, Gabra H, Mitra A, et al. Obesity and gynecological and obstetric conditions: umbrella review of the literature. Bmj. (2017) 359:j4511. doi: 10.1136/bmj.j4511
16. Aune D, Saugstad OD, Henriksen T, Tonstad S. Maternal body mass index and the risk of fetal death, stillbirth, and infant death: a systematic review and meta-analysis. Jama. (2014) 311:1536–46. doi: 10.1001/jama.2014.2269
17. Institute of, M.; National Research Council Committee to Reexamine, I. O. M. P. W. G. The national academies collection: reports funded by National Institutes of Health. In: Rasmussen KM, Yaktine AL, editors. Weight Gain During Pregnancy: Reexamining the Guidelines. National Academies Press (US) Copyright © 2009, National Academy of Sciences, Washington (DC (2009).
18. Deputy NP, Sharma AJ, Kim SY, Hinkle SN. Prevalence and characteristics associated with gestational weight gain adequacy. Obstet Gynecol. (2015) 125:773–81. doi: 10.1097/AOG.0000000000000739
19. Yee LM, Cheng YW, Inturrisi M, Caughey AB. Effect of gestational weight gain on perinatal outcomes in women with type 2 diabetes mellitus using the 2009 Institute of Medicine guidelines. Am J Obstet Gynecol. (2011) 205:257.e1–6. doi: 10.1016/j.ajog.2011.06.028
20. Classification and Diagnosis of Diabetes. Standards of medical care in diabetes-2021. Diabetes Care. (2021) 44:S15–s33. doi: 10.2337/dc21-S002
21. Hod M, Kapur A, Sacks DA, Hadar E, Agarwal M, Di Renzo GC, et al. The International Federation of Gynecology and Obstetrics (FIGO) Initiative on gestational diabetes mellitus: A pragmatic guide for diagnosis, management, and care. Int J Gynaecol Obstet. (2015) 131 Suppl 3:S173–211. doi: 10.1016/S0020-7292(15)30007-2
22. Villar J, Cheikh Ismail L, Victora CG, Ohuma EO, Bertino E, Altman DG, et al. International standards for newborn weight, length, and head circumference by gestational age and sex: the Newborn Cross-Sectional Study of the INTERGROWTH-21st Project. Lancet. (2014) 384:857–68. doi: 10.1016/S0140-6736(14)60932-6
23. Fu J, Tomlinson G, Feig DS. Gestational weight gain in women with type 2 diabetes and perinatal outcomes: A secondary analysis of the metformin in women with type 2 diabetes in pregnancy (MiTy) trial. Diabetes Res Clin Pract. (2022) 186:109811. doi: 10.1016/j.diabres.2022.109811
24. Xie X, Liu J, García-Patterson A, Chico A, Mateu-Salat M, Amigó J, et al. Gestational weight gain and pregnancy outcomes in women with type 1 and type 2 diabetes mellitus. Acta Diabetol. (2023) 60(5):621–9. doi: 10.21203/rs.3.rs-3046015/v1
25. Kurnit KC, Overcash RT, Ramos GA, LaCoursiere DY. The impact of inadequate gestational weight gain in obese diabetic women. J Perinatol. (2016) 36:86–9. doi: 10.1038/jp.2015.155
26. Kominiarek MA, Saade G, Mele L, Bailit J, Reddy UM, Wapner RJ, et al. Association between gestational weight gain and perinatal outcomes. Obstet Gynecol. (2018) 132:875–81. doi: 10.1097/AOG.0000000000002854
27. Siegel AM, Tita A, Biggio JR, Harper LM. Evaluating gestational weight gain recommendations in pregestational diabetes. Am J Obstet Gynecol. (2015) 213:563.e1–5. doi: 10.1016/j.ajog.2015.07.030
28. CNS, C. Standard of recommendation for weight gain during pregnancy period. Available online at: https://www.Chinanutri.cn/fgbz/fgbzhybz/202210/t20221014_261594.html (Accessed 1 March).
29. Goldstein RF, Abell SK, Ranasinha S, Misso ML, Boyle JA, Harrison CL, et al. Gestational weight gain across continents and ethnicity: systematic review and meta-analysis of maternal and infant outcomes in more than one million women. BMC Med. (2018) 16:153. doi: 10.1186/s12916-018-1128-1
30. Yogev, Chen, Hod, Coustan, Oats, McIntyre, et al. Hyperglycemia and Adverse Pregnancy Outcome (HAPO) study: preeclampsia. Am J Obstet Gynecol. (2010) 202:255.e1–7. doi: 10.1016/j.ajog.2010.01.024
31. Hauth JC, Clifton RG, Roberts JM, Myatt L, Spong CY, Leveno KJ, et al. Maternal insulin resistance and preeclampsia. Am J Obstet Gynecol. (2011) 204:327.e1–6. doi: 10.1016/j.ajog.2011.02.024
32. Bartsch E, Medcalf KE, Park AL, Ray JG. Clinical risk factors for pre-eclampsia determined in early pregnancy: systematic review and meta-analysis of large cohort studies. Bmj. (2016) 353:i1753. doi: 10.1136/bmj.i1753
33. Durst JK, Tuuli MG, Stout MJ, Macones GA, Cahill AG. Degree of obesity at delivery and risk of preeclampsia with severe features. Am J Obstet Gynecol. (2016) 214:651.e1–5. doi: 10.1016/j.ajog.2015.11.024
Keywords: diabetes mellitus, type 2, gestational weight gain, large for gestational age, pregnancy outcomes, diabetes
Citation: Yan X, Jia J, Zheng W, Yuan X, Wang J, Zhang L and Li G (2024) Gestational weight gain and pregnancy outcomes in Chinese women with type 2 diabetes mellitus: evidence from a tertiary hospital in Beijing. Front. Endocrinol. 15:1348382. doi: 10.3389/fendo.2024.1348382
Received: 12 December 2023; Accepted: 25 March 2024;
Published: 02 April 2024.
Edited by:
Christian Göbl, Medical University of Vienna, AustriaReviewed by:
Gitismita Naik, Kalyani (AIIMS Kalyani), IndiaDaniela Lopes Gomes, Federal University of Pará, Brazil
Copyright © 2024 Yan, Jia, Zheng, Yuan, Wang, Zhang and Li. This is an open-access article distributed under the terms of the Creative Commons Attribution License (CC BY). The use, distribution or reproduction in other forums is permitted, provided the original author(s) and the copyright owner(s) are credited and that the original publication in this journal is cited, in accordance with accepted academic practice. No use, distribution or reproduction is permitted which does not comply with these terms.
*Correspondence: Guanghui Li, bGlndWFuZ2h1aUBjY211LmVkdS5jbg==
†These authors have contributed equally to this work and share first authorship
‡ORCID: Guanghui Li, orcid.org/0000-0003-2290-1515