 Sarah Hazell Pickering
 Mohamed Abdelhalim
 Philippe Collas
 Nolwenn Briand
- 1Department of Molecular Medicine, Institute of Basic Medical Sciences, Faculty of Medicine, University of Oslo, Oslo, Norway
- 2Department of Immunology and Transfusion Medicine, Oslo University Hospital, Oslo, Norway
Background: The beneficial effect of thermogenic adipocytes in maintaining body weight and protecting against metabolic disorders has raised interest in understanding the regulatory mechanisms defining white and beige adipocyte identity. Although alternative splicing has been shown to propagate adipose browning signals in mice, this has yet to be thoroughly investigated in human adipocytes.
Methods: We performed parallel white and beige adipogenic differentiation using primary adipose stem cells from 6 unrelated healthy subjects and assessed differential gene and isoform expression in mature adipocytes by RNA sequencing.
Results: We find 777 exon junctions with robust differential usage between white and beige adipocytes in all 6 subjects, mapping to 562 genes. Importantly, only 10% of these differentially spliced genes are also differentially expressed, indicating that alternative splicing constitutes an additional layer of gene expression regulation during beige adipocyte differentiation. Functional classification of alternative isoforms points to a gain of function for key thermogenic transcription factors such as PPARG and CITED1, and enzymes such as PEMT, or LPIN1. We find that a large majority of the splice variants arise from differential TSS usage, with beige-specific TSSs being enriched for PPARγ and MED1 binding compared to white-specific TSSs. Finally, we validate beige specific isoform expression at the protein level for two thermogenic regulators, PPARγ and PEMT.
Discussion: These results suggest that differential isoform expression through alternative TSS usage is an important regulatory mechanism for human adipocyte thermogenic specification.
1 Introduction
Adipose tissue has become a major research focus because of its capacity to store energy in the form of lipids in white adipocytes and dissipate energy by heat in brown and beige (thermogenic) adipocytes. Thermogenic adipose tissue is found in human adults (1–3) as brown and beige depots in posterior regions of the neck, thorax and abdomen, and as beige adipocytes interspersed within white fat depots (4, 5). White adipocytes, which make up the majority of adipocytes in white fat depots, store energy in the form of lipids, while brown and beige adipocytes can dissipate energy as heat by uncoupling mitochondrial respiration from ATP production, or by activating other ATP-consuming futile cycles (6–8). Beige adipocytes arise in white depots by differentiation of progenitors and by conversion from a white phenotype in response to cold, or to PPARγ-agonist treatment. Thermogenic adipocyte activity correlates with increased insulin sensitivity and decreased incidence of obesity and type-2 diabetes in humans (9), thus elucidating the regulatory mechanisms defining white vs beige adipocyte specification may provide new targets for treating metabolic diseases.
Alternative splicing increases transcriptome and proteome diversity by modulating the combination of exons expressed from a single gene, thereby regulating diverse processes such as cell differentiation and signal transduction (10). Whole or parts of exons may be substituted by selection of the 5’ or 3’ splice sites by the key components of the spliceosome, or by accessory splicing factors which recognize weak signals in the surrounding RNA sequence (11). Alternative splicing events are classified into several types: exon skipping, mutually exclusive exons, intron retention and alternative 5’ and 3’ splice site usage (12). Sometimes included in this list are alternative first exons, which can be generated by alternative promoters or transcription start sites (TSS) (13, 14). Differences in alternative splicing between conditions can be assessed in short read RNA-seq by algorithms inferring differential splicing by assigning reads to isoforms found in a transcriptome, or by directly detecting exon-exon junctions (15, 16). Alternative splicing may influence protein function, localization or degradation, and the 5’ and 3’ untranslated regions of mRNAs also affect their secondary structure, export and translation efficiency (17). Thus, assigning functionality to the products of alternative splicing is still challenging. However, recent developments such as the establishment of protein isoform annotation databases and associated scoring tools now provide insights into variant functionality (18–21).
Alternative splicing has emerged as a key mechanism regulating white and thermogenic adipogenesis. Splice variants in nuclear corepressors and nuclear transcription factors have been shown to directly regulate adipogenesis (22, 23). In addition, perturbation of splicing factors in mice affects thermogenesis in brown (24, 25) and white adipose depots (26, 27). Recent evidence has suggested a potential role for splicing in the browning process of human adipocytes (28). Indeed, transcriptomic analysis of adipose tissue from patients with pheochromocytoma tumors revealed a global downregulation of splicing factors’ expression, a trend confirmed in cold-exposed mouse inguinal adipose tissue (28). However, the isoform specific gene expression program characterizing thermogenic adipocytes has not been comprehensively investigated.
Here, we analyze differential gene and transcript expression in white and beige adipocytes differentiated from 6 human primary adipose stem cell (ASC) lines. We unveil a high-confidence set of differentially spliced genes, including in key thermogenic regulators for which we validate beige-specific isoform expression at the protein level. Our results suggest that the regulation of isoform-specific expression is an important regulatory mechanism for the thermogenic function of human adipocytes.
2 Materials and methods
2.1 Cell culture
Primary ASCs were isolated from subcutaneous fat obtained by liposuction from six unrelated female donors (Supplementary Table 1) after informed consent (approval by the Regional Committee for Research Ethics for Southern Norway, REK 2013/2102 and 2018-660). ASCs were cultured in DMEM/F12 (17.5 mM glucose) with 10% fetal calf serum and 20 ng/ml basic fibroblast growth factor (proliferation medium). Upon confluency, fibroblast growth factor was removed, and cells cultured for 72 h in DMEM/F12 (17.5 mM glucose) with 10% fetal calf serum (basal medium) before induction of differentiation. For white adipose differentiation, ASCs were induced with a cocktail of 0.5 µM 1-methyl-3 isobutyl xanthine, 1 µM dexamethasone, 10 µg/ml insulin and 200 µM indomethacin in basal medium. Differentiation media was renewed every 3 days until day 9, after which cells were maintained in DMEM/F12 (17.5 mM glucose) with 10% fetal calf serum and 10 µg/ml insulin. For beige adipose differentiation, media were supplemented with 1 µM Rosiglitazone (Sigma, R2408) until day 15. Samples were harvested 15 days after induction. All differentiation experiments were done in at least three biological replicates between passage 3 and 8.
2.2 Microscopy and image analysis
Cells were differentiated for 15 days on 12-mm diameter coverslips in 24-well plates. Cells were washed 3 times with PBS before fixation in 4% paraformaldehyde for 10 min. Cells were then incubated in Bodipy (1µg/ml, Invitrogen D3922) for 15 min and washed 3 times in PBS before mounting in DAKO Fluorescence Mounting Medium (S3023, Agilent). Images were acquired on an IX81 microscope (Olympus) fitted with epifluorescence, an 100× 1.4 NA objective mounted on a piezo drive, and a DeltaVision personalDV (Applied Precision, Ltd.) imaging station. The Bodipy surface per field was quantified on threshold-adjusted images using ImageJ software.
2.3 Immunoblotting
Proteins were resolved by gradient 4-20% SDS–PAGE, transferred onto nitrocellulose membranes (BioRad) and blocked with 5% BSA. Membranes were incubated for 1h at room temperature or overnight at 4°C using the following antibodies: Perilipin1 (Progen, GP29), CITED1 (Novus, H00004435-M03), UCP1 (Abcam, 23841), PPARγ (Thermofisher, MA5-14889), PEMT (Novus, NBP1-59580), and γTubulin (Sigma, T5326). Proteins were visualized using IRDye-800-, IRDye-680-, or HRP-coupled secondary antibodies. Bands were quantified by densitometry (Image Lab; BioRad) using γTubulin for normalization. Uncropped membranes are presented as Supplementary Data 1-4.
2.4 RNA-sequencing and gene expression analysis
RNA sequencing (RNA-seq) was done in biological triplicates for 6 independent donors. Total RNA was isolated from samples harvested at differentiation endpoint (day 15) using the RNeasy kit (QIAGEN). PolyA-selected RNA was sequenced from paired-end libraries (TruSeq Stranded mRNA kit; Illumina) using Novaseq platform (Illumina). Reads were filtered with fastp, aligned to the hg38 genome (GENCODE 32 annotation) with hisat2, and counted using featureCounts (Supplementary Table 2). Low abundance genes were filtered using filterByExpr from edgeR and then normalized using the trimmed mean of M values method (29). Beige and white gene expression was compared pairwise for each donor using the robust eBayes method with limma-voom adjustment (30). Less than 100 genes changed according to the fraction of reads assigned to genes (adjusted p-value < 0.01), when this was included as a continuous variable in the model.
2.5 RT-qPCR and semi-quantitative PCR
RNA was isolated using RNeasy kit (QIAGEN) and 1 µg was used for cDNA synthesis using High-Capacity cDNA Reverse Transcription Kit (ThermoFisher). RT-PCR was done using IQ SYBR green (Bio-Rad Laboratories) with SF3A1 as a reference gene. PCR conditions were 95°C for 3 min and 40 cycles of 95°C for 30 s, 60°C for 30 s, and 72°C for 20 s. PCR primers are listed in Supplementary Table 3.
2.6 Alternative splicing analysis
Reads were aligned to the hg38 genome with STAR using the GENCODE 32 reference annotation. ENCODE options from the STAR manual were used as well as –outSAMstrandField intronMotif –outSAMtype BAM Unsorted (Supplementary Table 2). Split reads with at least 6 bp of anchor sequence and an intron length between 20 bp and 1 Mb were extracted using regtools (31). Introns sharing splice sites were clustered using LeafCutter’s leafcutter_cluster_regtools.py script, requiring at least 30 reads per library supporting each cluster for introns of up to 1 Mb in size.
Differences in intron excision were tested between white and beige triplicates with donor as a confounding variable. Strict prefiltering required that an intron was found in at least 14 (of 36) libraries and that clusters had at least 12 libraries per condition with 20 or more spliced reads. The differential_splicing function from LeafCutter R package version 0.2.9 was used to implement the Dirichlet-multinomial generalized linear model (15). LeafCutter assigns a ΔPSI to each intron and a p-value to each cluster, which contains introns that share splice sites and thus belong to alternative isoforms of that gene or genes. Effect size and cluster significance output files were merged into a single table containing both ΔPSI and cluster p-value (Supplementary Table 4). LeafCutter p-values are adjusted by FDR.
2.7 Annotation of introns
Introns were assigned to transcripts, with the priority for annotations: GENCODE 32 > RefSeq GCF_000001405.40-RS_2023_10 > FANTOM CAT robust (32). In other words, only if an intron was missing from the GENCODE annotation was it compared to the RefSeq annotation and so on. Normalized TRIFID prediction scores were downloaded for the GENCODE 37 and RefSeq110 annotations. Where multiple transcripts were possible for a single intron excision event, TRIFID scores were averaged, but if no score was found -0.1 was used. To calculate a TRIFID difference, the top two intron-excision events were compared for clusters with at least one significant junction (| ΔPSI | > 0.1 & p.adjust < 0.05) (Supplementary Table 5).
For ChIP-Seq profiles at TSSs, for each significant exon-exon junction, the most upstream annotated TSS was selected to avoid oversampling of junctions. For Unibind differential enrichment (beige vs white) at TSSs, overlapping -2 kb/+0.5 kb windows were merged.
2.8 Chromatin immunoprecipitation-seq
Day 15 differentiated white and beige samples were trypsinized, resuspended in HBSS, 0.5% BSA, and centrifuged 200g for 5 min to isolate floating mature adipocytes. Purified nuclei were fixed with 1% formaldehyde; lysed for 10 min in ChIP lysis buffer (1% SDS, 10 mM EDTA, 50 mM Tris-HCl, pH 8.0, proteinase inhibitors, 1 mM PMSF, 20 mM Na Butyrate) and sonicated for 30 sec ON/OFF for 10 min in a Bioruptor®Pico (Diagenode) into ~200 base-pair fragments. After sedimentation, the supernatant was diluted 10 times and chromatin incubated with anti-H3K27ac (Diagenode c15410174), anti-H3K4me3 (Diagenode c15410003), anti-H3K27me3 (Diagenode c15410069) or anti-H3K4me1 (Diagenode c15410037) antibodies, each at 2.5 μg/106 cells, for 2 h at 4°C. ChIP samples were washed, cross-links reversed, and DNA eluted for 2 h at 68°C. DNA was purified using phenol-chloroform isoamylalcohol and dissolved in H2O. Libraries were prepared using a Microplex kit (Diagenode) and sequenced on a NextSeq 500 or NovaSeq (Illumina).
ChIP-Seq reads for histone modifications were filtered with fastp, aligned to the genome with bowtie2, and deduplicated (Supplementary Table 2). Log ratio ChIP/Input tracks were generated using deepTools bigwigCompare from reads per genome coverage (RPGC) normalized tracks, created with bamCoverage. Profile plots were generated using deeptools computeMatrix and plotProfile.
PPARγ and MED1 ChIP-Seq were downloaded from Gene Expression Omnibus (GEO) accession GSE59703 (33). Reads from replicates were merged and aligned to hg38 using Bowtie2 (Supplementary Table 2). Peaks were detected using MACS3. ChIP/Input ratio tracks were generated using bamCompare in deepTools. PPARγ and MED1 ChIP/Input mean ratios were calculated for +/- 250 bp windows around the TSS using multiBigwigSummary from deepTools.
2.9 Alphafold predictions
Energy minimized structures of PEMT isoforms were predicted using Alphafold via ColabFold (34). Molecular graphics and analyses performed with UCSF ChimeraX (35).
2.10 Statistical analysis
Fisher’s exact test, implemented in ClusterProfiler (36), was used for overrepresentation analysis of genes in ontologies and pathways from MSigDb v2023.1 (37). For bioinformatic analyses, two-way ANOVA were conducted in R, followed by pairwise t-tests or Wilcoxon tests with Holmberg adjustment for multiple comparisons.
3 Results
3.1 ASC-derived adipocytes have differential beiging capacity
To characterize the alternative splicing events that may specify the beige thermogenic phenotype of human adipocytes, we differentiated primary ASCs from 6 unrelated, normal-weight female subjects (S1-S6) into beige or white adipocytes, in the presence or absence of rosiglitazone, respectively. After 15 days, differentiation efficiency is similar in all 6 ASC line-derived adipocytes, based on lipid droplet accumulation (Figures 1A, B) and Perilipin1 expression (Figures 1C, D, Supplementary Figure 1). As expected, rosiglitazone treatment elicits the expression of the beige adipocyte markers CITED1 and UCP1 in all donors (Figure 1C), albeit to a different extent, confirming that efficient beige adipogenesis is achieved with all 6 ASC lines. Accordingly, transcriptome analysis shows that differentially expressed genes (DEGs) in beige vs white adipocytes from all subjects are significantly enriched for Gene Ontology (GO) terms “Mitochondrial matrix” (GO:0005759), “Monocarboxylic acid metabolic process” (GO:0032787) and “Fatty acid metabolic process” (GO:0006631) (Figure 1E, Supplementary Table 4). Further analysis of the thermogenic gene expression signature using BATLAS beige-curated gene list (38) clearly segregates white from beige differentiated adipocytes (Figure 1F), with the median expression of BATLAS beige markers being significantly increased in beige adipocytes (Figure 1G). Hence, PPARγ agonist treatment efficiently elicits a beige adipocyte transcriptional program in all 6 ASC lines.
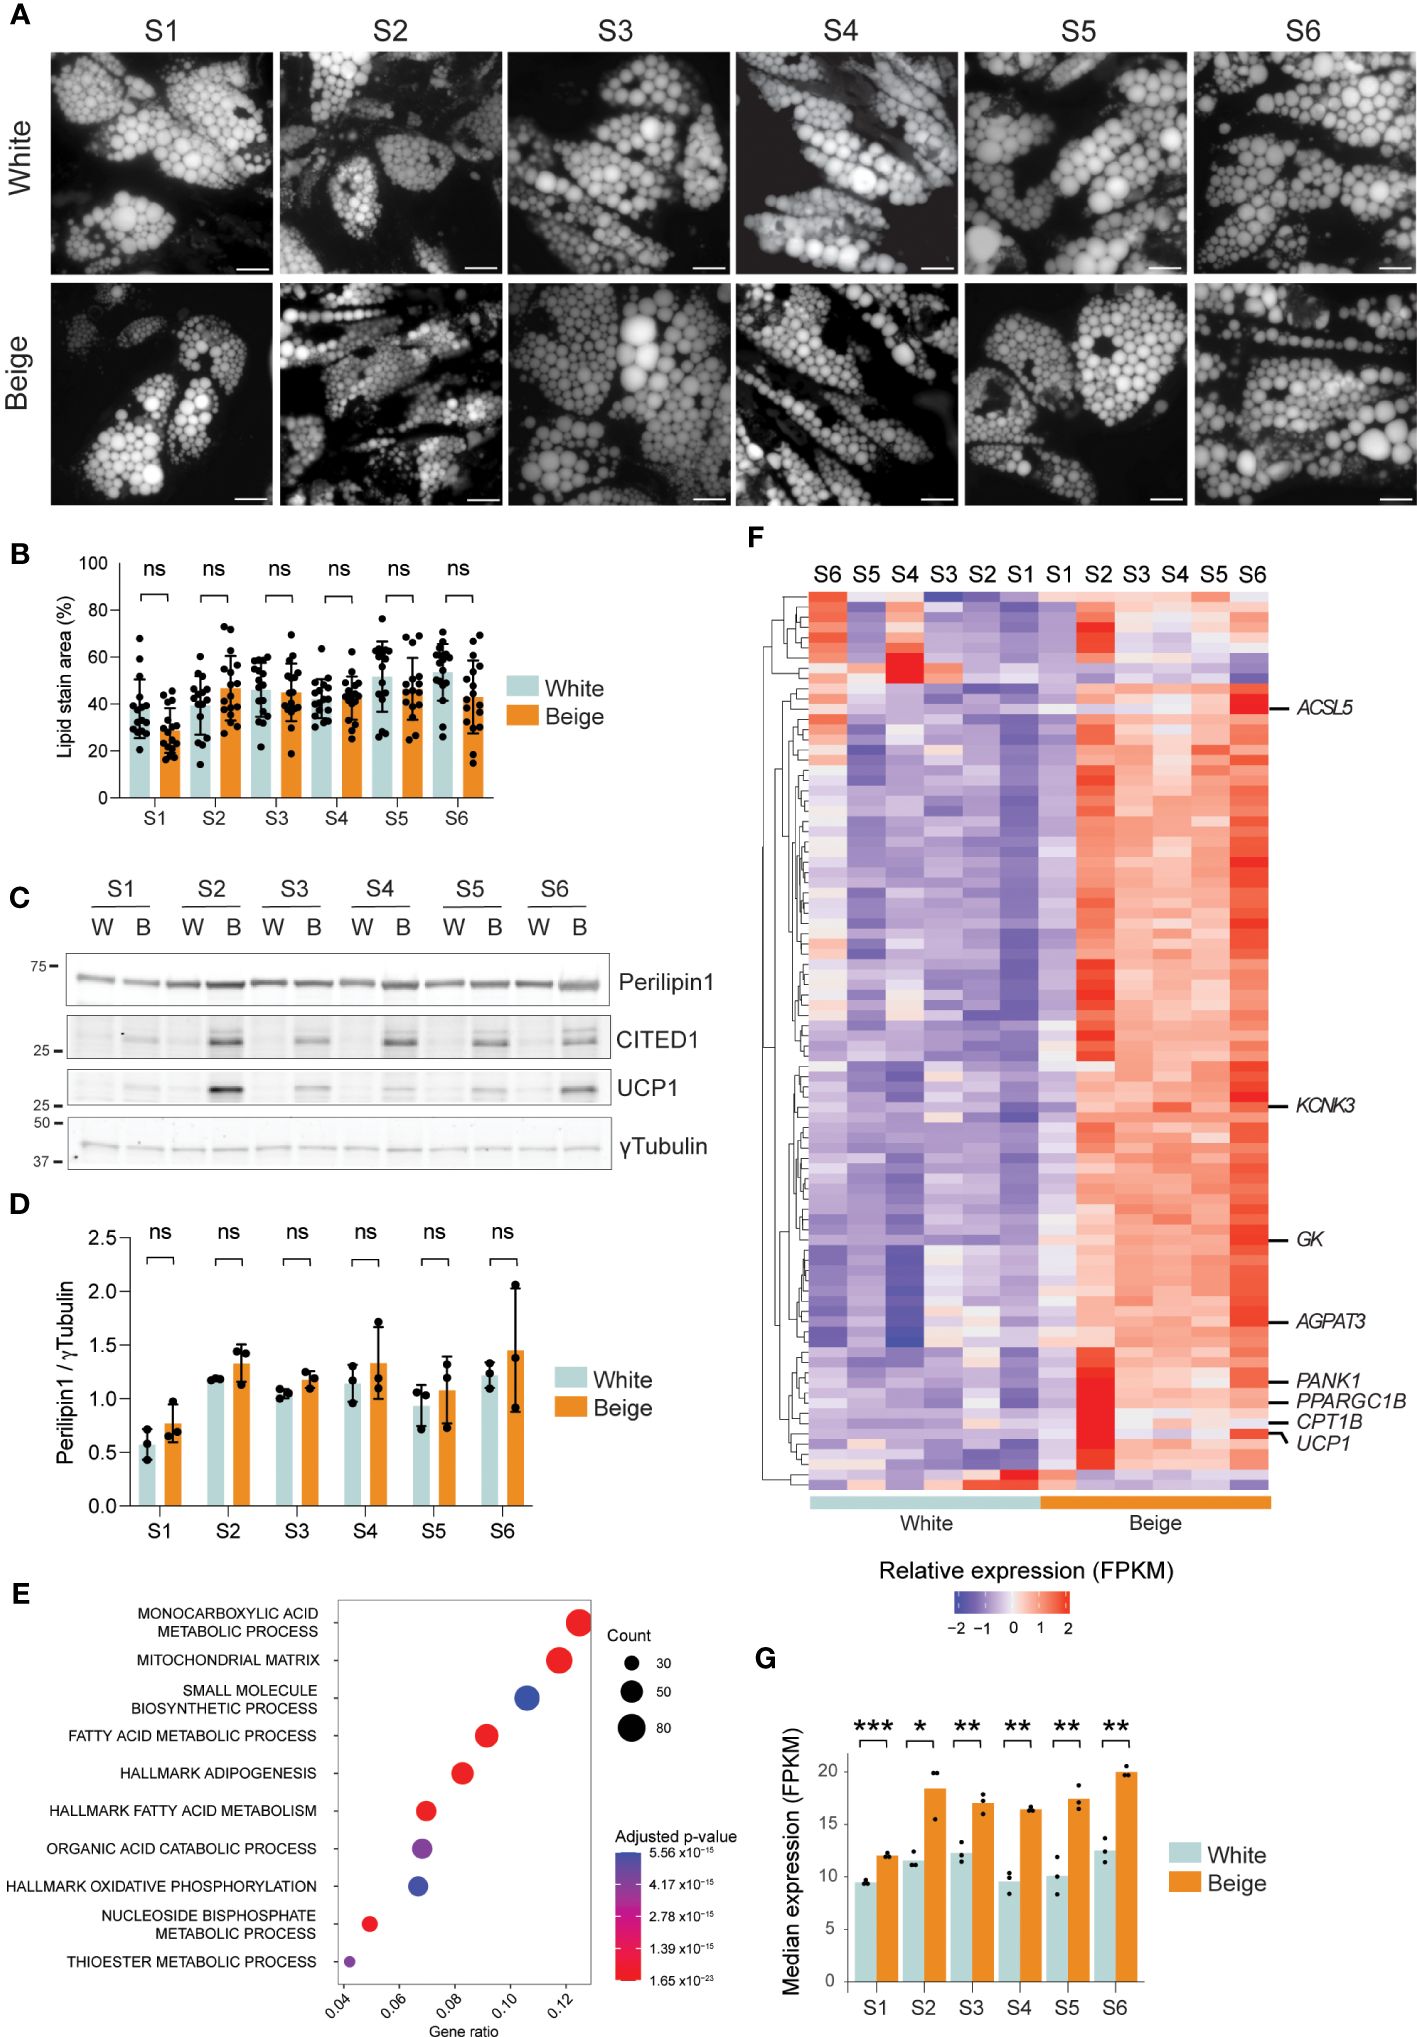
Figure 1 Model validation. (A) Bodipy staining of lipid droplets of day 15 differentiated white and beige adipocytes from 6 unrelated human subjects. Scale bar: 10µM. (B) Lipid droplet area per field quantified from (A) (ns non-significant; two-way ANOVA with Tukey’s multiple comparison; n>= 15 fields per condition from 3 independent experiments). (C) Western blot analysis of Perilipin1, CITED1, and UCP1 expression in day 15 differentiated white (W) and beige (B) adipocytes from 6 subjects. γTubulin is shown as a loading control. (D) Perilipin1 signals normalized to γTubulin, quantified from western blots (ns, non-significant; two-way ANOVA with Sidák’s multiple comparisons test; n=3). (E) Overrepresentation analysis of genes upregulated in beige vs white adipocytes from all donors (p < 0.05; RNA-seq) using GO and Hallmark gene sets from MSigDb (adjusted p-values < 1.2 x10⁻⁶). The gene ratio is the fraction of differentially expressed genes in each gene set. (F) Heatmap of relative gene expression (z-score transformed FPKM) for differentially expressed beige marker genes (p < 0.01 in any donor, eBayes method, limma package) from the BATLAS gene set (37). (G) Median gene expression of beige marker genes from the BATLAS gene set in day 15 white and beige adipocytes from 6 human subjects (*p < 0.05, **p < 0.01, ***p < 0.001; two-way ANOVA and t-tests with Holmberg adjustment).
3.2 Differential splicing in beige and white adipocytes gives rise to functionally distinct transcript isoforms
We next assessed differential splicing events in the white and beige adipocyte transcriptomes using LeafCutter, an annotation-free method that allows the identification and quantification of alternative splicing events by focusing on intron excision events, which are inferred from reads spanning exon–exon junctions (15). LeafCutter analysis identifies 777 exon junctions with robust differential usage between white and beige adipocytes in all 6 subjects (Figure 2A, Supplementary Table 5). Strikingly, genes with highly significant differences in intron excision, quantified by percent spliced-in (ΔPSI), include beiging markers (CITED1, PANK1), genes involved fatty acid and phospholipid remodeling (FAR2, PEMT, PLD1, LPIN1) or glucose metabolism (PC) as well as PPARG itself. Amongst the cell type specific exon junctions detected by LeafCutter, 723 could be annotated to known transcripts from either Gencode, RefSeq, or Fantom databases (Figure 2B). However, the remaining 54 cryptic exon junctions display canonical 5’ and 3’ motifs, and mostly result from differential 5´ splice site usage (Supplementary Figures 2A-C). Differential exon junctions detected in the beige vs white adipocyte transcriptomes map to 562 genes. Strikingly, only a minor fraction of these differentially spliced genes (DSGs) are also differentially expressed (Figure 2C), indicating that differential isoform expression constitutes an additional mechanism for gene expression regulation during beige adipocyte differentiation.
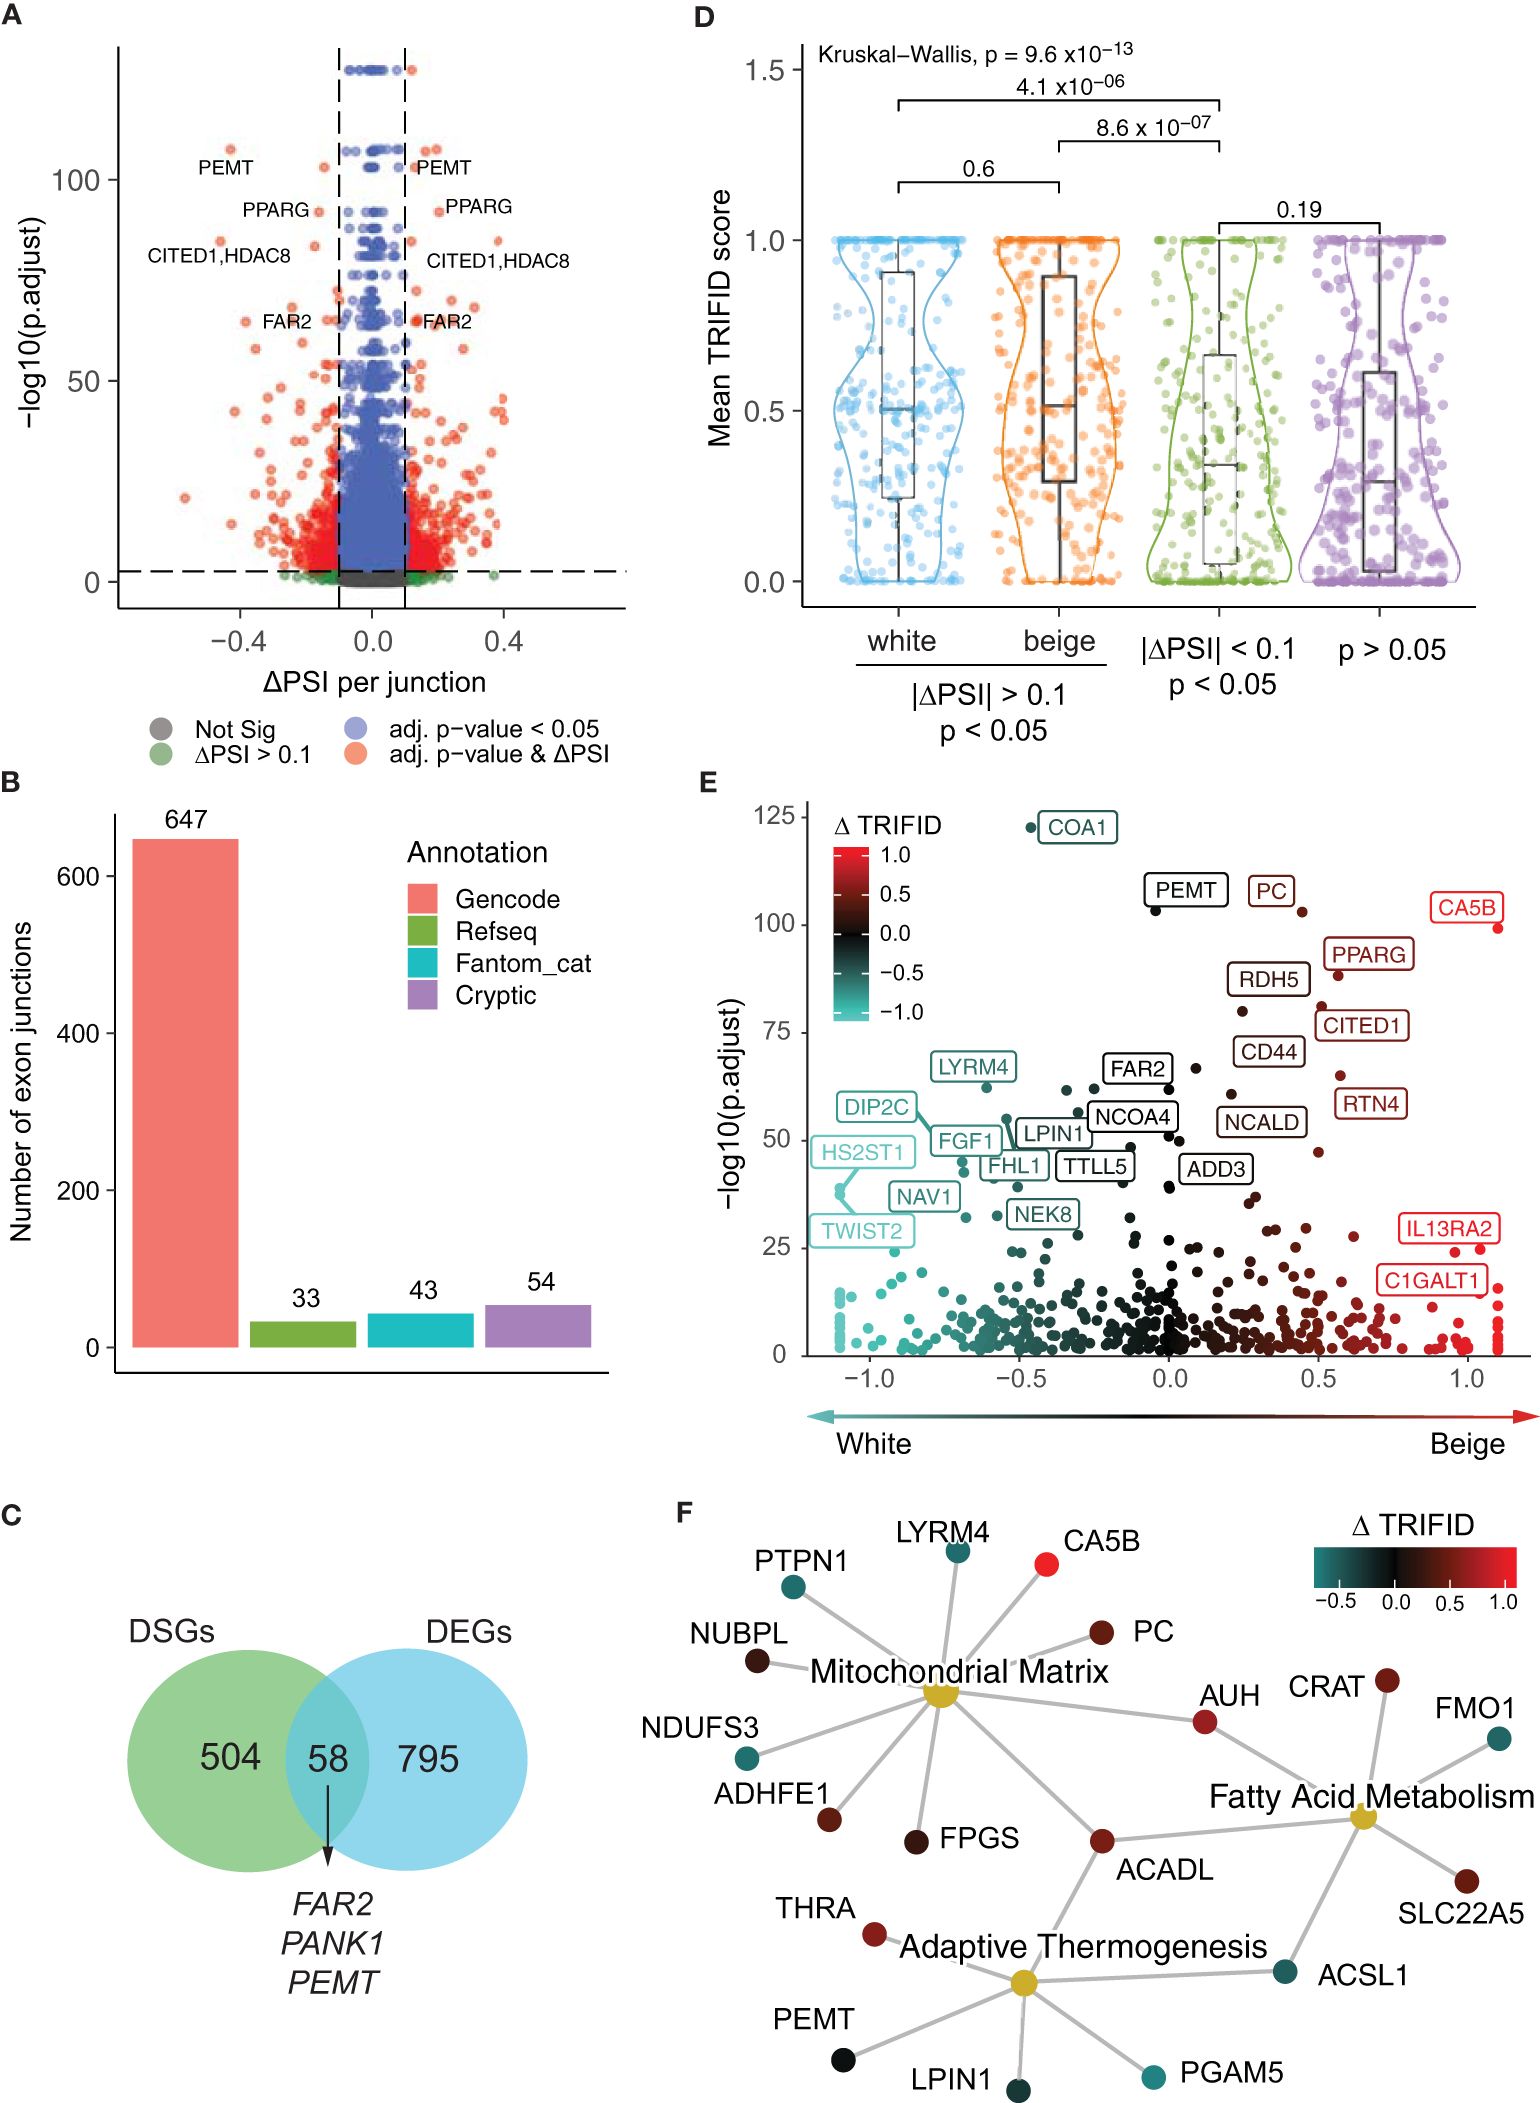
Figure 2 Functional classification of beige and white alternative isoforms. (A) Volcano plot of changes in exon-exon junction percentage spliced-in (PSI) between white and beige adipocytes and adjusted p-values per cluster from LeafCutter. (B) Annotation of exon junctions to transcript databases. (C) Venn diagram showing the overlap between differentially spliced genes (DSGs) and differentially expressed genes (DEGs) (D) Mean TRIFID score for exon junctions with white and beige enrichment (| ΔPSI> 0.1 & p < 0.05) compared to junctions with low differential enrichment (| ΔPSI< 0.1) from significant clusters (p < 0.05; n subsampled to 280), and non-significant junctions (p > 0.05; n subsampled to 280; Kruskal-Wallis test and t-tests with Holmberg adjustment). (E) Change in normalized TRIFID scores (Δ TRIFID) between white and beige isoforms (averaged per exon junction) plotted against LeafCutter ΔPSI adjusted p-value. (F) Network representation of genes pertaining to “Mitochondrial Matrix” (GO:0005759) “Fatty acid metabolism” (GO:0006631) and “Adaptive thermogenesis” (GO:1990845) GO terms, colored by Δ TRIFID score.
To assign functionality to differential exon junction usage, we mapped each junction to its matching transcripts and leveraged the TRIFID database to score protein functionality (18). TRIFID predicts protein functionality based on a number of transcript features including the presence of functional domains, cross-species conservation, transcript length and annotation database agreement. The TRIFID score (between 0 and 1) represents the likely functional relevance of protein isoforms. Both beige- and white-specific transcripts using spliced-in exon junctions have significantly higher average TRIFID functionality scores compared to the total transcriptome and to non-enriched exon-exon junctions from the same genes (Figure 2D), supporting a functional outcome for alternative isoform expression. Indeed, differential TRIFID score (ΔTRIFID) for DSGs predicts higher functionality for PC, CA5B, CITED1, RTN4 and PPARG isoforms in beige adipocytes (Figure 2E, Supplementary Table 6), and genes related to “Adaptive thermogenesis”, “Fatty acid metabolism” and “Mitochondrial matrix” show either an increase or decrease in predicted isoform functionality in beige adipocytes (Figure 2F). Altogether, these results argue for a functionally relevant impact of alternative isoform expression on the regulation of beige vs white adipocyte functions.
3.3 Beige-specific isoforms arise from differential TSS usage
To understand the mechanism driving beige-specific intron excision events, we first mapped these events along transcripts. We find a large majority of differential events occurring in the first intron of transcripts (Figure 3A), suggesting that DSGs between white and beige adipocytes may result from alternative TSS usage. This is further supported by the absence of consistent changes in expression of splicing regulators between white and beige adipocytes, and the minor overlap with splicing-driven alternative transcript expression described for adrenergic-induced adipocyte beiging (Supplementary Figures 3, 4) (28). We thus examined the epigenetic state of white and beige specific TSSs in mature adipocytes by ChIP-seq. Enrichment profiles for the active histone marks H3K4me3 and H3K27ac at beige TSSs are similar in beige and white adipocytes (Figures 3B, C, Supplementary Figures 5A, B), indicating that beige TSSs are already in an active state in white adipocytes. In line, we find a similar bimodal H3K4me1 enrichment around white and beige TSSs, and no enrichment for the repressive histone mark H3K27me3 is detected at beige TSSs in white adipocytes (Supplementary Figures 5C-G). Hence, differential TSS usage in beige vs white adipocytes is not driven by a transition in chromatin state.
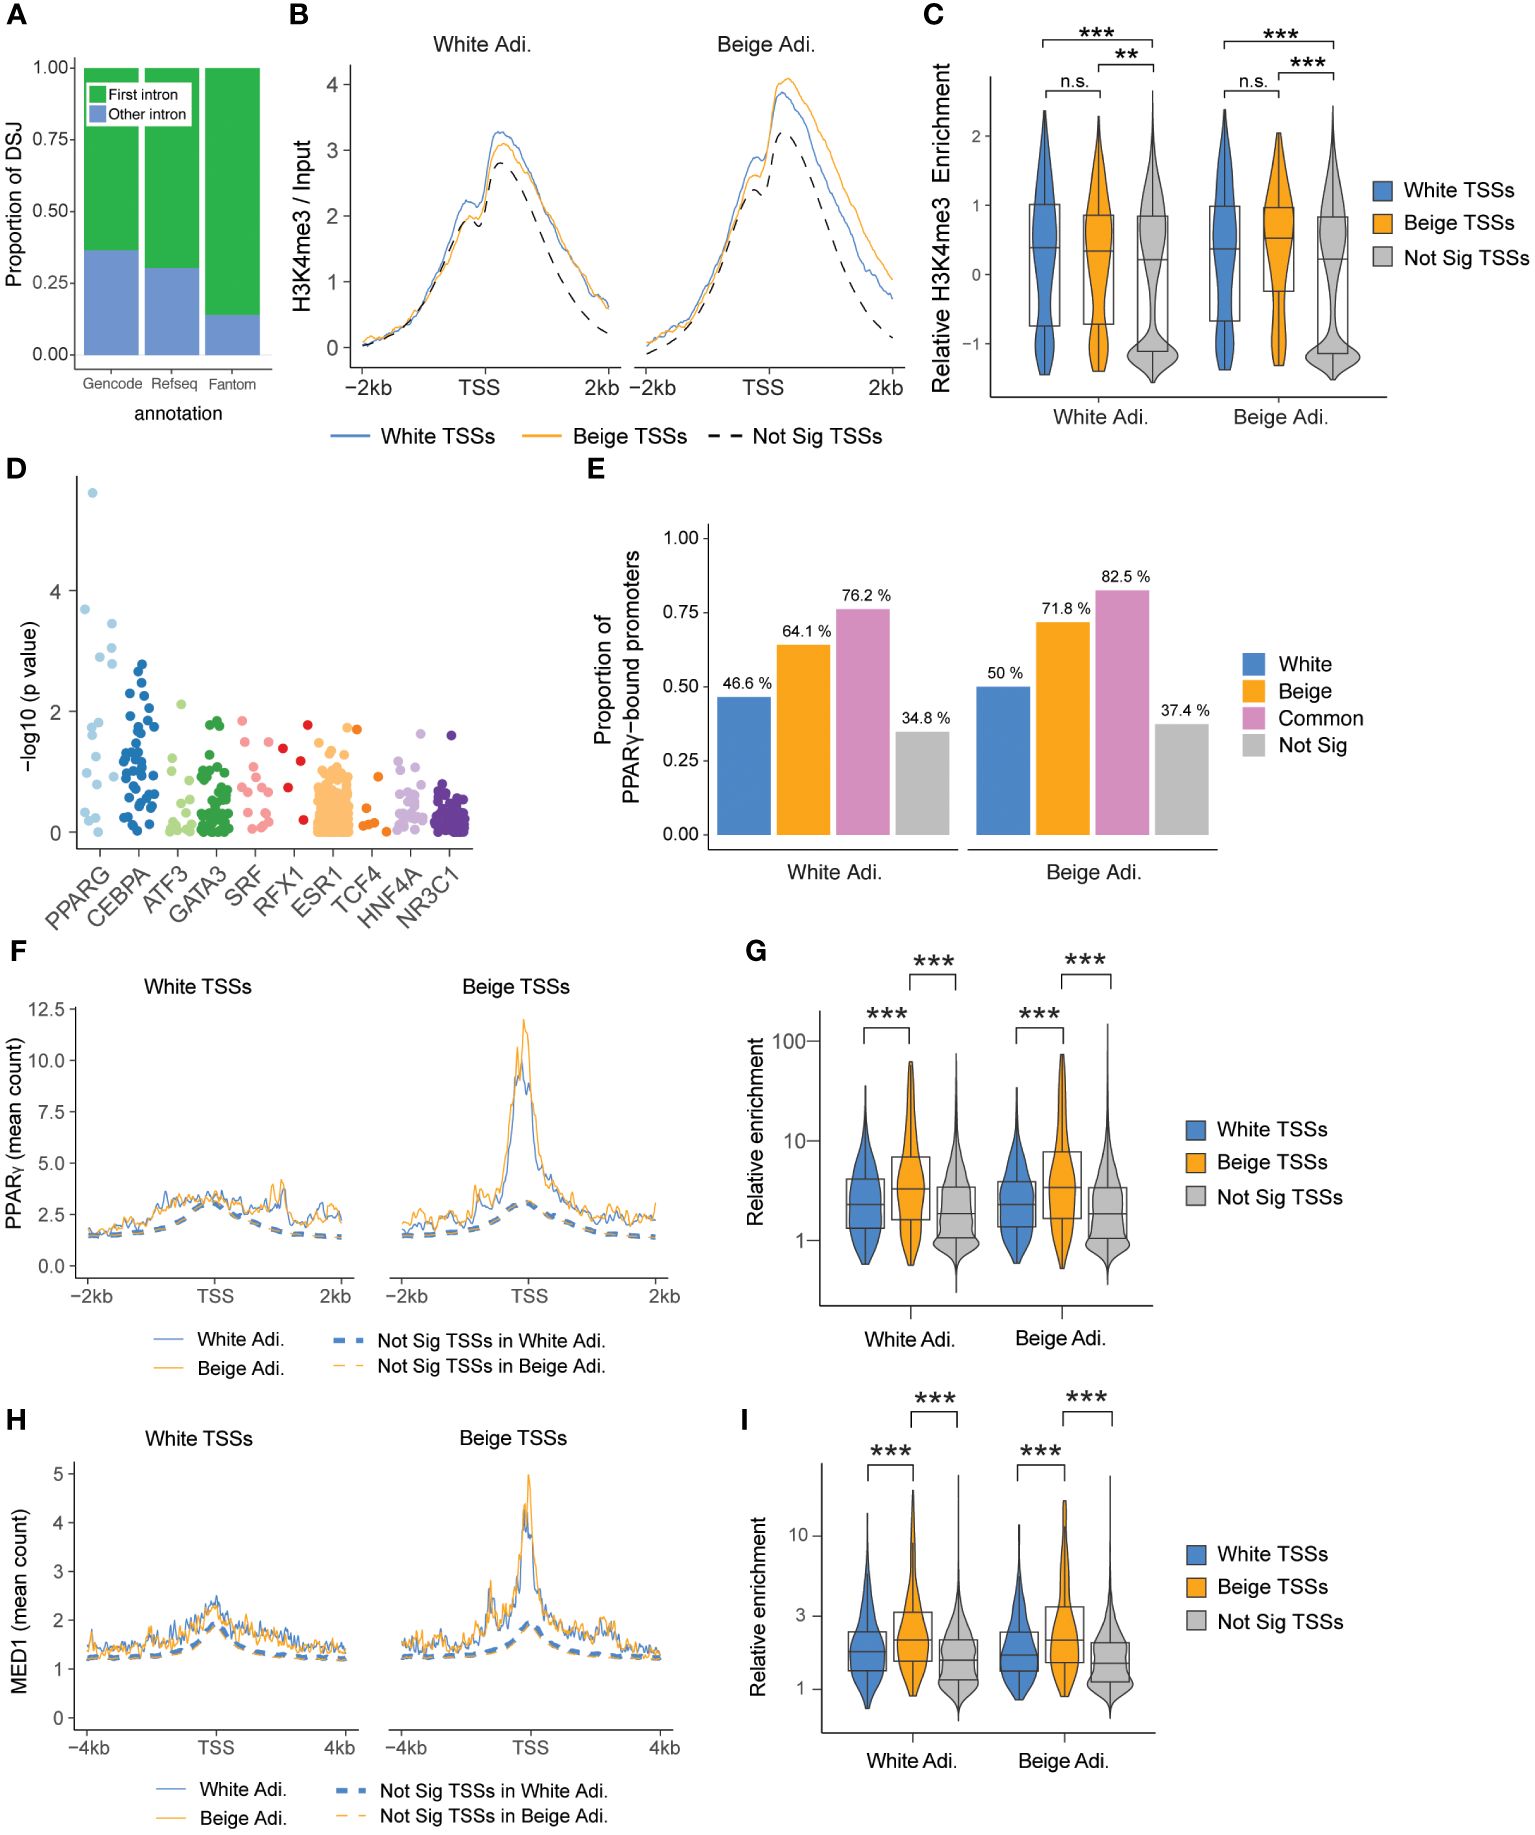
Figure 3 Splice variants arise from differential TSS usage. (A) Proportion of differentially spliced junctions (DSJs) mapping to the first intron of a transcript, arranged by annotation database. (B) Enrichment of H3K4me3 ChIP-Seq (log ratio of input) at differential TSSs in white and beige adipocytes. TSSs belonging to non-significant DEGs and non-significant DSGs are used as a control (n=23,529). (C) Quantification of H3K4me3 enrichment around the TSS (-1 kb/+2 kb), scaled within each condition (ns, non-significant, ** p < 0.01: ***p < 0.001; two-way ANOVA and Wilcoxon test with Holmberg adjustment). (D) Top 10 differentially enriched transcription factor binding sites at beige vs white TSSs (-2 kb/+0.5 kb) identified by Unibind. (E) Proportion of promoters (TSSs -2 kb/+0.5 kb) that intersect PPARγ ChIP-Seq peaks (beige promoters n=170; white promoters n=174) and promoters from non-significant DSGs and DEGs (n=12 257). Overlapping white and beige promoter regions are shown separately (n=63). (F, H) PPARγ and MED1 ChIP profiles around white (left panel) and beige (right panel) TSSs. (G, I) Quantification of PPARγ (TSS ± 250 bp) and MED1 (TSS ± 500 bp) ChIP enrichment around white, beige, and non-significant TSSs (***p < 0.0001; two-way ANOVA and Wilcoxon test with Holmberg adjustment).
3.4 Beige-specific TSSs are bound by PPARγ in beige and white adipocytes
We reasoned that beige TSS activation might result from differential binding of transcription factors. Using Unibind’s binding site predictions (39), we find PPARγ and CEBPα transcription factor binding sites as the most differentially enriched in beige compared to white TSSs (Figure 3D). Analysis of PPARγ ChIP-Seq data in human white and beige adipocytes (33) confirms that a higher proportion of beige TSSs overlap PPARγ peaks compared to white TSSs and non-significantly enriched TSSs (Figure 3E). Accordingly, average PPARγ enrichment levels are higher at beige TSSs in both beige and white adipocytes (Figures 3F, G). Since cell type-specific enhancers are enriched for MED1 binding in beige vs white adipocytes (33), we examined MED1 binding in each TSS subclass (Figure 3H). Similar to PPARγ, MED1 signals are significantly enriched at beige vs white TSSs (Figure 3I). However, rosiglitazone treatment does not result in increased MED1 binding, indicating that promoter-enhancer contacts at beige TSSs are also established in white adipocytes (Figures 3H, I). Altogether, our results show that beige-specific TSSs are in an active chromatin state and bound by PPARγ in both white and beige adipocytes, implying that rosiglitazone activation of PPARγ triggers cell type-specific isoform expression in beige adipocytes.
3.5 Distinct PPARγ isoform balance between white and beige adipocytes
LeafCutter analysis reveals that white and beige adipocytes express distinct proportions of PPARG isoforms (see Figure 2A). Indeed, exon junction reads spanning PPARG1 exon 1 and 2 are overrepresented in white adipocytes, while PPARG2 first exons are most expressed in beige adipocytes (Figures 4A-C). In agreement with whole TSS analyses, PPARG1 and PPARG2 TSSs are similarly enriched with broad domains of H3K4me3 and H3K27ac, marking active promoters (Figure 4B). However, only the PPARG2 TSS region shows an enrichment for PPARγ transcription factor binding and several MED1 peaks, suggestive of promoter-enhancer interaction (Figure 4B). Interestingly, PPARG2 TSS activation does not result in a global increase in PPARG expression in beige adipocytes (Figure 4D), but rather in a switch in the proportion of PPARG isoforms as confirmed by isoform-specific RT-qPCR (Figure 4E). Importantly, we show that both isoforms of PPARγ are readily detected at the protein level (Figure 4F), and rosiglitazone treatment results in a shift in PPARγ isoform expression with PPARγ2 becoming the main isoform in all ASC lines (Figure 4G), while total PPARγ protein expression remains unchanged (Figure 4H). Thus, altered balance of PPARγ isoform expression in beige adipocytes may underlie the activation of beige-specific TSSs upon rosiglitazone treatment.
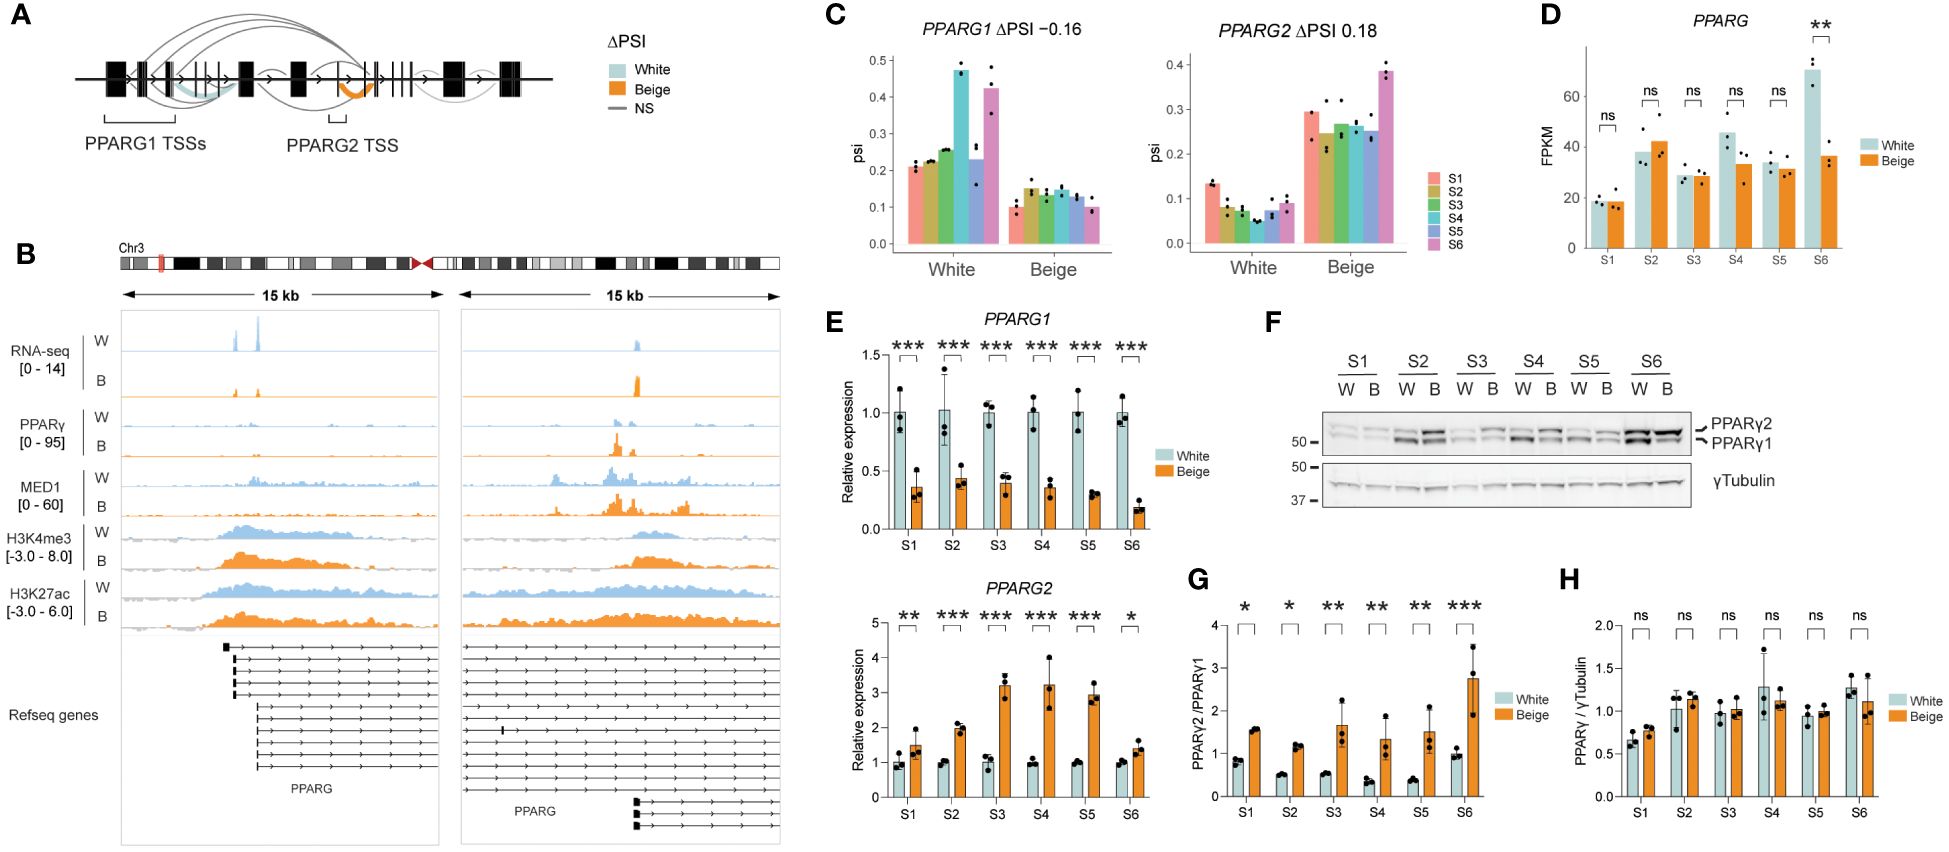
Figure 4 Beige specific isoform expression of PPARG. (A) Schematic representation of differential splicing pattern across the PPARG gene. (B) Integrative genomics viewer (IGV) tracks showing an overlay of S1-S6 RNA-seq reads on the forward strand, PPARγ and MED1 ChIP-seq over input ratios (33), and H3K4me3 and H3K27ac signals across PPARG1 and PPARG2 TSSs in beige vs white adipocytes. (C) ΔPSI on exon1-exon2 junction for PPARG1 (left panel) and PPARG2 (right panel) in white vs beige adipocytes derived from 6 ASC lines (p < 0.0001; LeafCutter). (D) Total PPARG expression level (FPKM) in white vs beige adipocytes (**p < 0.01, ns, non-significant; eBayes method, limma package; n=3) (E) Relative expression of PPARG1 (upper panel) and PPARG2 (lower panel) assessed by qPCR using isoform specific primers (*p < 0.05, **p < 0.01, ***p < 0.001; two-way ANOVA with Tukey’s multiple comparison; n=3). (F) Representative western blot and (G, H) quantification of PPARγ isoforms and total protein expression normalized to γTubulin (*p < 0.05, **p < 0.01, ***p < 0.001; two-way ANOVA with Sidák’s multiple comparisons test; n=3).
3.6 Beige cryptic PEMT isoform is efficiently translated
Amongst highly significant DSGs is PEMT, encoding the phosphatidylethanolamine methyltransferase (Figures 5A–C; see Figure 2A), an enzyme found at mitochondria-associated membranes and involved in the regulation of thermogenesis in vivo (40). PEMT encodes two major protein isoforms: short PEMT-S is liver-specific and highly active, while the long variant PEMT-L has an additional 37 N-terminal amino acids, reduced activity, and is expressed at low levels across a broad range of tissues (41) (Figure 5D; Supplementary Figures 6 and 7). Unlike most DSGs, PEMT expression is strongly induced in beige adipocytes (Figure 5E; see Figure 2C) and RNA-seq read alignment suggests this is driven by upregulation of a novel isoform (Figures 5A, B).
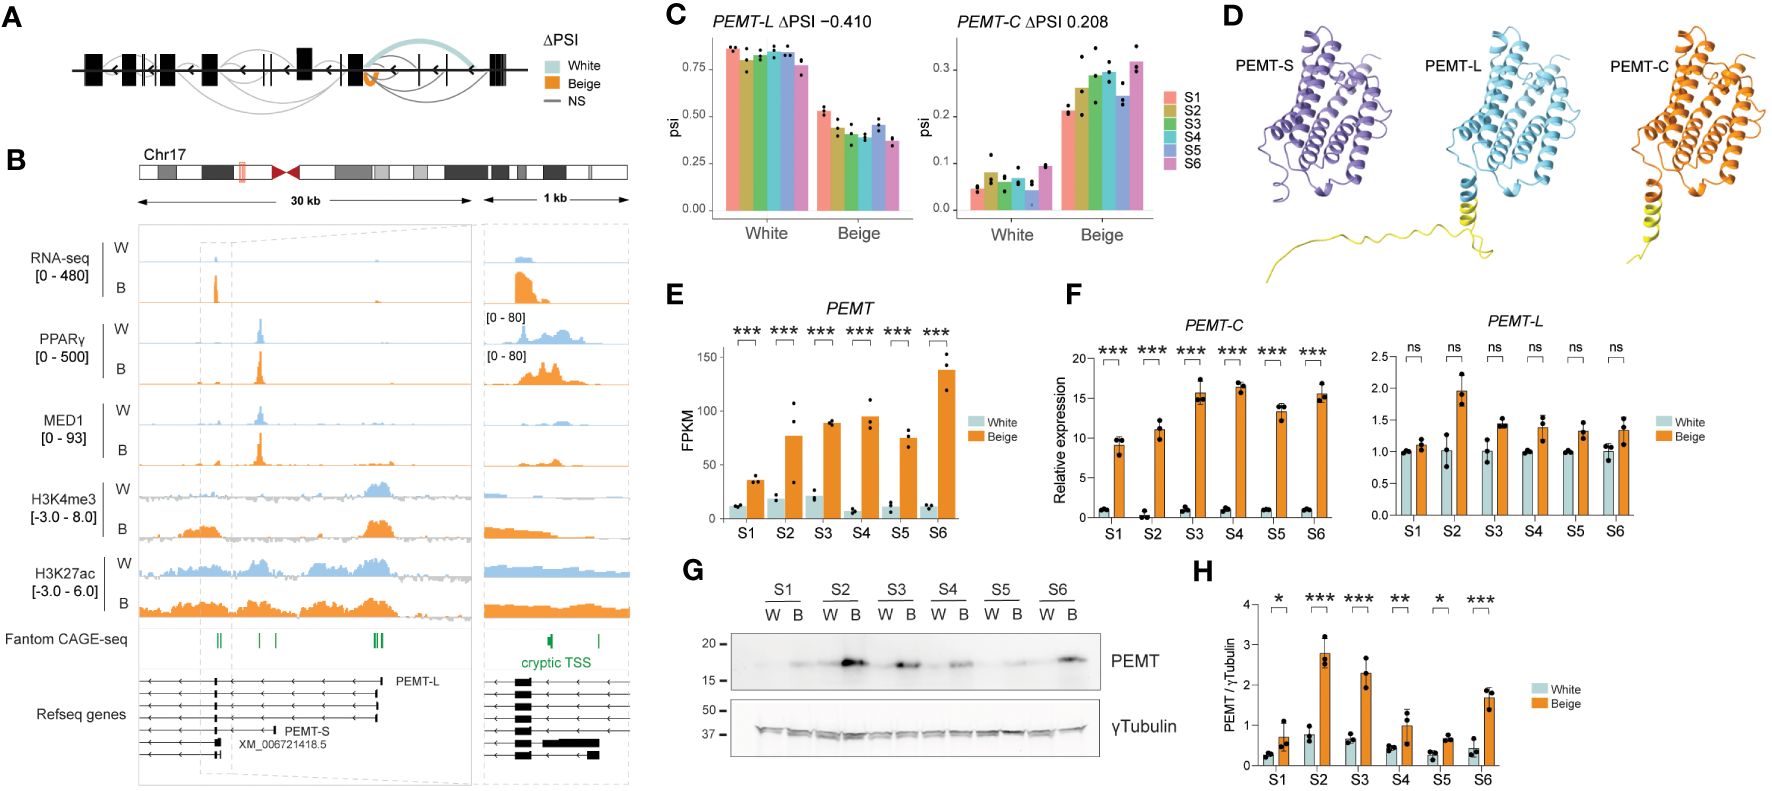
Figure 5 Beige-specific isoform expression of PEMT. (A) Schematic representation of differential splicing pattern across PEMT gene. (B) Integrative genomics viewer (IGV) tracks showing an overlay of S1-S6 RNA-seq reads on the reverse strand, PPARγ and MED1 ChIP-seq over input ratios (33), H3K4me3 and H3K27ac signals and Fantom CAGE-seq peaks across PEMT TSSs in white vs beige adipocytes. (C) ΔPSI on exon1-exon2 junction for PEMT-L (left panel) and PEMT-C (right panel) in beige vs white adipocytes derived from 6 ASC lines (p < 0.0001; LeafCutter). (D) Alphafold models for PEMT-S, PEMT-L and PEMT-C isoforms. The additional N-terminal amino acids in PEMT-L and PEMT-C are highlighted in yellow. (E) Total PEMT expression level (FPKM) in white vs beige adipocytes (***p < 0.0005, eBayes method, limma package, n = 3). (F) Relative expression of PEMT-C (left panel) and PEMT-L (right panel) assessed by qPCR using isoform specific primers (***p < 0.001, ns, non-significant, two-way ANOVA with Tukey’s multiple comparison, n = 3). (G) Representative western blot and (H) quantification of PEMT protein expression normalized to γTubulin (*p < 0.05, **p < 0.01, ***p < 0.001; two-way ANOVA with Sidák’s multiple comparisons test; n=3).
Indeed, LeafCutter identifies a switch from PEMT-L to a cryptic isoform of PEMT (hereafter referred to as PEMT-C) in beige adipocytes, with a first exon-exon junction matching a predicted transcript from RefSeq (XM_006721418.5) (Figures 5A-C), with a TRIFID functionality score similar to that of the PEMT-L isoform (see Figure 2F). However, no RNA-seq reads map over the first 250 bp of XM_006721418.5’s first intron, suggesting PEMT-C rather arises from a second downstream TSS, which is readily detected in Fantom robust CAGE-seq clusters (Figure 5B, right panel), and is a prominent PEMT TSS in differentiated adipocytes based on Fantom5 CAGE-Seq signal (Supplementary Figure 8). While PEMT-C promoter is similarly bound by PPARγ and MED1 in white and beige adipocytes, its upregulation in beige adipocytes correlates with an enrichment for the active promoter marks H3K4me3 and H3K27ac around its TSS (Figure 5B); this implies that the recruitment of chromatin modifiers underlies PEMT-C isoform expression in beige adipocytes.
Analysis of PEMT isoform expression using primers spanning isoform-specific exon junctions reveals that PEMT upregulation in beige adipocytes results from the induction of PEMT-C isoform only, while PEMT-L expression remains constant (Figure 5F). Importantly, only one PEMT isoform is detected at the protein level, with a molecular weight similar to that of the canonical PEMT-S isoform (Figure 5F). In agreement with RNA-seq and qPCR analysis, we find PEMT protein expression is significantly increased in beige adipocytes derived from all 6 ASC lines (Figures 5G, H). Thus, beige adipocytes express high levels of a novel PEMT isoform variant which is structurally close to the highly active PEMT-S variant (Figure 5D). Altogether, our results indicate that differential alternative TSS usage significantly impacts the beige adipocyte proteome.
4 Discussion
An increasing number of studies indicate that expression of alternative transcript isoforms plays an important role in adipose tissue physiology and pathophysiology (42). By analyzing differential gene and transcript expression in white and beige adipocytes differentiated from 6 human ASC lines, we uncover consistent switches in splicing patterns for more than 500 genes between the two lineages, likely resulting in the expression of functionally distinct protein isoforms.
Alternative splicing is a major driver of transcription heterogeneity, and splicing variations linked to age, sex, and ancestry contribute to phenotypic diversity (43). Our approach based on paired, parallel white and beige adipose differentiation from 6 unrelated subjects circumvents the issue of interindividual variability within the subpopulation. We identified splicing events using LeafCutter, a computational tool that estimates differential splicing directly from splice junction reads (15). While this approach has the major advantage of being annotation-independent, thus allowing cryptic event discovery, it also presents some limitations. Indeed, it cannot identify retained introns and relies on high read coverage across exon junctions, limiting splicing event identification for lowly expressed genes. However, the fact that only a fraction of DSGs are also differentially expressed suggests that variation in expression levels is not a strong bias in our dataset. In addition, interpretation of individual exon junction events is complicated by the relativization of PSI within clusters, which may link adjacent genes due to low coverage readthrough transcripts. However, linked genes are clearly identified in the output. Thus, by using an exon junction approach combined with stringent cut offs, we identify a set of robust, high-confidence splicing patterns characterizing white vs beige adipocytes in our system.
Recent evidence has highlighted a potential role for alternative splicing in the regulation of noradrenergic cAMP-mediated adipocyte beiging (25, 28). Indeed, sustained adrenergic stimulation elicits a global downregulation of splicing factors' gene expression in the pathological context of pheochromocytoma (28). Interestingly, such transcriptional remodeling of the splicing machinery was not observed upon rosiglitazone-induced beiging, a discrepancy that likely results from inherently different transcriptomic responses elicited by PPARγ- and cAMP-induced adipocyte browning (44). Instead, we find that differential isoform expression upon rosiglitazone-induced beiging mostly results from alternative TSS usage, rather than from alternative splicing of downstream exons. Nonetheless, both studies point to differential isoform expression as an important regulatory mechanism for thermogenic adipocyte specification and activation.
Rosiglitazone is a PPARγ agonist, and it is therefore not unexpected to find enriched PPARγ binding at beige-specific TSSs. Sequencing of nascent RNA in rosiglitazone-treated 3T3-L1 adipocytes highlights a redistribution of transcription towards PPARγ-driven enhancers (45). Intriguingly, rosiglitazone treatment also triggers gene downregulation through decreased coactivator binding at sites devoid of PPARγ, a mechanism which could account for the absence of overall gene upregulation upon PPARγ-dependent TSS activation, as we observe for PPARG itself. The functional significance of the switch in PPARγ protein isoform expression we observe in human beige adipocytes is supported by a recent study showing the differential effect of Pparγ1 and Pparγ2 deficiency on weight gain and thermogenic capacity (46). Indeed, mice with selective deficiency of PPARγ1 maintain body temperature better than PPARγ2-deficient mice and are protected against rosiglitazone induced weight gain. These results and ours point to PPARγ2 as the main PPARγ isoform driving adipocyte thermogenic response to rosiglitazone.
We find that PPARγ agonist-induced beiging triggers a consistent and strong upregulation of a new PEMT isoform. PEMT is most active in the liver where it is expressed as a short isoform, while its activity is thought to be only marginal in other tissues where the longer variant is expressed. PEMT-deficient mice are cold intolerant, a phenotype which has been linked to both compromised hepatic glucose production (40) and to lack of UCP1 expression in the brown adipose tissue (47). While the effect of PEMT deficiency in white adipose tissue has not been investigated, in vitro studies suggest that PEMT upregulation is required for efficient adipogenic differentiation (48). Our data together with public datasets identifies an adipose-specific TSS for PEMT, leading to the expression of a cryptic isoform which only differs by 16 additional amino acids from the highly active, liver specific PEMT-S. While the specific activity of this isoform needs to be examined, its strong upregulation in beige adipocytes is likely to alter the phosphatidylcholine to phosphatidylethanolamine ratio, which may modulate mitochondrial dynamics and function (49). Interestingly, the PEMT gene contains a splice junction quantitative trait loci (sQTL) which is associated with triglyceride levels and waist-to-hip ratio in genome-wide association studies (50). The same study identified numerous sQTLs associated with cardiometabolic traits in subcutaneous adipose tissue, supporting the contribution of alternative isoform usage to metabolic health. Further studies involving single-nuclei, isoform-level analysis of transcript expression in human adipose tissue will be needed to further establish the physiological relevance of beige-specific transcript expression.
Data availability statement
The datasets presented in this study can be found in online repositories. The names of the repository/repositories and accession number(s) can be found below: https://www.ncbi.nlm.nih.gov/geo/, GSE256262 https://www.ncbi.nlm.nih.gov/geo/, GSE256260 https://www.ncbi.nlm.nih.gov/geo/, GSE256261. The link to the code for data processing and analysis can be found here: https://github.com/sarahhp/splicing_thermogenesis.
Ethics statement
The studies involving humans were approved by Regional Committee for Research Ethics for Southern Norway (REK). The studies were conducted in accordance with the local legislation and institutional requirements. The participants provided their written informed consent to participate in this study.
Author contributions
SHP: Formal analysis, Investigation, Validation, Visualization, Writing – original draft, Writing – review & editing, Data curation. MA: Writing – review & editing, Data curation, Formal analysis. PC: Funding acquisition, Writing – review & editing. NB: Conceptualization, Funding acquisition, Investigation, Project administration, Supervision, Validation, Visualization, Writing – original draft, Writing – review & editing.
Funding
The author(s) declare financial support was received for the research, authorship, and/or publication of this article. This work was funded by the Research Council of Norway (grant 313508).
Acknowledgments
We thank Anita Løvstad Sørensen for technical assistance, especially for ChIP assays. We acknowledge the Norwegian Sequencing Center (Oslo University Hospital) for professional services.
Conflict of interest
The authors declare that the research was conducted in the absence of any commercial or financial relationships that could be construed as a potential conflict of interest.
Publisher’s note
All claims expressed in this article are solely those of the authors and do not necessarily represent those of their affiliated organizations, or those of the publisher, the editors and the reviewers. Any product that may be evaluated in this article, or claim that may be made by its manufacturer, is not guaranteed or endorsed by the publisher.
Supplementary material
The Supplementary Material for this article can be found online at: https://www.frontiersin.org/articles/10.3389/fendo.2024.1395750/full#supplementary-material
References
1. Cypess AM, Lehman S, Williams G, Tal I, Rodman D, Goldfine AB, et al. Identification and importance of brown adipose tissue in adult humans. N Engl J Med. (2009) 360:1509–17. doi: 10.1056/NEJMOA0810780
2. Lidell ME, Betz MJ, Enerbäck S. Brown adipose tissue and its therapeutic potential. J Internal Med J Intern Med. (2014) 276:364–77. doi: 10.1111/joim.12255
3. van Marken Lichtenbelt WD, Vanhommerig JW, Smulders NM, Drossaerts JMAFL, Kemerink GJ, Bouvy ND, et al. Cold-activated brown adipose tissue in healthy men. N Engl J Med. (2009) 360:1500–8. doi: 10.1056/NEJMOA0808718
4. Rockstroh D, Landgraf K, Wagner IV, Gesing J, Tauscher R, Lakowa N, et al. Direct evidence of brown adipocytes in different fat depots in children. PLoS One. (2015) 10:e0117841. doi: 10.1371/JOURNAL.PONE.0117841
5. Vijay J, Gauthier MF, Biswell RL, Louiselle DA, Johnston JJ, Cheung WA, et al. Single-cell analysis of human adipose tissue identifies depot- and disease-specific cell types. Nat Metab. (2020) 2:97–109. doi: 10.1038/s42255-019-0152-6
6. Sakers A, De Siqueira MK, Seale P, Villanueva CJ. Adipose-tissue plasticity in health and disease. Cell. (2022) 185:419–46. doi: 10.1016/J.CELL.2021.12.016
7. Bertholet AM, Kazak L, Chouchani ET, Bogaczyńska MG, Paranjpe I, Wainwright GL, et al. Mitochondrial patch clamp of beige adipocytes reveals UCP1-positive and UCP1-negative cells both exhibiting futile creatine cycling. Cell Metab. (2017) 25:811–22.e4. doi: 10.1016/j.cmet.2017.03.002
8. Ikeda K, Kang Q, Yoneshiro T, Camporez JP, Maki H, Homma M, et al. UCP1-independent signaling involving SERCA2b-mediated calcium cycling regulates beige fat thermogenesis and systemic glucose homeostasis. Nat Med. (2017) 23:1454–65. doi: 10.1038/NM.4429
9. Ouellet V, Routhier-Labadie A, Bellemare W, Lakhal-Chaieb L, Turcotte E, Carpentier AC, et al. Outdoor temperature, age, sex, body mass index, and diabetic status determine the prevalence, mass, and glucose-uptake activity of 18F-FDG-detected BAT in humans. J Clin Endocrinol Metab. (2011) 96:192–9. doi: 10.1210/JC.2010-0989
10. Marasco LE, Kornblihtt AR. The physiology of alternative splicing. Nat Rev Mol Cell Biol. (2023) 24:242–54. doi: 10.1038/s41580-022-00545-z
11. Lee Y, Rio DC. Mechanisms and regulation of alternative pre-mRNA splicing. Annu Rev Biochem. (2015) 84:291–323. doi: 10.1146/annurev-biochem-060614-034316
12. Pan Q, Shai O, Lee LJ, Frey BJ, Blencowe BJ. Deep surveying of alternative splicing complexity in the human transcriptome by high-throughput sequencing. Nat Genet. (2008) 40:1413–5. doi: 10.1038/ng.259
13. Denoeud F, Kapranov P, Ucla C, Frankish A, Castelo R, Drenkow J, et al. Prominent use of distal 5’ transcription start sites and discovery of a large number of additional exons in ENCODE regions. Genome Res. (2007) 17:746–59. doi: 10.1101/GR.5660607
14. Forrest ARR, Kawaji H, Rehli M, Baillie JK, De Hoon MJL, Haberle V, et al. A promoter-level mammalian expression atlas. Nat. (2014) 507:462–70. doi: 10.1038/nature13182
15. Li YI, Knowles DA, Humphrey J, Barbeira AN, Dickinson SP, Im HK, et al. Annotation-free quantification of RNA splicing using LeafCutter. Nat Genet. (2017) 50:151–8. doi: 10.1038/s41588-017-0004-9
16. Trincado JL, Entizne JC, Hysenaj G, Singh B, Skalic M, Elliott DJ, et al. SUPPA2: Fast, accurate, and uncertainty-aware differential splicing analysis across multiple conditions. Genome Biol. (2018) 19:1–11. doi: 10.1186/s13059-018-1417-1
17. Sajjanar B, Deb R, Raina SK, Pawar S, Brahmane MP, Nirmale AV, et al. Untranslated regions (UTRs) orchestrate translation reprogramming in cellular stress responses. J Therm Biol. (2017) 65:69–75. doi: 10.1016/J.JTHERBIO.2017.02.006
18. Pozo F, Martinez-Gomez L, Walsh TA, Rodriguez JM, Di Domenico T, Abascal F, et al. Assessing the functional relevance of splice isoforms. NAR Genomics Bioinforma. (2021) 3:1–16. doi: 10.1093/NARGAB/LQAB044
19. Sulakhe D, D’Souza M, Wang S, Balasubramanian S, Athri P, Xie B, et al. Exploring the functional impact of alternative splicing on human protein isoforms using available annotation sources. Brief Bioinform. (2019) 20:1754–68. doi: 10.1093/BIB/BBY047
20. Morales J, Pujar S, Loveland JE, Astashyn A, Bennett R, Berry A, et al. A joint NCBI and EMBL-EBI transcript set for clinical genomics and research. Nat. (2022) 604:310–5. doi: 10.1038/s41586-022-04558-8
21. Rodriguez JM, Pozo F, Cerdán-Velez D, Di Domenico T, Vázquez J, Tress ML. APPRIS: selecting functionally important isoforms. Nucleic Acids Res. (2022) 50:D54–9. doi: 10.1093/NAR/GKAB1058
22. Xue P, Hou Y, Zuo Z, Wang Z, Ren S, Dong J, et al. Long isoforms of NRF1 negatively regulate adipogenesis via suppression of PPARγ expression. Redox Biol. (2020) 30:101414. doi: 10.1016/J.REDOX.2019.101414
23. Goodson ML, Mengeling BJ, Jonas BA, Privalsky ML. Alternative mRNA splicing of corepressors generates variants that play opposing roles in adipocyte differentiation. J Biol Chem. (2011) 286:44988–99. doi: 10.1074/JBC.M111.291625
24. Lin JC, Chi YL, Peng HY, Lu YH. RBM4–Nova1–SRSF6 splicing cascade modulates the development of brown adipocytes. Biochim Biophys Acta - Gene Regul Mech. (2016) 1859:1368–79. doi: 10.1016/J.BBAGRM.2016.08.006
25. Castellá M, Mestres-Arenas A, Gavaldà-Navarro A, Blasco-Roset A, Quesada-López T, Romero-Carramiñana I, et al. The splicing factor SF3B1 is involved in brown adipocyte thermogenic activation. Biochem Pharmacol. (2024) 220:116014. doi: 10.1016/j.bcp.2023.116014
26. Vernia S, Edwards YJK, Han MS, Cavanagh-Kyros J, Barrett T, Kim JK, et al. An alternative splicing program promotes adipose tissue thermogenesis. Elife. (2016) 5. doi: 10.7554/eLife.17672
27. Chao Y, Jiang Y, Zhong M, Wei K, Hu C, Qin Y, et al. Regulatory roles and mechanisms of alternative RNA splicing in adipogenesis and human metabolic health. Cell Biosci. (2021) 11:1–16. doi: 10.1186/s13578-021-00581-w
28. Castellá M, Blasco-Roset A, Peyrou M, Gavaldà-Navarro A, Villarroya J, Quesada-López T, et al. Adipose tissue plasticity in pheochromocytoma patients suggests a role of the splicing machinery in human adipose browning. iScience. (2023) 26:106847. doi: 10.1016/j.isci.2023.106847
29. Robinson MD, Oshlack A. A scaling normalization method for differential expression analysis of RNA-seq data. Genome Biol. (2010) 11:1–9. doi: 10.1186/gb-2010-11-3-r25
30. Law CW, Chen Y, Shi W, Smyth GK. Voom: Precision weights unlock linear model analysis tools for RNA-seq read counts. Genome Biol. (2014) 15:1–17. doi: 10.1186/GB-2014-15-2-R29/FIGURES/11
31. Cotto KC, Feng YY, Ramu A, Richters M, Freshour SL, Skidmore ZL, et al. Integrated analysis of genomic and transcriptomic data for the discovery of splice-associated variants in cancer. Nat Commun. (2023) 14:1–18. doi: 10.1038/s41467-023-37266-6
32. Hon CC, Ramilowski JA, Harshbarger J, Bertin N, Rackham OJL, Gough J, et al. An atlas of human long non-coding RNAs with accurate 5′ ends. Nature. (2017) 543:199. doi: 10.1038/NATURE21374
33. Loft A, Forss I, Siersbæk MS, Schmidt SF, Larsen ASB, Madsen JGS, et al. Browning of human adipocytes requires KLF11 and reprogramming of PPARγ superenhancers. Genes Dev. (2015) 29:7. doi: 10.1101/GAD.250829.114
34. Mirdita M, Schütze K, Moriwaki Y, Heo L, Ovchinnikov S, Steinegger M. ColabFold: making protein folding accessible to all. Nat Methods. (2022) 19:679–82. doi: 10.1038/s41592-022-01488-1
35. Meng EC, Goddard TD, Pettersen EF, Couch GS, Pearson ZJ, Morris JH, et al. UCSF ChimeraX: Tools for structure building and analysis. Protein Sci. (2023) 32:e4792. doi: 10.1002/PRO.4792
36. Wu T, Hu E, Xu S, Chen M, Guo P, Dai Z, et al. clusterProfiler 4.0: A universal enrichment tool for interpreting omics data. Innovation. (2021) 2. doi: 10.1016/j.xinn.2021.100141
37. Liberzon A, Birger C, Thorvaldsdóttir H, Ghandi M, Mesirov JP, Tamayo P. The Molecular Signatures Database (MSigDB) hallmark gene set collection. Cell Syst. (2015) 1:417–25. doi: 10.1016/J.CELS.2015.12.004
38. Perdikari A, Leparc GG, Balaz M, Pires ND, Lidell ME, Sun W, et al. BATLAS: deconvoluting brown adipose tissue. Cell Rep. (2018) 25:784–797.e4. doi: 10.1016/j.celrep.2018.09.044
39. Puig RR, Boddie P, Khan A, Castro-Mondragon JA, Mathelier A. UniBind: maps of high-confidence direct TF-DNA interactions across nine species. BMC Genomics (2021) 22:482. doi: 10.1186/s12864-021-07760-6
40. Gao X, van der Veen JN, Fernandez-Patron C, Vance JE, Vance DE, Jacobs RL. Insufficient glucose supply is linked to hypothermia upon cold exposure in high-fat diet-fed mice lacking PEMT. J Lipid Res. (2015) 56:1701–10. doi: 10.1194/JLR.M059287
41. Morita SY, Takeuchi A, Kitagawa S. Functional analysis of two isoforms of phosphatidylethanolamine N-methyltransferase. Biochem J. (2010) 432:387–98. doi: 10.1042/BJ20100490
42. Naing YT, Sun L. The role of splicing factors in adipogenesis and thermogenesis. Mol Cells. (2023) 46:268. doi: 10.14348/MOLCELLS.2023.2195
43. García-Pérez R, Ramirez JM, Ripoll-Cladellas A, Chazarra-Gil R, Oliveros W, Soldatkina O, et al. The landscape of expression and alternative splicing variation across human traits. Cell Genomics. (2022) 3. doi: 10.1016/J.XGEN.2022.100244
44. So J, Wann J, Strobel O, Kim K, Roh HC. Chronic cAMP activation induces adipocyte browning through discordant biphasic remodeling of transcriptome and chromatin accessibility. Mol Metab. (2022) 66:101619. doi: 10.1016/J.MOLMET.2022.101619
45. Step SE, Lim HW, Marinis JM, Prokesch A, Steger DJ, You SH, et al. Anti-diabetic rosiglitazone remodels the adipocyte transcriptome by redistributing transcription to PPARγ-driven enhancers. Genes Dev. (2014) 28:1018–28. doi: 10.1101/GAD.237628.114
46. Hu W, Jiang C, Kim M, Xiao Y, Richter HJ, Guan D, et al. Isoform-specific functions of PPARγ in gene regulation and metabolism. Genes Dev. (2022) 34:300–12. doi: 10.1101/gad.349232.121
47. Johnson JM, Verkerke ARP, Maschek JA, Ferrara PJ, Lin C, Kew KA, et al. Alternative splicing of UCP1 by non-cell-autonomous action of PEMT. Mol Metab. (2020) 31:55–66. doi: 10.1016/J.MOLMET.2019.10.007
48. Presa N, Dominguez-Herrera A, van der Veen JN, Vance DE, Gómez-Muñoz A. Implication of phosphatidylethanolamine N-methyltransferase in adipocyte differentiation. Biochim Biophys Acta - Mol Basis Dis. (2020) 1866:165853. doi: 10.1016/J.BBADIS.2020.165853
49. Tasseva G, Bai HD, Davidescu M, Haromy A, Michelakis E, Vance JE. Phosphatidylethanolamine deficiency in mammalian mitochondria impairs oxidative phosphorylation and alters mitochondrial morphology. J Biol Chem. (2013) 288:4158–73. doi: 10.1074/jbc.M112.434183
Keywords: beige adipocyte, human thermogenic adipocytes, adipose differentiation, transcriptomics, alternative transcript isoforms, alternative splicing, human adipose stem cells (hASCs)
Citation: Hazell Pickering S, Abdelhalim M, Collas P and Briand N (2024) Alternative isoform expression of key thermogenic genes in human beige adipocytes. Front. Endocrinol. 15:1395750. doi: 10.3389/fendo.2024.1395750
Received: 04 March 2024; Accepted: 07 May 2024;
Published: 24 May 2024.
Edited by:
Rubén Cereijo, University of Barcelona, SpainReviewed by:
Alexander Bartelt, Ludwig Maximilian University of Munich, GermanySergio Alonso, Germans Trias i Pujol Health Science Research Institute (IGTP), Spain
Lorenzo Pasquali, Pompeu Fabra University, Spain
Copyright © 2024 Hazell Pickering, Abdelhalim, Collas and Briand. This is an open-access article distributed under the terms of the Creative Commons Attribution License (CC BY). The use, distribution or reproduction in other forums is permitted, provided the original author(s) and the copyright owner(s) are credited and that the original publication in this journal is cited, in accordance with accepted academic practice. No use, distribution or reproduction is permitted which does not comply with these terms.
*Correspondence: Nolwenn Briand, bm9sd2Vubi5icmlhbmRAbWVkaXNpbi51aW8ubm8=