 Ting Yin1,2†
 Jing Wang1,3†XueQing Lan1Jiaxing Zhang1,2Qingan Wang1,2
 Jiangwei Qiu1Tao Ma4Yi Zhao2,5*‡
 Yuhong Zhang1,2*‡
- 1Department of Epidemiology and Health Statistics, School of Public Health, Ningxia Medical University, Yinchuan, Ningxia, China
- 2Key Laboratory of Environmental Factors and Chronic Disease Control, Ningxia Medical University, Yinchuan, Ningxia, China
- 3General Hospital of Ningxia Medical University, Public Health School, Ningxia Medical University, Yinchuan, Ningxia, China
- 4Peking University First Hospital Ningxia Women and Children's Hospital (Ningxia Hui Autonomous Region Maternal and Child Health Hospital), Ningxia, China
- 5Department of Nutrition and Food Hygiene, School of Public Health, Ningxia Medical University, Yinchuan, Ningxia, China
Objective: This study aimed to explore the cut-off value of 10 obesity indicators, including BF% (Body Fat Ratio, BF%), BMI (Body Mass Index, BMI), WHR (Waist-to-Hip Ratio, WHR), WHtR (Waist-to-Height Ratio, WHtR), BAI (Body Adiposity Index, BAI), OBD (Obesity Degree, OBD), CI (Conicity Index,CI), AVI (Abdominal Volume Index, AVI), ABSI (A Body Shape Index, ABSI) and BRI (Body Roundness Index, BRI), and investigate their relationship between different anthropometric indices of obesity indicators and their correlation to hypertension, diabetes, and dyslipidemia in rural residents aged 35–74 years in Ningxia, an autonomous region of northwest China.
Methods: The study participants were interviewed by questionnaire (including demographic characteristics such as age, education status, economic status, and lifestyle variables such as exercise frequency, smoke, alcohol, tea, spice, and vinegar consumption), bio-impedance body composition analysis, and blood laboratory test. The t-test and chi-square test were used to compare the characteristics of different groups, and the receiver operating characteristic curve was used to analyze the correlation of different indicators and explore their cut-off values.
Results: The study comprised 14,926 participants, of whom 39.80% (5948/14,926) were male, and the mean age of the study population was 56.75 ± 9.74 years. The waist circumference had the greatest influence on obesity indicators, and BMI, AVI, and BRI are most susceptible to anthropometric indicators. WHtR had the largest AUC (Area Under the ROC Curves, AUC) for predicting obesity in both male and female. In addition, we provided a recommended cut-off value of BMI, WHR, WHtR, BAI, OBD, CI, AVI, ABSI and BRI. WHtR had the largest AUC for predicting diabetes, hypertension, and dyslipidemia, while WHtR served as a good predictive indicator (all P<0.001).
Conclusion: Waist circumference is closely related to obesity. Therefore, there is a great significance to carry out long-term health management education among the population, change the unhealthy lifestyle and promote the metabolic health for the primary prevention of cardiovascular diseases.
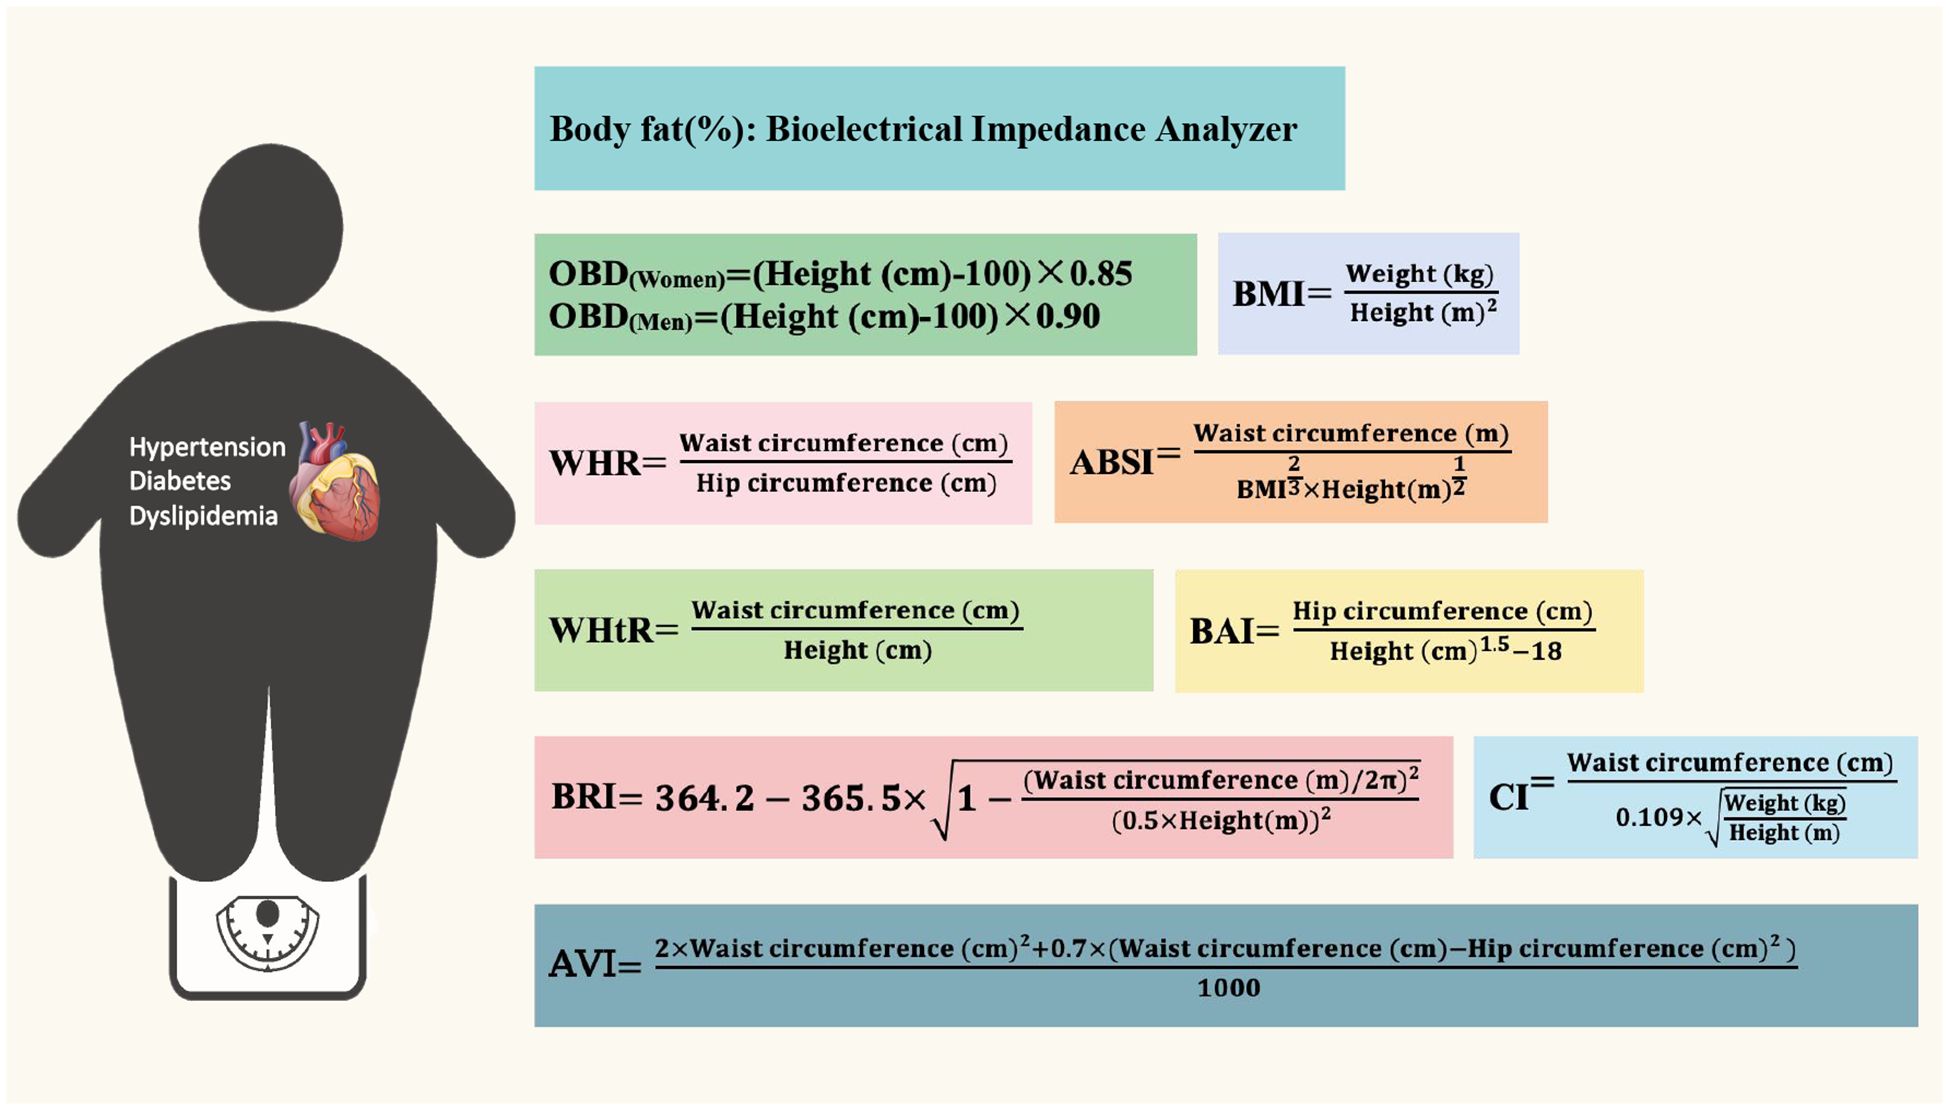
Graphical Abstract. Different obesity indicators and the calculation.
1 Introduction
Obesity is a metabolic disease caused by the body’s calorie intake exceeding consumption, resulting in the accumulation of body fat or excessive weight growth (1). Obesity affects people’s quality of life and is closely related to many cardiovascular diseases. Especially, among a series of social problems brought about by population aging, the increasing number of middle-aged and elderly people with obesity has gradually become a public health problem that cannot be ignored (2, 3). According to the Chinese Center for Disease Control and Prevention, more than 8.1% of Chinese adults were obese in 2018, three times as many as in 2004 (4). The Report on Nutrition and Chronic Diseases of Chinese Residents (2020) showed that the overweight and obesity rate of urban and rural residents of all age groups continues to rise, with more than half of adult residents being overweight or obese (5). A cross-sectional study of 1,577,094 Chinese adult participants showed that 14.1% were obese according to BMI (Body Mass Index, BMI). Men were higher than women (standardized prevalence of obesity was 17.6% and 9.6%, respectively). Compared with participants with normal BMI, obese individuals had a higher prevalence of assessed complications, primarily prediabetes, dyslipidemia, and hypertension, and higher BMI brings more complications (6).
Glucose and lipid metabolism are the basis of life activities and play an important role in maintaining human health (7–9). Abnormal glucose and lipid metabolism is a major risk factor leading to the occurrence and death of cardiovascular diseases worldwide (10, 11). Hypertension is the most common chronic noncommunicable disease in China and the most important risk factor for cardiovascular diseases, which seriously consumes medical and social resources (12). Studies have found that the proportion of abnormal blood pressure in middle-aged people is increasing, and the prevalence rate of obesity-related hypertension in Chinese adults aged 45 and above is 22.7%. However, the awareness rate and treatment compliance are lacking, especially in rural areas (13). Study shows that the prevalence of diabetes in adults is on the rise (14). The incidence of diabetes in the elderly in China is about 30.0%, which is much higher than the average adult level, and seriously affects the quality of life and survival of the elderly (15). The epidemiological survey on dyslipidemia in China shows that the prevalence of dyslipidemia varies greatly due to different groups, regions and cultural characteristics, and the prevalence of dyslipidemia is higher in obese people (16).
Currently, standard measures that define obesity varies widely, body fat percentage (BF%) is the gold standard for diagnosing obesity (17). In addition to the body mass index (BMI) and waist-hip ratio (WHR), Waist-to-height ratio (WHtR), waist circumference (WC), neck circumference (NC) are used to evaluate obese, leading to inconsistencies in result (18, 19). At the same time, these indexes could not distinguish subcutaneous and visceral fat. The cut-off values of WC and WHR are also affected by gender. Therefore, new compound obesity indicators was proposed. Research shows that Body adiposity index (BAI) can better reflect the weight loss of patients with mild Obesity (20). The Obesity degree (OBD) calculates the proportion of the actual body mass exceeding the ideal body mass (21). Conicity index (CI) reflects the accumulation of abdominal fat (22), and Abdominal volume index (AVI) is a comprehensive index based on traditional measurements (such as waist circumference and hip circumference), which is mainly used to assess the accumulation of visceral fat (23). A body shape index (ABSI) adds waist circumference to BMI, which can be used to infer the risk of death from obesity-related diseases (24). The Body roundness index (BRI) evaluates the distribution of body fat by calculating the ratio of waist circumference to height. Studies have shown that it can be used as an anthropometric index to evaluate dyslipidemia (25). However, among these traditional obesity indicators and new obesity indicators, which is better associated with hypertension, diabetes and dyslipidemia, and its cut-off value needs to be further studied in Chinese population.
Therefore, this study chose BF% as the gold standard of obesity indicators, to explore the consistency of other standards, and investigate the cut-off value of each indicator in Ningxia rural adults and their relationship with obesity-related diseases, such as hypertension, diabetes, and dyslipidemia.
2 Materials and methods
2.1 Study population
Data for this study was obtained from a population-based cohort study conducted at Ningxia Medical University between March 2018 and May 2019, comprising a random sample of more than 14,926 men and women aged 35 to 74 years in Pingluo County, Shizuishan City and Qingtongxia City, Wuzhong City in Ningxia.
2.2 Inclusion and exclusion criteria
Inclusion criteria were (i) male and female adults aged between 35 and 74 (born between 1943 and 1982), (ii) registered permanent residents in the selected investigation sites (those who stay at home for more than five months throughout the year), (iii) no serious physical disability and are able to communicate normally; (iv) registration report of morbidity and death of the disease belongs to the administrator of the local health department. Exclusion criteria were: (i) participants who planned to leave the local area for various reasons within the past year and could not be followed up, (ii) have been seriously ill or hospitalized in the last two weeks, (iii) pregnant or breastfeeding women.
The sample size was calculated using n=400*(q/p). Previous research results showed that the prevalence rate of diabetes among adults in rural areas of Ningxia was 4.21%, and the sample size for this study was about 9,102. According to the inclusion and exclusion criteria, 14,926 participants were finally included in the study.
All participants met the above four inclusion criteria to formally participate in the study and provided written informed consent. All investigations were performed in accordance with the Declaration of Helsinki and approved by the Ethical Committee of Ningxia Medical University. The specific process is shown in Figure 1.
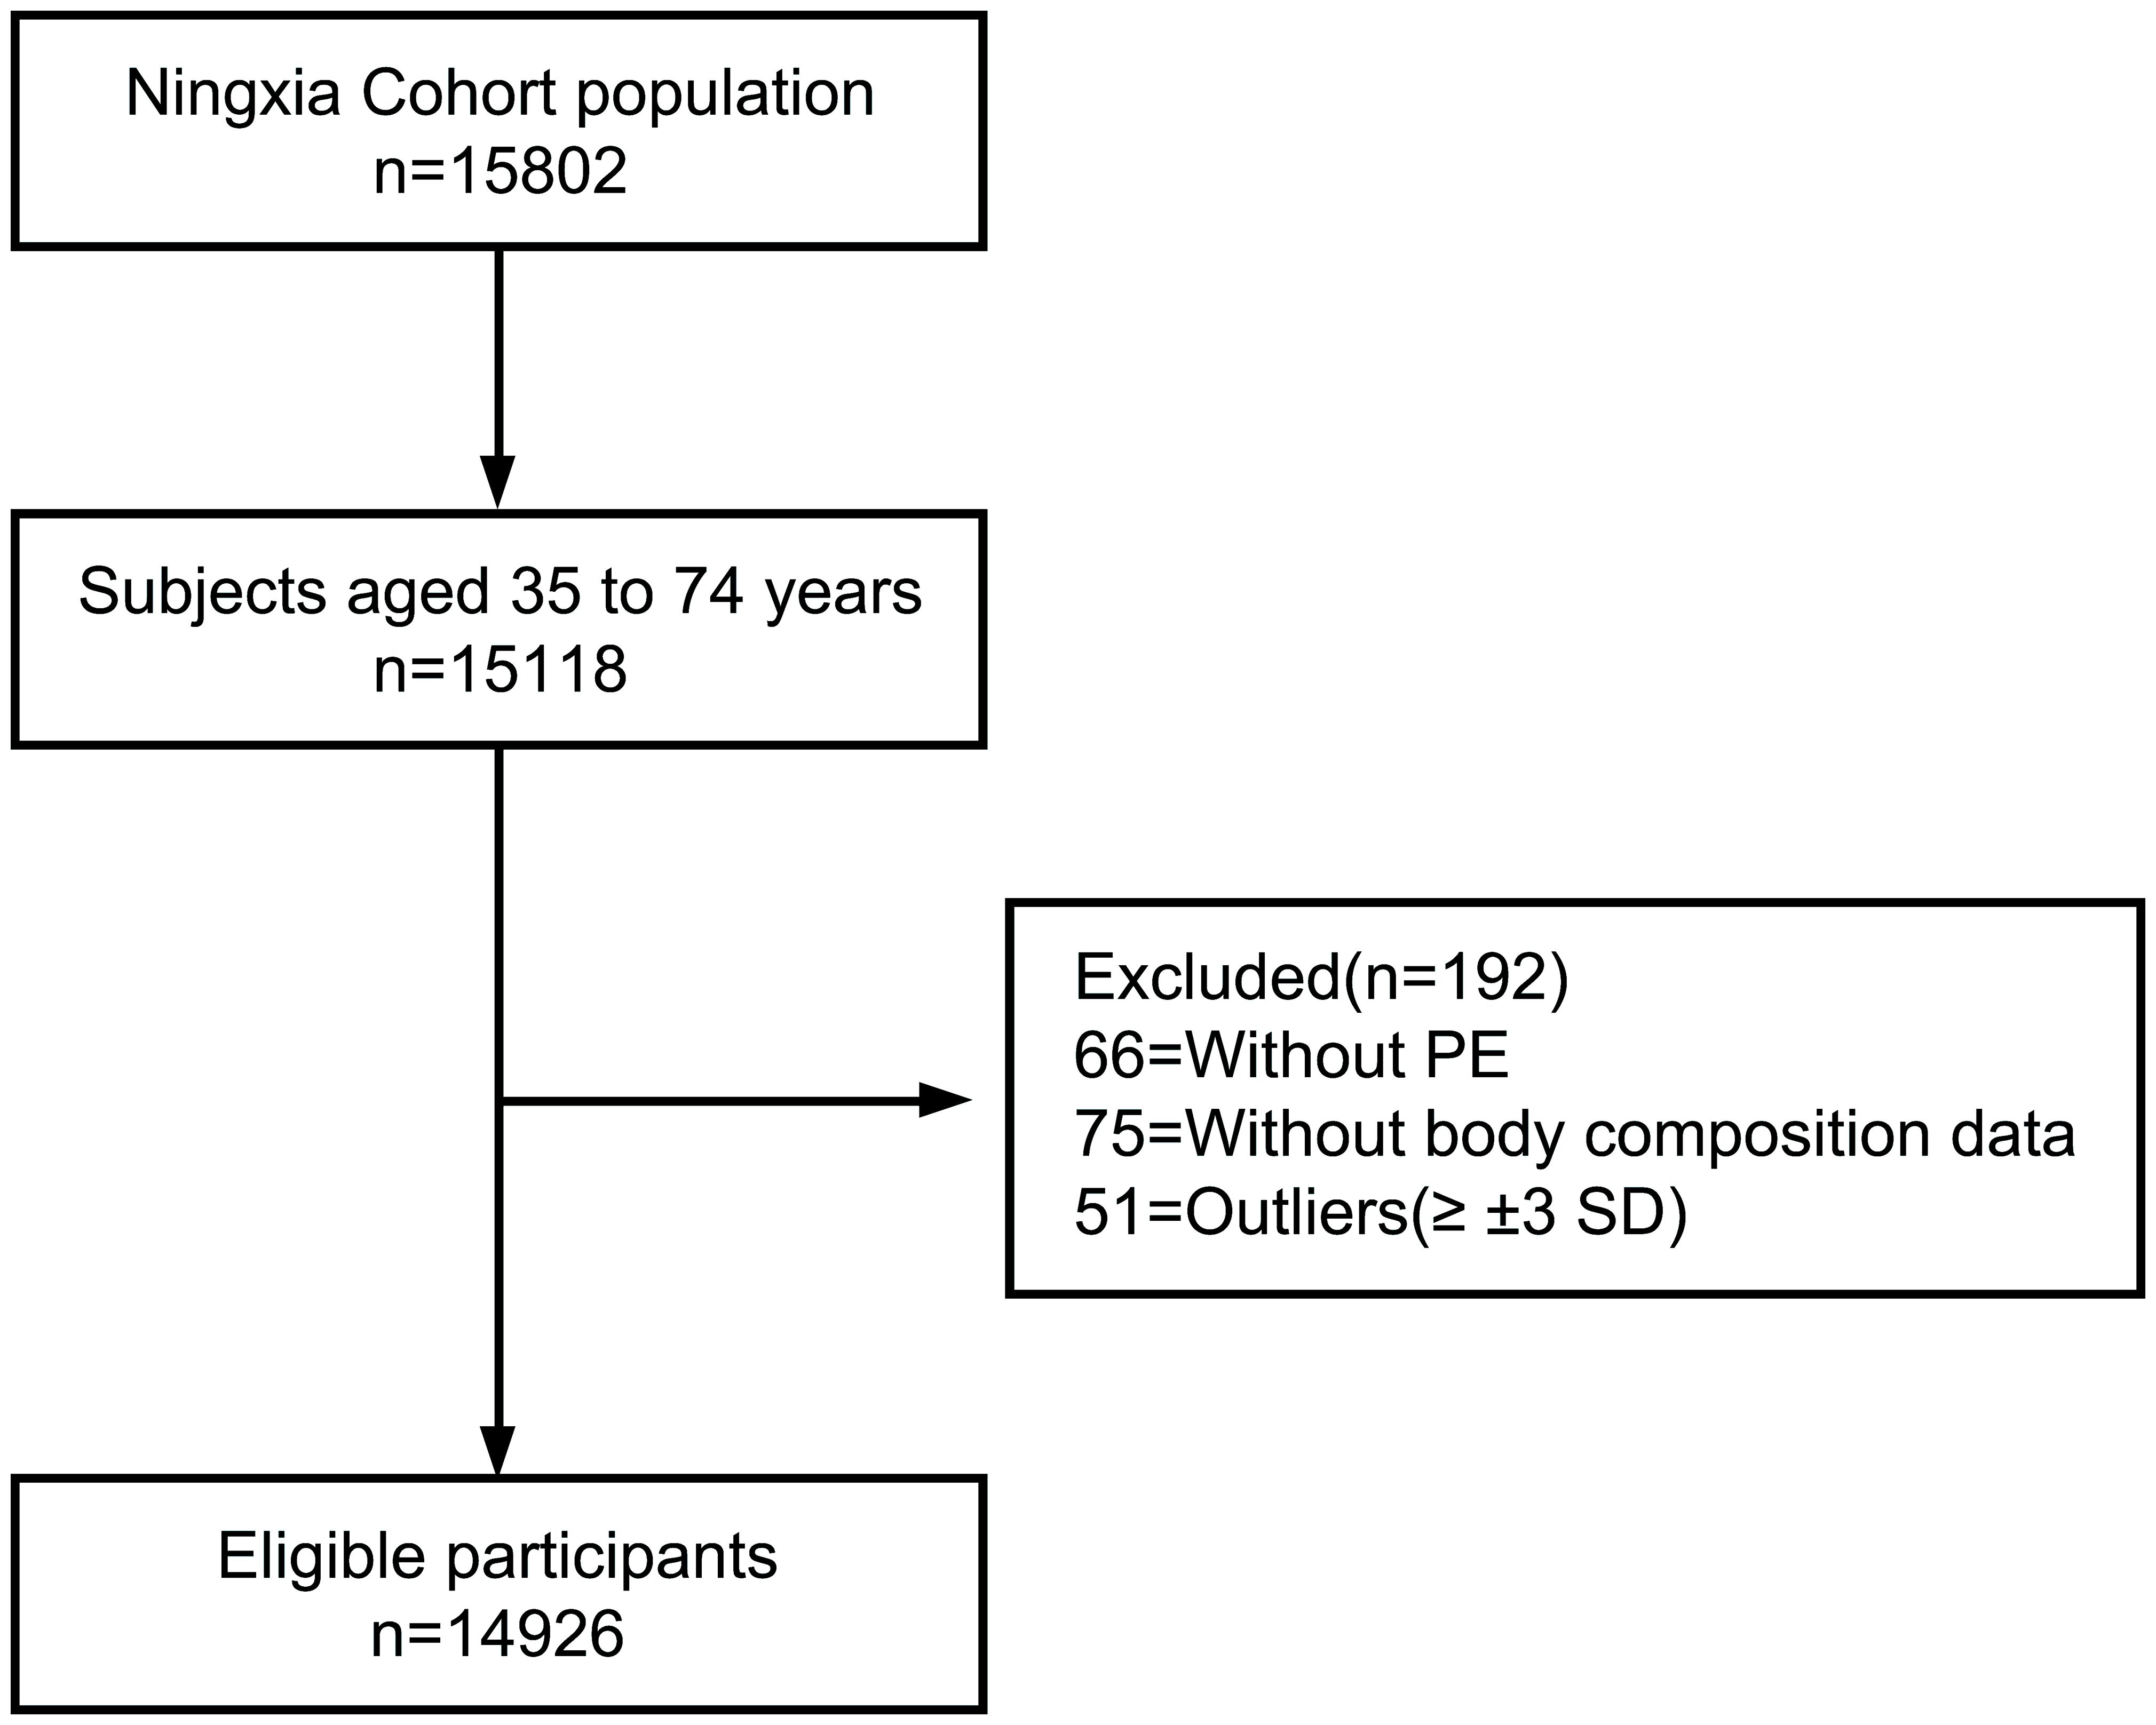
Figure 1. Respondent screening process for the participants.
2.3 Data collection
All participants underwent a questionnaire interview to collect demographic data, followed by a physical examination for anthropometric variables. After blood samples were sent to the clinical laboratory testing department, biochemical measurements were performed according to standard laboratory procedures. All operations were performed by trained investigators and processed by trained and experienced laboratory technicians.
The studies involving human participants were reviewed and approved by the Ethics Committee of Ningxia Medical University (No. 2018-021). All participants provided their written informed consent to participate in this study.
2.4 Variables
2.4.1 Demographic data
After providing informed consent, all participants were interviewed by questionnaire to obtain demographic data, such as age, sex, marital status, education status, economic status, and certain lifestyle variables, including exercise frequency, whether they smoked or not, and their alcohol, tea, spice, and vinegar consumption. Each participant was given a study identification (ID) number to ensure prevention bias.
2.4.2 Anthropometric variables
The anthropometric variables were measured by well-trained investigators. Body height (cm) was measured, in light clothing and without shoes, with a height bar. Brachial artery blood pressure and pulse were measured using an electronic sphygmomanometer. Each measurement was repeated twice; if the measured values were within 0.5 cm of one another, their average was calculated. If the difference between the two measurements exceeded 0.5 cm, then a third measurement was conducted. Weight, BMI, waist circumference, neck circumference, and other anthropometric variables were acquired using a bioelectrical impedance analyzer (BIA; Inbody Co., Seoul, Korea), according to manufacturer guidelines. The BIA calculates the resistance of body tissues to an electrical signal sent through the hands and feet. Participants removed extra clothes, such as shoes, coats, sweaters, and metal accessories, such as earrings, rings, and watches, and stood on a balance scale with bare feet and grasped the handles of the BIA. The examination took approximately 30 s.
2.4.3 Biochemical variables
Blood samples were obtained between 8:00 and 10:00 am, following overnight fasting, and were used to perform biochemical analyses by means of standard laboratory enzymatic methods. These analyses included fasting blood glucose (FBG, mmol/L), total cholesterol (TC, mmol/L), triglyceride (TG, mmol/L), high-density lipoprotein cholesterol (HDL-C, mmol/L), and low-density lipoprotein cholesterol (LDL-C, mmol/L) levels. The serum was centrifuged, aliquoted, and stored at -80°C.
2.5 Diagnostic standards
2.5.1 Definitions of obesity
Ten definitions of obesity were compared: (i) Body fat ratio: Derived from the results of the bioelectrical impedance analyzer. (ii) The WHO definition of BMI (kg/m2), , BMI greater than 25.0 were considered obese for Asians. (iii) , if the Waist-to-hip ratio (WHR) greater than 0.8 in women or 0.9 in men, it was defined as central obesity. (iv) , Waist-to-height ratio (WHtR), WHtR greater than 0.5 was identified as a cut-off value for obesity in this study. (v) , Body adiposity index (BAI). (vi) , , Obesity degree (OBD), participants who exceeded 20% of the standard weight were diagnosed as obese. (vii) Conicity index (CI), . (viii) Abdominal volume index (AVI),
(ix) A body shape index (ABSI), . (x) Body roundness index (BRI), . As shown in Graphical Abstract.
2.5.2 Definitions of hypertension, diabetes, and dyslipidemia
The diagnosis of hypertension was based on the criteria recommended by Guidelines for hypertension management in the elderly in China (2023) (26), defined as systolic blood pressure ≥140 mmHg and diastolic blood pressure ≥90 mmHg. According to China National Guidelines for Prevention and Treatment of Diabetes Mellitus (2022) (27), FPG ≥7.0 mmol/L was considered as diabetes mellitus. The diagnosis for dyslipidemia refers to Chinese Lipid Management Guidelines (2023) (28), patients with hypercholesterolemia (TC≥5.20 mmol/L), hypertriglyceridemia (TG≥1.70 mmol/L), or low-high-density lipoprotein cholesterolemia (HDL-C< 1.00 mmol/L) were diagnosed with dyslipidemia.
2.6 Statistical analyses
Absolute number (percentage, %) and mean ± standard deviation (SD) were used describe the categorical data. Chi-Square test for categorical data and t-test for continuous data were used to compare the difference between different groups. Pearson correlation was used for correlation analysis. Receiver operating characteristic (ROC) analyses were then used to calculate the area under the ROC curves (AUC) between dyslipidemia and anthropometric measures, adjusted for age and sex. All analyses were performed using SPSS statistical software version 26.0. All tests were 2-tailed, and P< 0.05 was considered statistically significant.
3 Results
3.1 Demographic and clinical characteristics of the study participants
Totally 15,802 participants were enrolled, after the exclusion of individuals younger than 35 years or older than 74 years, and missing data on physical examination questionnaire (including age, Marital status, level of education, et al.) and body composition data (including weight (kg), height (m), SBP (mmHg), et al.), 14,926 participants were included finally. The basic characteristics of the study population are shown in Figure 1.
Among the participants, 39.80% (5948/14,926) were male, the mean age of the study population was 56.75 ± 9.74 years, most of them were married (93.4%) and only had a primary school education (67.3%), and females showed less smoking and alcohol consumption, and more tea and vinegar consumption, compared to men. Males tended to have higher anthropometric measures, such as the neck circumference, waist circumference, arm and thigh circumference (all P<0.001). For the obesity indicators, BMI showed no significant difference between males and females in this study, and WHR showed little statistical difference (P=0.015). BF%, WHtR, BAI, and CI were higher in females than males, OBD, AVI, and BRI were higher in males than females, and ABSI was almost the same both groups (all P<0.05). Regarding biochemical status, males tended to have higher blood pressure and FBG levels, females has higher TC, HDL-C, and LDL-C levels (all P<0.001), and TG showed no statistically significant difference between the two groups (Table 1).
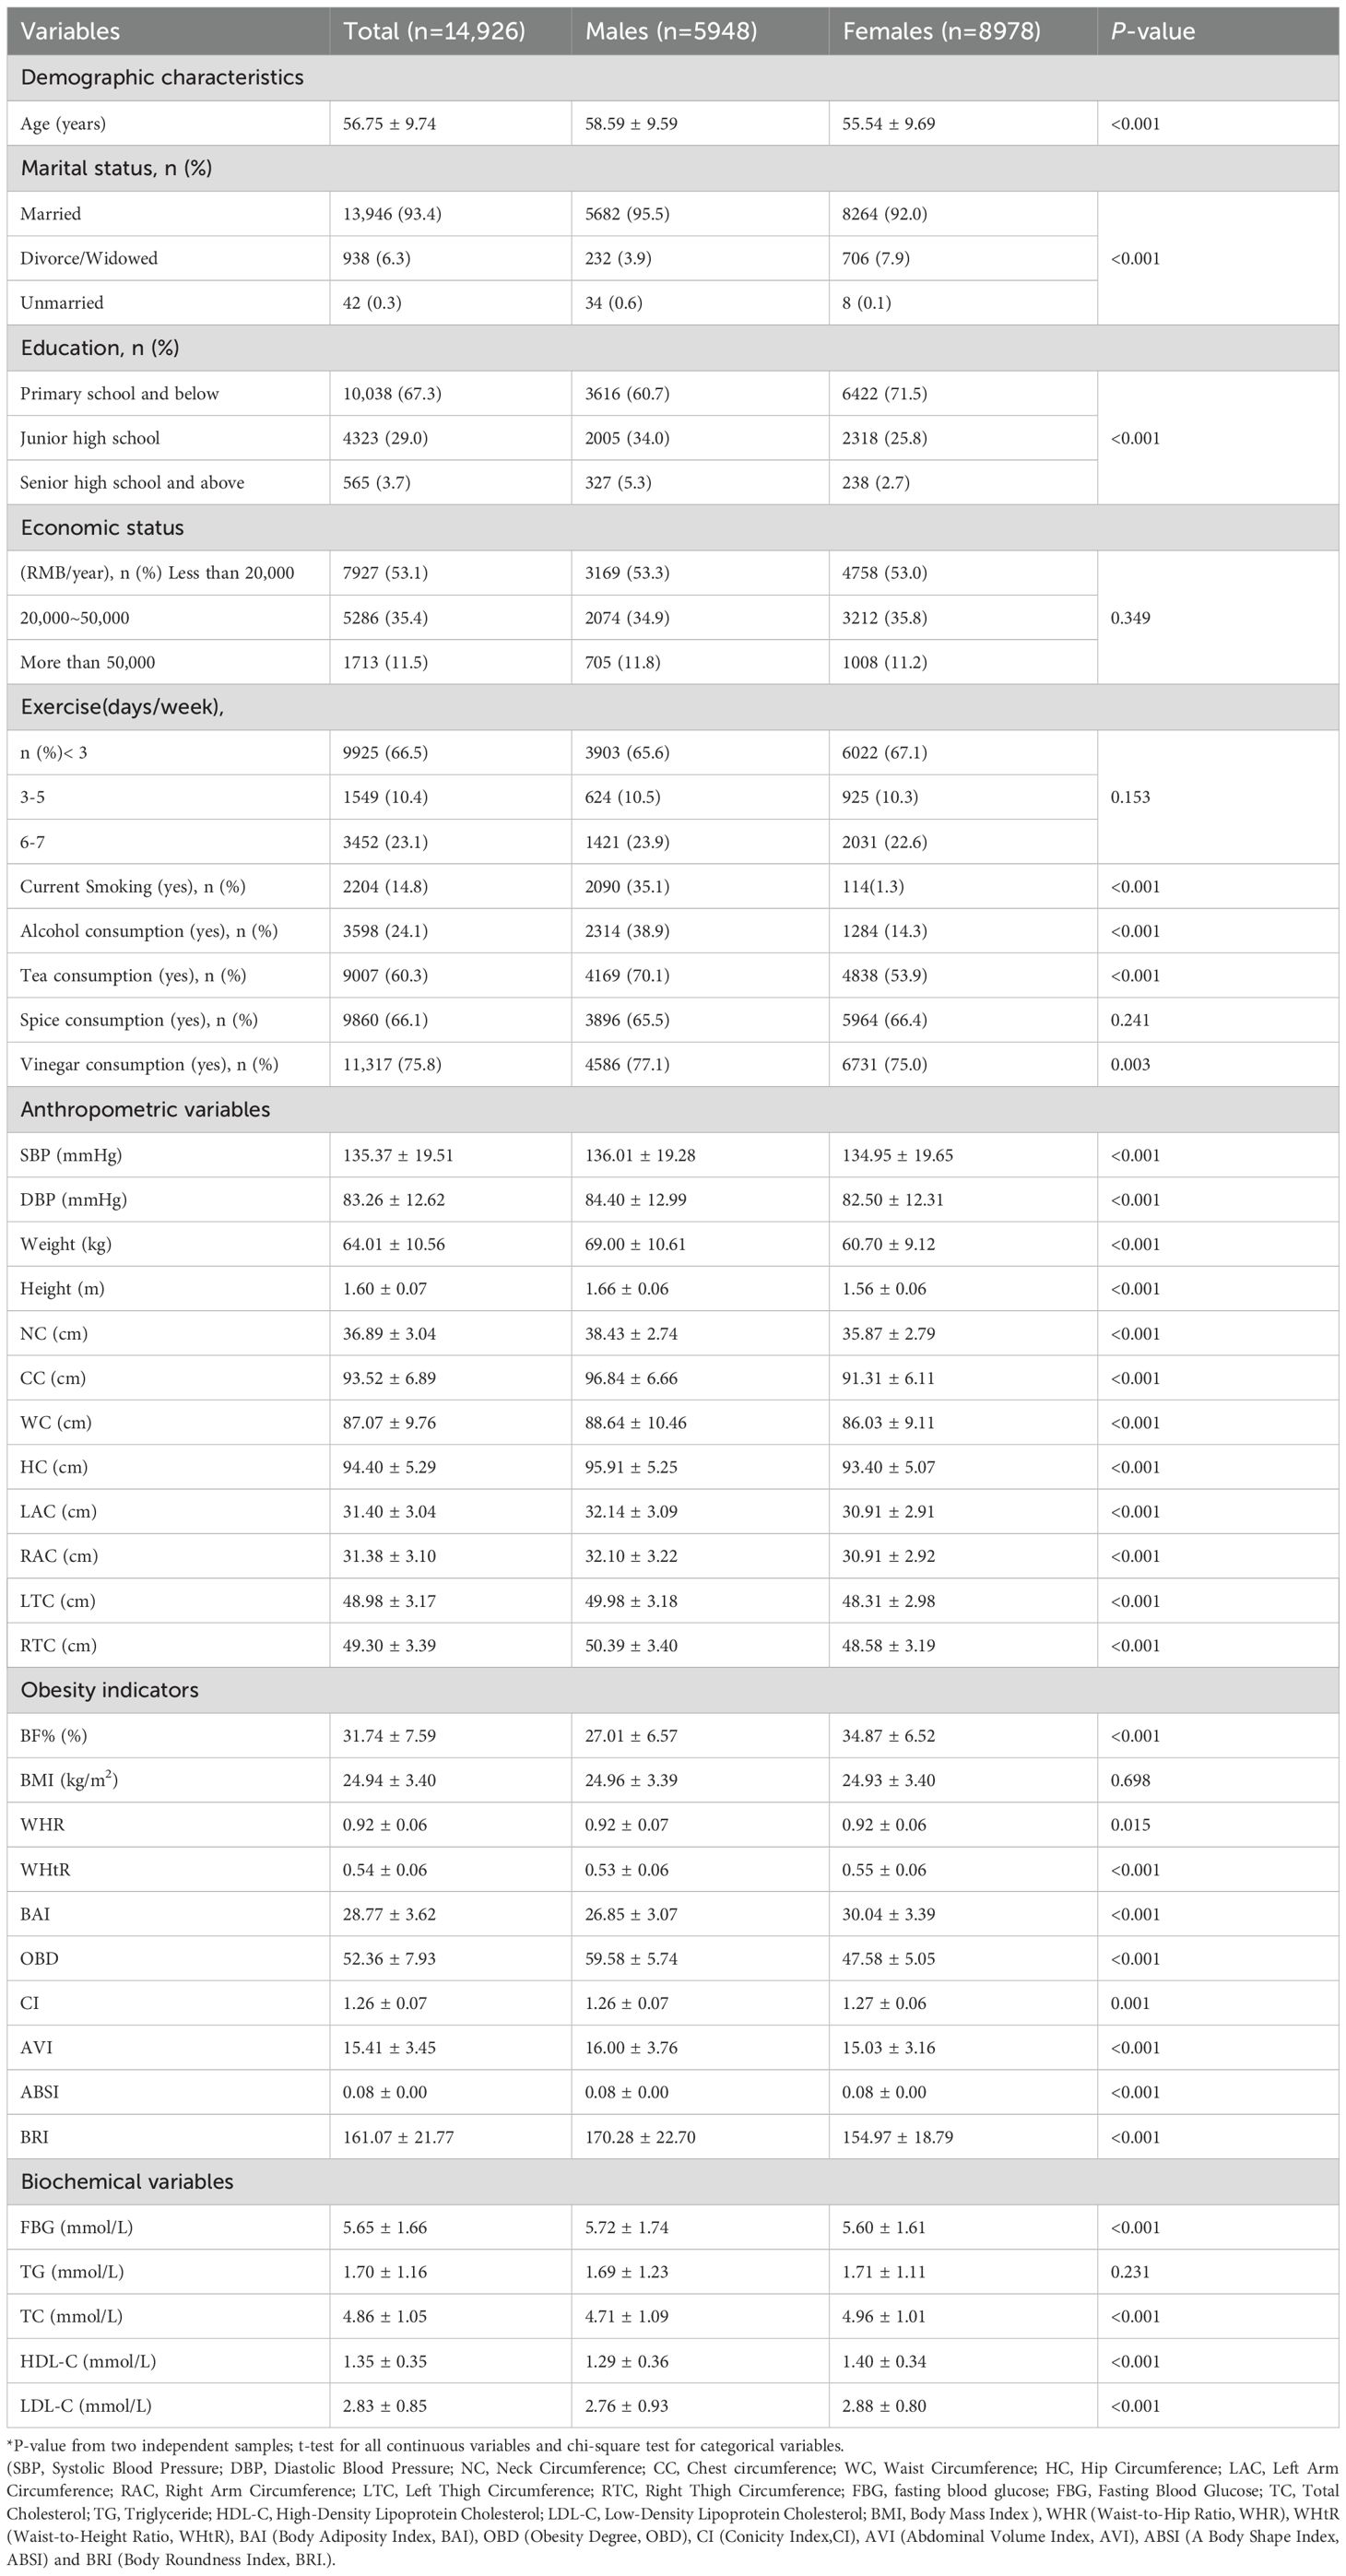
Table 1. Basic characteristics of study subjects.
3.2 Correlation between obesity indicators and anthropometric and biochemical variables
Pearson’s correlation coefficients were used to measure the correlation between obesity indicators and anthropometric and biochemical variables (Table 2). Anthropometric measures, such as waist circumference, left and right arm circumference, were significantly correlated with obesity indicators (all P<0.001). Among them, BMI was affected by nine anthropometric measures in addition to height, most closely associated with hip circumference, left and right arm circumference. AVI and BRI were also affected by seven measures in addition to height and thigh circumference, AVI most influenced by waist circumference, left and right arm circumference, while BRI associate closely to weight, waist circumference and chest circumference. Meanwhile, waist circumference had the most influence on obesity assessment indicators, including BMI, WHR, WHtR, CI, AVI and BRI, height correlated best with OBD. Biochemical variables showed lower correlation coefficients with obesity indicators, only blood pressure may had little effect.
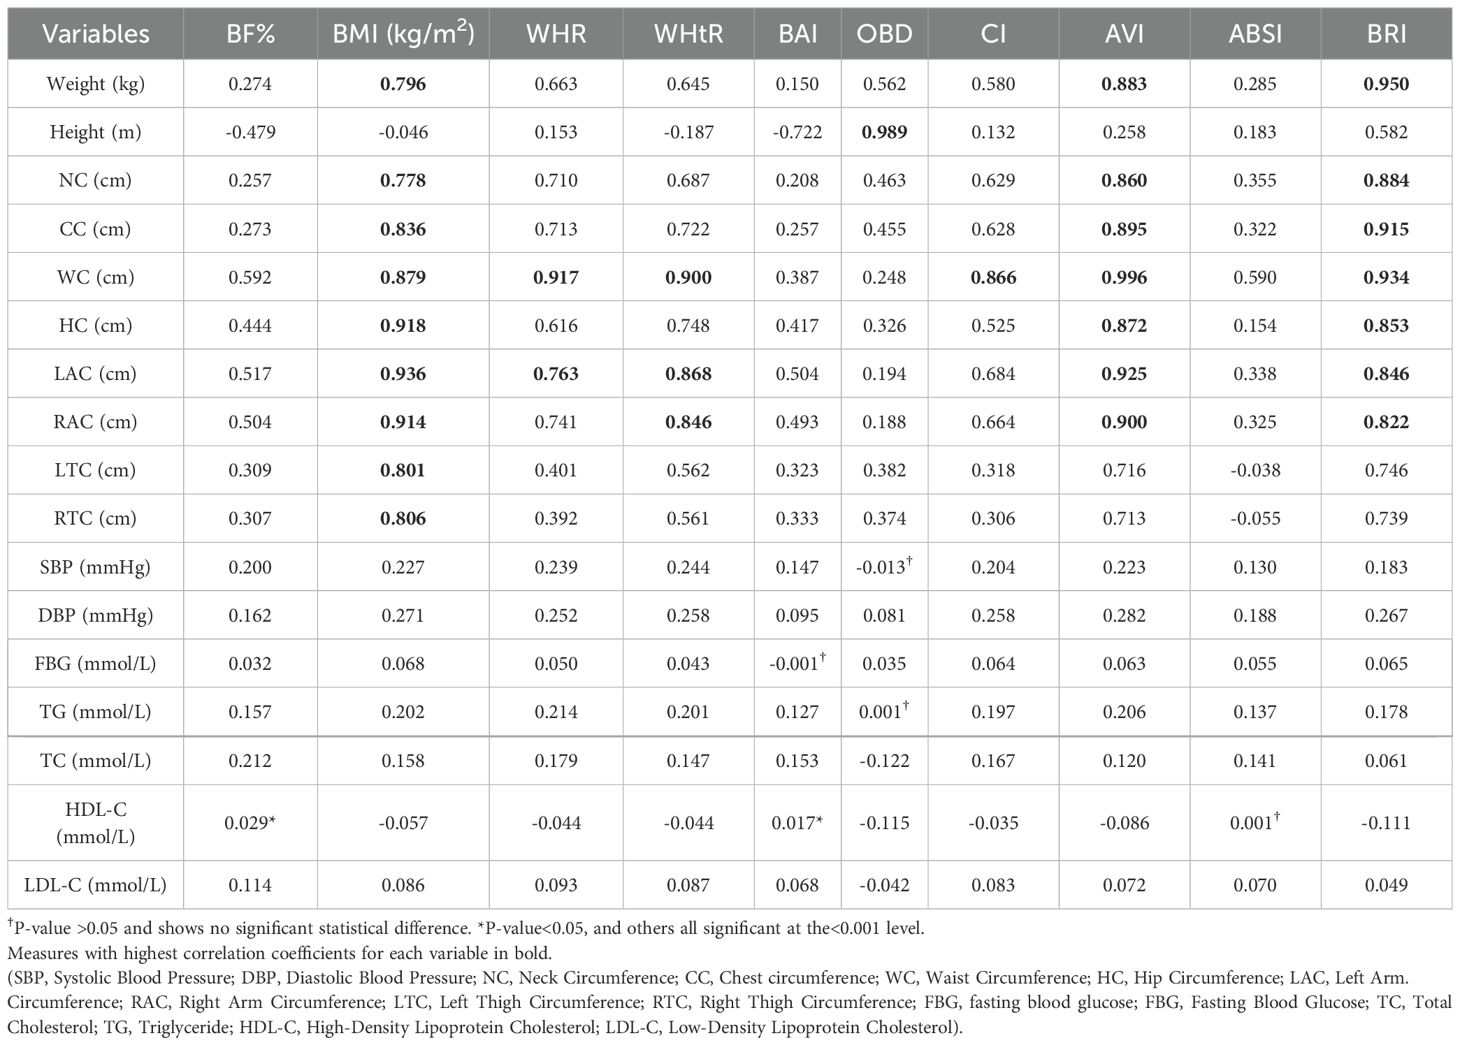
Table 2. Correlation between obesity indicators and anthropometric and biochemical variables.
3.3 Cut-off points between different obesity indicators in population
The Area Under the ROC Curves (AUC) between different obesity indicators after adjusting for sex are shown in Table 3. The objective was to investigate the predictive value of alternative obesity indicators, and determine the optimal cut-off value that best balanced sensitivity and specificity, relative to BF%. This study shows that WHtR had the largest AUC for predicting obesity in both sexes, the cut-off value is 0.52 for males and 0.55 for females. Followed by BMI and AVI, the cut-off value is 24.35 and 14.87 for males, 24.85 and 14.79 for females. In the whole population, the sensitivity and specificity of BMI and WHtR cut-off estimation were better, AVI was more suitable for males. OBD showed no significant diagnostic value. Men have higher values for BAI, OBD, AVI, and BRI, and lower values for BMI, WHR, and WHtR, compared to females, ABSI has the same as the cut-off point of 0.08 in both sexes.
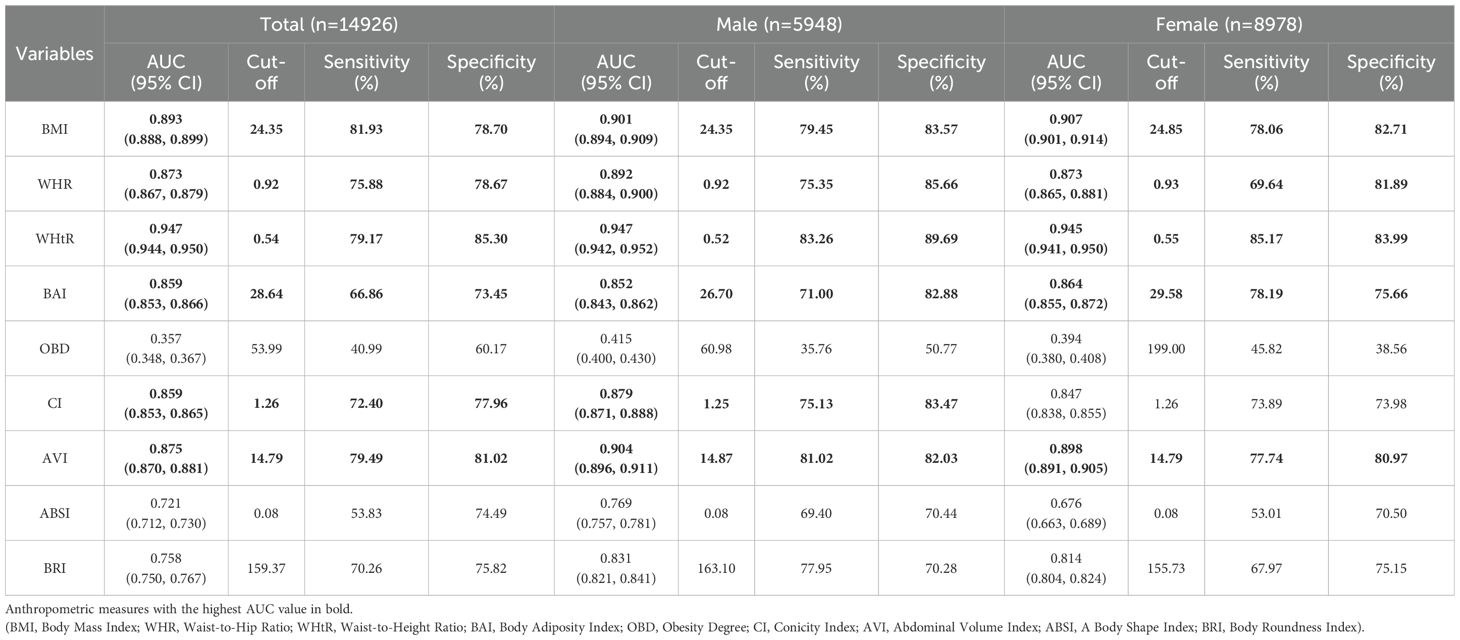
Table 3. Adjusted AUC and cut-off points, sensitivity, and specificity between different obesity indicators in population.
3.3 Diagnostic value of different indicators in hypertension, diabetes and dyslipidemia
The AUC for hypertension, diabetes, and dyslipidemia and the different obesity indicators are shown in Table 4. Overall, the accuracy of each obesity indicator in predicting hypertension, diabetes, and dyslipidemia was not very high (all AUC<0.7). WHtR and BMI had the same AUC for hypertension (0.606, 95%CI: 0.595, 0.617) and diabetes (0.573, 95%CI: 0.552, 0.594) while WHtR also had high predictive level for dyslipidemia (0.625, 95%CI: 0.616, 0.635) (all P<0.001). The AUC of other obesity evaluation indicators, including BAI, OBD, CI, AVI, ABSI and BRI, were all around 0.5, suggesting low predictive value.
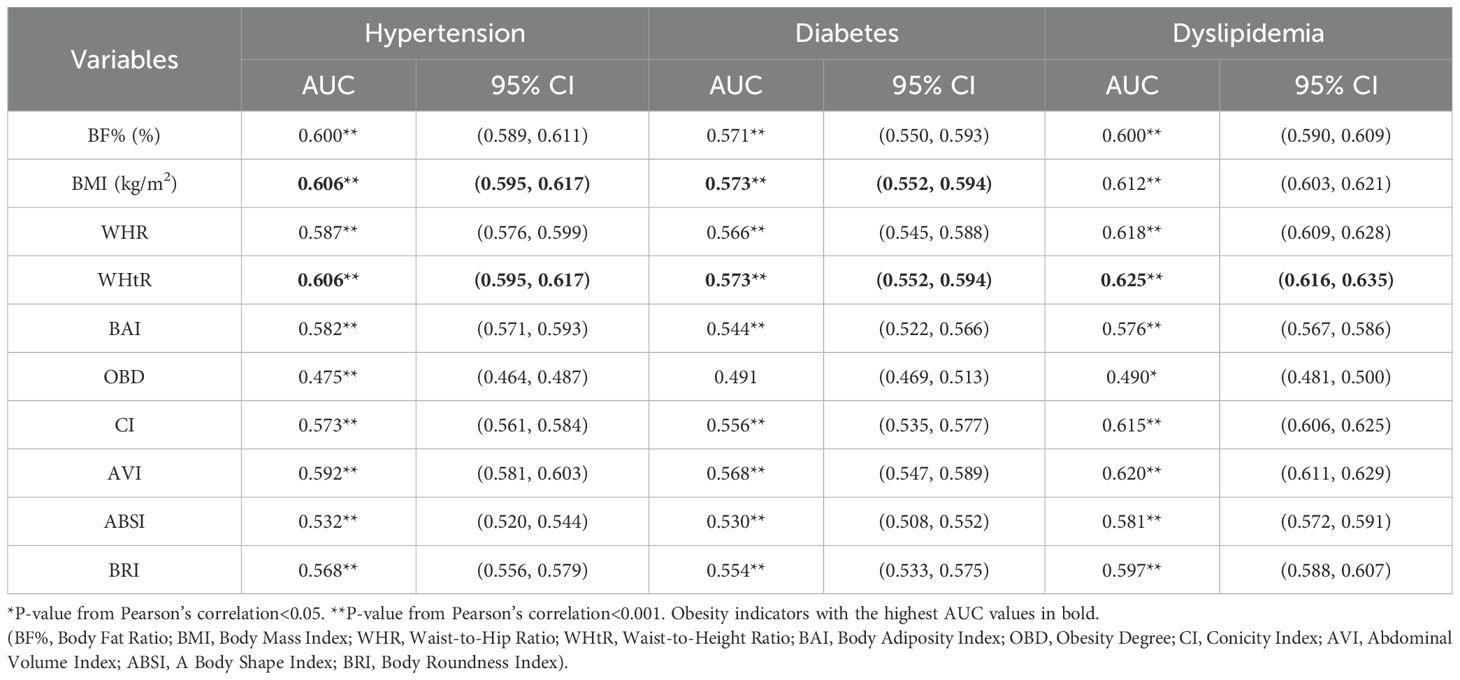
Table 4. Adjusted AUC of different obesity indicators evaluating hypertension, diabetes, and dyslipidemia.
4 Discussion
Obesity is a chronic, non-communicable condition in which body fat accumulates excessively and impairs physical and mental health, leading to lower quality of life and shorter life expectancy (29). The pathogenesis of obesity is related to genetic factors, neuropsychiatric factors, hyperinsulinemia and abnormal brown adipose tissue. Leptin is a protein encoded by the ob gene and is a hormone synthesized and secreted by fat cells (30). The changes of leptin and orexin are involved in the pathogenesis of obesity. They are two opposite polypeptides that mainly act on the hypothalamus. Leptin reduces appetite, increases energy consumption and reduces weight, while orexin stimulates eating behavior and leads to obesity. Mental factors often affect appetite, the function of the feeding center is subject to the mental state, when the mental stress is excessive and the sympathetic nerve or adrenergic nerve is stimulated (especially α receptor dominated), appetite is suppressed, while the vagus nerve excites and insulin secretion increases, appetite is often hyperactive (31). The brown adipose tissue was mainly distributed in the interscapular, neck and back, armpit, mediastinum and around the kidney, with light brown appearance and relatively small cell volume change (32). Brown adipose tissue is a thermogenic organ in function, and β3 adrenergic receptor is mainly expressed in brown fat, which is involved in the regulation of energy balance and fat storage through its thermogenic and lipolysis promoting effects. β3 adrenergic receptor gene mutation has impaired its expression in brown fat and significantly weakened its thermogenic and lipolysis promoting effects, and increased fat storage leads to obesity (33). Overeat produces too much gastric inhibitory peptide (GIP) through stimulation of the small intestine, which stimulates the release of insulin by islet beta cells. At the same time, high plasma insulin levels in obese patients can stimulate increased eating and inhibit lipolysis, causing fat accumulation in the body (34). This several factors contribute to obesity and evaluated by different obesity indicators.
This study assessed the different indicators of obesity in adults aged 35–74 years in Ningxia rural residents. In recent years, with the rapid economic development and the improvement of living standards, there have been great changes in dietary structure and lifestyle habits, physical activity and exercise have reduced gradually, and the incidence of obesity is increasing and is a serious health concern (35, 36). The prevalence of hypertension, diabetes, and dyslipidemia is increasing significantly worldwide (37–39). The prevention and treatment of obesity-related disorders is crucial, and health concerns, such as cardiovascular disease, have increased significantly. Serious cardiovascular events and related complications have affects the physical health of patients and places a heavy burden on families and society (40, 41). Therefore, it is very important to diagnose obesity earlier, and to take preventive measures to control and reduce the adverse consequences. It is necessary to develop simple, effective, and reliable screening criteria for early detection. At present, there are many indicators for diagnostic obesity, but these approaches are not uniform (42–44). This study included ten obesity indicators to explore their correlation with body measurement indicators and their cut-off values, and investigate potential relationships with hypertension, diabetes, and dyslipidemia.
Bioelectrical impedance, as a widely used method to measure human body composition, has been recognized in many medical circles (45). This study showed that the anthropometric measures were higher in men than in women, and Body Mass Index (BMI) showed no statistical significance differences between the two groups. This may be because the BMI is based on height and weight, cannot distinguish the degree of fat and muscle (46). The differences in indicators between men and women were statistically significant, suggesting that gender may be discussed in the subsequent formulation of relevant cut-off values.
Based on the correlation between obesity indicators and anthropometric and biochemical variables, waist circumference has the most influence, and some studies show that the obesity of Chinese people is mainly abdominal obesity. Related studies have pointed out that abdominal obesity is characterized by abdominal fat accumulation, which is more closely related to cardiovascular risk factors than subcutaneous adipose tissue (47). Therefore, obesity indicators should be combined with those of abdominal obesity in order to monitor the health level of the population more comprehensively. Among the various obesity indicators in this study, the calculations of Waist to hip ratio (WHR), Waist to height ratio (WHtR), Conicity index (CI), Abdominal volume index (AVI) and Body roundness index (BRI) were all related to waist circumference, among them, AVI was most significant, and also closely related to arm circumference found in this study. Studies have shown that AVI is primarily used to assess the accumulation of visceral fat, is strongly associated with impaired glucose tolerance and type 2 diabetes, and is considered a predictor of metabolic syndrome in adolescents, and suitable for community public health monitoring (48, 49). Obesity degree (OBD) did not show significant effect in this study, which may be because this indicator is mainly calculated by height, and height does not show significant influence on various obesity indicators. A large accumulation of visceral fat in obese people will produce free fatty acids and increase TG synthesis, and excessive accumulation of visceral fat will change lipase activity and increase cholesterol synthesis, leading to dyslipidemia (50). Central obesity, which is measured by waist circumference, has a greater impact on dyslipidemia (51). Studies have shown that higher ABSI indicates higher abdominal fat deposits, ABSI is closely related to visceral fat, and is positively correlated with waist circumference in both men and women (52).
Body Fat ratio (BF%) can accurately reflect the body fat content, distinguishing whether an increase in body mass is due to fat or muscle, which is considered the gold standard for evaluating obesity, and lipid molecules can affect the elastic function and structure of blood vessels, resulting in abnormal elasticity and structure of arterial blood vessels, and then cause the increase of systolic or diastolic blood pressure. Our study showed that the BF% in females was significantly higher than males, which may be related to the differences in physiological characteristics between the different sexes. Sex hormones are important factors involved in regulating fat storage, distribution, and decomposition in the body (53, 54).
Waist to height ratio WHtR had the largest AUC for predicting obesity in both gender, followed by BMI and AVI. WHtR has certain evaluation effect on hypertension and dyslipidemia in participants, which is the most suitable index for reflecting body fat distribution and central obesity, and a strong predictor of hypertension-diabetes comorbidity in adults (55). Fat accumulation in the upper body is more likely to cause diabetes and hypertension than that accumulated in the lower body. Moreover, upper body fat may directly affect fatty acids and lipid metabolism throughout the body (56, 57). Although BF% is considered the gold standard for obesity, in view of the equipment for measuring body composition is generally expensive and not suitable for handling, it is inconvenient for practical application (58). WHtR is relatively simple, and is suitable for large-scale screening of population.
This study investigated the cut-off values of different obesity indicators, which can be used as a reference for subsequent research. The use of a combination of indicators is recommended when assessing obesity, together with the fat distribution, to increase the accuracy of predicting cardiovascular disease. According to the status of each obesity diagnosis indicators, intervention to improve physical fitness and the quality of life is important (59–61).
5 Conclusion
The study shows that abdominal obesity is the main type of Ningxia rural adults. BMI, AVI and BRI were most affected by anthropometric indicators, especially waist circumference and arm circumference. WHtR is a suitable measure of body fat distribution and central obesity, the cutoff value is 0.52 for males and 0.55 for females. The study suggests population to pay attention to their waist circumference, to prevent cardiovascular diseases, and also could be used to monitor community health.
5.1 Limitations
Based on the analysis of anthropometric index data of residents in Ningxia, Northwest China, the application and cut-off value of ten obesity evaluation indicators first explored based on the body composition measurement instrument of bioelectrical impedance. This study preliminarily discussed the relationship between obesity index and related diseases, and provided basic research information for the prevention and control of obesity, hypertension, diabetes and dyslipidemia more effectively in this region and country. However, there are some limitations in this study. Firstly, part of the data collection process (such as lifestyle) is carried out by the subjects. self-reported, bias may have affected survey responses. Second, this study was only conducted on residents in rural areas of Ningxia, and due to the differences in population composition, economic level and living habits, these findings should be applied with caution to other areas. Third, population of this study only included rural residents aged 35-74. At present, we have carried out a survey of the population aged over 18 and included the urban population, stratified analysis of different indicators at different ages will be conducted to make up for the shortcomings of this study. Fourth, this study only used the baseline data of the cohort study for analysis, and the causal relationship could not be obtained. This study preliminarily discussed the relationship between obesity indicators and related diseases, and the design and analysis need to be further improved in subsequent studies.
Data availability statement
The datasets presented in this article are not readily available because The data that support the findings of this study are available from National Key Research and Development Program of China, China Northwest General Population Cohort. Restrictions apply to the availability of these data, which were used under license for this study. Data are available from the authors with the permission of project unit university. Requests to access the datasets should be directed to Yi Zhao, emhhb3lpNzUxMTE0QGhvdG1haWwuY29t.
Ethics statement
The studies involving humans were approved by Ethics Committee of Ningxia Medical University (No. 2018-021). The studies were conducted in accordance with the local legislation and institutional requirements. The participants provided their written informed consent to participate in this study. Written informed consent was obtained from the individual(s) for the publication of any potentially identifiable images or data included in this article.
Author contributions
TY: Conceptualization, Data curation, Formal analysis, Funding acquisition, Investigation, Methodology, Resources, Validation, Visualization, Writing – original draft, Writing – review & editing. JW: Data curation, Visualization, Software, Writing – review & editing. XL: Data curation, Methodology, Writing – review & editing. JQ: Conceptualization, Data curation, Investigation, Methodology, Writing – review & editing. JZ: Data curation, Investigation, Writing – review & editing. QW: Data curation, Investigation, Writing – review & editing. YiZ: Data curation, Investigation, Methodology, Project administration, Supervision, Visualization, Writing – review & editing. YuZ: Conceptualization, Methodology, Project administration, Resources, Supervision, Validation, Writing – review & editing. TM: Investigation, Writing – original draft.
Funding
The author(s) declare that financial support was received for the research and/or publication of this article. This work was support by Ningxia Medical University talent launch project (XT2022013) and Key Project of Ningxia Key Research and Development Program (2021BEG02026).
Acknowledgments
We sincerely thank all the field staff and participants for their contributions.
Conflict of interest
The authors declare that the research was conducted in the absence of any commercial or financial relationships that could be construed as a potential conflict of interest.
Publisher’s note
All claims expressed in this article are solely those of the authors and do not necessarily represent those of their affiliated organizations, or those of the publisher, the editors and the reviewers. Any product that may be evaluated in this article, or claim that may be made by its manufacturer, is not guaranteed or endorsed by the publisher.
References
1. Piché ME, Tchernof A, and Després JP. Obesity phenotypes, diabetes, and cardiovascular diseases. Circ Res. (2020) 126:1477–500. doi: 10.1161/CIRCRESAHA.120.316101
2. Franzago M, Pilenzi L, Di Rado S, Vitacolonna E, and Stuppia L. The epigenetic aging, obesity, and lifestyle. Front Cell Dev Biol. (2022) 10:985274. doi: 10.3389/fcell.2022.985274
3. Malandrino N, Bhat SZ, Alfaraidhy M, Grewal RS, and Kalyani RR. Obesity and aging. Endocrinol Metab Clin North Am. (2023) 52:317–39. doi: 10.1016/j.ecl.2022.10.001
4. Li J, Shi Q, Gao Q, Pan XF, Zhao L, He Y, et al. Obesity pandemic in China: epidemiology, burden, challenges, and opportunities. Chin Med J (Engl). (2022) 135:1328–30. doi: 10.1097/CM9.0000000000002189
5. Li Y, Wang N, Ge W, Ding B, Wang J, Hong Z, et al. Association study between cereal intake and the risk of overweight and obesity among adult residents in China. Food Nutri China (Chinese). (2025) 31(4):88–93. doi: 10.19870/j.cnki.11-3716/ts.2025.04.001
6. Chen K, Shen Z, Gu W, Lyu Z, Qi X, Mu Y, et al. Prevalence of obesity and associated complications in China: A cross-sectional, real-world study in 15.8 million adults. Diabetes Obes Metab. (2023) 25:3390–9. doi: 10.1111/dom.15238
7. De Jesus A, Keyhani-Nejad F, Pusec CM, Goodman L, Geier JA, Stoolman JS, et al. Hexokinase 1 cellular localization regulates the metabolic fate of glucose. Mol Cell. (2022) 82:1261–1277.e9. doi: 10.1016/j.molcel.2022.02.028
8. Tappy L. Metabolism of sugars: A window to the regulation of glucose and lipid homeostasis by splanchnic organs. Clin Nutr. (2021) 40:1691–8. doi: 10.1016/j.clnu.2020.12.022
9. Yan J and Horng T. Lipid metabolism in regulation of macrophage functions. Trends Cell Biol. (2020) 30:979–89. doi: 10.1016/j.tcb.2020.09.006
10. Deprince A, Haas JT, and Staels B. Dysregulated lipid metabolism links NAFLD to cardiovascular disease. Mol Metab. (2020) 42:101092. doi: 10.1016/j.molmet.2020.101092
11. Liu X, Tan Z, Huang Y, Zhao H, Liu M, Yu P, et al. Relationship between the triglyceride-glucose index and risk of cardiovascular diseases and mortality in the general population: a systematic review and meta-analysis. Cardiovasc Diabetol. (2022) 21:124. doi: 10.1186/s12933-022-01546-0
12. Wang JG, Zhang W, Li Y, and Liu L. Hypertension in China: epidemiology and treatment initiatives. Nat Rev Cardiol. (2023) 20:531–45. doi: 10.1038/s41569-022-00829-z
13. Zhang Y, Zhang WQ, Tang WW, Zhang WY, Liu JX, Xu RH, et al. The prevalence of obesity-related hypertension among middle-aged and older adults in China. Front Public Health. (2022) 10:865870. doi: 10.3389/fpubh.2022.865870
14. Chew NWS, Ng CH, Tan DJH, Kong G, Lin C, Chin YH, et al. The global burden of metabolic disease: Data from 2000 to 2019. Cell Metab. (2023) 35:414–428.e3. doi: 10.1016/j.cmet.2023.02.003
15. Compilation group of Clinical Guidelines for the Prevention and Treatment of Type 2 Diabetes in the Elderly in China. Clinical guidelines for the prevention and treatment of type 2 diabetes mellitus in the elderly in China (2022 edition). Chin J Diabetes. (2022) 30:2–51. doi: 10.1016/j.cmet.2023.02.003
16. Zhu J, Zhang Y, Wu Y, Xiang Y, Tong X, Yu Y, et al. Obesity and dyslipidemia in chinese adults: A cross-sectional study in Shanghai, China. Nutrients. (2022) 14:2321. doi: 10.3390/nu14112321
17. Pinheiro ACDB, Filho NS, França AKTDC, Fontenele AMM, and Santos AMD. Sensitivity and specificity of the body mass index in the diagnosis of obesity in patients with non-dialysis chronic kidney disease: a comparison between gold standard methods and the cut-off value purpose. Nutr Hosp. (2019) 36:73–9. doi: 10.20960/nh.1880
18. Awal Y, Mshelia-Reng R, Omonua SO, Odumodu K, Shuaibu R, Itanyi UD, et al. Comparison of waist-height ratio and other obesity indices in the prediction of diabetic peripheral neuropathy. Front Nutr. (2022) 9:949315. doi: 10.3389/fnut.2022.949315
19. Wan H, Wang Y, Xiang Q, Fang S, Chen Y, Chen C, et al. Associations between abdominal obesity indices and diabetic complications: Chinese visceral adiposity index and neck circumference. Cardiovasc Diabetol. (2020) 19:118. doi: 10.1186/s12933-020-01095-4
20. Blus E, Wojciechowska-Kulik A, Majewska E, and Baj Z. Usefulness of new indicators of obesity (BAI and VAI) in estimation of weight reduction. J Am Coll Nutr. (2020) 39:171–7. doi: 10.1080/07315724.2019.1630024
21. Zhang M, Chen J, Gan YN, Ruan BY, Wang X, Liu Y, et al. Diagnostic values of four common methods for adult obesity. Chin Gen Practice. (2017) 20:2732–8. doi: 10.3969/j.issn.1007-9572.2017.22.010
22. Martins CA, do Prado CB, Santos Ferreira JR, Cattafesta M, Dos Santos Neto ET, Haraguchi FK, et al. Conicity index as an indicator of abdominal obesity in individuals with chronic kidney disease on hemodialysis. PloS One. (2023) 18:e0284059. doi: 10.1371/journal.pone.0284059
23. Hu X, Appleton AA, Ou Y, Zhang Y, Cai A, Zhou Y, et al. Abdominal volume index trajectories and risk of diabetes mellitus: Results from the China Health and Nutrition Survey. J Diabetes Investig. (2022) 13:868–77. doi: 10.1111/jdi.13733
24. Nagayama D, Fujishiro K, Watanabe Y, Yamaguchi T, Suzuki K, Saiki A, et al. A body shape index (ABSI) as a variant of conicity index not affected by the obesity paradox: A cross-sectional study using arterial stiffness parameter. J Pers Med. (2022) 12:2014. doi: 10.3390/jpm12122014
25. Nkwana MR, Monyeki KD, and Lebelo SL. Body roundness index, A body shape index, conicity index, and their association with nutritional status and cardiovascular risk factors in South African rural young adults. Int J Environ Res Public Health. (2021) 18:281. doi: 10.3390/ijerph18010281
26. Hypertension Branch of Chinese Geriatric Society, Beijing Association of Hypertension Prevention and Treatment, and National Clinical Medical Research Center for Geriatric Diseases (General Hospital of Chinese People’s Liberation Army, etc.). Guidelines for hypertension management in the elderly in China. Chin J Hypertension. (2023) 31:508–38. doi: 10.16439/j.issn.1673-7245.2023.06.003
27. Clinical guidelines for the prevention and treatment of type 2 diabetes in the elderly in China (2022 edition). Chin J Diabetes. (2022) 30:2–51. doi: 10.3969/j.issn.1006-6187.2022.01.002
28. Wang Z, Liu J, Li J, Wu N, Lu G, Chen Z, et al. Chinese blood lipid management guidelines (2023). Chin J Circ. (2023) 38:237–71. doi: 10.3969/j.issn.1000-3614.2023.03.001
29. Blüher M. Obesity: global epidemiology and pathogenesis. Nat Rev Endocrinol. (2019) 15:288–98. doi: 10.1038/s41574-019-0176-8
30. Obradovic M, Sudar-Milovanovic E, Soskic S, Essack M, Arya S, Stewart AJ, et al. Leptin and obesity: role and clinical implication. Front Endocrinol (Lausanne). (2021) 12:585887. doi: 10.3389/fendo.2021.585887
31. Huang C, AlMarabeh S, Cavers J, Abdulla MH, and Johns EJ. Effects of intracerebroventricular leptin and orexin-A on the baroreflex control of renal sympathetic nerve activity in conscious rats fed a normal or high-fat diet. Clin Exp Pharmacol Physiol. (2021) 48:585–96. doi: 10.1111/1440-1681.13451
32. Saito M, Matsushita M, Yoneshiro T, and Okamatsu-Ogura Y. Brown adipose tissue, diet-induced thermogenesis, and thermogenic food ingredients: from mice to men. Front Endocrinol (Lausanne). (2020) 11:222. doi: 10.3389/fendo.2020.00222
33. Cero C, Lea HJ, Zhu KY, Shamsi F, Tseng YH, and Cypess AM. β3-Adrenergic receptors regulate human brown/beige adipocyte lipolysis and thermogenesis. JCI Insight. (2021) 6:e139160. doi: 10.1172/jci.insight.139160
34. Dicks L, Jakobs L, Sari M, Hambitzer R, Ludwig N, Simon MC, et al. Fortifying a meal with oyster mushroom powder beneficially affects postprandial glucagon-like peptide-1, non-esterified free fatty acids and hunger sensation in adults with impaired glucose tolerance: a double-blind randomized controlled crossover trial. Eur J Nutr. (2022) 61:687–701. doi: 10.1007/s00394-021-02674-1
35. Valenzuela PL, Carrera-Bastos P, Castillo-García A, Lieberman DE, Santos-Lozano A, and Lucia A. Obesity and the risk of cardiometabolic diseases. Nat Rev Cardiol. (2023) 20:475–94. doi: 10.1038/s41569-023-00847-5
36. Watanabe LM and Seale LA. Challenging aspects to precise health strategies in native Hawaiian and other pacific islanders using statins. Front Public Health. (2022) 10:799731. doi: 10.3389/fpubh.2022.799731
37. Mills KT, Stefanescu A, and He J. The global epidemiology of hypertension. Nat Rev Nephrol. (2020) 16:223–37. doi: 10.1038/s41581-019-0244-2
38. Wang L, Peng W, Zhao Z, Zhang M, Shi Z, Song Z, et al. Prevalence and treatment of diabetes in China, 2013-2018. JAMA. (2021) 326:2498–506. doi: 10.1001/jama.2021.22208
39. Lu Y, Zhang H, Lu J, Ding Q, Li X, Wang X, et al. Prevalence of dyslipidemia and availability of lipid-lowering medications among primary health care settings in China. JAMA Netw Open. (2021) 4:e2127573. doi: 10.1001/jamanetworkopen.2021.27573
40. Roth GA, Mensah GA, Johnson CO, Addolorato G, Ammirati E, Baddour LM, et al. Global burden of cardiovascular diseases and risk factors, 1990-2019: update from the GBD 2019 study. J Am Coll Cardiol. (2020) 76:2982–3021. doi: 10.1016/j.jacc.2020.11.010
41. Chen R, Safiri S, Behzadifar M, Kong JD, Zguira MS, Bragazzi NL, et al. Health effects of metabolic risks in the United States from 1990 to 2019. Front Public Health. (2022) 10:751126. doi: 10.3389/fpubh.2022.751126
42. Karchynskaya V, Kopcakova J, Klein D, Gába A, Madarasova-Geckova A, van Dijk JP, et al. Is BMI a valid indicator of overweight and obesity for adolescents? Int J Environ Res Public Health. (2020) 17:4815. doi: 10.3390/ijerph17134815
43. Tsatsoulis A and Paschou SA. Metabolically healthy obesity: criteria, epidemiology, controversies, and consequences. Curr Obes Rep. (2020) 9:109–20. doi: 10.1007/s13679-020-00375-0
44. Gažarová M, Galšneiderová M, and Mečiarová L. Obesity diagnosis and mortality risk based on a body shape index (ABSI) and other indices and anthropometric parameters in university students. Rocz Panstw Zakl Hig. (2019) 70:267–75. doi: 10.32394/rpzh.2019.0077
45. Hermesdorf M, Leppert D, Maceski A, Benkert P, Wellmann J, Wiendl H, et al. Longitudinal analyses of serum neurofilament light and associations with obesity indices and bioelectrical impedance parameters. Sci Rep. (2022) 12:15863. doi: 10.1038/s41598-022-20398-y
46. Simmonds M, Burch J, Llewellyn A, Griffiths C, Yang H, Owen C, et al. The use of measures of obesity in childhood for predicting obesity and the development of obesity-related diseases in adulthood: a systematic review and meta-analysis. Health Technol Assess. (2015) 19:1–336. doi: 10.3310/hta19430
47. Qiao T, Luo T, Pei H, Yimingniyazi B, Aili D, Aimudula A, et al. Association between abdominal obesity indices and risk of cardiovascular events in Chinese populations with type 2 diabetes: a prospective cohort study. Cardiovasc Diabetol. (2022) 21:225. doi: 10.1186/s12933-022-01670-x
48. Guerrero-Romero F and Rodríguez-Morán M. Abdominal volume index. An anthropometry-based index for estimation of obesity is strongly related to impaired glucose tolerance and type 2 diabetes mellitus. Arch Med Res. (2003) 34:428–32. doi: 10.1016/S0188-4409(03)00073-0
49. Perona JS, Schmidt Rio-Valle J, Ramírez-Vélez R, Correa-Rodríguez M, Fernández-Aparicio Á, and González-Jiménez E. Waist circumference and abdominal volume index are the strongest anthropometric discriminators of metabolic syndrome in Spanish adolescents. Eur J Clin Invest. (2019) 49:e13060. doi: 10.1111/eci.13060
50. Yousri NA, Suhre K, Yassin E, Al-Shakaki A, Robay A, Elshafei M, et al. Metabolic and metabo-clinical signatures of type 2 diabetes, obesity, retinopathy, and dyslipidemia. Diabetes. (2022) 71:184–205. doi: 10.2337/db21-0490
51. Liu R, Liu C, Sarina, Tao Y, Wang Y, and Qiu L. Relationship between obesity and dyslipidemia in adult residents of Shaanxi Province. Chin J Public Health. (2023) 39:1383–7. doi: 10.11847/zgggws1141424
52. Chen R, Ji L, Chen Y, and Meng L. Weight-to-height ratio and body roundness index are superior indicators to assess cardio-metabolic risks in Chinese children and adolescents: compared with body mass index and a body shape index. Transl Pediatr. (2022) 11:318–29. doi: 10.21037/tp-21-479
53. Tsao YC, Lee YY, Chen JY, Yeh WC, Chuang CH, Yu W, et al. Gender- and age-specific associations between body fat composition and C-reactive protein with lung function: A cross-sectional study. Sci Rep. (2019) 9:384. doi: 10.1038/s41598-018-36860-9
54. Karnes JH, Arora A, Feng J, Steiner HE, Sulieman L, Boerwinkle E, et al. Racial, ethnic, and gender differences in obesity and body fat distribution: An All of Us Research Program demonstration project. PloS One. (2021) 16:e0255583. doi: 10.1371/journal.pone.0255583
55. Wu W, Wu Y, Yang J, Sun D, Wang Y, Ni Z, et al. Relationship between obesity indicators and hypertension-diabetes comorbidity among adults: a population study from Central China. BMJ Open. (2022) 12:e052674. doi: 10.1136/bmjopen-2021-052674
56. Gowri SM, Antonisamy B, Geethanjali FS, Thomas N, Jebasingh F, Paul TV, et al. Distinct opposing associations of upper and lower body fat depots with metabolic and cardiovascular disease risk markers. Int J Obes (Lond). (2021) 45:2490–8. doi: 10.1038/s41366-021-00923-1
57. Karpe F and Pinnick KE. Biology of upper-body and lower-body adipose tissue–link to whole-body phenotypes. Nat Rev Endocrinol. (2015) 11:90–100. doi: 10.1038/nrendo.2014.185
58. Salamunes ACC, Stadnik AMW, and Neves EB. The effect of body fat percentage and body fat distribution on skin surface temperature with infrared thermography. J Therm Biol. (2017) 66:1–9. doi: 10.1016/j.jtherbio.2017.03.006
59. Perissiou M, Borkoles E, Kobayashi K, and Polman R. The effect of an 8 week prescribed exercise and low-carbohydrate diet on cardiorespiratory fitness, body composition and cardiometabolic risk factors in obese individuals: A randomized controlled trial. Nutrients. (2020) 12:482. doi: 10.3390/nu12020482
60. Lee PF, Ho CC, Kan NW, Yeh DP, Chang YC, Li YJ, et al. The association between physical fitness performance and abdominal obesity risk among Taiwanese adults: A cross-sectional study. Int J Environ Res Public Health. (202) 17:1722. doi: 10.3390/ijerph17051722
Keywords: obesity indicators, hypertension, diabetes, dyslipidemia, rural residents
Citation: Yin T, Wang J, Lan X, Zhang J, Wang Q, Qiu J, Ma T, Zhao Y and Zhang Y (2025) Different obesity indicators and their correlation with hypertension, diabetes, and dyslipidemia in 35–74 years rural residents in Northwest China. Front. Endocrinol. 16:1346193. doi: 10.3389/fendo.2025.1346193
Received: 29 November 2023; Accepted: 21 May 2025;
Published: 09 June 2025.
Edited by:
Bert B. Little, University of Louisville, United StatesReviewed by:
Fatemeh Ayoobi, Rafsanjan University of Medical Sciences, IranMana Moghadami, University of Louisville, United States
Copyright © 2025 Yin, Wang, Lan, Zhang, Wang, Qiu, Ma, Zhao and Zhang. This is an open-access article distributed under the terms of the Creative Commons Attribution License (CC BY). The use, distribution or reproduction in other forums is permitted, provided the original author(s) and the copyright owner(s) are credited and that the original publication in this journal is cited, in accordance with accepted academic practice. No use, distribution or reproduction is permitted which does not comply with these terms.
*Correspondence: Yuhong Zhang, emhhYm91ckAxNjMuY29t; Yi Zhao, emhhb3lpNzUxMTE0QGhvdG1haWwuY29t
†These authors have contributed equally to this work
‡These authors have contributed equally to this work