 Marilyn Arosemena1,2*
 Maria V. Salguero3Siri Atma W. Greeley4
 Rochelle N. Naylor4Esra Tasali5
 Louis H. Philipson4,5
- 1Texas Diabetes Institute - University Health, University of Texas Health San Antonio, San Antonio, TX, United States
- 2Universidad Espíritu Santo, Samborondón, Ecuador
- 3Pediatric Endocrinology, Advocate Christ Medical Center, Oak Lawn, IL, United States
- 4Department of Pediatrics, The University of Chicago, Chicago, IL, United States
- 5Department of Medicine, The University of Chicago, Chicago, IL, United States
Objective: To review the current evidence on sleep patterns in relation to glucose control in adults and children with type 1 diabetes (T1DM) and monogenic diabetes.
Methods: We searched for the literature pertaining to T1DM and monogenic diabetes with reported sleep patterns, along with glycemic control, in PubMed. This review aimed to examine the current evidence on the relationship between sleep patterns and diabetes management and possible mediating mechanisms for this relationship in adults and children with T1DM and monogenic diabetes. We reviewed articles published from inception until 2023.
Results: Twenty-five clinical studies met the eligibility criteria and were included. Children with T1DM with higher sleep variability had higher glucose levels, and those with higher glucose variability had more sleep disruptions. Comparing children with suboptimal [hemoglobin A1c (HbA1c) ≥ 7.5%] and optimal glucose control, those with suboptimal control had shorter sleep duration. There was no higher prevalence of obstructive sleep apnea (OSA) in children with T1DM compared to controls, but in T1DM, those who had OSA had higher glucose levels. Adults with T1DM had a high prevalence of poor sleep quality and were also sleeping less than the recommended hours for their age. Poor sleep quality and short sleep duration correlated with higher glycemic variability. First-generation automated insulin delivery systems did not improve sleep patterns in T1DM, but other strategies, including coaching and counseling, proved to be effective. Monogenic diabetes data also suggest poor sleep quality, short sleep duration, and high rates of sleep apnea.
Conclusion: T1DM subjects seem to have worse sleep patterns, especially those with suboptimal glucose control. Monogenic diabetes data are limited, but they also suggest poor sleep patterns. Rigorous interventional studies are needed to further elucidate the sleep–diabetes relationship. Future research could provide insights into strategies that could effectively improve sleep in people living with diabetes.
Introduction
Diabetes mellitus is a group of metabolic diseases characterized by hyperglycemia resulting from defects in insulin action, insulin secretion, or both. The goal of classifying the different types of diabetes is to better understand the cause, natural history, genetics, heritability, clinical phenotype, and optimum therapies (1).
The forms of diabetes known today include type 1 diabetes (T1DM), type 2 diabetes (T2DM), monogenic diabetes [which includes maturity-onset diabetes of the young (MODY), neonatal, mitochondrial, and syndromic], drug-induced diabetes, and other disease-associated diabetes. A unifying characteristic of diabetes is hyperglycemia, but the subtypes of diabetes differ in their etiology, natural history, associated conditions, and treatment. T2DM classically is associated with high rates of obesity and insulin resistance. T1DM is primarily an autoimmune disease seen in younger and leaner patients, but may occur at any age and any body type. Transcription factor and glucokinase mutations resulting in monogenic diabetes have a genetic background without autoimmunity and with rates of obesity and insulin resistance at or below background population levels. Other disease-associated diabetes and drug-induced types may have overlapping phenotypes in some cases, with pathognomonic features.
Sleep health has several indicators, such as sleep duration, sleep quality, and sleep timing, all of which are influenced by individual, social, and environmental demands. Sleep health is strongly linked to physical and mental well-being (2). The American Diabetes Association’s Standards of Medical Care have recommended assessment of sleep patterns as part of the comprehensive diabetes medical evaluation, given accumulated evidence highlighting the importance of sleep in glucose regulation. Meta-analyses from 15 studies suggest that both sleep duration and quality are associated with hemoglobin A1c (HbA1c) in people with T2DM (3). Subjects with type 2 diabetes additionally have higher rates of poor sleep quality, shorter sleep duration, and increased sleep apnea compared to controls (4).
Despite strong evidence linking sleep disturbances and diabetes (4, 5), previous reviews mainly focused on patients with T2DM, which often involve confounding from obesity and insulin resistance, as well as associated features of the metabolic syndrome (e.g., hypertension and hyperlipidemia). Our aim was to review the current evidence on the relationship between sleep patterns and diabetes management and possible mediating mechanisms for this relationship in adults and children with T1DM and monogenic diabetes.
Methods
Studies published in English were searched in PubMed since their inception until April 2023. For T1DM, the search terms were “type 1 diabetes”, “sleep”, “insomnia”, “apnea”, and “continuous glucose monitoring”. The search terms were employed in variable order and combinations. Inclusion criteria were studies that reported sleep characteristics with subjective and/or objective measures, along with glycemic control using continuous glucose monitoring (CGM). Exclusion criteria were reviewed articles or comments, assessment of caregivers of children with type 1 diabetes, absent sleep or CGM data, study protocols, and other diabetes treatment- or complication-related outcomes. See Figure 1 for further details. A total of 25 clinical studies met the eligibility criteria and were included.
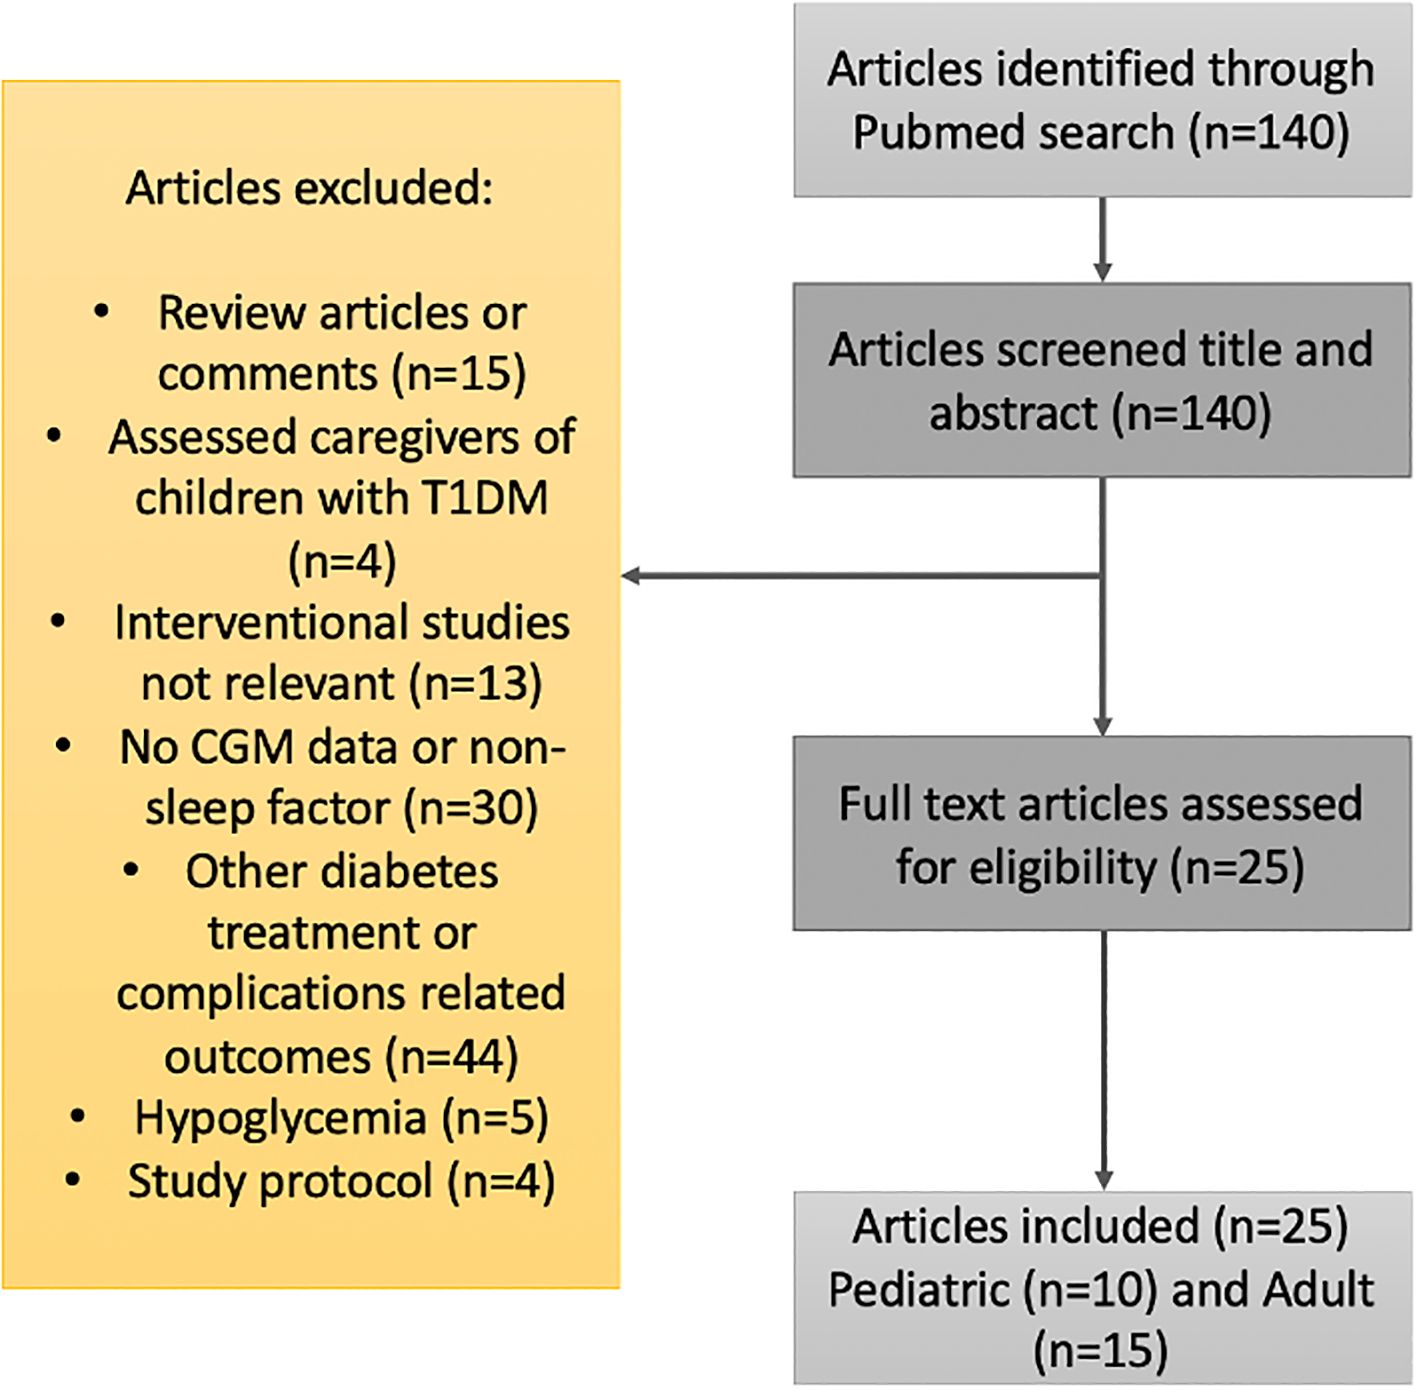
Figure 1. Flow diagram for the literature search and filtering of results for the review of the relationship between sleep patterns and type 1 diabetes.
In children, in some circumstances, sleep duration was measured using a home sleep study or actigraphy; the majority of those studies (three out of five) used validated devices (6–8). Follow-up rate was 83%–100% in the adult studies and 52%–100% in the child studies. Although there is always risk for bias in observational studies, in the studies analyzed, the main bias we suspect may have occurred is an “observer bias” or “Hawthorne effect”. As subjects know they are being evaluated using questionnaires, wrist actigraphy, or a sleep study, they may have changed their behavior while being studied.
For monogenic diabetes, search terms included “monogenic diabetes”, “maturity-onset diabetes of the young”, “atypical diabetes”, “sleep”, “insomnia”, and “apnea”. We included studies that reported sleep characteristics with subjective and/or objective measures along with glycemic control [CGM, HbA1c, or self-monitoring of blood glucose (SMBG)]. As there were no studies including CGM or SMBG and sleep in monogenic diabetes, we included the only available three studies investigating sleep in monogenic diabetes.
Screening for sleep disturbances
In the clinical and research settings, there are available tools to screen for sleep disorders. At a subjective level, screening can be accomplished using sleep questionnaires, and at an objective level, screening can be accomplished using in-lab or ambulatory sleep testing (9, 10). For sleep assessment methodologies, see Table 1. For sleep variable definitions, see Table 2.
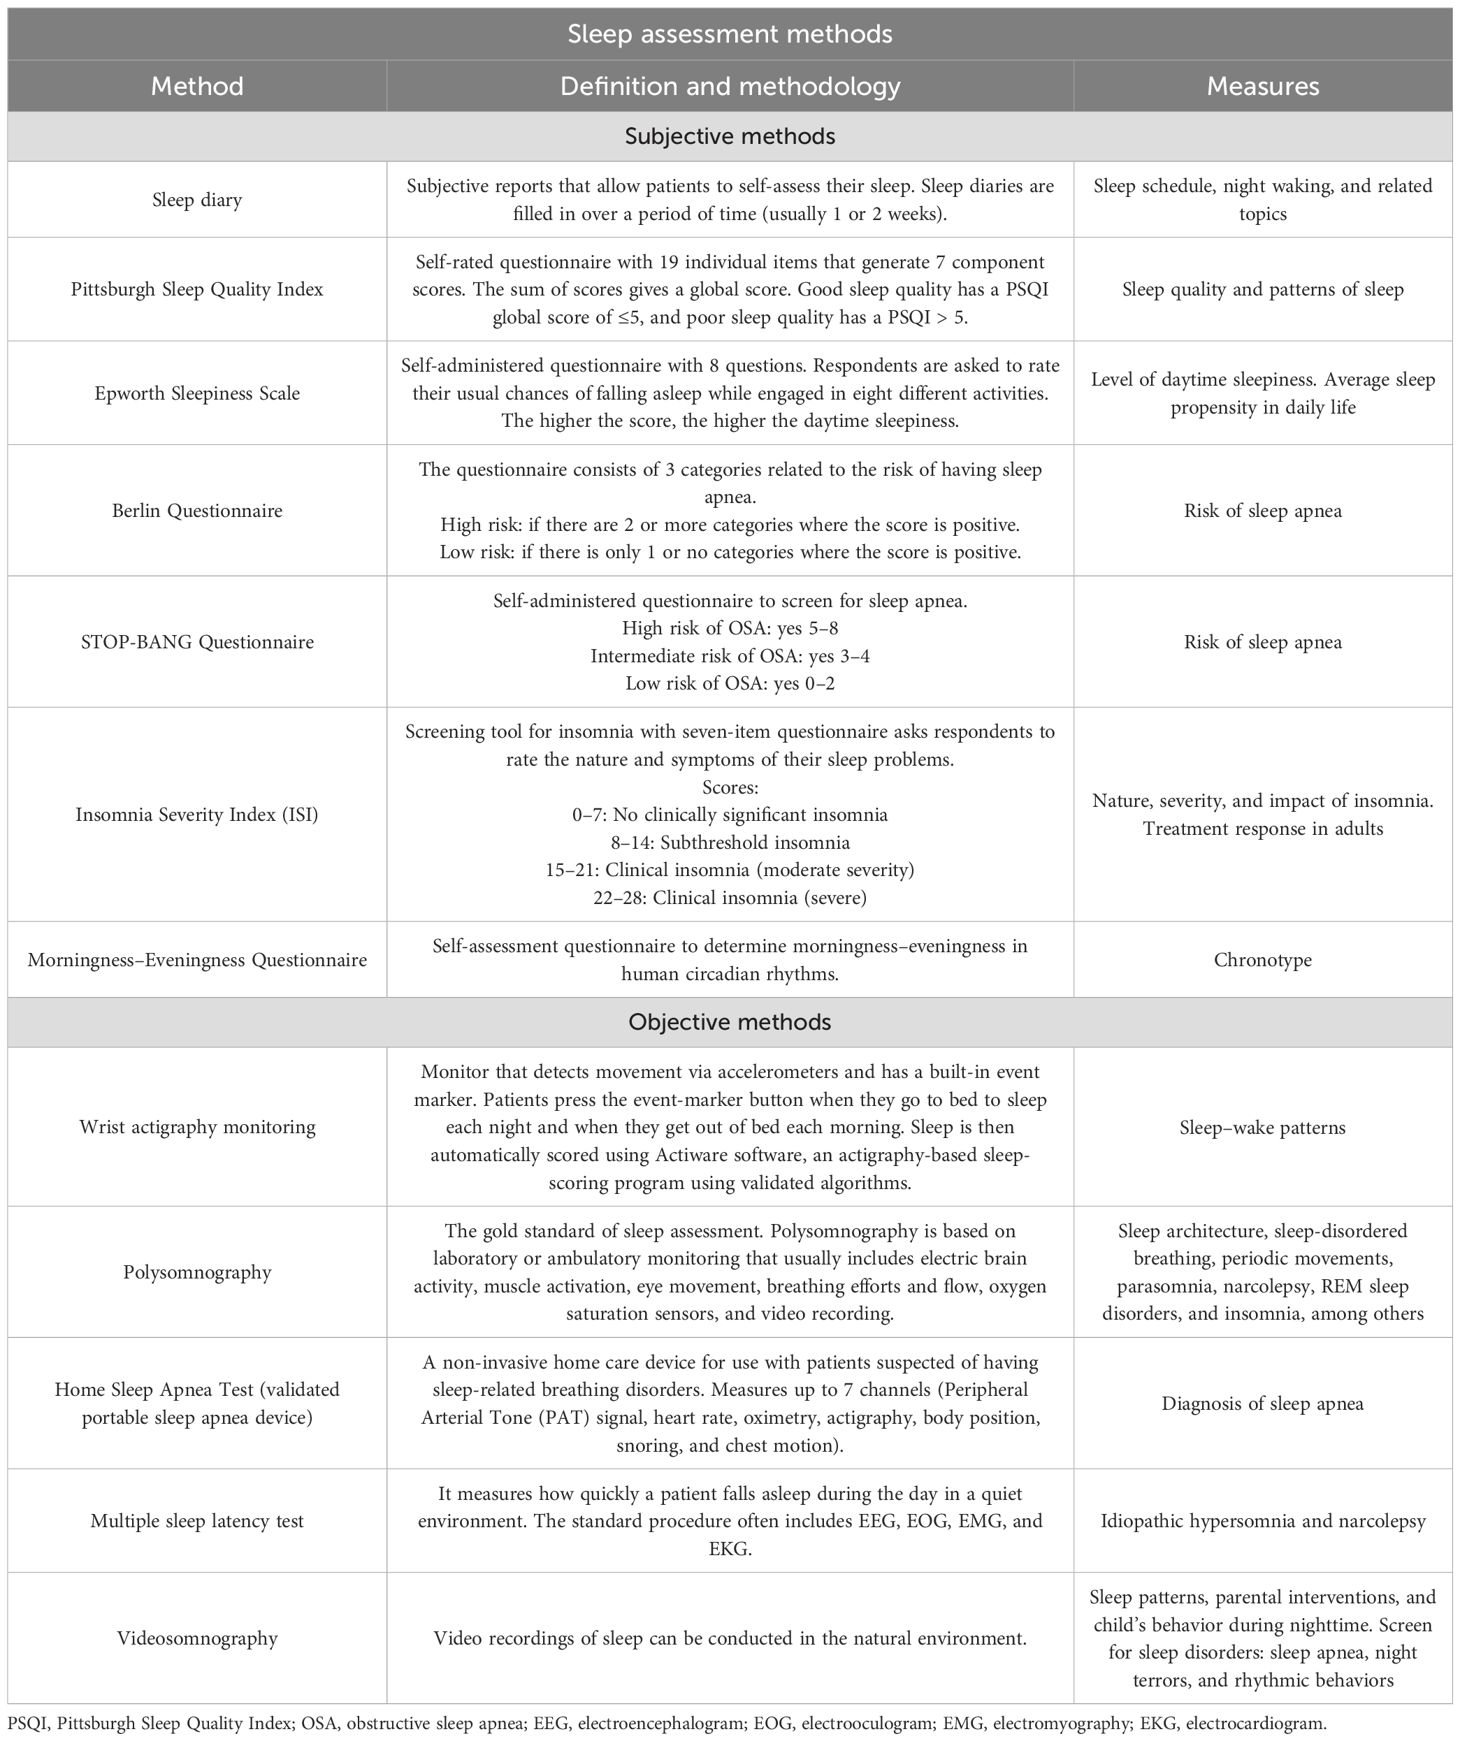
Table 1. Sleep assessment methods.
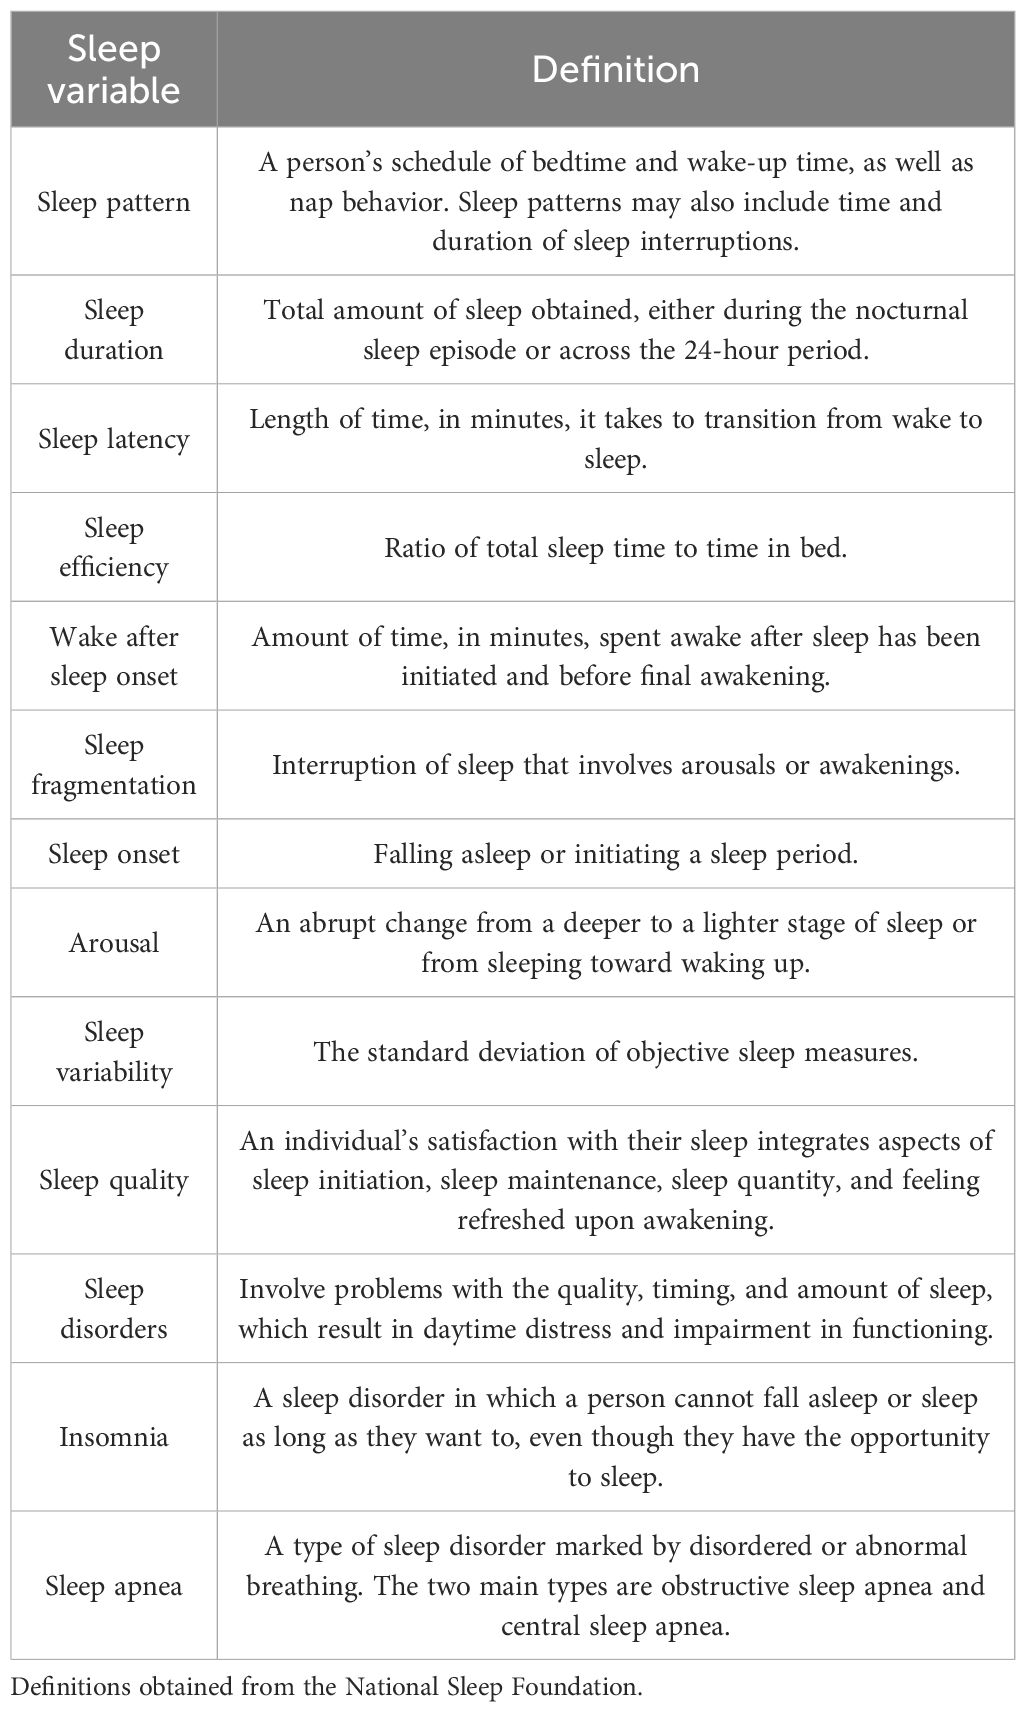
Table 2. Sleep dictionary.
Results
Type 1 diabetes in children
Glycemic control and sleep patterns
Observational studies in children have found high Pittsburgh Sleep Quality Index (PSQI) scores that are at or above the clinical cutoff for poor sleep quality (6, 7). Children who report poor sleep also report high diabetes-specific stress, poor diabetes self-management, and high state anxiety (7). A case–control study of 154 subjects, which investigated three pediatric populations (children, adolescents, and young adults), showed that young adults had higher PSQI scores than controls, while children and adolescents were no different than controls. No significant correlations were found between the self-reported sleep quality assessed using PSQI score and diabetes duration, HbA1c, the mode of therapy, the mode of glucose monitoring, or the rate of nocturnal hypo- or hyperglycemic episodes (11) (Table 3).
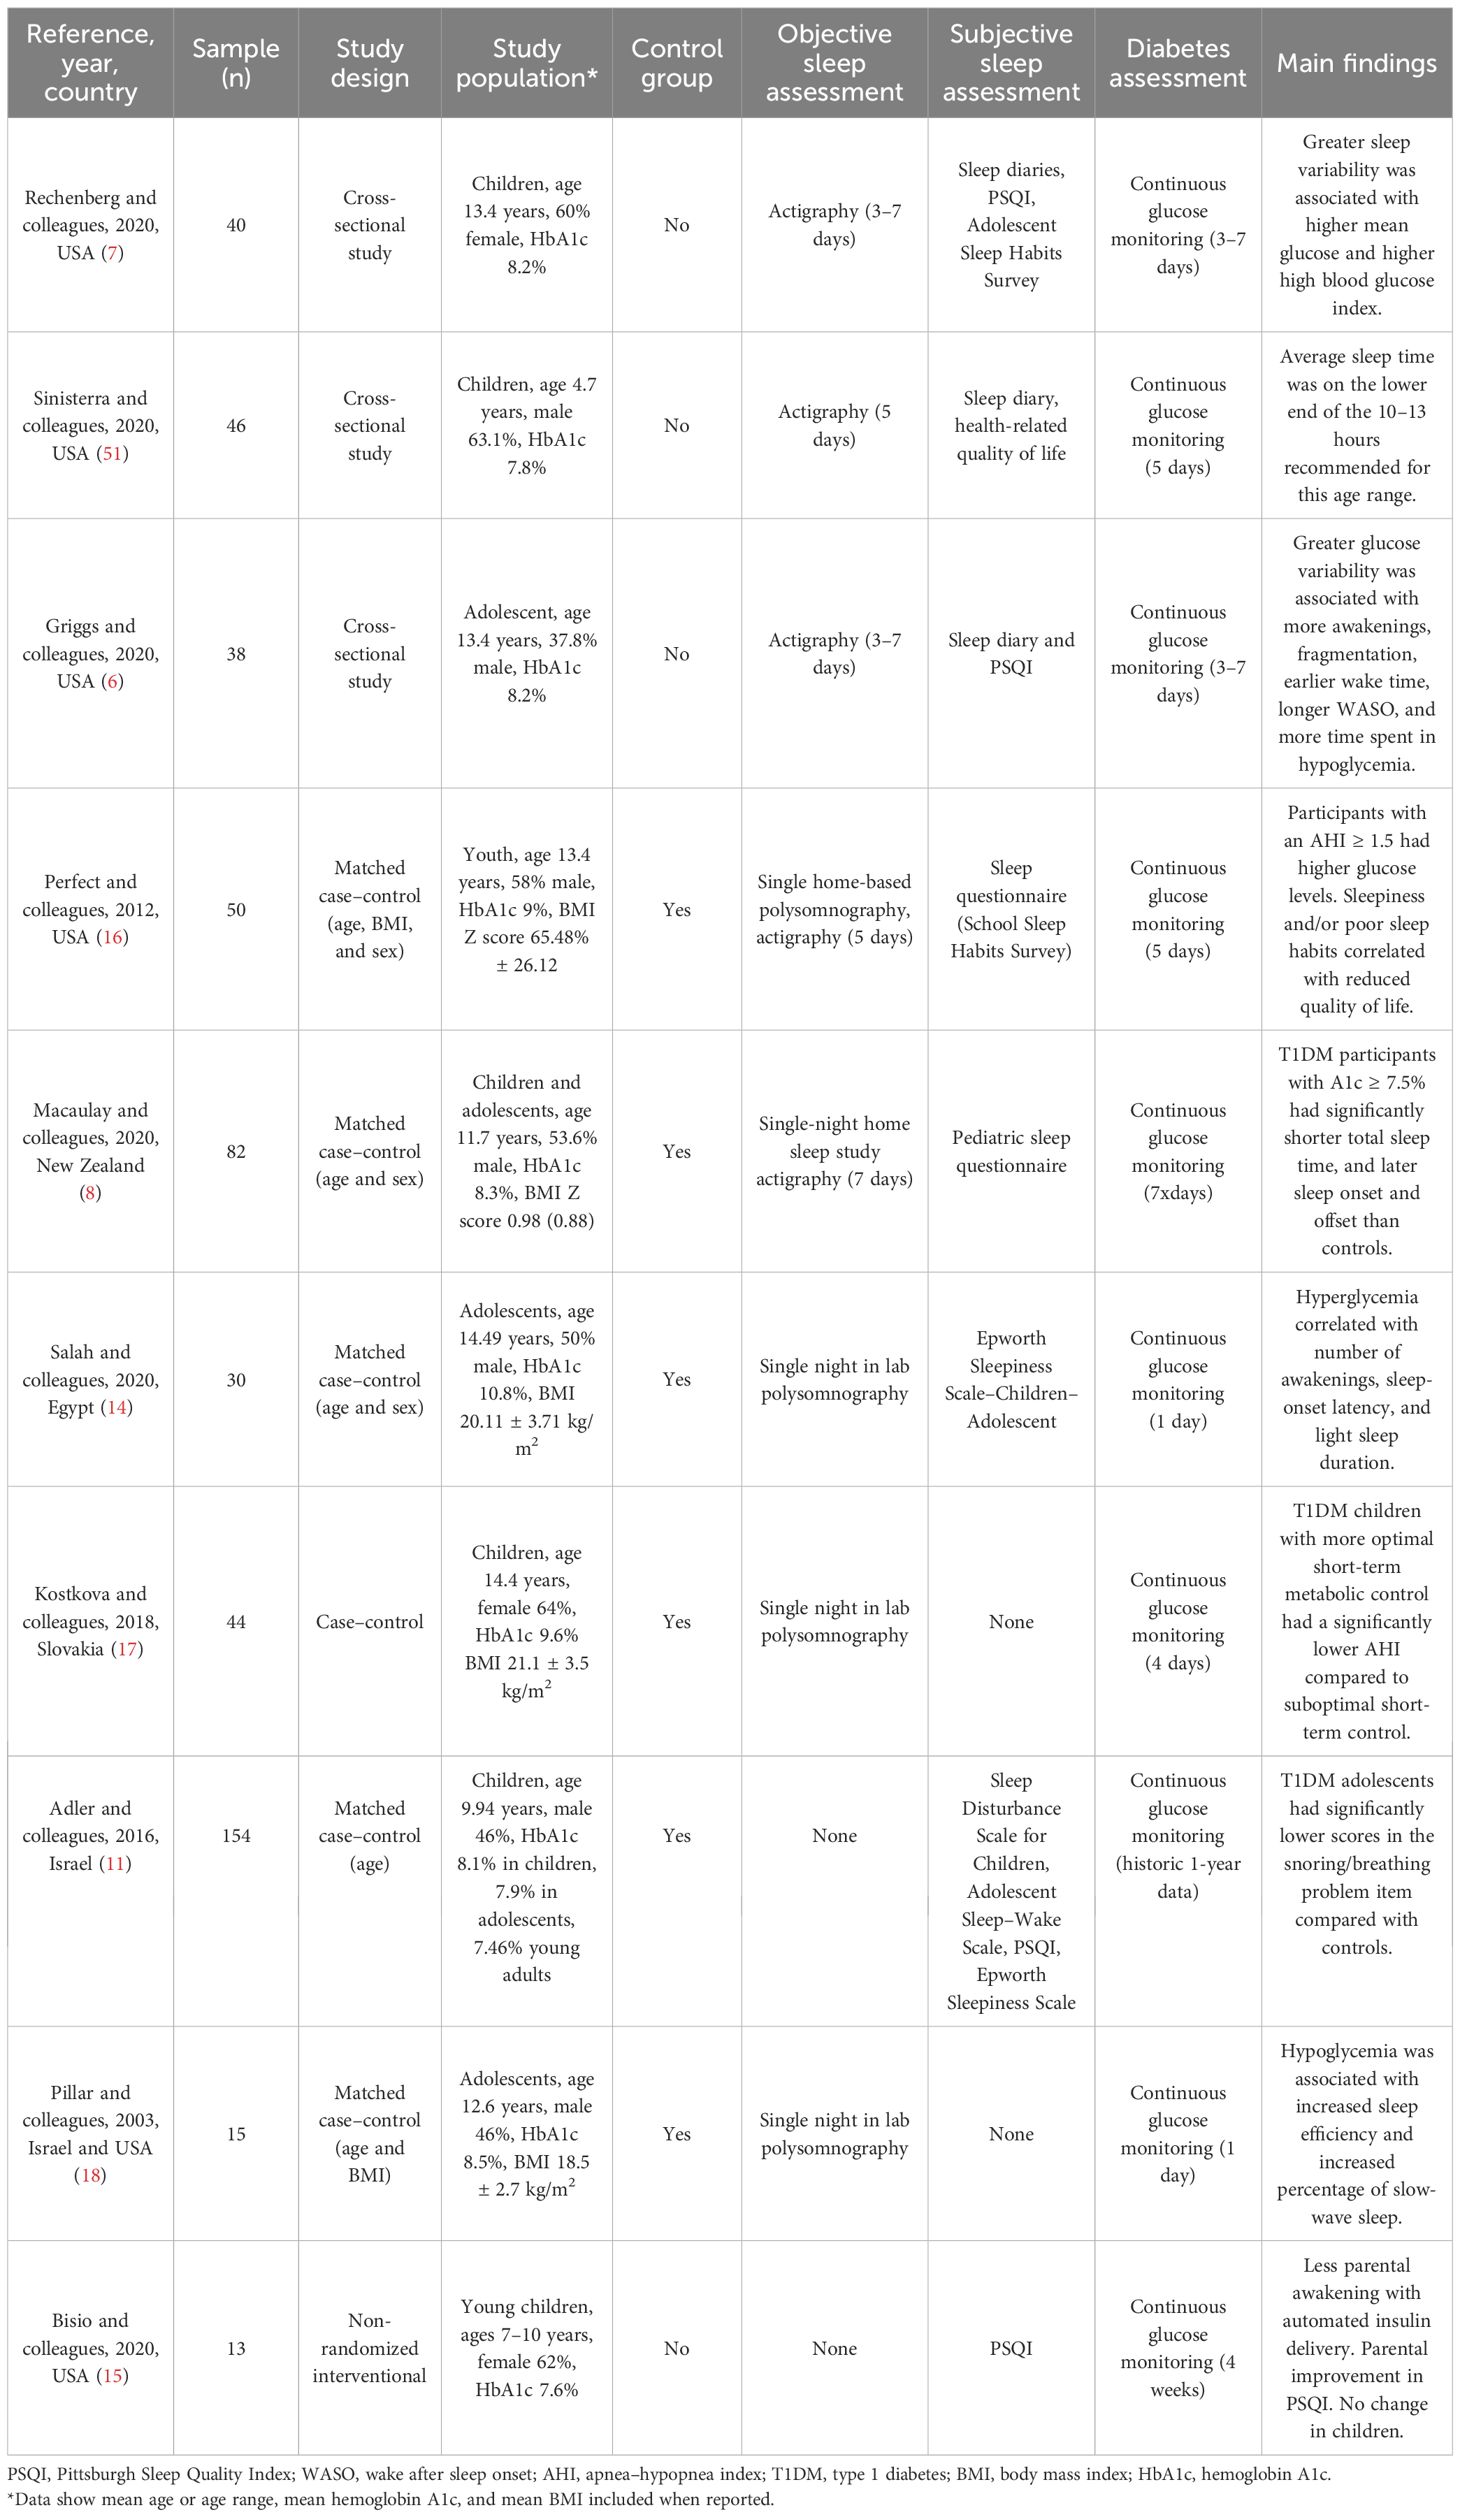
Table 3. Sleep patterns and glucose control in children with type 1 diabetes.
Two observational studies in adolescents revealed that adolescents are not getting enough sleep. In one of the studies, the mean sleep duration was 7.3 hours (7) [recommended by age is 8–10 hours (12)], which is at the 40th percentile compared with age- and sex-based normative data for actigraphy-measured sleep duration (13). In both studies, over 79% of the cohort were sleeping less than the recommended hours for their age (6, 7). A study in children aged 2–5 years also showed similar results; their average sleep time was on the lower end of the 10–13 hours recommended for this age range (12). An observational age- and sex-matched case–control study also revealed that children with T1DM had later sleep onset and later sleep offset compared to controls (8).
Abnormal sleep patterns also have an impact on glucose control. Patients with greater sleep variability (i.e., standard deviation of total sleep time across the nights) had higher mean glucose levels and a higher high blood glucose index (7). Higher glucose variability was also associated with more sleep disruptions (i.e., more awakenings and sleep fragmentation) and poorer sleep [i.e., earlier wake time or longer wake after sleep onset (WASO)] in the same subject (6). Total sleep time measured using polysomnography and actigraphy was shorter in children with T1DM with suboptimal glycemic control (HbA1c ≥ 7.5%) compared to those with optimal glycemic control. Later sleep onset was also noted in those patients with suboptimal glycemic control compared to those with optimal glycemic control. Additionally, an increase in HbA1c was associated with a small but significant increase in sleep timing variability as measured using actigraphy (8).
Another case–control study of 30 children with T1DM and control siblings revealed that cases had lower sleep efficiency compared to age- and sex-matched controls. Nocturnal hypoglycemia positively correlated with the amount of deep sleep, while hyperglycemia correlated with higher sleep onset latency, decreased rapid eye movement (REM) sleep, and increased awakenings compared to those in controls (14).
An interventional study in 13 young children assessed parents’ and children’s sleep patterns by comparing sensor-augmented pump therapy vs. an automated insulin delivery system. In children, there was no difference in regard to sleep patterns and sleep quality, but there was improvement in glucose control. In their parents, there was a reduction in awakenings and improvement in the PSQI score, diabetes-related distress, and mood disorders (15).
Glycemic control and sleep disorders
Observational studies did not show that sleep disorders were more common in children with T1DM than in controls, with the limitation that there was a high frequency of sleep disorders among both cases and controls (11). An association was seen between the apnea–hypoxia index (AHI) and glucose. One case–control study of 50 subjects revealed that T1DM children who had obstructive sleep apnea (OSA) with an AHI ≥ 1.5 (normal AHI ≤ 1 in this population) had higher glucose levels (16). Another case–control study of 44 subjects showed similar findings, as T1DM subjects with more optimal short-term metabolic control (average glucose <180 mg/dL) had a significantly lower AHI and respiratory arousal index compared to children with suboptimal short-term control (17). The rate of change or rapid glucose concentrations was also shown to have an impact on sleep by increasing awakenings in children with T1DM (18). Sleepiness and/or poor sleep habits correlated with reduced quality of life, depressed mood, lower grades, and lower state standardized reading scores (16).
At a subjective level, children with T1DM compared to controls report significantly more sleepiness (60% vs. 31.7%, respectively) (8). At an objective level, the sleepiness may be related to an increased number of awakenings, a higher arousal index, periodic limb movements, and a higher AHI in cases compared to controls (8, 14).
Type 1 diabetes in adults
Glycemic control and sleep patterns
Four cross-sectional studies with sample sizes ranging from 20 to 48 subjects revealed that a high proportion of T1DM subjects have poor sleep quality (19–22). For two of the studies, sleep quality was defined using a composite of objective sleep features (sleep efficiency, WASO, and number of awakenings) and revealed 66% of “poor sleep quality” (19) for one study and 77% for the other study (21). Subjectively measured sleep quality using sleep questionnaires revealed poor sleep quality ranging from 46% to 50% in T1DM subjects (20, 22) (Table 4).
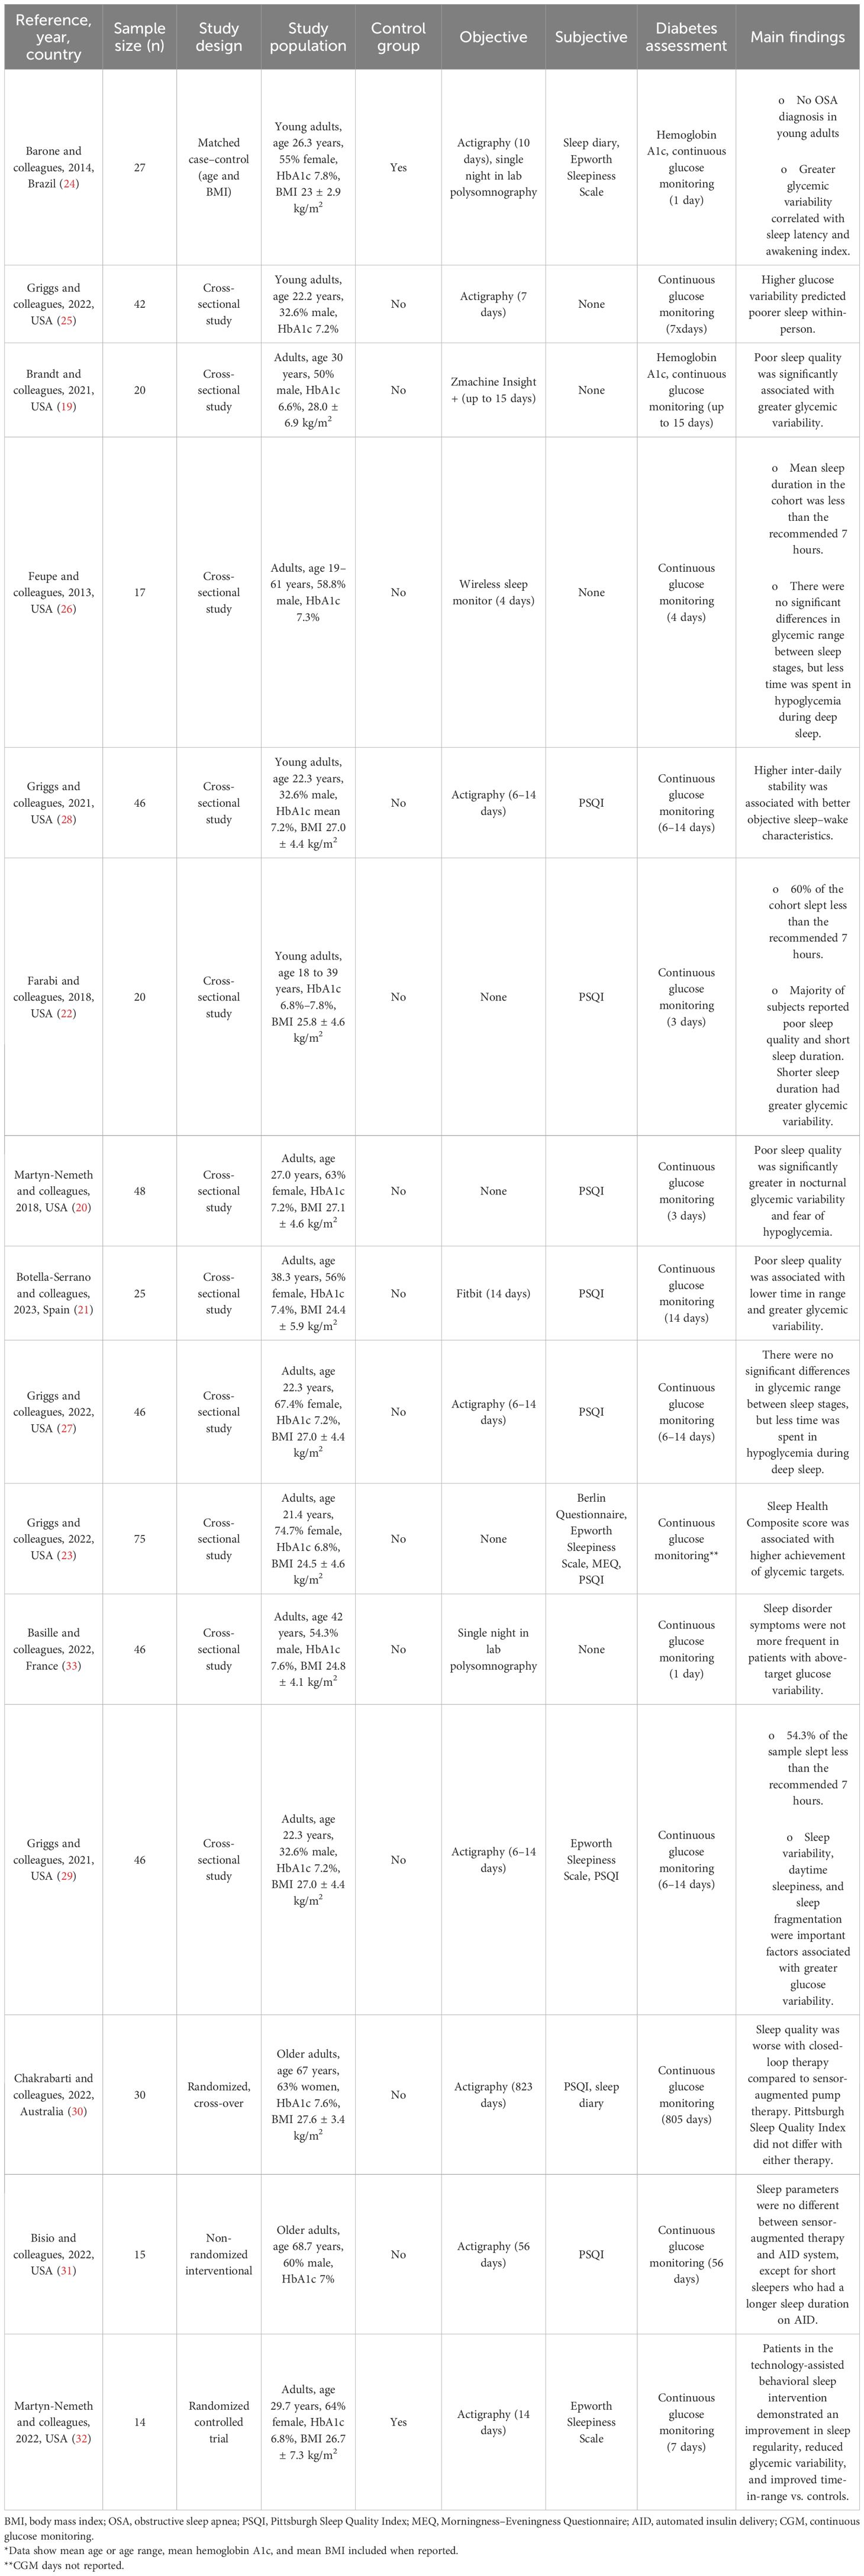
Table 4. Sleep patterns and glucose control in adults with type 1 diabetes.
When analyzing sleep quality with glycemia, poor sleep quality was significantly associated with greater glycemic variability after accounting for age, sex, and body mass index (BMI). Those participants with poor sleep quality had greater nocturnal glycemic variability than those with good sleep (19–21). Higher glucose levels and lower time in range were associated with poorer sleep quality (21, 22).
A composite of sleep health score (using satisfaction, alertness, timing, and efficiency) in a cross-sectional study of 75 young adults showed that better sleep health was significantly associated with higher achievement of glycemic targets (time in range and J index); however, these associations did not persist after considering covariates (T1DM duration, race, the mode of insulin delivery, and sleep apnea risk) (23).
A case–control study matched by age and BMI in 27 young adults found that neither sleep quality nor sleep duration correlated with glycemia or glycemic variability. However, in this study, sleep quality was measured differently using a visual analogue scale. Individuals with diabetes in this study presented more pronounced sleep extension from weekdays to weekends compared to controls. Glycemic variability did correlate with sleep latency and full awakening index (24).
A cross-sectional study in 42 young adults who underwent actigraphy and CGM revealed that higher sleep efficiency predicted more time in range and less time in hyperglycemia. More awakenings predicted higher glucose variability, a higher high blood glucose risk score, and more time spent in hyperglycemia between subjects. Another finding was that a higher high blood glucose index risk score and more time spent in severe hyperglycemia were associated with a longer WASO between subjects. Additionally, more time spent in severe hyperglycemia was associated with a higher sleep fragmentation index between subjects (25).
In regard to sleep duration, three cross-sectional studies with sample sizes ranging from 17 to 46 showed that subjects with T1DM are short sleepers (22, 26, 27). In one of the studies, the mean sleep duration was slightly less than 6 hours (26) [which is at the 15–25th percentile compared with age- and sex-based normative data for actigraphy-measured sleep duration (13)], and the other two studies reported that the majority of their cohort [54.3% (27) and 60% (22)] slept less than the recommended 7–9 hours. The subjects with shorter sleep duration had greater glycemic variability (22). Another cross-sectional study of 25 subjects showed a mean sleep duration of 7.15 hours (26) (at the 55th percentile compared with age- and sex-based normative data for actigraphy-measured sleep duration 12), higher than those reported above, but in the lower end of what is recommended for their age (12).
When investigating circadian alignment in a cross-sectional study of 46 young adults, patients with T1DM with robust and stronger rhythm (higher interdaily stability) had longer total sleep time and less self-reported daytime sleepiness, better executive function, and less hyperglycemia risk, but more time spent in hypoglycemia and greater hypoglycemia risk. Higher hypoglycemia risk was no longer significant when diabetes duration was added to the model. 12 In a cross-sectional study of 46 adults, poorer objective sleep–wake characteristics (longer sleep onset latency and poorer sleep efficiency) were found to be associated with higher diabetes emotional distress (27).
A cross-sectional study of 46 subjects also showed that a higher sleep fragmentation index was associated with greater glucose variability after controlling for T1DM duration and accounting for higher daytime sleepiness. Additionally, greater sleep variability was directly associated with greater glucose variability; however, this association was no longer significant when accounting for daytime sleepiness and controlling for T1DM duration (29).
Two interventional studies in older adults assessed sleep patterns and quality by comparing sensor-augmented pump therapy vs. an automated insulin delivery system. None of them found a difference in sleep quality or sleep patterns (30, 31). In one of the studies, using an automated insulin delivery system led to worse sleep quality; however, this was a first-generation closed-loop system in which patients experienced 30% more alarms compared to sensor-augmented therapy (30).
Another intervention to improve sleep health was evaluated through a randomized controlled trial in 14 adults with T1DM. A technology-assisted sleep intervention (an 8-week remotely delivered program that entailed the following: weekly emailed didactic sleep content, weekly 5–10-minute telephone coaching, and a wearable sleep tracker and smartphone application with interactive feedback and tools) demonstrated an improvement in sleep regularity, reduced glycemic variability, and improved glucose time in range compared to controls (32).
Glycemic control and sleep disorders
Not all studies have found a clear relationship between sleep disorders and T1DM. A case–control study in 27 T1DM young adults matched by age and BMI revealed that none of them had OSA measured using polysomnography. There was also a surprisingly negative correlation between the mean glycemia and the apnea–hypopnea index, given the established association in T2DM. Despite no detectable OSA, T1DM subjects who had the highest glycemic variability had a significantly higher awakening index (24). The same study also measured sleepiness by utilizing the Epworth Sleepiness Scale (ESS) and revealed that T1DM subjects had higher scores (more sleepiness) compared to controls (24). Similarly, a cross-sectional study of 17 subjects who utilized the same questionnaire revealed that 29% of the sample had a high ESS score (≥10), which is interpreted as daytime sleepiness (26).
A cross-sectional study of 46 older adults who underwent polysomnography and CGM showed that 37% of patients had sleep-disordered breathing (SDB; mild SDB, n = 9; moderate-to-severe SDB, n = 8). Moderate-to-severe SDB was associated with a higher BMI and a longer diabetes duration but not with above-target glucose variability or more sleep disorder symptoms. However, these findings were based on only one night of CGM, which limited the opportunity to detect possible differences (33).
Sleep in monogenic diabetes
One study investigating sleep quality in adult MODY participants (pathogenic variants in GCK, HNF4A, HNF1A, and HNF1B) (n = 24, mean age 46.0 years, 79% women, BMI 24.7 kg/m2) who underwent actigraphy and answered sleep questionnaires revealed that 88% participants had poor sleep quality measured using PSQI. The mean global score was 8.8 ± 3.6. Insomnia (including subthreshold and clinical insomnia) was reported in 71% of them (34). The study also showed that 54% had sleep duration less than the recommended minimum of 7 hours. Moreover, transcription factor-related MODY (HNF4A-, HNF1A-, and HNF1B-MODY) displayed increased night-to-night variability in sleep patterns compared to GCK-MODY (34). OSA was reported at 58% (64% mild, 22% moderate, and 14% severe), measured using a home sleep monitor. OSA rate was not different in GCK-MODY vs. TF-MODY. The mean HbA1c for both groups was not significantly different (6.3% for GCK and TF-MODY) (34).
A pediatric population of 13 neonatal diabetes subjects due to a KCNJ11 mutation revealed higher rates of sleep difficulties compared to sibling controls (35). In another study where sleep was objectively assessed using wrist actigraphy and sleep questionnaires, KCNJ11-neonatal diabetes subjects showed increased sleep duration and WASO night-to-night variability compared to unaffected siblings. Patients with neonatal diabetes had poorer sleep behaviors compared to unaffected siblings (36).
Discussion
Bidirectional relationship between sleep and glycemia: putative mechanisms of disrupted sleep in diabetes
There is growing evidence revealing how sleep and diabetes impact one another (Figure 2). Glucose excursions (hypo- and hyperglycemia) can impact sleep architecture (18, 21, 22). Cross-sectional studies surveying large sample sizes from different countries have shown that nocturnal hypoglycemia, even when it is not severe, correlates with patients having difficulty falling back to sleep (37, 38). Studies in children have shown that glucose variability and hyperglycemia provoke awakenings and disrupt sleep (6, 14). An expert review also hypothesized that hyperglycemia causes awakenings and disrupts sleep, as it induces osmotic diuresis, resulting in polyuria and nocturia (39). One study in T1DM showed that patients with a glucose level above 154 mg/dL had lower melatonin levels, which can impact normal circadian rhythm (40).
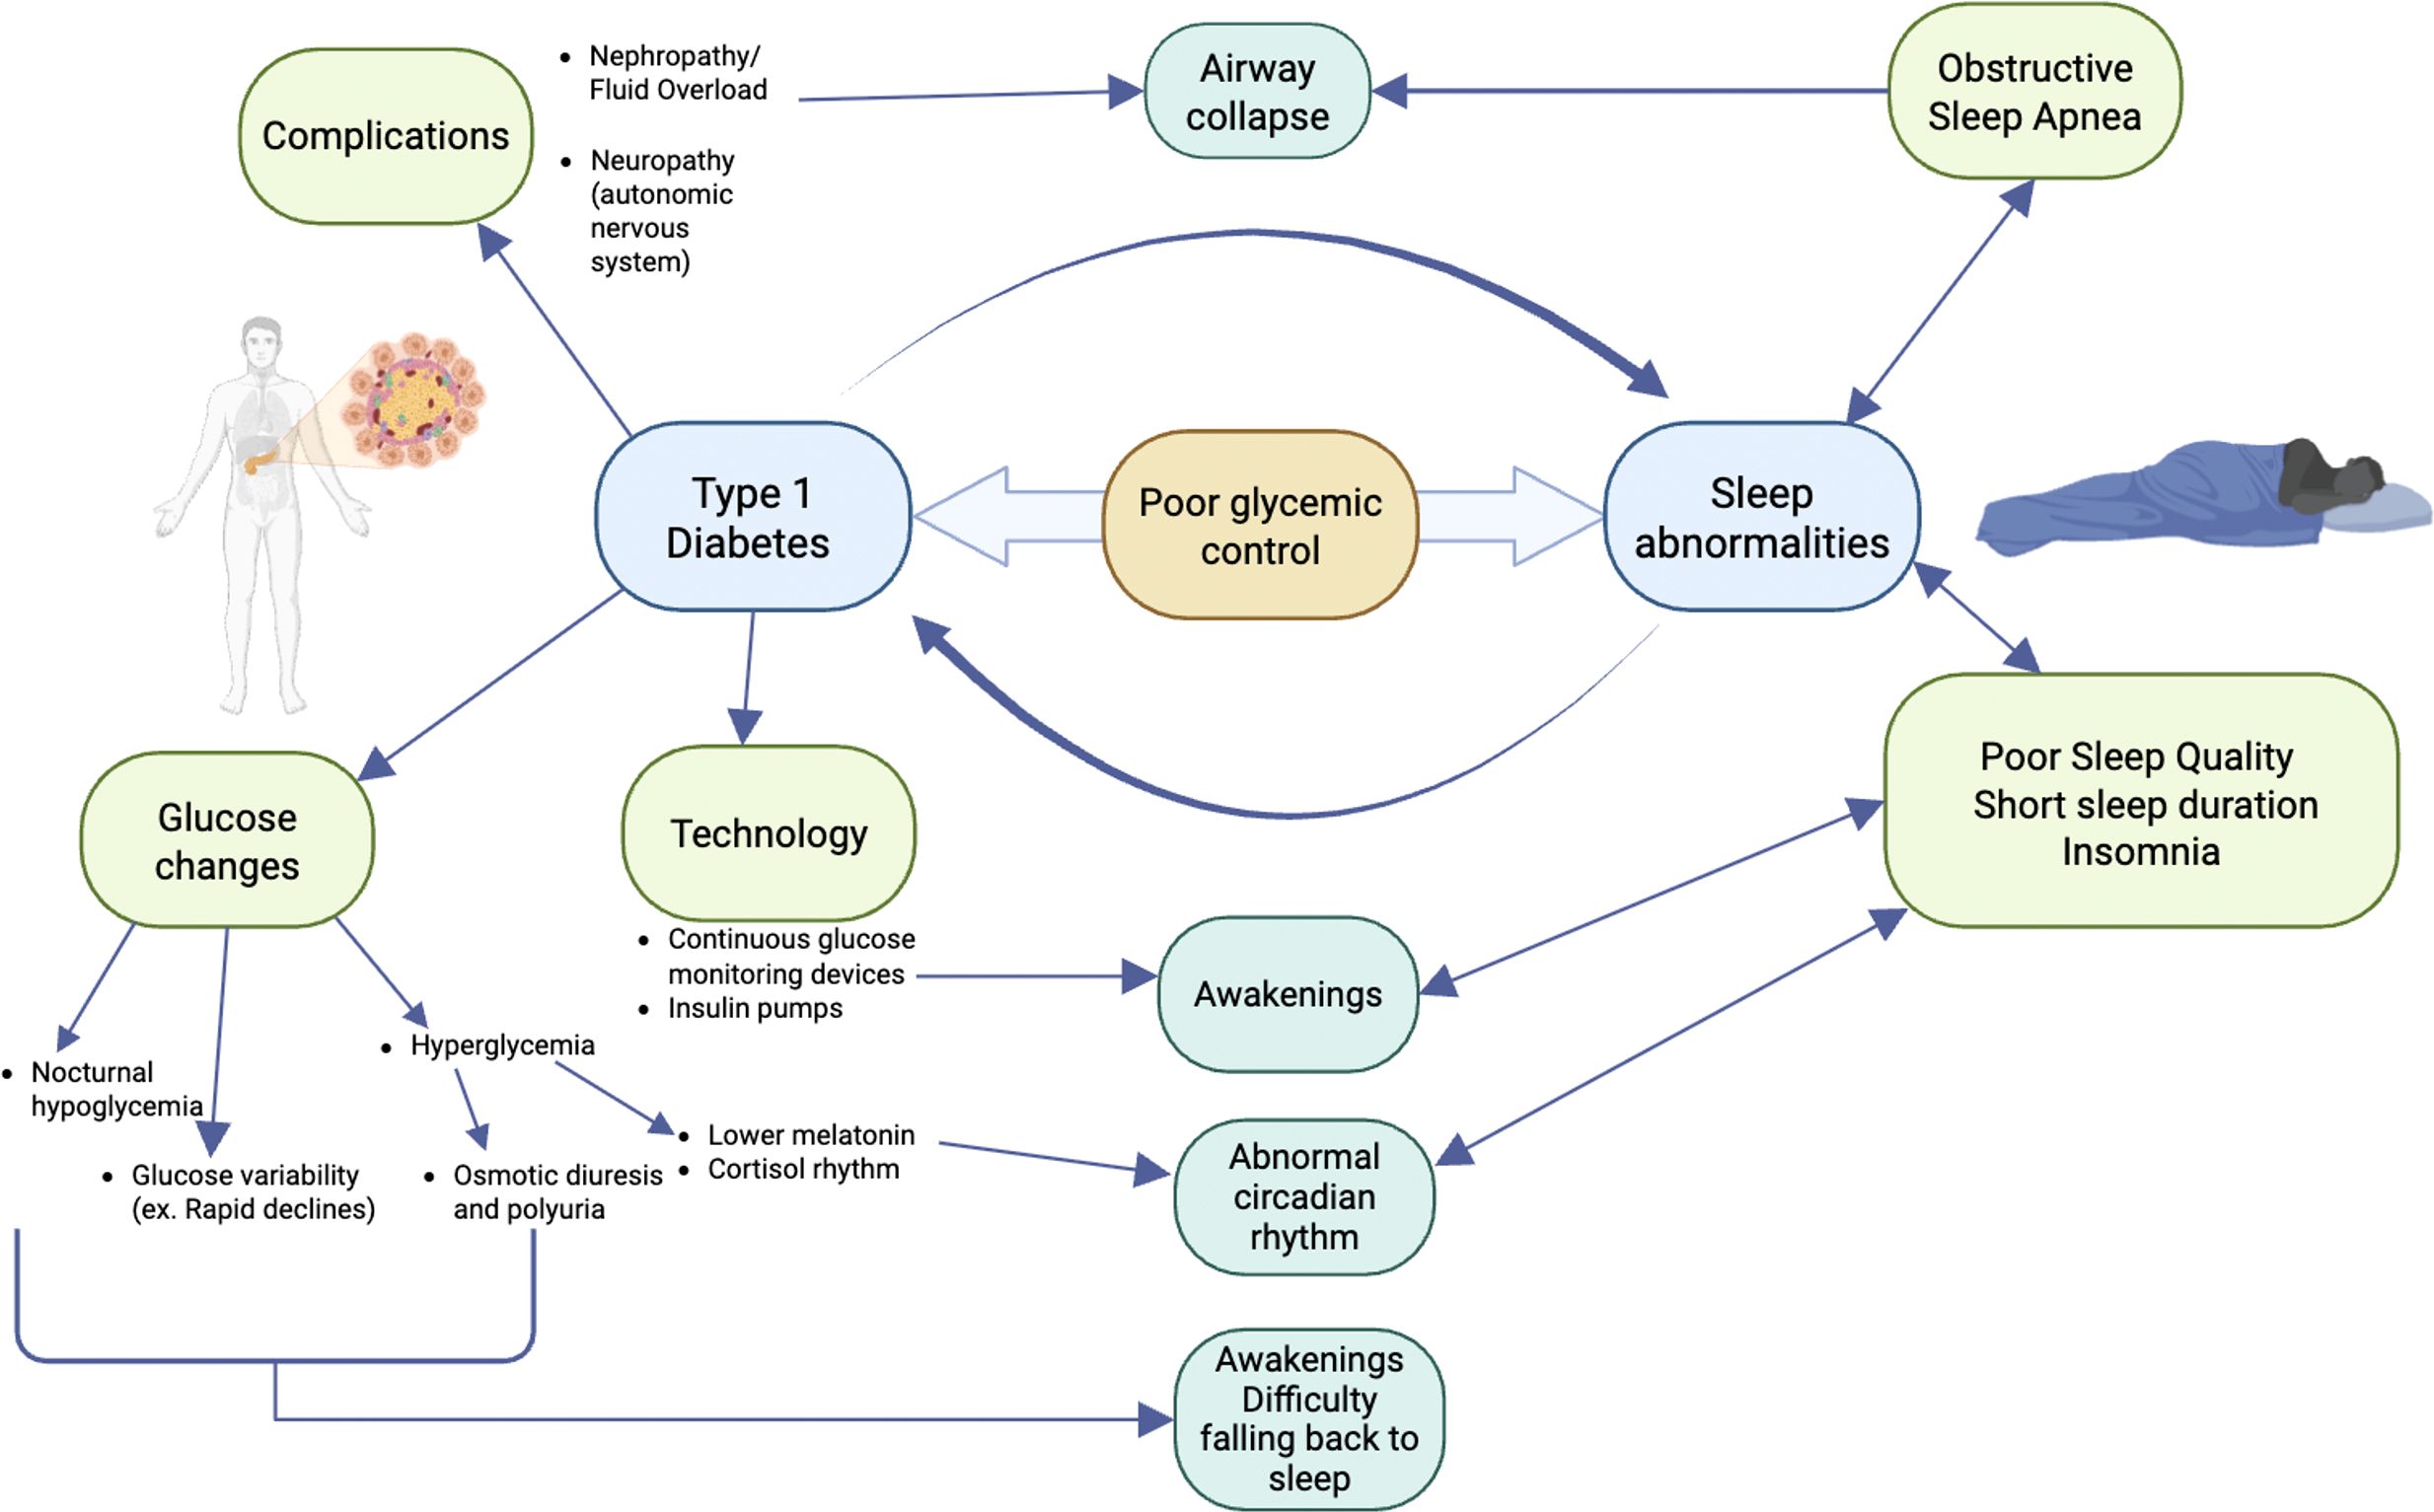
Figure 2. Potential mechanisms for sleep disruption in type 1 diabetes. Nephropathy with fluid overload and/or autonomic nervous system neuropathy can lead to airway collapse and obstructive sleep apnea. Glucose excursions (hypoglycemia, hyperglycemia, or high glycemic variability) can impact sleep architecture by causing awakenings and difficulty falling back to sleep or an abnormal circadian rhythm. Technology, including continuous glucose monitoring devices and/or insulin pumps, has alarms that can lead to awakenings. Sleep abnormalities, including poor sleep quality, short sleep duration, obstructive sleep apnea, and insomnia, can decrease insulin sensitivity and response; therefore, glucose control becomes more difficult.
Once sleep is disrupted, due to short sleep duration, sleep disorders (insomnia or OSA), or poor sleep quality, glucose control worsens (8, 17). The etiology of why glucose control declines in the setting of sleep abnormalities is multifactorial. From a sleep disorder perspective, OSA increases insulin resistance, which makes diabetes control more difficult (41). OSA is most common in people who are overweight or obese; however, in the studies listed, the majority of the patients were in the “normal” or “overweight” category. Additional anthropometric parameters, aside from BMI, that also correlate with the presence and severity of OSA and cardiometabolic disease include waist and neck circumference, body shape index, body adiposity index, and abdominal volume index (42, 43). Those were not measured in these studies.
There was no increased prevalence of OSA in T1DM compared to controls in one study, while another study did show a high prevalence of OSA. The discrepancy could be secondary to differences in the studied population, as the study that found a higher prevalence of OSA included predominantly older men with higher BMI and longer diabetes duration. Awakenings in these patients may not all be explained by episodes of apnea. From a sleep pattern perspective, short sleep duration and poor sleep quality lead to decreased insulin sensitivity and insulin response; therefore, glucose control becomes more difficult. This was reported in a high-quality review that included results from randomized controlled trials and epidemiological studies (44).
Technology has brought major improvements in glucose control; however, sleep has not necessarily been impacted in a positive way (45, 46). Continuous glucose monitoring devices and pump alarms may disrupt sleep by awakening patients. The use of the newest technology with hybrid closed- and semi-closed-loop systems correlates with subjective overall positive sleep quality in one pediatric study (15), while in adult studies, results were mixed, as there was little improvement for short sleepers on newer automated insulin delivery (AID) systems but worse sleep quality with older-generation automated systems due to alarms (30, 31). However, this conclusion relates to limited data in a small population with mostly first-generation systems and may change over time.
Sleep and mood disorders also have a significant impact on each other and should be taken into consideration, as they are highly prevalent in people with diabetes (47, 48). Sleepiness and/or poor sleep habits correlate with reduced quality of life, depressed mood, lower grades, and lower state standardized reading scores in children (16). One study reported that 36% of the sample screened positive for a mood disorder (21), and another study reported high depression scores (31). The rest of the studies described in this review did not screen for or report mood disorders, while others excluded patients with major psychiatric comorbidities as part of the study design (25).
The limitations of this literature review include studies with small sample sizes, short sleep and glycemic follow-up, and the potential for the Hawthorne effect affecting results. Most studies were cross-sectional studies, which have a lower level of evidence, making it difficult to establish cause–effect relationships and are prone to bias. Another limitation is the difficulty in systematically comparing studies that use different measurement tools (subjective and objective) for evaluating sleep patterns and sleep quality, which can lead to different results. Many studies did not control for confounding factors such as depression, obesity, hypertension, alcohol consumption, and obstructive sleep apnea. Furthermore, in both adult and pediatric studies, population characteristics differ in terms of BMI, age range, gender predominance, and glycemic control, which may also affect the results.
Summary and future directions
There is strong evidence in T2DM that sleep characteristics can positively or negatively impact the neuroendocrine systems, while diabetes itself often leads to sleep difficulties and disturbances (49, 50). Subjects with type 2 diabetes have been more extensively studied, and it is known that they have shorter sleep duration, poorer sleep quality, and increased sleep apnea compared to controls and the rates reported in other types of diabetes. The reciprocal relationship between T1DM and sleep is not completely well understood and needs more rigorous interventional studies. When considering the available evidence with its limitations, data have shown that short sleep duration, poor sleep quality, and sleep disorders can negatively impact glycemic control (19, 21–23). Children with T1DM have higher PSQI scores, indicating poor sleep quality (6, 7). Objectively, most children with T1DM are sleeping less than the recommended hours for their age (6, 7, 51). Those patients who elicit higher sleep variability have higher glucose levels, and patients with higher glucose variability have more sleep disruptions (6–8). Studies have also revealed that in people with diabetes, those with suboptimal control have shorter sleep duration compared to those with optimal control (8). Children with T1DM who have a higher apnea–hypopnea index also have higher glucose levels, and when rapid changes in glucose levels occur, they have more awakenings (6, 16).
In adults, subjectively and objectively, most studies have shown a high percentage of poor sleep quality in people with T1DM (19–22). Poor sleep quality is related to glycemic variability; higher glycemic variability is associated with poorer sleep quality. Out-of-range glucose is also associated with poor sleep quality (19–22). Hyperglycemia also negatively impacts adult sleep patterns, causing lower sleep efficiency, more awakenings, more sleep fragmentation, and higher WASO (24, 25). Sleep duration across all studies shows that most patients with T1DM sleep less than the recommended sleep duration for their age. Those subjects who have shorter sleep duration also exhibit higher glycemic variability, and poor sleep–wake characteristics have also been shown to produce higher emotional distress (22, 26, 27).
It is unclear if the use of automated insulin delivery systems can improve sleep patterns and quality in T1DM, as the devices’ alarms alert users and can disrupt sleep. Other strategies, including coaching and counseling, have proven to be effective (30–32).
In MODY, it is not yet clear what may be driving the higher rates of OSA, insomnia, and poor sleep quality. It is also unclear what underlies the decreased sleep variability seen in GCK-MODY compared to TF-MODY (34). KCNJ11-neonatal diabetes appears also to be commonly affected by sleep disturbances, seemingly attributable to the impairment of KATP channel function in the brain; however, more extensive studies need to be performed (35).
We have made great progress in understanding that sleep disruption is common in diabetes, but also that blood glucose control appears to be worse in those with disrupted sleep. Although there are no clear mechanisms of cause and effect for sleep disturbances, possible contributors include diabetes-related complications, sleep-disrupting technology, and glycemic variability or out-of-range glycemia. Advances in technology and data science have the potential to help us better understand this relationship. Learning that individuals with certain types of diabetes are at particularly high risk for developing certain sleep disorders will improve screening and treatment strategies (52). In the coming years, there is a need for both pediatric and adult large-scale cohort studies that can evaluate longitudinally the concomitant use of actigraphy, polysomnography, and CGM with standardized sleep metrics, as well as interventional studies targeting sleep hygiene strategies to improve sleep quality in both T1DM and monogenic diabetes. This will better elucidate the relationship between sleep and diabetes in less common forms of diabetes.
Author contributions
MA: Conceptualization, Formal Analysis, Investigation, Methodology, Writing – original draft, Writing – review & editing. MS: Data curation, Formal Analysis, Writing – original draft, Writing – review & editing. SG: Writing – original draft, Writing – review & editing. RN: Writing – original draft, Writing – review & editing. ET: Data curation, Supervision, Writing – original draft, Writing – review & editing. LP: Conceptualization, Investigation, Supervision, Writing – original draft, Writing – review & editing.
Funding
The author(s) declare financial support was received for the research and/or publication of this article. This study was supported by the following: Marilyn Arosemena: the Doris Duke Foundation Grant #2022028; Maria V. Salguero: Clinical Therapeutics Training Grant (T32GM00719); Siri Greeley: R01DK104942; Rochelle Naylor: R01DK104942, 7-22-ICTSPM-17; Esra Tasali is supported by the National Institutes of Health (NIH) grants R01HL146127, R01DK120312, P30DK020595, R01DK136214, and R01HL174685; and Louis Philipson: R01DK104942, P30 DK02059.
Conflict of interest
The authors declare that the research was conducted in the absence of any commercial or financial relationships that could be construed as a potential conflict of interest.
Publisher’s note
All claims expressed in this article are solely those of the authors and do not necessarily represent those of their affiliated organizations, or those of the publisher, the editors and the reviewers. Any product that may be evaluated in this article, or claim that may be made by its manufacturer, is not guaranteed or endorsed by the publisher.
References
1. Thomas CC and Philipson LH. Update on diabetes classification. Med Clin North Am. (2015) 99:1–16. doi: 10.1016/j.mcna.2014.08.015
2. Buysse DJ. Sleep health: can we define it? Does it matter? Sleep. (2024) 37(1):9–17. doi: 10.5665/sleep.3298
3. Lee SWH, Ng KY, and Chin WK. The impact of sleep amount and sleep quality on glycemic control in type 2 diabetes: A systematic review and meta-analysis. Sleep Med Rev. (2017) 31:91–101. doi: 10.1016/j.smrv.2016.02.001
4. Nefs GM, Bazelmans E, Donga E, Tack CJ, and de Galan BE. Sweet dreams or bitter nightmare: a narrative review of 25 years of research on the role of sleep in diabetes and the contributions of behavioural science. Diabetes Med. (2020) 37:418–26. doi: 10.1111/dme.14211
5. Rutters F and Nefs G. Sleep and circadian rhythm disturbances in diabetes: A narrative review. Diabetes Metab Syndr Obes. (2022) 15:3627–37. doi: 10.2147/DMSO.S354026
6. Griggs S, Redeker NS, Jeon S, and Grey M. Daily variations in sleep and glucose in adolescents with type 1 diabetes. Pediatr Diabetes. (2020) 21:1493–501. doi: 10.1111/pedi.13117
7. Rechenberg K, Griggs S, Jeon S, Redeker N, Yaggi HK, and Grey M. Sleep and glycemia in youth with type 1 diabetes. J Pediatr Health Care. (2020) 34:315–24. doi: 10.1016/j.pedhc.2019.12.002
8. Macaulay GC, Galland BC, Boucher SE, Wiltshire EJ, Haszard JJ, Campbell AJ, et al. Impact of type 1 diabetes mellitus, glucose levels, and glycemic control on sleep in children and adolescents: a case-control study. Sleep. (2020) 43:zsz226. doi: 10.1093/sleep/zsz226
9. Ibáñez V, Silva J, and Cauli O. A survey on sleep questionnaires and diaries. Sleep Med. (2018) 42:90–6. doi: 10.1016/j.sleep.2017.08.026
10. Sadeh A. Sleep assessment methods. Monogr Soc Res Child Dev. (2015) 80:33–48. doi: 10.1111/mono.12143
11. Adler A, Gavan MY, Tauman R, Phillip M, and Shalitin S. Do children, adolescents, and young adults with type 1 diabetes have increased prevalence of sleep disorders? Pediatr Diabetes. (2017) 18:450–8. doi: 10.1111/pedi.12419
12. Hirshkowitz M, Whiton K, Albert SM, Alessi C, Bruni O, DonCarlos L, et al. National Sleep Foundation’s sleep time duration recommendations: methodology and results summary. Sleep Health. (2015) 1:40–3. doi: 10.1016/j.sleh.2014.12.010
13. Barreira TV, Schuna JM, and Chaput JP. NORMATIVE REFERENCE VALUES FOR ACTIGRAPHY-MEASURED TOTAL NOCTURNAL SLEEP TIME IN THE US POPULATION. Am J Epidemiol. (2022) 191:360–2. doi: 10.1093/aje/kwab258
14. Salah NY, Abido AY, and Rashed HR. Relationship of glycaemic derangement using continuous glucose monitoring system with sleep pattern among children with type 1 diabetes. Diabetes Metab Res Rev. (2021) 37:e3407. doi: 10.1002/dmrr.3407
15. Bisio A, Brown SA, McFadden R, Pajewski M, Yu PL, DeBoer M, et al. Sleep and diabetes-specific psycho-behavioral outcomes of a new automated insulin delivery system in young children with type 1 diabetes and their parents. Pediatr Diabetes. (2021) 22:495–502. doi: 10.1111/pedi.13164
16. Perfect MM, Patel PG, Scott RE, Wheeler MD, Patel C, Griffin K, et al. Sleep, glucose, and daytime functioning in youth with type 1 diabetes. Sleep. (2012) 35:81–8. doi: 10.5665/sleep.1590
17. Kostkova M, Durdik P, Ciljakova M, Vojtkova J, Sujanska A, Pozorciakova K, et al. Short-term metabolic control and sleep in children and adolescents with type 1 diabetes mellitus. J Diabetes Complications. (2018) 32:580–5. doi: 10.1016/j.jdiacomp.2018.03.010
18. Pillar G, Schuscheim G, Weiss R, Malhotra A, McCowen KC, Shlitner A, et al. Interactions between hypoglycemia and sleep architecture in children with type 1 diabetes mellitus. J Pediatr. (2003) 142:163–8. doi: 10.1067/mpd.2003.66
19. Brandt R, Park M, Wroblewski K, Quinn L, Tasali E, and Cinar A. Sleep quality and glycaemic variability in a real-life setting in adults with type 1 diabetes. Diabetologia. (2021) 64:2159–69. doi: 10.1007/s00125-021-05500-9
20. Martyn-Nemeth P, Phillips SA, Mihailescu D, Farabi SS, Park C, Lipton R, et al. Poor sleep quality is associated with nocturnal glycaemic variability and fear of hypoglycaemia in adults with type 1 diabetes. J Adv Nurs. (2018) 74:2373–80. doi: 10.1111/jan.13765
21. Botella-Serrano M, Velasco JM, Sánchez-Sánchez A, Garnica O, and Hidalgo JI. Evaluating the influence of sleep quality and quantity on glycemic control in adults with type 1 diabetes. Front Endocrinol (Lausanne). (2023) 14:998881. doi: 10.3389/fendo.2023.998881
22. Farabi SS, Quinn L, Phillips S, Mihailescu D, Park C, Ali M, et al. Endothelial dysfunction is related to glycemic variability and quality and duration of sleep in adults with type 1 diabetes. J Cardiovasc Nurs. (2018) 33:E21–5. doi: 10.1097/JCN.0000000000000485
23. Griggs S, Pignatiello G, and Hickman RL. A composite measure of sleep health is associated with glycaemic target achievement in young adults with type 1 diabetes. J Sleep Res. (2022) 32(3):e13784. doi: 10.1111/jsr.13784
24. Barone MTU, Wey D, Schorr F, Franco DR, Carra MK, Lorenzi Filho G, et al. Sleep and glycemic control in type 1 diabetes. Arch Endocrinol Metab. (2015) 59:71–8. doi: 10.1590/2359-3997000000013
25. Griggs S, Grey M, Strohl KP, Crawford SL, Margevicius S, Kashyap SR, et al. Variations in sleep characteristics and glucose regulation in young adults with type 1 diabetes. J Clin Endocrinol Metab. (2022) 107:e1085–95. doi: 10.1210/clinem/dgab771
26. Feupe SF, Frias PF, Mednick SC, McDevitt EA, and Heintzman ND. Nocturnal continuous glucose and sleep stage data in adults with type 1 diabetes in real-world conditions. J Diabetes Sci Technol. (2013) 7:1337–45. doi: 10.1177/193229681300700525
27. Griggs S, Grey M, Ash GI, Li CSR, Crawford SL, and Hickman RL. Objective sleep-wake characteristics are associated with diabetes symptoms in young adults with type 1 diabetes. Sci Diabetes Self Manag Care. (2022) 48:149–56. doi: 10.1177/26350106221094521
28. Griggs S, Strohl KP, Grey M, Barbato E, Margevicius S, and Hickman RL. Circadian characteristics of the rest-activity rhythm, executive function, and glucose fluctuations in young adults with type 1 diabetes. Chronobiol Int. (2021) 38:1477–87. doi: 10.1080/07420528.2021.1932987
29. Griggs S, Hickman RL, Strohl KP, Redeker NS, Crawford SL, and Grey M. Sleep-wake characteristics, daytime sleepiness, and glycemia in young adults with type 1 diabetes. J Clin Sleep Med. (2021) 17:1865–74. doi: 10.5664/jcsm.9402
30. Chakrabarti A, Trawley S, Kubilay E, Mohammad Alipoor A, Vogrin S, Fourlanos S, et al. Closed-loop insulin delivery effects on glycemia during sleep and sleep quality in older adults with type 1 diabetes: results from the ORACL trial. Diabetes Technol Ther. (2022) 24:666–71. doi: 10.1089/dia.2022.0110
31. Bisio A, Gonder-Frederick L, McFadden R, Cherñavvsky D, Voelmle M, Pajewski M, et al. The impact of a recently approved automated insulin delivery system on glycemic, sleep, and psychosocial outcomes in older adults with type 1 diabetes: A pilot study. J Diabetes Sci Technol. (2022) 16:663–9. doi: 10.1177/1932296820986879
32. Martyn-Nemeth P, Duffecy J, Quinn L, Steffen A, Baron K, Chapagai S, et al. Sleep-opt-in: A randomized controlled pilot study to improve sleep and glycemic variability in adults with type 1 diabetes. Sci Diabetes Self Manag Care. (2023) 49:11–22. doi: 10.1177/26350106221136495
33. Basille D, Timmerman M, Basille-Fantinato A, Al-Salameh A, Fendri S, and Lalau JD. Screening for sleep-disordered breathing in people with type 1 diabetes by combining polysomnography with glucose variability assessment. Diabetes Res Clin Pract. (2022) 185:109786. doi: 10.1016/j.diabres.2022.109786
34. Arosemena M, Salguero MV, Naylor RN, Wroblewski K, Tasali E, and Philipson LH. Objective and subjective sleep patterns in adults with maturity-onset diabetes of the young (MODY). Diabetes Care. (2023) 46(3):608–12. doi: 10.2337/dc22-1343
35. Landmeier KA, Lanning M, Carmody D, Greeley SAW, and Msall ME. ADHD, learning difficulties and sleep disturbances associated with KCNJ11-related neonatal diabetes. Pediatr Diabetes. (2017) 18:518–23. doi: 10.1111/pedi.12428
36. Tian P, Hendrix KR, Choppara S, Wroblewski K, Letourneau-Freiberg LR, Spruyt K, et al. Increased Actigraphy-Based Sleep Variability and Poor Sleep Behaviors in KATPChannel-Related Neonatal Diabetes Mellitus (KATP-NDM) Individuals Compared to Unaffected Siblings. Abstracts of the 2022 Pediatric Endocrine Society (PES) Annual Meeting. Horm Res Paediatr. (2022) 95Suppl (Hormone research in pediatrics, Karger Publishers: Basel, Switzerland). 1:1–266.
37. Brod M, Pohlman B, Wolden M, and Christensen T. Non-severe nocturnal hypoglycemic events: experience and impacts on patient functioning and well-being. Qual Life Res. (2013) 22:997–1004. doi: 10.1007/s11136-012-0234-3
38. Brod M, Christensen T, and Bushnell DM. Impact of nocturnal hypoglycemic events on diabetes management, sleep quality, and next-day function: results from a four-country survey. J Med Econ. (2012) 15:77–86. doi: 10.3111/13696998.2011.624144
39. Farabi SS. Type 1 diabetes and sleep. Diabetes Spectr. (2016) 29:10–3. doi: 10.2337/diaspect.29.1.10
40. Amaral FG, Turati AO, Barone M, Scialfa JH, do Carmo Buonfiglio D, Peres R, et al. Melatonin synthesis impairment as a new deleterious outcome of diabetes-derived hyperglycemia. J Pineal Res. (2014) 57:67–79. doi: 10.1111/jpi.12144
41. Cho Y. Early development of bidirectional associations between sleep disturbance and diabetes. Diabetes Metab J. (2020) 44:668–70. doi: 10.4093/dmj.2020.0198
42. Balat K, Pazarlı AC, İnönü Köseoğlu H, Yaşayancan N, and Demir O. Importance of anthropometric measurements to determine cardiometabolic diseases in obstructive sleep apnea syndrome. Turk Thorac J. (2021) 22:11–7. doi: 10.5152/TurkThoracJ.2020.19105
43. Pazarlı AC. The role of anthropometric measurements in identifying cardiometabolic diseases in obstructive sleep apnea syndrome. Tuberk Toraks. (2022) 70:287–92. doi: 10.5578/tt.20229708
44. Spiegel K, Tasali E, Leproult R, and Van Cauter E. Effects of poor and short sleep on glucose metabolism and obesity risk. Nat Rev Endocrinol. (2009) 5:253–61. doi: 10.1038/nrendo.2009.23
45. Shivers JP, Mackowiak L, Anhalt H, and Zisser H. Turn it off!”: diabetes device alarm fatigue considerations for the present and the future. J Diabetes Sci Technol. (2013) 7:789–94. doi: 10.1177/193229681300700324
46. Messer LH, Johnson R, Driscoll KA, and Jones J. Best friend or spy: a qualitative meta-synthesis on the impact of continuous glucose monitoring on life with Type 1 diabetes. Diabetes Med. (2018) 35:409–18. doi: 10.1111/dme.13568
47. Buchberger B, Huppertz H, Krabbe L, Lux B, Mattivi JT, and Siafarikas A. Symptoms of depression and anxiety in youth with type 1 diabetes: A systematic review and meta-analysis. Psychoneuroendocrinology. (2016) 70:70–84. doi: 10.1016/j.psyneuen.2016.04.019
48. Benca RM, Okawa M, Uchiyama M, Ozaki S, Nakajima T, Shibui K, et al. Sleep and mood disorders. Sleep Med Rev. (1997) 1:45–56. doi: 10.1016/S1087-0792(97)90005-8
49. Huang T, Lin BM, Stampfer MJ, Tworoger SS, Hu FB, and Redline S. A population-based study of the bidirectional association between obstructive sleep apnea and type 2 diabetes in three prospective U.S. Cohorts. Diabetes Care. (2018) 41:2111–9. doi: 10.2337/dc18-0675
50. Aurora RN and Punjabi NM. Obstructive sleep apnoea and type 2 diabetes mellitus: a bidirectional association. Lancet Respir Med. (2013) 1:329–38. doi: 10.1016/S2213-2600(13)70039-0
51. Sinisterra M, Hamburger S, Tully C, Hamburger E, Jaser S, and Streisand R. Young children with type 1 diabetes: sleep, health-related quality of life, and continuous glucose monitor use. Diabetes Technol Ther. (2020) 22:639–42. doi: 10.1089/dia.2019.0437
Keywords: type 1 diabetes mellitus, monogenic diabetes mellitus, sleep, obstructive sleep apnea, MODY (mature onset diabetes of the young)
Citation: Arosemena M, Salguero MV, Greeley SAW, Naylor RN, Tasali E and Philipson LH (2025) Sleep patterns in adults and children with less common forms of diabetes. Front. Endocrinol. 16:1388995. doi: 10.3389/fendo.2025.1388995
Received: 20 February 2024; Accepted: 22 September 2025;
Published: 13 October 2025.
Edited by:
Åke Sjöholm, Gävle Hospital, SwedenReviewed by:
Jerzy Beltowski, Medical University of Lublin, PolandAhmet Cemal Pazarlı, Gaziosmanpaşa University, Türkiye
Betül Tiryaki Baştuğ, Bilecik Şeyh Edebali University, Türkiye
Copyright © 2025 Arosemena, Salguero, Greeley, Naylor, Tasali and Philipson. This is an open-access article distributed under the terms of the Creative Commons Attribution License (CC BY). The use, distribution or reproduction in other forums is permitted, provided the original author(s) and the copyright owner(s) are credited and that the original publication in this journal is cited, in accordance with accepted academic practice. No use, distribution or reproduction is permitted which does not comply with these terms.
*Correspondence: Marilyn Arosemena, bWFyaWx5bmFyb3NlbWVuYUBnbWFpbC5jb20=