 Dexing Dai†
 Yali Ling†
 Feng Xu
 Haibo LiRui WangYingying GuXuedi XiaAn XiongRuoman SunLei QiuYa DingYixin YuXueyang Cai
 Zhongjian Xie*
- National Clinical Research Center for Metabolic Diseases, Hunan Provincial Key Laboratory of Metabolic Bone Disease, and Department of Metabolism and Endocrinology, The Second Xiangya Hospital of Central South University, Changsha, Hunan, China
Background: Previous studies have shown that individuals with high body mass index typically require high doses of vitamin D supplementation to correct vitamin D deficiency. However, it is unclear which specific body composition is the determining factor affecting the bioavailability of vitamin D after supplementation. The aim of this study was to determine which body components affect the bioavailability of vitamin D.
Methods: In order to ensure the compliance of the study subjects and avoid the impact of sunlight on vitamin D3 levels, the subjects received multiple intramuscular (i.m.) injections of vitamin D2 until their serum levels of 25-hydroxyvitamin D [25(OH)D] were above 30 ng/mL. All subjects received two i.m. injections of 600,000 IU vitamin D2, and dose adjustments were made every 6 weeks based on whether serum 25(OH)D levels were sufficient. The levels of serum 25(OH)D2 and 25(OH)D3 were determined by liquid chromatography tandem mass spectrometry. The body composition was measured using dual-energy X-ray absorptiometry and corrected using body fat mass index (FMI). Based on the 100% difference in 25(OH)D levels before and after vitamin D supplementation, the sample size was calculated, and 20 subjects would provide over 95% of the power to show the difference.
Results: After two dose adjustment, the serum 25(OH)D levels of all subjects were above 30 ng/mL. The subjects were divided into ≤ 1,200,000 IU vitamin D2 (n=10) and ≥ 2,400,000 IU vitamin D2 (n=15) based on the i.m. dose of vitamin D2. The results showed that compared with subjects receiving ≤ 1,200,000 IU vitamin D2, subjects receiving ≥ 2,400,000 IU of vitamin D2 had a higher total body fat mass index (FMI), particularly with higher trunk fat content and high visceral adipose tissue mass. However, the dosage of vitamin D2 supplementation was not related to BMI and lean mass content.
Conclusion: The body fat content, especially trunk fat content, is the main body component that affects the bioavailability of vitamin D in healthy adults. Healthy adults with high trunk fat content have low bioavailability of vitamin D and require relatively high dose of vitamin D to achieve sufficient levels.
Clinical Trial Registration: http://www.chictr.org.cn, identifier ChiCTR2300070641.
1 Introduction
Vitamin D is an open-loop sterol fat soluble essential micronutrient relevant to numerous biological processes (1). It has been found that vitamin D is mainly stored in adipocytes through animal research using radio-labeled method (2). Vitamin D deficiency has become a global public health issue that may impair bone health and increase the incidence and progression of cancer, immune and cardiovascular diseases (3–6). Therefore, in order to maximize the protection of the health of bones and other organs, the nutritional status of human vitamin D needs to be sufficient. It is generally believed that serum levels of 25-hydroxyvitamin D [25(OH)D]< 20 ng/mL are vitamin D deficiency, and serum levels of 25(OH)D levels< 30 ng/mL are vitamin D insufficiency (7). The serum level of serum 25(OH)D is influenced by various factors including sunshine duration, ultraviolet radiation B (UVB) intensity, race, age, geographic latitude, dietary habits, dressing habits, and obesity. Previous studies have shown that serum levels of 25(OH)D in subjects with high normal body mass index (BMI) are lower than those in subjects with normal BMI, and serum levels of 25(OH)D in subjects with higher BMI have lower serum 25(OH)D levels than subjects with normal BMI after taking vitamin D3 orally (8–12). In addition, some cross-sectional studies have shown that increased waist circumference (WC) is related to the elevated risk of vitamin D deficiency in adults (13, 14). However, other cross-sectional studies have shown that WC and BMI are not associated with serum 25(OH)D levels (15, 16). The possible reason for the inconsistency in these results is that BMI or WC cannot reflect the amount of each body component, which may be a factor affecting the bioavailability of vitamin D. Other influencing factors include medication adherence and differences in sunlight exposure.
In the present study, in order to improve subject compliance and eliminate the influence of different sunlight exposure, we injected different doses of vitamin D2 into the muscles of subjects with different body components, and then observed whether the nutritional level of vitamin D reached the target level to determine which body component is the main factor affecting the bioavailability of vitamin D2.
2 Materials and methods
2.1 Study design
This 32-week, randomized, controlled clinical trial was conducted in healthy Chinese adults in Changsha, China, from March 2022 to October 2022, and lasted from early spring (March) to autumn (October). The aim of the study was to determine which body components affect the bioavailability of vitamin D. We chose intramuscular injection of vitamin D2 as the supplement method for vitamin D because the increased levels of 25(OH)D2 after vitamin D2 supplementation are not affected by sunlight. This study conforms to the principles outlined in the Declaration of Helsinki and has been approved by the Ethics Committee of the National Clinical Medical Research Center, the Second Xiangya Hospital, Central South University and registered in the China Clinical Trial Registration Center (ChiCTR number: ChiCTR2300070641). All participants signed informed consent forms before enrollment.
2.2 Participants
The study recruited adults with vitamin D deficiency [25(OH)D< 20 ng/mL] at the Second Xiangya Hospital. All participants understood the purpose of the trial and the benefits and possible risks during the study before enrollment. Subjects entered the screening process after signing the informed consent form, and subjects who met the enrollment criteria were numbered. The main enrollment criteria were based on the following terms: (1) serum 25(OH)D< 20 ng/mL; (2) aged between 18 and 60 years old; (3) No liver or kidney dysfunction or other serious diseases; (4) No long-term activity plan in tropical aeras within 6 months after the start of the experiment; (5) Voluntarily participate in the study and sign informed consent. The exclusion criteria were: (1) vitamin D supplements in the last 6 months; (2) a history of any drugs that affect vitamin D metabolism (such as phenytoin, phenobarbital, rifampicin) in the last 6 months; (3) unwillingness to participate in research; (4) a history of cognitive impairment or physical dysfunction that affects the completion of research; (5) Hypercalcemia, vitamin D poisoning, renal insufficiency, chronic diarrhea, hypoproteinemia or other diseases that affect vitamin D metabolism.
2.3 Sample size
Our previous studies have shown that a single i.m. injection of 600,000 IU vitamin D2 increases serum total 25(OH)D levels by 10.3 ng/mL (17). In the present study, the average baseline level of 25(OH)D was 7.6 ± 2.1 ng/mL. We estimated that subjects with vitamin D deficiency would need multiple i.m. injections of 600,000 IU vitamin D2 to achieve sufficient levels of vitamin D, i.e. serum total 25(OH)D ≥30 ng/mL. We assumed that the vitamin D sufficient rate before supplementation was 0% and the vitamin D sufficient rate after supplementation was 100%. The sample size of this study was calculated based on 5% of the inspection level (α), 95% of the inspection efficacy (1-β), and a relative difference of 100% when vitamin D levels reached sufficient levels before and after supplementation. The following formula was used to calculate the sample size required for this study (18).
N: sample size; 1: the incidence of vitamin D sufficient before supplement (0%); 2: the incidence of vitamin D sufficient after supplement (100%); = (1+ 2)/2; Z1-α/2: the standard deviation corresponding to the α level; Zβ: is the standard deviation corresponding to the level of 1-β; α: 0.05 and 1-β: 0.95.
In the sample size calculation, we set a significance level of 0.05 and a withdrawal rate of 20%. The sample size of 20 subjects supplementing with vitamin D2 would provide over 95% power to show differences.
2.4 Randomization and intervention
Thirty volunteers were recruited and screened, among which subjects who met inclusion and exclusion criteria were enrolled and given the enrollment number in the order of arrival. Twenty-five subjects were received multiple i.m. injection of 600,000 IU vitamin D2 until the subject’s 25(OH)D level reached to the sufficient level. The follow-up and intervention procedures of the subjects are shown in Figure 1. Subjects were given a single i.m. injection of 600,000 IU vitamin D2 at the beginning of the study, followed by another 600,000 IU vitamin D2 after an interval of two weeks. The vitamin D2 supplement were adjusted every 6 weeks (week 6 and 12 of the study) based on whether serum 25(OH)D levels reached sufficient levels. Subjects whose serum 25(OH)D levels< 30 ng/mL continued to receive a single i.m. injection of 600,000 IU vitamin D2, followed by another 600,000 IU vitamin D2 after an interval of two weeks (at week 8 or 12 of the study). Finally, according to the dose of vitamin D2 supplementation, subjects was divided into ≤ 1,200,000 IU vitamin D2 group and ≥ 2,400,000 IU vitamin D2 group.
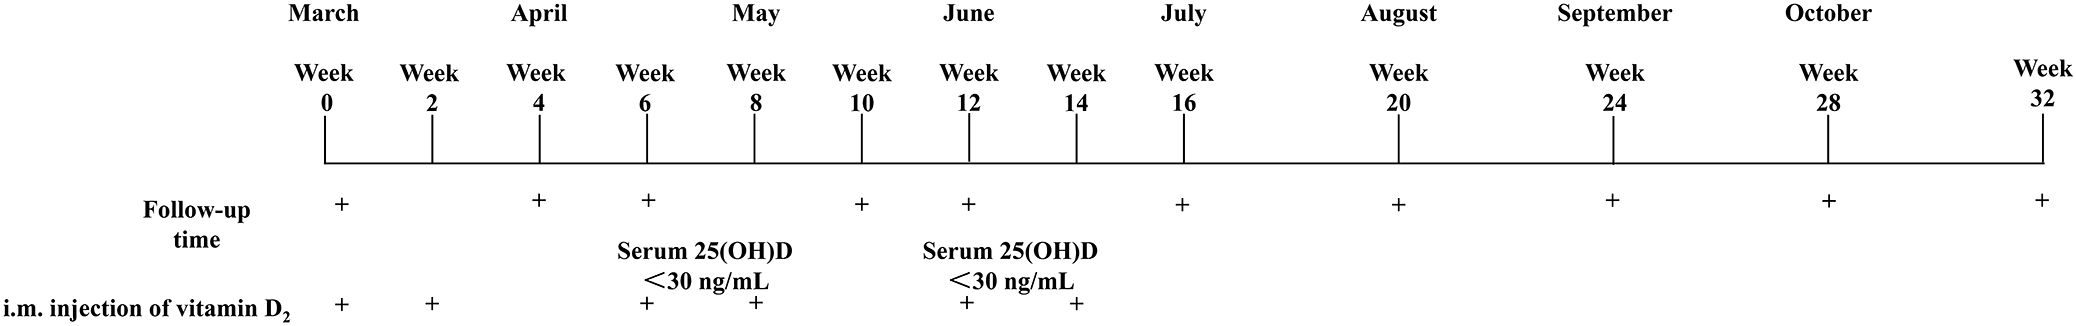
Figure 1. Follow-up and intervention procedures for the subjects. 25(OH)D, 25-Hydroxyvitamin D; i.m., Intramuscular.
The vitamin D2 (Futai, 200,000 IU/1 mL) was purchased from Jiangxi Gannan Haixin Pharmaceutical Co., Ltd. (Ganzhou, Jiangxi, China). The vitamin D2 content corresponding to the indicated amount was confirmed by using Waters 1525–1489 high performance liquid chromatography (Waters, Milford, MA). All subjects were instructed normal diet, not to take calcium and oral vitamin D supplements, and not to take medications that affect vitamin D metabolism during the study period. The blood sample were collected at baseline and 4, 6, 10, 12, 16, 20, 24, 28, and 32 weeks after i.m. injection of vitamin D2. The 24-hour urine sample were collected at baseline and 4, 12, 16, 20, and 24 weeks after i.m. injection of vitamin D2. Body composition was measured by dual-energy X-ray absorptiometry (DXA) at 32 weeks after i.m. injection of vitamin D2. None of the subjects was withdrawn.
2.5 Biochemical marker determination
The serum samples from subjects were collected and stored at -80°C until the last batch of samples were collected and sent for testing. The vitamin D status was determined by measuring serum 25(OH)D levels, and Endocrine Society recommends achieving a 25(OH)D of 30 ng/mL (19). Due to the inability to distinguish between serum 25(OH)D2 and serum 25(OH)D3 when measuring serum 25(OH)D using chemiluminescence detection, serum 25(OH)D2 and 25(OH)D3 were measured by liquid chromatography tandem mass spectrometry (LC-MS/MS) using SCIEX 4500 MD LC-MS/MS at King Med Clinical Laboratory (Changsha, Hunan, China). The detection limits for serum 25(OH)D2 and 25(OH)D3 were 2.2 ng/mL and 2.6 ng/mL, respectively, with the intra-batch coefficient of variation (CV) approximately 3.0%. When the serum 25(OH)D2 level of the subject was below the detection limit, the value was recorded as 0 ng/mL.
Levels of serum calcium and 24-hour urinary calcium (24 h-Uca) were measured by arsenazo method to assess whether hypercalcemia and hypercalciuria after i.m. injection of vitamin D2, with an intra-batch CV was less than 3.5%, and an inter-batch CV was less than 6.0%. Hypercalcemia was defined as a fasting serum calcium level above 2.75 mmol/L (11 mg/dL). To calculate the urinary calcium/creatinine ratio, 24 h-Uca and 24-hour urinary creatinine (24 h-UCr) were measured. Both serum creatine and 24 h-UCr were detected using enzymatic methods, with an intra-batch CV was less than 5.0%, and an inter-batch CV was less than 5.0%. Hypercalciuria was defined as 24 h-Uca/24 h-UCr values above 0.3 mg/day or 24 h-Uca in females exceeds 6.25 mmol/day or in males exceeds 7.50 mmol/day (20).
Serum osteocalcin, intact parathyroid hormone (iPTH), bone formation markers including N-terminal propeptide of type I procollagen (P1NP), and bone resorption markers β C-terminal telopeptide of type I collagen (β-CTX) were measured by electrochemiluminescence in the Clinical Laboratory of Endocrinology at the Second Xiangya Hospital of Central South University (Changsha, Hunan, China). The intra-batch CV of osteocalcin, iPTH, P1NP and β-CTX were 1.8%, 2.7%, 3.0% and 3.5%, respectively, and the in inter-batch CV was 3.3%, 6.5%, 3.0%, 8.4%, respectively.
2.6 Body composition determination
Height (cm) and weight (kg) of the subjects were measured and their gender and age were recorded. The total body fat mass, total body lean mass, trunk fat mass, limb fat mass and visceral adipose tissue (VAT) mass were measured by DXA (Discovery, WiS/N87556, Hologic Inc., Bedford, MA, USA). Fat mass index (FMI) was calculated as total body fat mass (kg)/height2 (m2). Lean mass index (LMI) was calculated as total body lean mass (kg)/height2 (m2). Fat mass ratio (FMR) includes two indices, trunk fat mass (kg)/leg fat mass (kg) and trunk fat mass (kg)/limb fat mass (kg), respectively (21).
2.7 Statistical analysis
Statistical analysis was performed using SPSS software (SPSS Inc., Chicago, IL, version 26.0). All descriptive statistics are shown as mean ± standard (SD). Differences among different groups were determined by analysis of variance (ANOVA) for parametric data. Repeated measurements analysis was performed, and then multivariate-least significant difference post hoc tests were performed to analyze the differences among groups at the followed-up time point. Assessment of the incidence of hypercalcemia and hypercalciuria between groups using chi square test or Fisher’s exact probability method (theoretical frequency< 1). If p value less than 0.05, the differences were considered to be statistically significant.
3 Results
Of the 25 participants enrolled at baseline, 25 finished the overall program and thus were included for further analysis (Figure 2). The characteristics of the subjects are presented in Table 1. Of the 25 subjects, 15 subjects (60.0%) were females and 10 subjects (40.0%) were males, and all subjects were vitamin D deficient. The mean age of the subjects was 26.3 ± 2.7 years, the mean height was 163.9 ± 10.4 cm, the mean weight was 61.4 ± 17.1 kg, and the mean BMI was 21.9 ± 3.4 kg/m2. The average baseline of total serum 25(OH)D levels of all subjects was 7.6 ± 2.1 ng/mL, and the serum 25(OH)D2 levels of all subjects were undetectable. According to the dose of vitamin D2 required for vitamin D to reach the sufficient status, the subjects were divided into divided into ≤ 1,200,000 IU vitamin D2 group (n=10) and ≥ 2,400,000 IU vitamin D2 group (n=15). There were no significant differences in age, height, weight, BMI, 25(OH)D, iPTH, β-CTX, P1NP, osteocalcin, serum calcium, serum creatinine, 24 h-Uca urinary calcium, and 24 h-Ucr levels between two groups (Table 1).
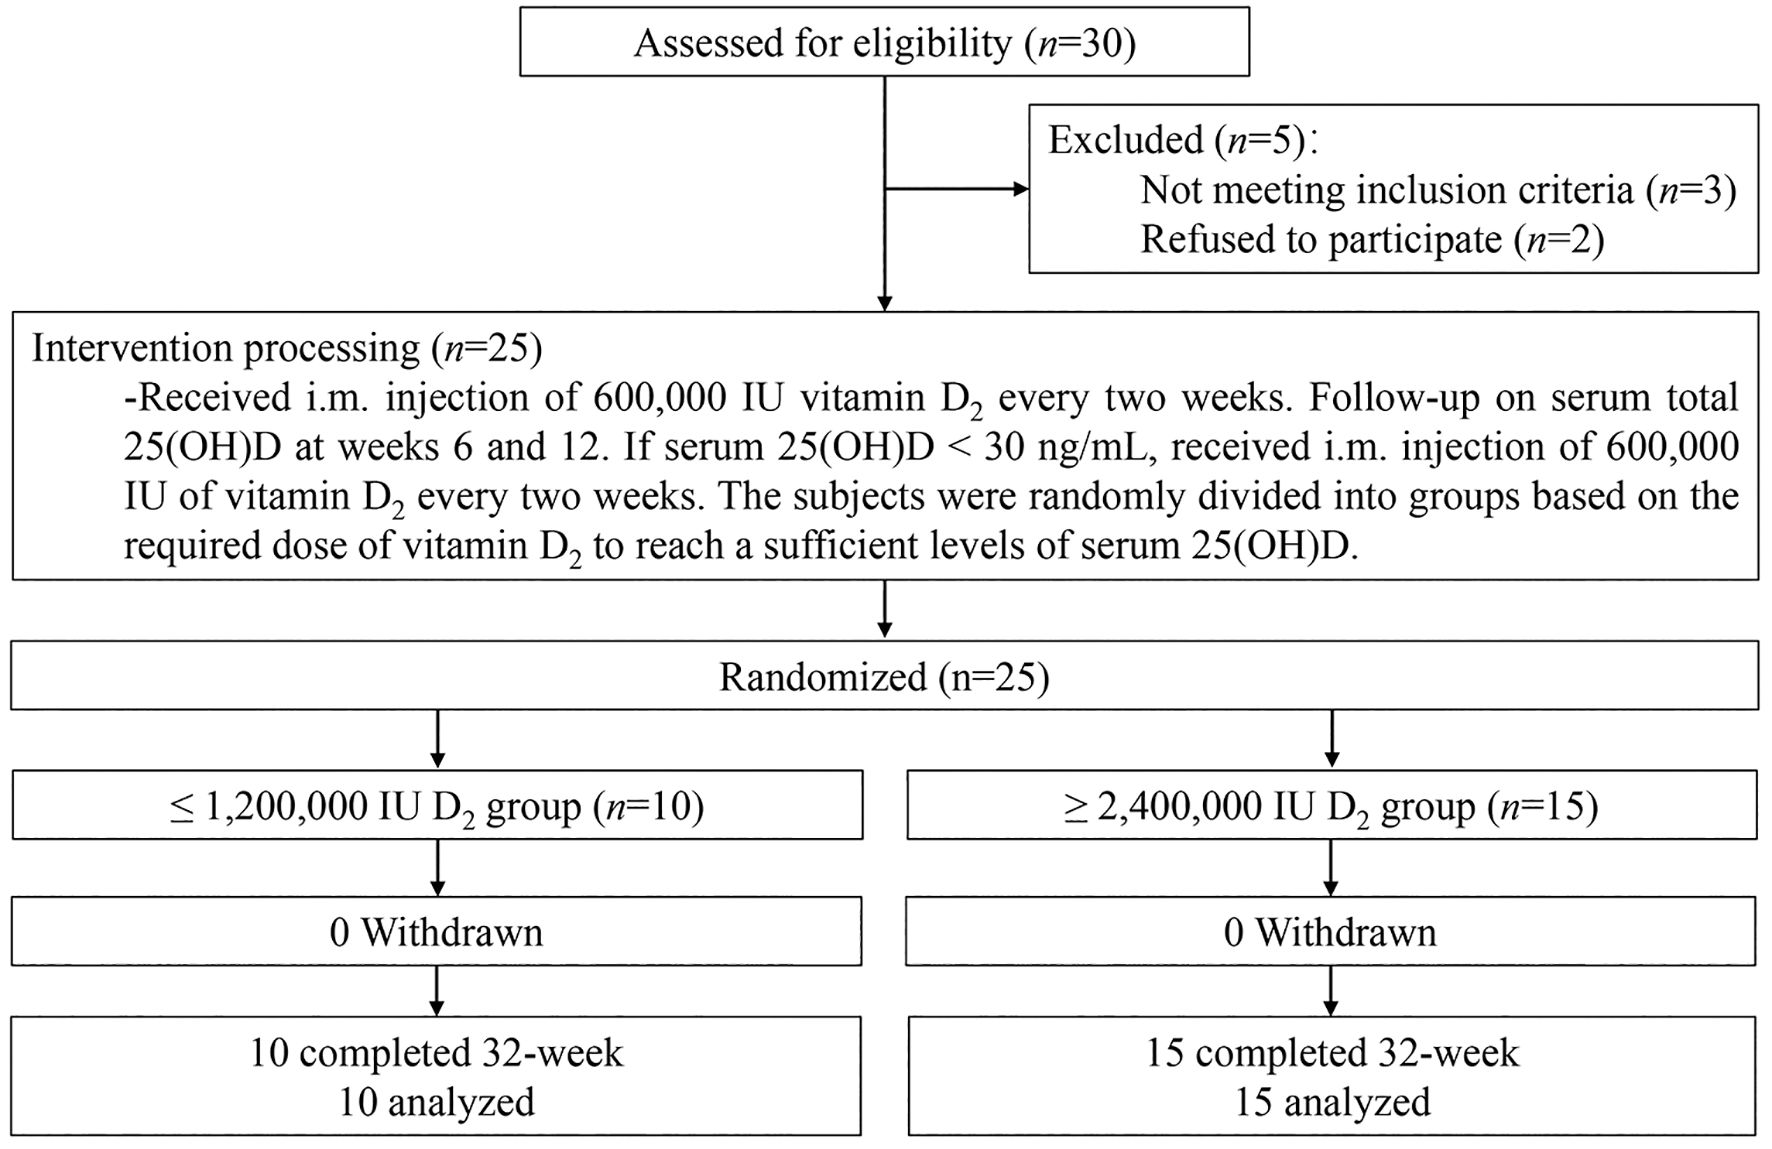
Figure 2. Flow diagram of the study. 25(OH)D, 25-Hydroxyvitamin D; i.m., Intramuscular; IU, International units.
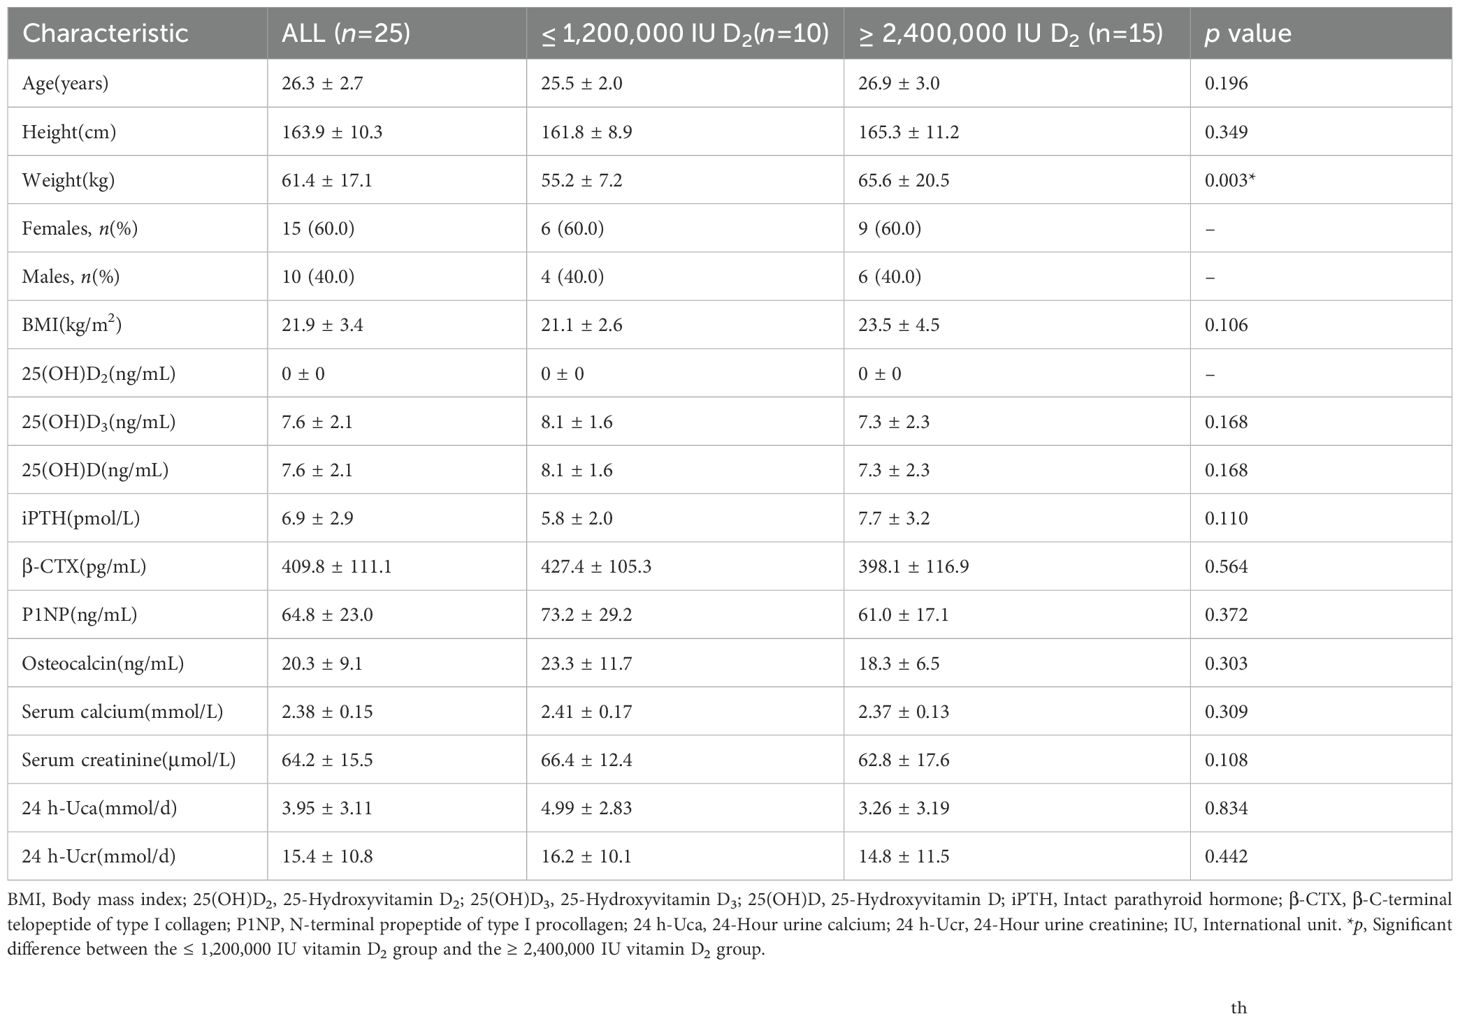
Table 1. Baseline characteristics of the subjects.
Figure 3 shows the levels of serum total 25(OH)D (Figure 3a) and 25(OH)D2 (Figure 3b) levels changes over time after multiple i.m. injections of vitamin D2. After i.m. injection of vitamin D2, the serum total 25(OH)D levels of subjects in two group increased significantly after the 4th week. The total serum 25(OH)D levels of subjects with i.m. injection of ≤ 1,200,000 IU vitamin D2 group reached vitamin D sufficient status after 6th week and remained stable until the end of study, with average peak value of 40.7 ± 12.3 ng/mL. However, the total serum 25(OH)D level of the subjects who received ≥ 2,400,000 IU vitamin D2 i.m. injection reached vitamin D sufficient status and remained stable at the 16th week, with average peak value of 38.2 ± 7.1 ng/mL. In addition, at weeks 4, 6, 10, and 12, the serum total 25(OH)D levels in the ≤ 1,200,000 IU vitamin D2 group was significantly higher than those in the ≥ 2,400,000 IU vitamin D2 group (Figure 3a).
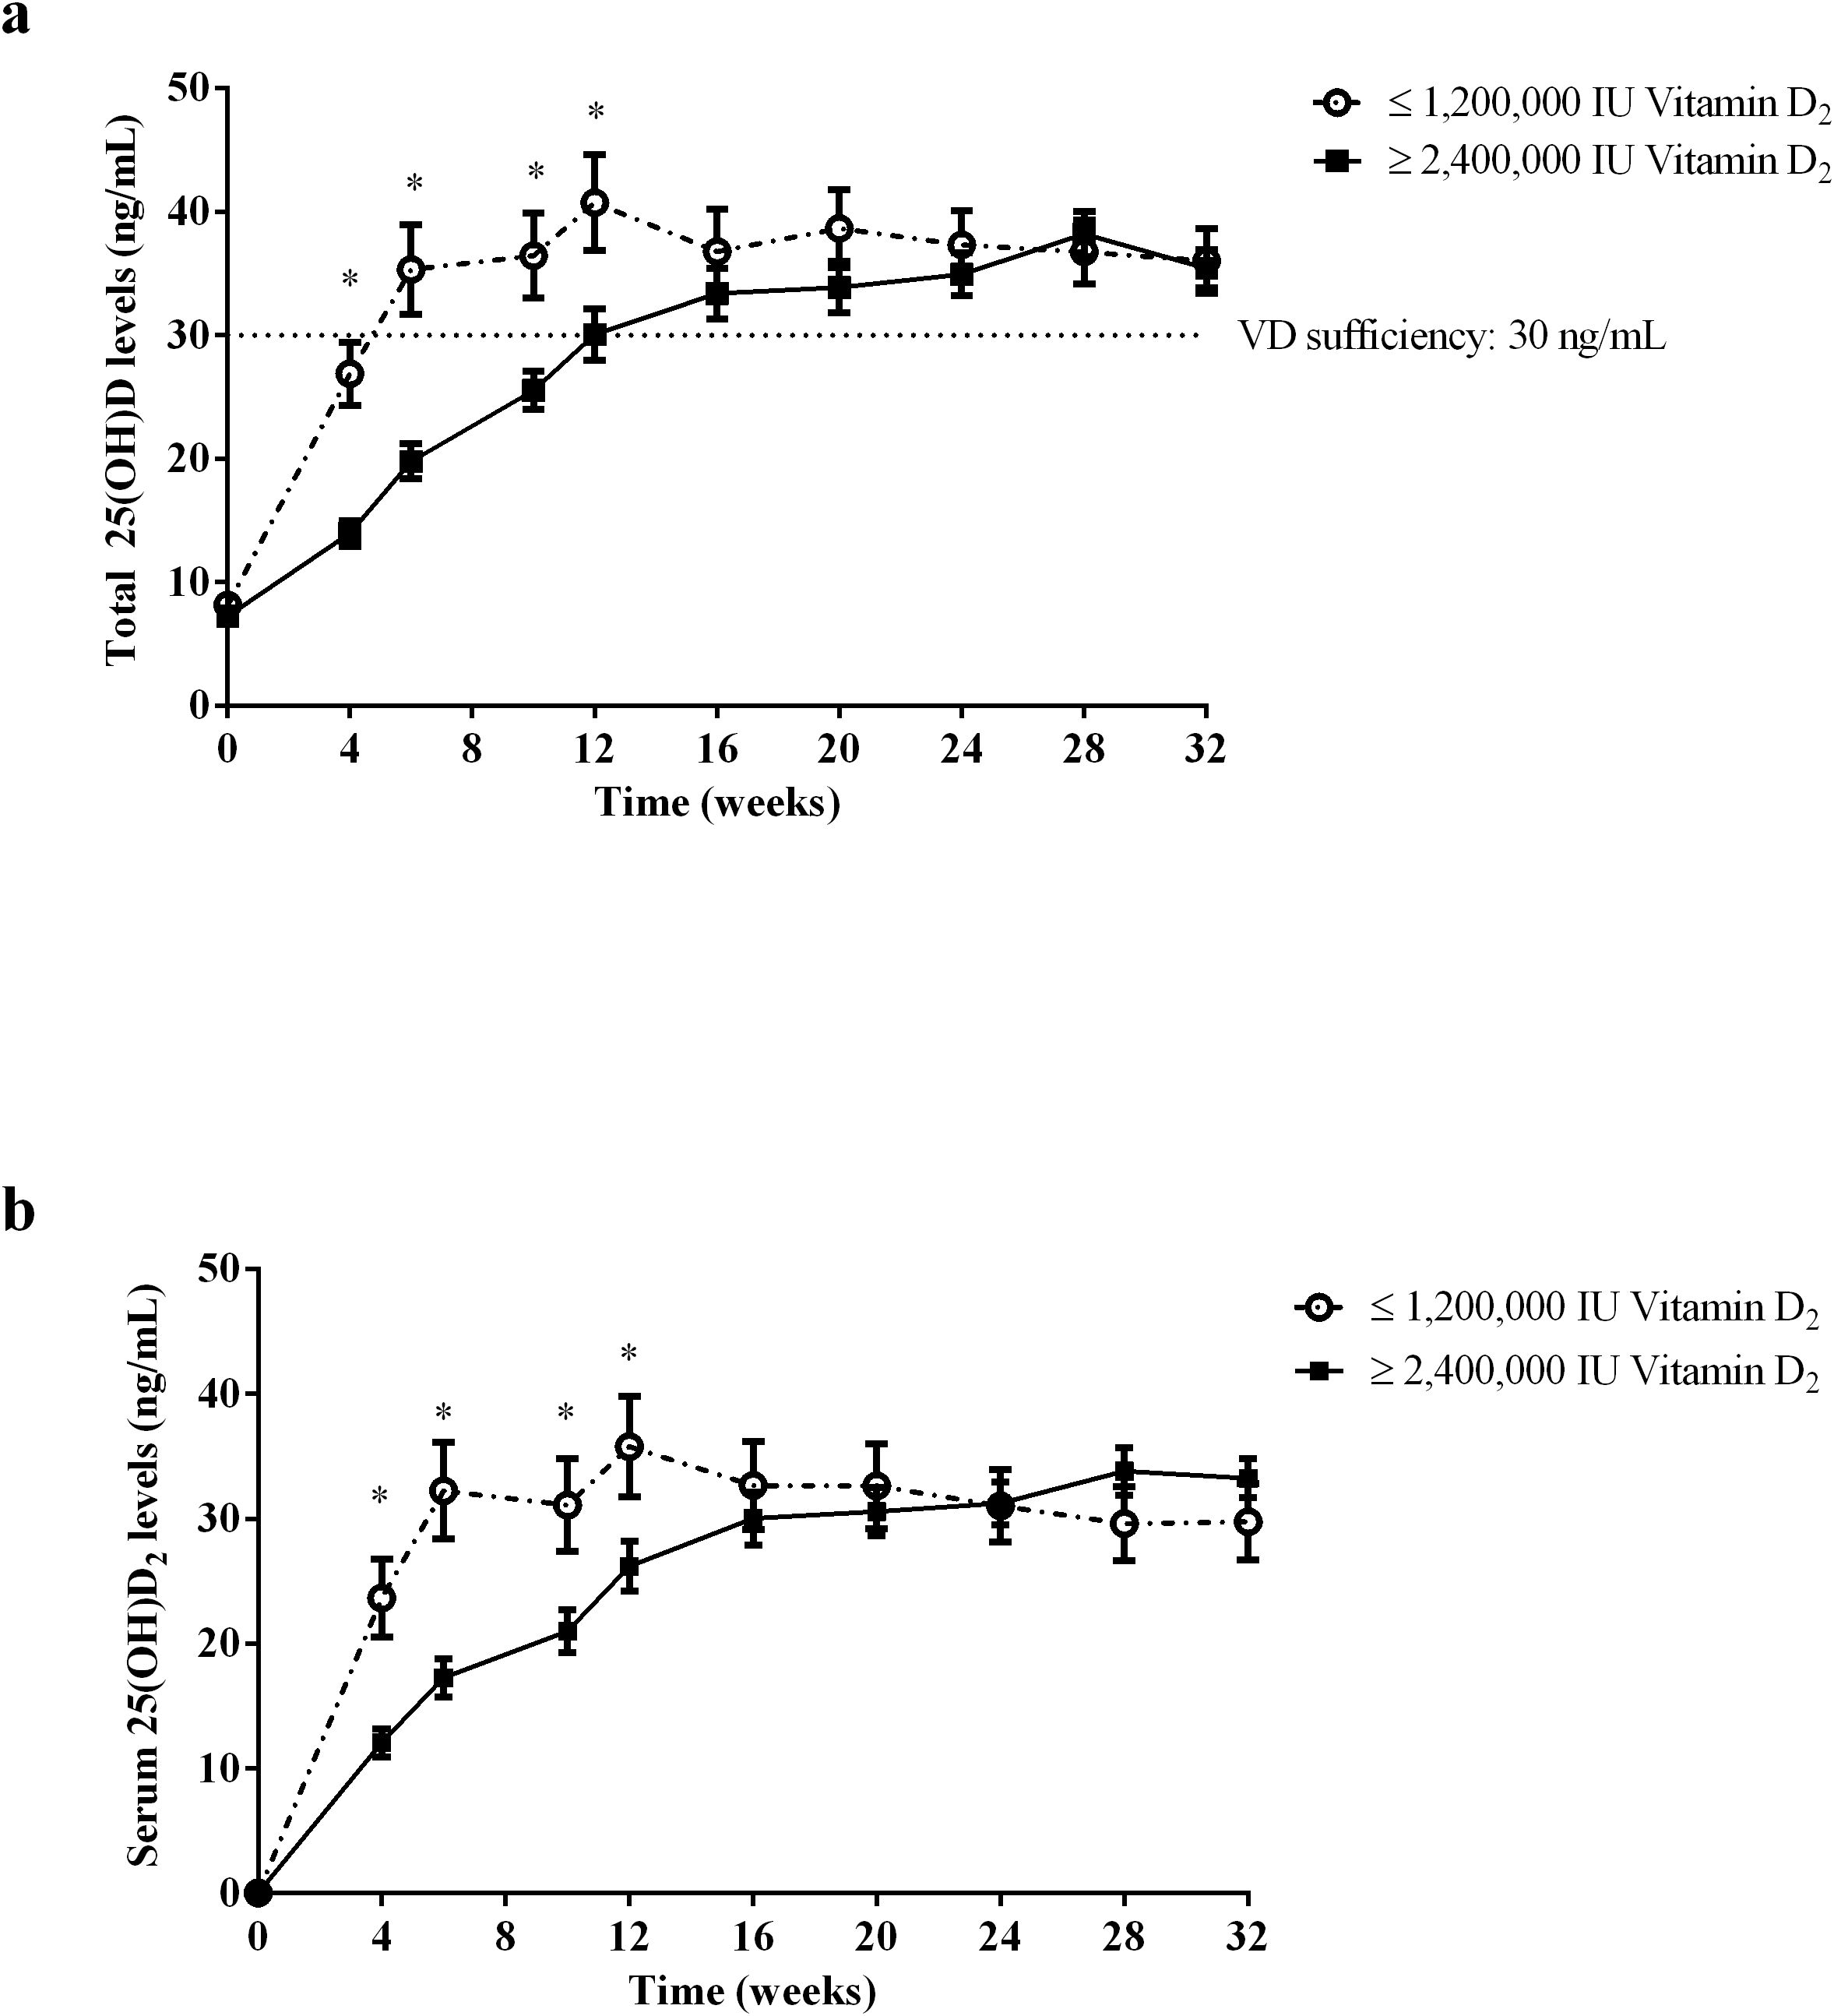
Figure 3. The total serum 25(OH)D (a) and 25(OH)D2 (b) level change over time after i.m. injection of vitamin D2. The subjects were divided into ≤ 1,200,000 IU vitamin D2 group (n=10) and ≥ 2,400,000 IU vitamin D2 group (n=15) according to the dose of vitamin D2 required reach sufficient vitamin D status. The dotted line shows the critical value of 30 ng/ml for vitamin D to reach the sufficient state. Data are shown as mean ± SD at each follow-up point. *P, significant difference between the ≤ 1,200,000 IU vitamin D2 group and the ≥ 2,400,000 IU vitamin D2 group at each follow-up time point. 25(OH)D, 25-hydroxyvitamin D; 25(OH)D2, 25-hydroxyvitamin D2.
To eliminate the influence of sunlight, we used LS-MS/MS to determine the serum 25(OH)D2 levels at various follow-up points to analyze the bioavailability of vitamin D2 after intramuscular injection (Figure 3b). Serum 25(OH)D2 levels of subjects with i.m. injection of ≤ 1,200,000 IU vitamin D2 group and ≥ 2,400,000 IU vitamin D2 group reached vitamin D sufficient state after week 6 and week 16, respectively, and remained stable until the end of study. However, there was no significant difference in the average of serum 25(OH)D2 levels peak value between the ≤ 1,200,000 IU vitamin D2 group and the ≥ 2,400,000 IU vitamin D2 group (35.8 ± 12.8 ng/mL vs. 33.8 ± 7.4 ng/mL, p = 0.311). Similarly, at weeks 4, 6, 10, and 12, the serum 25(OH)D2 levels in the ≤ 1,200,000 IU vitamin D2 group was significantly higher than those in the ≥ 2,400,000 IU vitamin D2 group. Of note, the serum 25(OH)D2 levels of both groups were still above 30 ng/mL and remained stable at the end of study, probably due to the large amount of vitamin D stored in adipose tissue and slowly released into the bloodstream. These results suggest that subjects who received low-doses of vitamin D2 supplementation have a shorter time to reach the target level and have better bioavailability of vitamin D2.
In the present study, we observed significant differences in the bioavailability of vitamin D among different subjects. To investigate which factors affect the bioavailability of vitamin D2, we analyzed whether there was any difference in BMI between the two groups. As shown in Figure 4, There was no significant difference in BMI between the ≤ 1,200,000 IU vitamin D2 group and the ≥ 2,400,000 IU vitamin D2 group (21.1 ± 2.6 kg/m2 vs. 23.5 ± 4.5 ng/mL, p = 0.106).
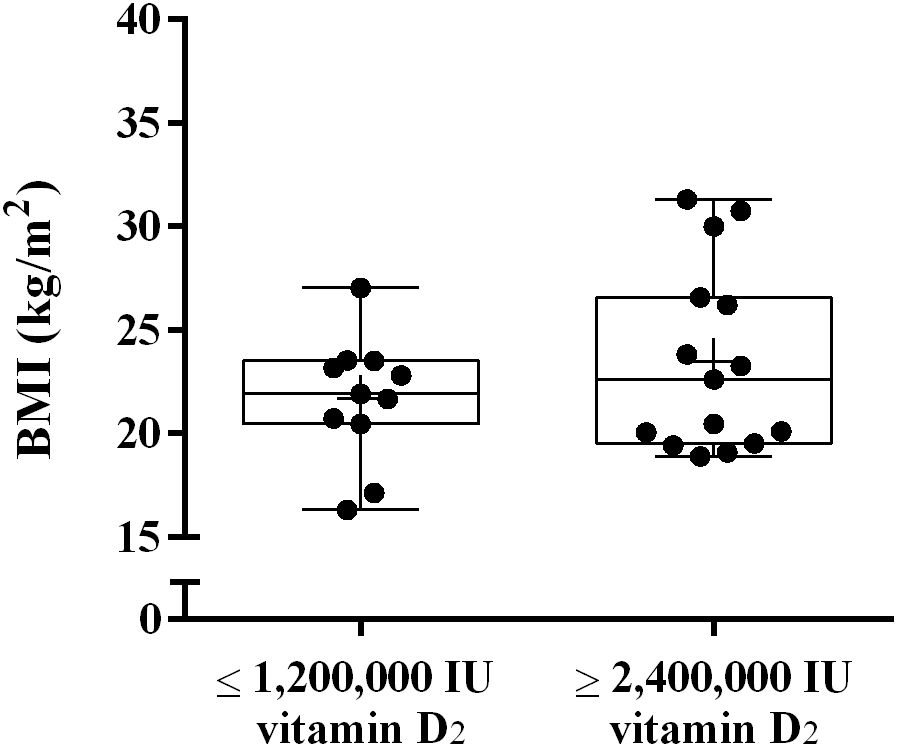
Figure 4. The difference in BMI between the ≤ 1,200,000 IU vitamin D2 group and the ≥ 2,400,000 IU vitamin D2 group. Data are shown as boxplots, including interquartile range, median, maximum and minimum value. BMI, Body mass index; IU, International units.
Vitamin D is mainly stored in adipocytes, and the amount of adipose tissue may affect the level of serum 25(OH)D. To investigate whether the fat content affects the bioavailability of vitamin D2, we used DXA to measure the body components of subjects 32 weeks after intramuscular injection of vitamin D. As shown in Figure 5, the results showed that the total body fat mass and total FMI of subjects in ≥ 2,400,000 IU vitamin D2 group was significantly higher than those in the ≤ 1,200,000 IU vitamin D2 group (p< 0.05) (Figures 5a, b). These results suggest that subjects who require higher doses of vitamin D to achieve sufficient levels of vitamin D have higher total fat content.
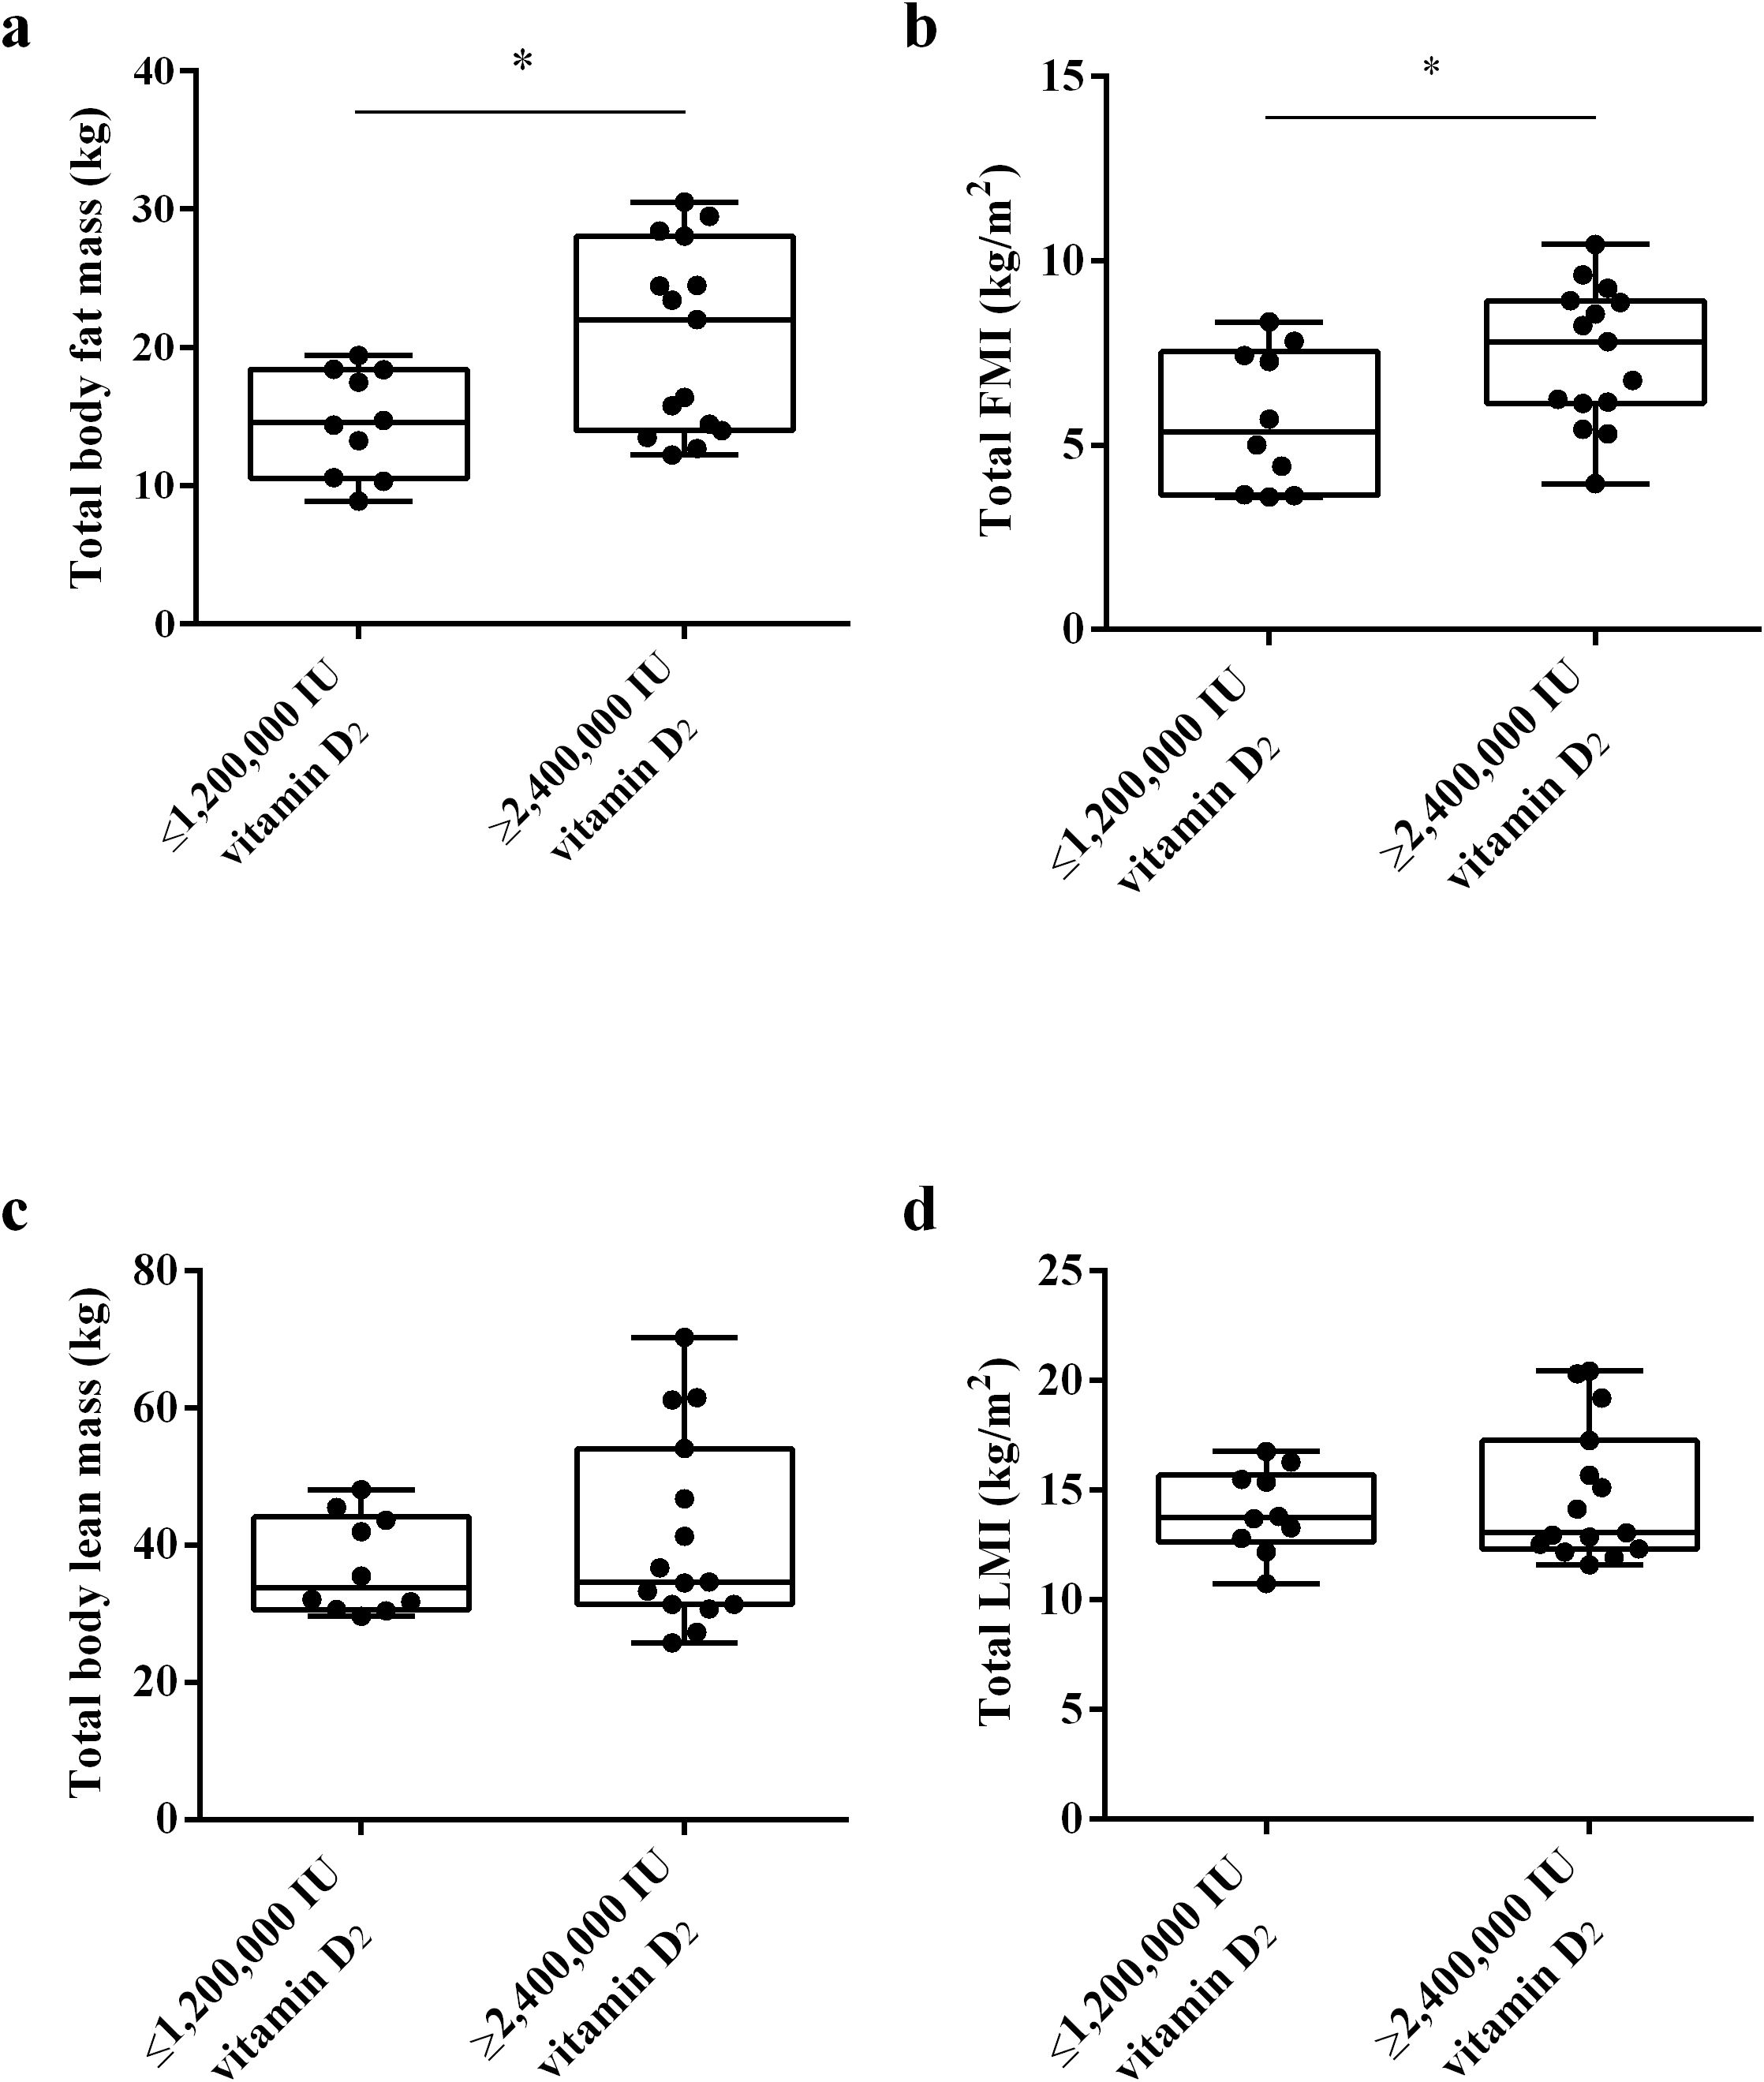
Figure 5. The difference in total body fat mass (a), total FMI (b), total body lean mass (c), and total LMI (d) between the ≤ 1,200,000 IU vitamin D2 group and the ≥ 2,400,000 IU vitamin D2 group. Data are shown as boxplots, including interquartile range, median, maximum and minimum value. *P, significant difference between the ≤ 1,200,000 IU vitamin D2 group and the ≥ 2,400,000 IU vitamin D2 group. IU, International units; FMI, fat mass index; LMI, lean mass index.
In addition, we also analyzed whether muscle affects the bioavailability of vitamin D2, we used DXA to measure the lean mass and LMI of the subjects. Lean body mass refers to the muscle content. However, there was no statistically significant difference in total body lean mass and total LMI between two groups (Figures 5c, d). These results indicate that muscle content has no effect on the bioavailability of vitamin D2
To clarify whether the differences in fat distribution are related to the required vitamin D dose to achieve sufficient vitamin D status, we used DXA to measure the trunk fat mass, limb fat mass and VAT mass of the subjects at week 32. The results showed that there was no significant difference in trunk/leg FMR and trunk/limb FMR between the ≥ 2,400,000 IU vitamin D2 group and the ≤ 1,200,000 IU vitamin D2 group. (Figures 6a, b). These results indicate that there was no significant difference in fat distribution between these two groups. Moreover, after trunk mass adjustment, the trunk fat content (%) of subjects in the ≥ 2,400,000 IU vitamin D2 group was significantly higher than those in the ≤ 1,200,000 IU vitamin D2 group (p< 0.05) (Figure 7a). However, after limb mass adjustment, there was no difference in the limb fat content (%) between the ≥ 2,400,000 IU vitamin D2 group and the ≤ 1,200,000 IU vitamin D2 group (p = 0.116) (Figure 7b). In addition, we analyzed the VAT in the trunk fat separately, and the results showed that the VAT mass of subjects in the ≥ 2,400,000 IU vitamin D2 group was significantly higher than those in the ≤ 1,200,000 IU vitamin D2 group (p< 0.05) (Figure 7c). Therefore, these results indicate that individuals with higher trunk fat content require a higher doses of vitamin D supplementation to achieve sufficient levels of 25(OH)D.
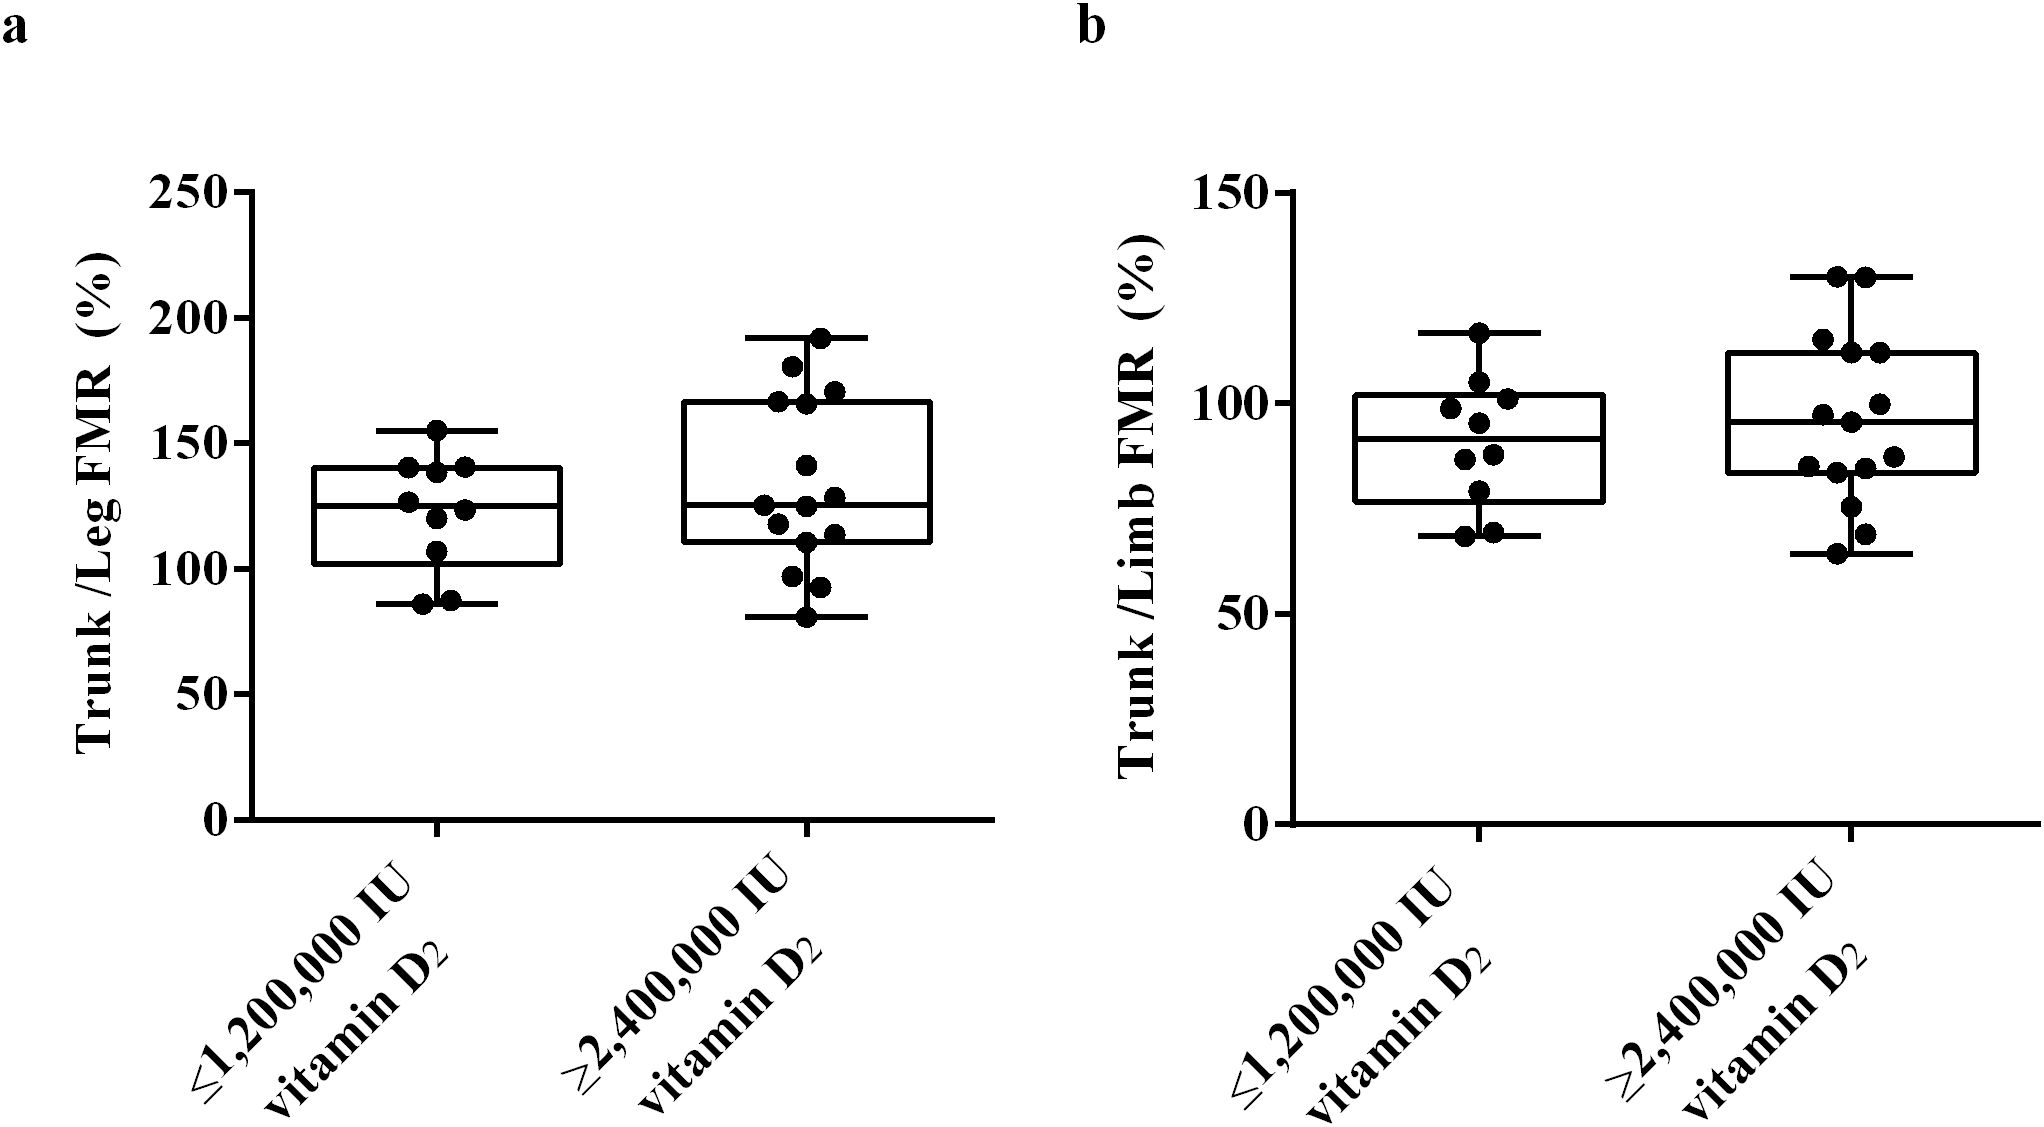
Figure 6. The difference trunk/Legs FMR (a), trunk/limb FMR (b) between the ≤ 1,200,000 IU vitamin D2 group and the ≥ 2,400,000 IU vitamin D2 group. Data were shown as boxplots, including interquartile range, median, maximum and minimum value. IU, International units; FMR, Fat mass ratio.
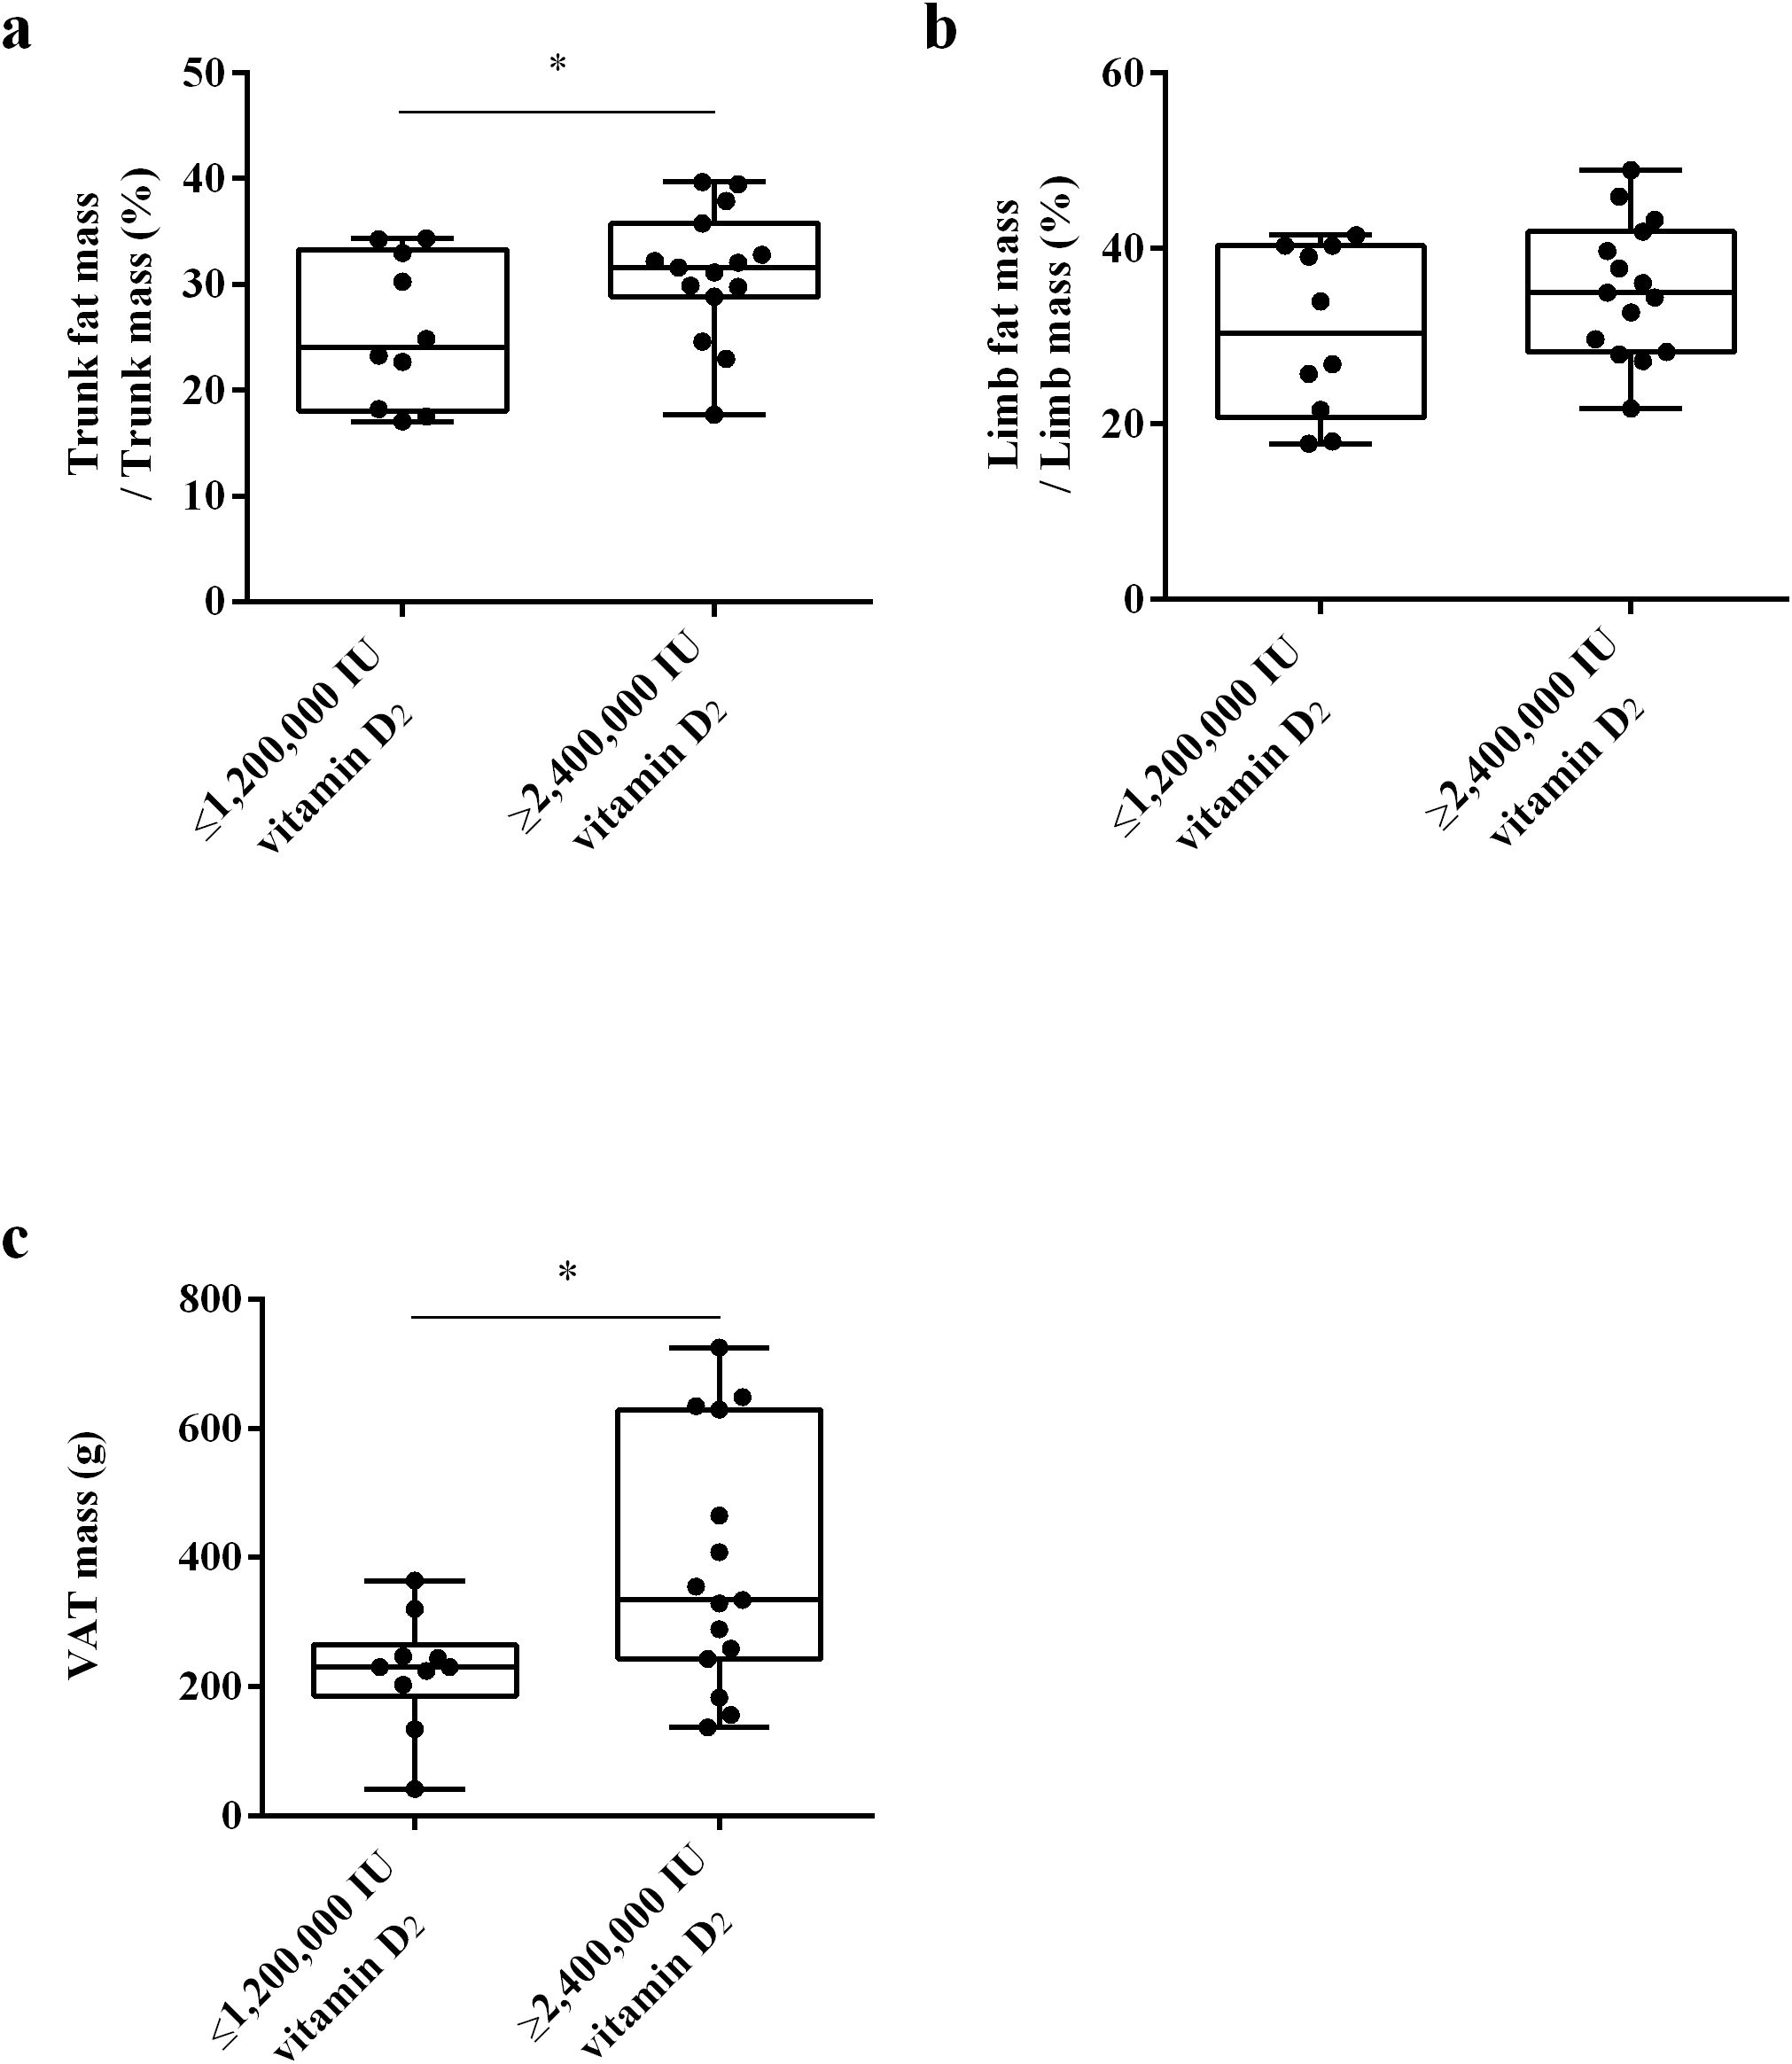
Figure 7. The difference in trunk fat mass/trunk mass (a), limb fat mass/limb mass (b) and VAT mass (c) between the ≤ 1,200,000 IU vitamin D2 group and the ≥ 2,400,000 IU vitamin D2 group. Data are shown as boxplots, including interquartile range, median, maximum and minimum value. *P, significant difference between the ≤ 1,200,000 IU vitamin D2 group and the ≥ 2,400,000 IU vitamin D2 group. IU, International units; VAT, Visceral adipose tissue.
To determine whether multiple i.m. injections of vitamin D2 increase the risk of hypercalcemia and hypercalciuria, we measured levels of serum calcium and 24 h-Uca at weeks 0, 4, 12, 16, 20 and 24. There were no significant differences in serum calcium and 24 h-Uca between subjects receiving different doses of vitamin D2 at each follow-up time point (data not shown).
4 Discussion
In the present study, we regularly injected vitamin D2 into the muscles of the subjects, which not only ensured compliance but also ensured that the increase in 25(OH)D in the body was not affected by sunlight. We also used DXA to detect the body composition and demonstrated that body fat content has a greater impact on vitamin D2 bioavailability, and people with higher trunk fat content need to supplement higher doses of vitamin D to achieve adequate levels of vitamin D. However, the muscle content or BMI does not affect the bioavailability of vitamin D2. To our knowledge, this is the first clinical intervention study to investigate the effect of body fat content on the dosage required to achieve sufficient levels of vitamin D.
Previous animal studies have shown that vitamin D is mainly stored in adipocytes (2). In our study, we found there was no significant difference in BMI between different dosage vitamin D2 (≤ 1,200,000 IU of vitamin D2 group vs. ≥ 2,400,000 IU vitamin D2 group) required to achieve sufficient levels of 25(OH)D. AlQuaiz et al. found no significant correlation between serum 25(OH)D levels and WC in males and females after conducting multivariate analyses (15). Studies by Han et al. showed that after gender adjustment, BMI and WC were not associated with serum 25(OH)D (16). Wortsman et al. compared the difference in serum 25(OH)D2 or serum 25(OH)D3 levels between high BMI and normal BMI individuals who received oral vitamin D2 or whole body irradiation, and found that there was no significant difference in the peak of serum 25(OH)D2 or serum 25(OH)D3 levels between subjects with high BMI and subjects with normal BMI (22). In addition, in Wortsman’s study, the increase in serum 25(OH)D concentration in high BMI subjects was 57% lower than that in normal BMI subjects receiving equivalent ultraviolet radiation, but there was no difference in vitamin D3 precursor levels. The authors concluded that obesity-associated vitamin D insufficiency is likely due to the decreased bioavailability of vitamin D3 from cutaneous and dietary sources because of its deposition in body fat compartments (22). However, the results of some studies do not support this conclusion. Some clinical studies have demonstrated that serum 25(OH)D levels in subjects with high normal BMI are lower than those in subjects with normal BMI, and high weight subjects have lower serum 25(OH)D levels than normal weight subjects after vitamin D supplementation (23–25). Studies by Mattia Bellan et al. have shown that up to 95 percent of high BMI (35 to 70 kg/m2) individuals suffer from vitamin D deficiency, and subjects with the higher BMI had lower serum 25(OH)D levels (26). In a retrospective study, Monache et al. found that overweight patients had lower average 25(OH)D levels in winter and summer compared to normal weight individuals, usually in vitamin D deficiency status. Monache et al. also found that the higher BMI was significantly associated with lower serum total 25(OH)D levels, regardless of season or age (27). In some large-scale cross-sectional studies, the results showed a significant correlation between insufficient serum 25(OH)D levels and the risk of elevated WC (28, 29). These studies indicate that individuals with relatively high BMI or WC are prone to vitamin D deficiency. The reason for these inconsistent results may be related to the fact that WC and BMI cannot fully reflect body fat content. Therefore, it is necessary to clarify whether the body fat content will affect the bioavailability of vitamin D.
In the present study, we found that the total body fat mass and total FMI of subjects in ≥ 2,400,000 IU vitamin D2 group were significantly higher than those in the ≤ 1,200,000 IU vitamin D2 group (p< 0.05). However, there was no statistically significant difference in total body lean mass and total LMI between these two groups. These results indicate that for individuals with a high body fat content, supplementing with higher doses of vitamin D is necessary to achieve sufficient levels of 25(OH)D. Previous studies on the correlation between vitamin D supplementation dose and body fat content have not yielded consistent results. Gronborg et al. conducted a one-year randomized, double-blind, placebo-controlled trial and found no correlation between body fat content (fat mass/weight) and elevated levels of serum 25(OH)D elevation levels in the 400 IU/day vitamin D3 supplementation group (30). In Gronborg’s study, the reason for the negative results may be related to the low dose of vitamin D supplements received by the subjects. However, there was no significant correlation between the body fat content and elevated levels of 25(OH)D in the body of subjects after supplementing with 800–1000 IU/day of vitamin D3 (31, 32). In a randomized, double-blind, placebo-controlled study, 30 subjects received a single oral dose of 120,000 IU of vitamin D3, and the results showed that subjects with higher body fat content did not have lower serum 25(OH)D elevation levels (33). A randomized controlled study also showed that there was no significant correlation between changes in serum 25(OH)D levels and body fat mass in subjects receiving 400 IU/day vitamin D3 supplementation (n=21), but in subjects receiving 2000 IU/day vitamin D3 supplementation (n=23), individuals with high body fat mass showed a lower increase in serum 25(OH)D levels after vitamin D3 supplementation (n=23) (34). In another randomized controlled study, elderly subjects who received 500 mg calcium and 700 IU vitamin D3 daily after adjusting for baseline 25(OH)D levels, season and gender, showed a significant negative correlation between elevated levels of 25(OH)D and total body fat mass and central fat mass, but not peripheral fat mass (35). The reason for these inconsistent results may be the impact of sunlight on vitamin D3 levels, the difficulties in ensuring compliance with oral vitamin D supplements and the use of different measurement indicators.
Given the inconsistencies in prior findings, standardized adiposity assessment is critical for vitamin D research. To address this, we applied the FMI to adjust for differences in obesity caused by body size, which can directly reflect the fat mass component of body weight, and without interference from other components such as muscle mass (21, 36). Forsyth et al. measured FMI by measuring skinfold thicknesses in young and elderly individuals who received daily oral supplementation of 600 IU vitamin D3. The results showed that after adjusting for gender and region, baseline 25(OH)D levels in elderly subjects were significantly negatively correlated with fat mass and FMI, while there was no significant correlation in young subjects. In addition, the Forsyth et al. also found that after adjusting for baseline 25(OH)D levels, age, gender, and region, the increase in 25(OH)D levels was not significantly associated with fat mass and FMI (13). However, Forsyth et al. used skinfold thickness measurements to estimate FMI, rather than using DXA measurements to calculate FMI. Compared with skinfold thickness measurement, DXA measurement can accurately measure fat mass and calculate FMI. In the present study, there was no significant difference in FMI between males and females (6.32 ± 0.71 vs. 7.17 ± 0.49 kg/m2, p = 0.314). In addition, there was no significant difference in the dosage of vitamin D required for males and females to achieve sufficient levels of 25(OH)D. These results suggest that gender differences do not affect the dosage of vitamin D that needs to be supplemented.
While gender does not influence vitamin D dosage requirements, regional adipose tissue distribution may modulate its metabolic efficacy. A cross-sectional study has shown that 25(OH)D3 increases in abdominal subcutaneous fat tissue after supplementation with vitamin D3 (37). Another study showed that increases in 25(OH)D levels were correlated with decreases in the changes in all obesity indices, visceral, and abdominal adipose tissue during a year of weight loss through lifestyle changes (38). However, in these studies, limb fat content was not measured and it was unknown whether limb fat content was related to serum 25(OH)D levels. In the present study, the results showed that the trunk fat content (%) of subjects in the ≥ 2,400,000 IU vitamin D2 group was significantly higher than those in the ≤ 1,200,000 IU vitamin D2 group (P<0.05). However, there were no difference in limb fat content (%) adjusted by weight between the ≥ 2,400,000 IU vitamin D2 group and the ≤ 1,200,000 IU vitamin D2 group. Besides, the VAT content (%) of subjects in the ≥ 2,400,000 IU vitamin D2 group was significantly higher than those in the ≤ 1,200,000 IU vitamin D2 group. In addition, there was no statistically significant difference in trunk/leg FMR and trunk/limb FMR between two groups. Compared to limb fat deposits, trunk adipose tissue demonstrates a stronger inverse association with serum 25(OH)D levels. This differential relationship may be attributed to two primary mechanisms. First, the greater volumetric proportion of trunk fat relative to peripheral adiposity might magnify its metabolic influence on vitamin D homeostasis (39, 40). Second, compared to peripheral fat distribution, central adiposity exhibits enhanced secretion of proinflammatory cytokines that potentially suppress 25-hydroxylase enzymatic activity, thereby decreasing circulating 25(OH)D concentrations (41, 42).
In the present study, we also observed that the muscle content does not affect the bioavailability of vitamin D2. Previous studies also investigated this association and found similar results. Vitezova et al. found that lean body mass showed no association with vitamin D deficiency (43). Taken together, these findings suggest that body fat content rather than muscle content affects the bioavailability of vitamin D2.
In the present study, baseline serum 25(OH)D2 levels fell below detectable thresholds in the study cohort, a finding potentially attributable to the limited consumption of vitamin D2-rich foods (e.g., UV-exposed mushrooms) and insufficient use of vitamin D2 supplements among the Chinese population. Notably, serum 25(OH)D3 concentrations remained sufficient to maintain iPTH levels within normal physiological parameters, thereby preventing a clinically significant elevation of iPTH.
This study pioneers the application of body composition analysis to investigate how regional adipose tissue distribution influences vitamin D supplementation requirements. A key methodological strength lies in the standardized intramuscular vitamin D2 administration protocol, which ensured treatment compliance and eliminated confounding from sunlight-induced 25(OH)D fluctuations. Furthermore, we utilized DXA for precise body composition profiling and adopted FMI as a superior adiposity indicator to BMI. Limitations include the modest sample size, which may constrain the generalizability of findings, and the single-center design that may restrict population representativeness. Subsequent investigations should employ multi-center cohorts with demographically diverse populations to enhance external validity, complemented by stratified analyses of adipose-depot-specific vitamin D metabolism.
5 Conclusion
The body fat content, especially trunk fat content, is the main body component that affects the bioavailability of vitamin D in healthy adults. Healthy adults with high trunk fat content have low bioavailability of vitamin D and need to supplement relatively higher doses of vitamin D to achieve sufficient levels of vitamin D. However, the muscle content does not affect the bioavailability of vitamin D.
Data availability statement
The datasets presented in this article are not readily available because The data supporting the research results are not been publicly available, but reasonable requests can be made through the corresponding author. Requests to access the datasets should be directed to emhvbmdqaWFuLnhpZUBjc3UuZWR1LmNu.
Ethics statement
The studies involving humans were approved by the Ethics Committee of the National Clinical Medical Research Center, the Second Xiangya Hospital, Central South University. The studies were conducted in accordance with the local legislation and institutional requirements. The participants provided their written informed consent to participate in this study.
Author contributions
DD: Conceptualization, Formal Analysis, Investigation, Methodology, Validation, Writing – original draft, Writing – review & editing. YL: Conceptualization, Formal Analysis, Investigation, Methodology, Validation, Writing – original draft, Writing – review & editing. FX: Investigation, Methodology, Validation, Writing – review & editing. HL: Investigation, Methodology, Writing – review & editing. RW: Investigation, Methodology, Writing – review & editing. YG: Methodology, Writing – review & editing. XX: Methodology, Writing – review & editing. AX: Methodology, Writing – review & editing. RS: Methodology, Writing – review & editing. LQ: Methodology, Writing – review & editing. YD: Methodology, Writing – review & editing. YY: Methodology, Writing – review & editing. XC: Methodology, Writing – review & editing. ZX: Conceptualization, Funding acquisition, Project administration, Supervision, Writing – review & editing.
Funding
The author(s) declare that financial support was received for the research and/or publication of this article. This work was supported by the funding from the National Key R&D Program of China (2021YFC2501700, 2021YFC2501705), the National Natural Science Foundation of China (82171580, 81672646), the Hunan Provincial Natural Science Foundation (2021JJ30035), the Key Research and Development Program of Hunan Province (No.2019SK2253) and the Fundamental Research Funds for the Central Universities of Central South University (Grant No. 2024ZZTS0167)
Acknowledgments
We would like to thank all participants. We thank Yu Huang, Wei tang and, Dichen Zhao for their help and support.
Conflict of interest
The authors declare that the research was conducted in the absence of any commercial or financial relationships that could be construed as a potential conflict of interest.
The author(s) declared that they were an editorial board member of Frontiers, at the time of submission. This had no impact on the peer review process and the final decision.
Publisher’s note
All claims expressed in this article are solely those of the authors and do not necessarily represent those of their affiliated organizations, or those of the publisher, the editors and the reviewers. Any product that may be evaluated in this article, or claim that may be made by its manufacturer, is not guaranteed or endorsed by the publisher.
References
2. Rosenstreich S, Rich C, and Volwiler W. Deposition in and release of vitamin D3 from body fat: evidence for a storage site in the rat. J Clin Invest. (1971) 50:679–87. doi: 10.1172/jci106538
3. Haussler MR, Whitfield GK, Kaneko I, Haussler CA, Hsieh D, Hsieh JC, et al. Molecular mechanisms of vitamin D action. Calcif Tissue Int. (2013) 92:77–98. doi: 10.1007/s00223-012-9619-0
4. Anderson JL, May HT, Horne BD, Bair TL, Hall NL, Carlquist JF, et al. Relation of vitamin D deficiency to cardiovascular risk factors, disease status, and incident events in a general healthcare population. Am J Cardiol. (2010) 106:963–8. doi: 10.1016/j.amjcard.2010.05.027
5. Perez-Hernandez N, Aptilon-Duque G, Nostroza-Hernandez MC, Vargas-Alarcon G, Rodriguez-Perez JM, and Blachman-Braun R. Vitamin D and its effects on cardiovascular diseases: A comprehensive review. Korean J Intern Med. (2016) 31:1018–29. doi: 10.3904/kjim.2015.224
6. Bikle D. Nonclassic actions of vitamin D. J Clin Endocrinol Metab. (2009) 94:26–34. doi: 10.1210/jc.2008-1454
7. Holick MF. Vitamin D: extraskeletal health. Rheum Dis Clin North Am. (2012) 38:141–60. doi: 10.1016/j.rdc.2012.03.013
8. Walsh JS, Evans AL, Bowles S, Naylor KE, Jones KS, Schoenmakers I, et al. Free 25-hydroxyvitamin D is low in obesity, but there are no adverse associations with bone health. Am J Clin Nutr. (2016) 103:1465–71. doi: 10.3945/ajcn.115.120139
9. Konradsen S, Ag H, Lindberg F, Hexeberg S, and Jorde R. Serum 1,25-dihydroxy vitamin D is inversely associated with body mass index. Eur J Nutr. (2008) 47:87–91. doi: 10.1007/s00394-008-0700-4
10. Guagnano MT, D’Ardes D, Di Giovanni P, Rossi I, Boccatonda A, Bucci M, et al. Gender, obesity, fat distribution and 25-hydroxyvitamin D. Medicina. (2023) 59:1123. doi: 10.3390/medicina59061123
11. McGill A-T, Stewart JM, Lithander FE, Strik CM, and Poppitt SD. Relationships of low serum vitamin D3with anthropometry and markers of the metabolic syndrome and diabetes in overweight and obesity. Nutr J. (2008) 7:4. doi: 10.1186/1475-2891-7-4
12. Parikh SJ, Edelman M, Uwaifo GI, Freedman RJ, Semega-Janneh M, Reynolds J, et al. The relationship between obesity and serum 1,25-dihydroxy vitamin D concentrations in healthy adults. J Clin Endocrinol Metab. (2004) 89:1196–9. doi: 10.1210/jc.2003-031398
13. Forsythe LK, Livingstone MB, Barnes MS, Horigan G, McSorley EM, Bonham MP, et al. Effect of adiposity on vitamin D status and the 25-hydroxycholecalciferol response to supplementation in healthy young and older irish adults. Br J Nutr. (2012) 107:126–34. doi: 10.1017/S0007114511002662
14. Santos A, Amaral TF, Guerra RS, Sousa AS, Alvares L, Moreira P, et al. Vitamin D Status and Associated Factors among Portuguese Older Adults: Results from the Nutrition up 65 Cross-Sectional Study. BMJ Open. (2017) 7:e016123. doi: 10.1136/bmjopen-2017-016123
15. AlQuaiz AM, Kazi A, Fouda M, and Alyousefi N. Age and gender differences in the prevalence and correlates of vitamin D deficiency. Arch Osteoporos. (2018) 13:49. doi: 10.1007/s11657-018-0461-5
16. Han SS, Kim M, Lee SM, Lee JP, Kim S, Joo KW, et al. Association between body fat and vitamin D status in korean adults. Asia Pac J Clin Nutr. (2014) 23:65–75. doi: 10.6133/apjcn.2014.23.1.10
17. Xu F, Dai D, Sun R, Liu Z, Lin X, Li L, et al. Long-term bioavailability of single doses of intramuscular vitamin D(2). Endocr Pract. (2020) 26:1244–54. doi: 10.4158/EP-2020-0124
18. Serdar CC, Cihan M, Yucel D, and Serdar MA. Sample size, power and effect size revisited: simplified and practical approaches in pre-clinical, clinical and laboratory studies. Biochem Med (Zagreb). (2021) 31:10502. doi: 10.11613/BM.2021.010502
19. Malabanan A, Veronikis IE, and Holick MF. Redefining vitamin D insufficiency. Lancet. (1998) 351:805–6. doi: 10.1016/s0140-6736(05)78933-9
20. Curhan GC and Taylor EN. 24-H uric acid excretion and the risk of kidney stones. Kidney Int. (2008) 73:489–96. doi: 10.1038/sj.ki.5002708
21. Kelly TL, Wilson KE, and Heymsfield SB. Dual energy X-ray absorptiometry body composition reference values from nhanes. PloS One. (2009) 4:e7038. doi: 10.1371/journal.pone.0007038
22. Wortsman J, Matsuoka LY, Chen TC, Lu Z, and Holick MF. Decreased bioavailability of vitamin D in obesity. Am J Clin Nutr. (2000) 72:690–3. doi: 10.1093/ajcn/72.3.690
23. Carrelli A, Bucovsky M, Horst R, Cremers S, Zhang C, Bessler M, et al. Vitamin D storage in adipose tissue of obese and normal weight women. J Bone Miner Res. (2017) 32:237–42. doi: 10.1002/jbmr.2979
24. Need AG, Morris HA, Horowitz M, and Nordin C. Effects of skin thickness, age, body fat, and sunlight on serum 25-hydroxyvitamin D. Am J Clin Nutr. (1993) 58:882–5. doi: 10.1093/ajcn/58.6.882
25. Rock CL, Emond JA, Flatt SW, Heath DD, Karanja N, Pakiz B, et al. Weight loss is associated with increased serum 25-hydroxyvitamin D in overweight or obese women. Obes (Silver Spring). (2012) 20:2296–301. doi: 10.1038/oby.2012.57
26. Bellan M, Guzzaloni G, Rinaldi M, Merlotti E, Ferrari C, Tagliaferri A, et al. Altered glucose metabolism rather than naive type 2 diabetes mellitus (T2dm) is related to vitamin D status in severe obesity. Cardiovasc Diabetol. (2014) 13:57. doi: 10.1186/1475-2840-13-57
27. Delle Monache S, Di Fulvio P, Iannetti E, Valerii L, Capone L, Nespoli MG, et al. Body mass index represents a good predictor of vitamin D status in women independently from age. Clin Nutr. (2019) 38:829–34. doi: 10.1016/j.clnu.2018.02.024
28. Shan X, Zhao X, Li S, Song P, Man Q, Liu Z, et al. Association of serum 25(Oh)D with metabolic syndrome in chinese women of childbearing age. Nutrients. (2022) 14:2301. doi: 10.3390/nu14112301
29. Mai XM, Chen Y, Camargo CA Jr., and Langhammer A. Cross-sectional and prospective cohort study of serum 25-hydroxyvitamin D level and obesity in adults: the hunt study. Am J Epidemiol. (2012) 175:1029–36. doi: 10.1093/aje/kwr456
30. Gronborg IM, Lundby IM, Molgaard C, Jakobsen J, Ovesen L, and Andersen R. Association of body fat and vitamin D status and the effect of body fat on the response to vitamin D supplementation in Pakistani immigrants in Denmark. Eur J Clin Nutr. (2015) 69:405–7. doi: 10.1038/ejcn.2014.254
31. Nelson ML, Blum JM, Hollis BW, Rosen C, and Sullivan SS. Supplements of 20 microg/D cholecalciferol optimized serum 25-hydroxyvitamin D concentrations in 80% of premenopausal women in winter. J Nutr. (2009) 139:540–6. doi: 10.3945/jn.108.096180
32. Canto-Costa MH, Kunii I, and Hauache OM. Body fat and cholecalciferol supplementation in elderly homebound individuals. Braz J Med Biol Res. (2006) 39:91–8. doi: 10.1590/s0100-879x2006000100011
33. Leszczynska D, Szatko A, Kowalski K, Raczkiewicz D, Ostrowska M, Misiorowski W, et al. The effect of a single high dose of vitamin D on serum levels of its metabolites in the elderly. Front Biosci (Landmark Ed). (2022) 27:289. doi: 10.31083/j.fbl2710289
34. Dong Y, Stallmann-Jorgensen IS, Pollock NK, Harris RA, Keeton D, Huang Y, et al. A 16-week randomized clinical trial of 2000 international units daily vitamin D3 supplementation in black youth: 25-hydroxyvitamin D, adiposity, and arterial stiffness. J Clin Endocrinol Metab. (2010) 95:4584–91. doi: 10.1210/jc.2010-0606
35. Blum M, Dallal GE, and Dawson-Hughes B. Body size and serum 25 hydroxy vitamin D response to oral supplements in healthy older adults. J Am Coll Nutr. (2008) 27:274–9. doi: 10.1080/07315724.2008.10719700
36. Peltz G, Aguirre MT, Sanderson M, and Fadden MK. The role of fat mass index in determining obesity. Am J Hum Biol. (2010) 22:639–47. doi: 10.1002/ajhb.21056
37. Didriksen A, Burild A, Jakobsen J, Fuskevag OM, and Jorde R. Vitamin D3 increases in abdominal subcutaneous fat tissue after supplementation with vitamin D3. Eur J Endocrinol. (2015) 172:235–41. doi: 10.1530/EJE-14-0870
38. Gangloff A, Bergeron J, Pelletier-Beaumont E, Nazare JA, Smith J, Borel AL, et al. Effect of adipose tissue volume loss on circulating 25-hydroxyvitamin D levels: results from a 1-year lifestyle intervention in viscerally obese men. Int J Obes (Lond). (2015) 39:1638–43. doi: 10.1038/ijo.2015.118
39. Cominacini M, Fumaneri A, Ballerini L, Braggio M, Valenti MT, and Dalle Carbonare L. Unraveling the connection: visceral adipose tissue and vitamin D levels in obesity. Nutrients. (2023) 15:4259. doi: 10.3390/nu15194259
40. Drincic AT, Armas LA, Van Diest EE, and Heaney RP. Volumetric dilution, rather than sequestration best explains the low vitamin D status of obesity. Obes (Silver Spring). (2012) 20:1444–8. doi: 10.1038/oby.2011.404
41. Elkhwanky MS, Kummu O, Piltonen TT, Laru J, Morin-Papunen L, Mutikainen M, et al. Obesity represses cyp2r1, the vitamin D 25-hydroxylase, in the liver and extrahepatic tissues. JBMR Plus. (2020) 4:e10397. doi: 10.1002/jbm4.10397
42. Park CY, Shin Y, Kim JH, Zhu S, Jung YS, and Han SN. Effects of high fat diet-induced obesity on vitamin D metabolism and tissue distribution in vitamin D deficient or supplemented mice. Nutr Metab (Lond). (2020) 17:44. doi: 10.1186/s12986-020-00463-x
Keywords: vitamin D deficiency, vitamin D supplementation, vitamin D bioavailability, body fat, nutrition
Citation: Dai D, Ling Y, Xu F, Li H, Wang R, Gu Y, Xia X, Xiong A, Sun R, Qiu L, Ding Y, Yu Y, Cai X and Xie Z (2025) Impact of body composition on vitamin D requirements in healthy adults with vitamin D deficiency. Front. Endocrinol. 16:1421663. doi: 10.3389/fendo.2025.1421663
Received: 22 April 2024; Accepted: 16 June 2025;
Published: 03 July 2025.
Edited by:
Fan Yang, Shandong University, ChinaReviewed by:
Xiude Fan, Shandong Provincial Hospital, ChinaZhenqi Liu, University of Virginia, United States
Mohamad Golitaleb, Arak University of Medical Sciences, Iran
Copyright © 2025 Dai, Ling, Xu, Li, Wang, Gu, Xia, Xiong, Sun, Qiu, Ding, Yu, Cai and Xie. This is an open-access article distributed under the terms of the Creative Commons Attribution License (CC BY). The use, distribution or reproduction in other forums is permitted, provided the original author(s) and the copyright owner(s) are credited and that the original publication in this journal is cited, in accordance with accepted academic practice. No use, distribution or reproduction is permitted which does not comply with these terms.
*Correspondence: Zhongjian Xie, emhvbmdqaWFuLnhpZUBjc3UuZWR1LmNu
†These authors have contributed equally to this work