 Dan Long
 Chenhan Mao2
- 1Department of Gastroenterology, The First Hospital of Hunan University of Chinese Medicine, Changsha, Hunan, China
- 2Affiliated Hospital of Integrated Traditional Chinese and Western Medicine, Nanjing University of Chinese Medicine, Nanjing, Jiangsu, China
Background: Mounting research suggests that insulin resistance (IR) is associated with Helicobacter pylori (H. pylori) infection. The triglyceride-glucose (TyG) index has received widespread attention due to its high sensitivity in assessing IR. This study examined the association between H. pylori infection and TyG index.
Methods: This cross-sectional study used data from the National Health and Nutrition Examination Survey (NHANES) 1999 - 2000. Participants were categorized into quartile groups (Q1–Q4) based on their TyG index. Weighted multivariable-adjusted logistic regression and subgroup analysis were used to explore the correlation between TyG index and H. pylori infection. Furthermore, sensitivity analysis was conducted to assess the robustness of our findings.
Results: This study included 2,918 participants, 1,101 of whom were infected with H. pylori. The mean TyG index for all participants was 8.56 ± 0.67. Patients who were H. pylori positive had higher levels of TyG index compared with H. pylori seronegative participants (8.74 ± 0.03 vs. 8.57 ± 0.03, P < 0.05). The fourth quartile of the TyG index showed the highest odds of H. pylori infection compared to Q1 (OR = 2.37, 95%CI: 1.52 to 3.71, P < 0.001). Sensitivity analysis indicated that the association between TyG index and H. pylori infection remained strong even after excluding participants with cardiovascular diseases or taking lipid-lowering medications, as well as patients with diabetes or taking glucose-lowering medications.
Conclusions: In this study, a stable and strong positive association was found between TyG index and H. pylori infection. IR may be significantly associated with H. pylori infection. Further studies are necessary to elucidate the underlying mechanisms and potential clinical implications of these findings.
Introduction
Helicobacter pylori (H. pylori), a gram-negative bacterium, which infects more than half of the worldwide population and has been identified as a global public health threat (1). H. pylori was classified as a class I carcinogen by the World Health Organization in 1994. It has been demonstrated that H. pylori infection may increase the risk of gastric diseases such as acute gastritis and peptic ulcer, and possibly promote the development of gastric cancer (2–4). Notably, there is growing evidence indicating a close association between H. pylori infection and diseases outside the gastrointestinal tract (5–7). When colonizing gastric epithelial cells, H. pylori not only induces local tissue inflammation or malignant transformation, but also leads to systemic and local changes in host metabolism. There is an intricate interaction between H. pylori and the regulation of body metabolism (8). In particular, the association between H. pylori infection and diabetes mellitus (DM) has attracted widespread academic attention (9, 10). Insulin resistance (IR) probably plays a key role in their association (11). IR is a precursor to type 2 diabetes mellitus (T2DM) and has been generally recognized as a unique and reliable measure. Therefore, it is crucial to understand the correlation between IR and H. pylori infection.
There is increasing evidence suggesting a significant association between IR and H. pylori infection (12–14). The triglyceride-glucose (TyG) index is a marker used to assess IR (15, 16). The TyG index has been validated as a reliable and convenient marker for IR (16). The advantages of the TyG index have been demonstrated in a number of diseases such as cardiovascular disease (17), diabetes (18), and hearing impairment (19). Zheng et al. (20) reported a significant association between higher TyG index and higher risk of kidney stone and its recurrence. Identifying new risk factors or predictive markers for H. pylori infection could have a profound impact on its early detection, prevention, and management. Given the association between IR and H. pylori infection, uncovering the relationship between the TyG index and H. pylori infection may contribute to a better understanding of the underlying pathophysiological mechanisms connecting metabolic disorders and infectious diseases. This could open new avenues for research and potentially lead to the development of novel treatment strategies.
Methods
Study design and participants
This cross-sectional study utilized data from the National Health and Nutrition Examination Survey (NHANES), a publicly available database that employs a stratified, multistage probability sampling design to capture nationally representative samples of the nonhospitalized population (21). The survey component includes demographic data, diet, questionnaires and physical examinations, as well as laboratory tests supervised by trained medical staff. In addition, NHANES utilizes a variety of modern equipment to make data collection more reliable and efficient. All raw data used in this study were extracted from the official NHANES website (https://www.cdc.gov/nchs/nhanes/). The NHANES protocol was approved by the National Center for Health Statistics (NCHS) Research Ethics Review Board and written informed consent was obtained from each participant.
The NHANES 1999-2000 cycle was selected as it is the only survey period that included laboratory measurements for H. pylori, encompassing a total of 9,965 participants. The sample size for this study was determined by the number of eligible participants in the NHANES 1999-2000 dataset who met the inclusion criteria. A total of 2,918 participants were included in the study after excluding 2,472 individuals with missing H. pylori data, 170 with ambiguous H. pylori results, and 4,405 lacking triglyceride or glucose measurements. The inclusion and exclusion criteria are shown in Figure 1.
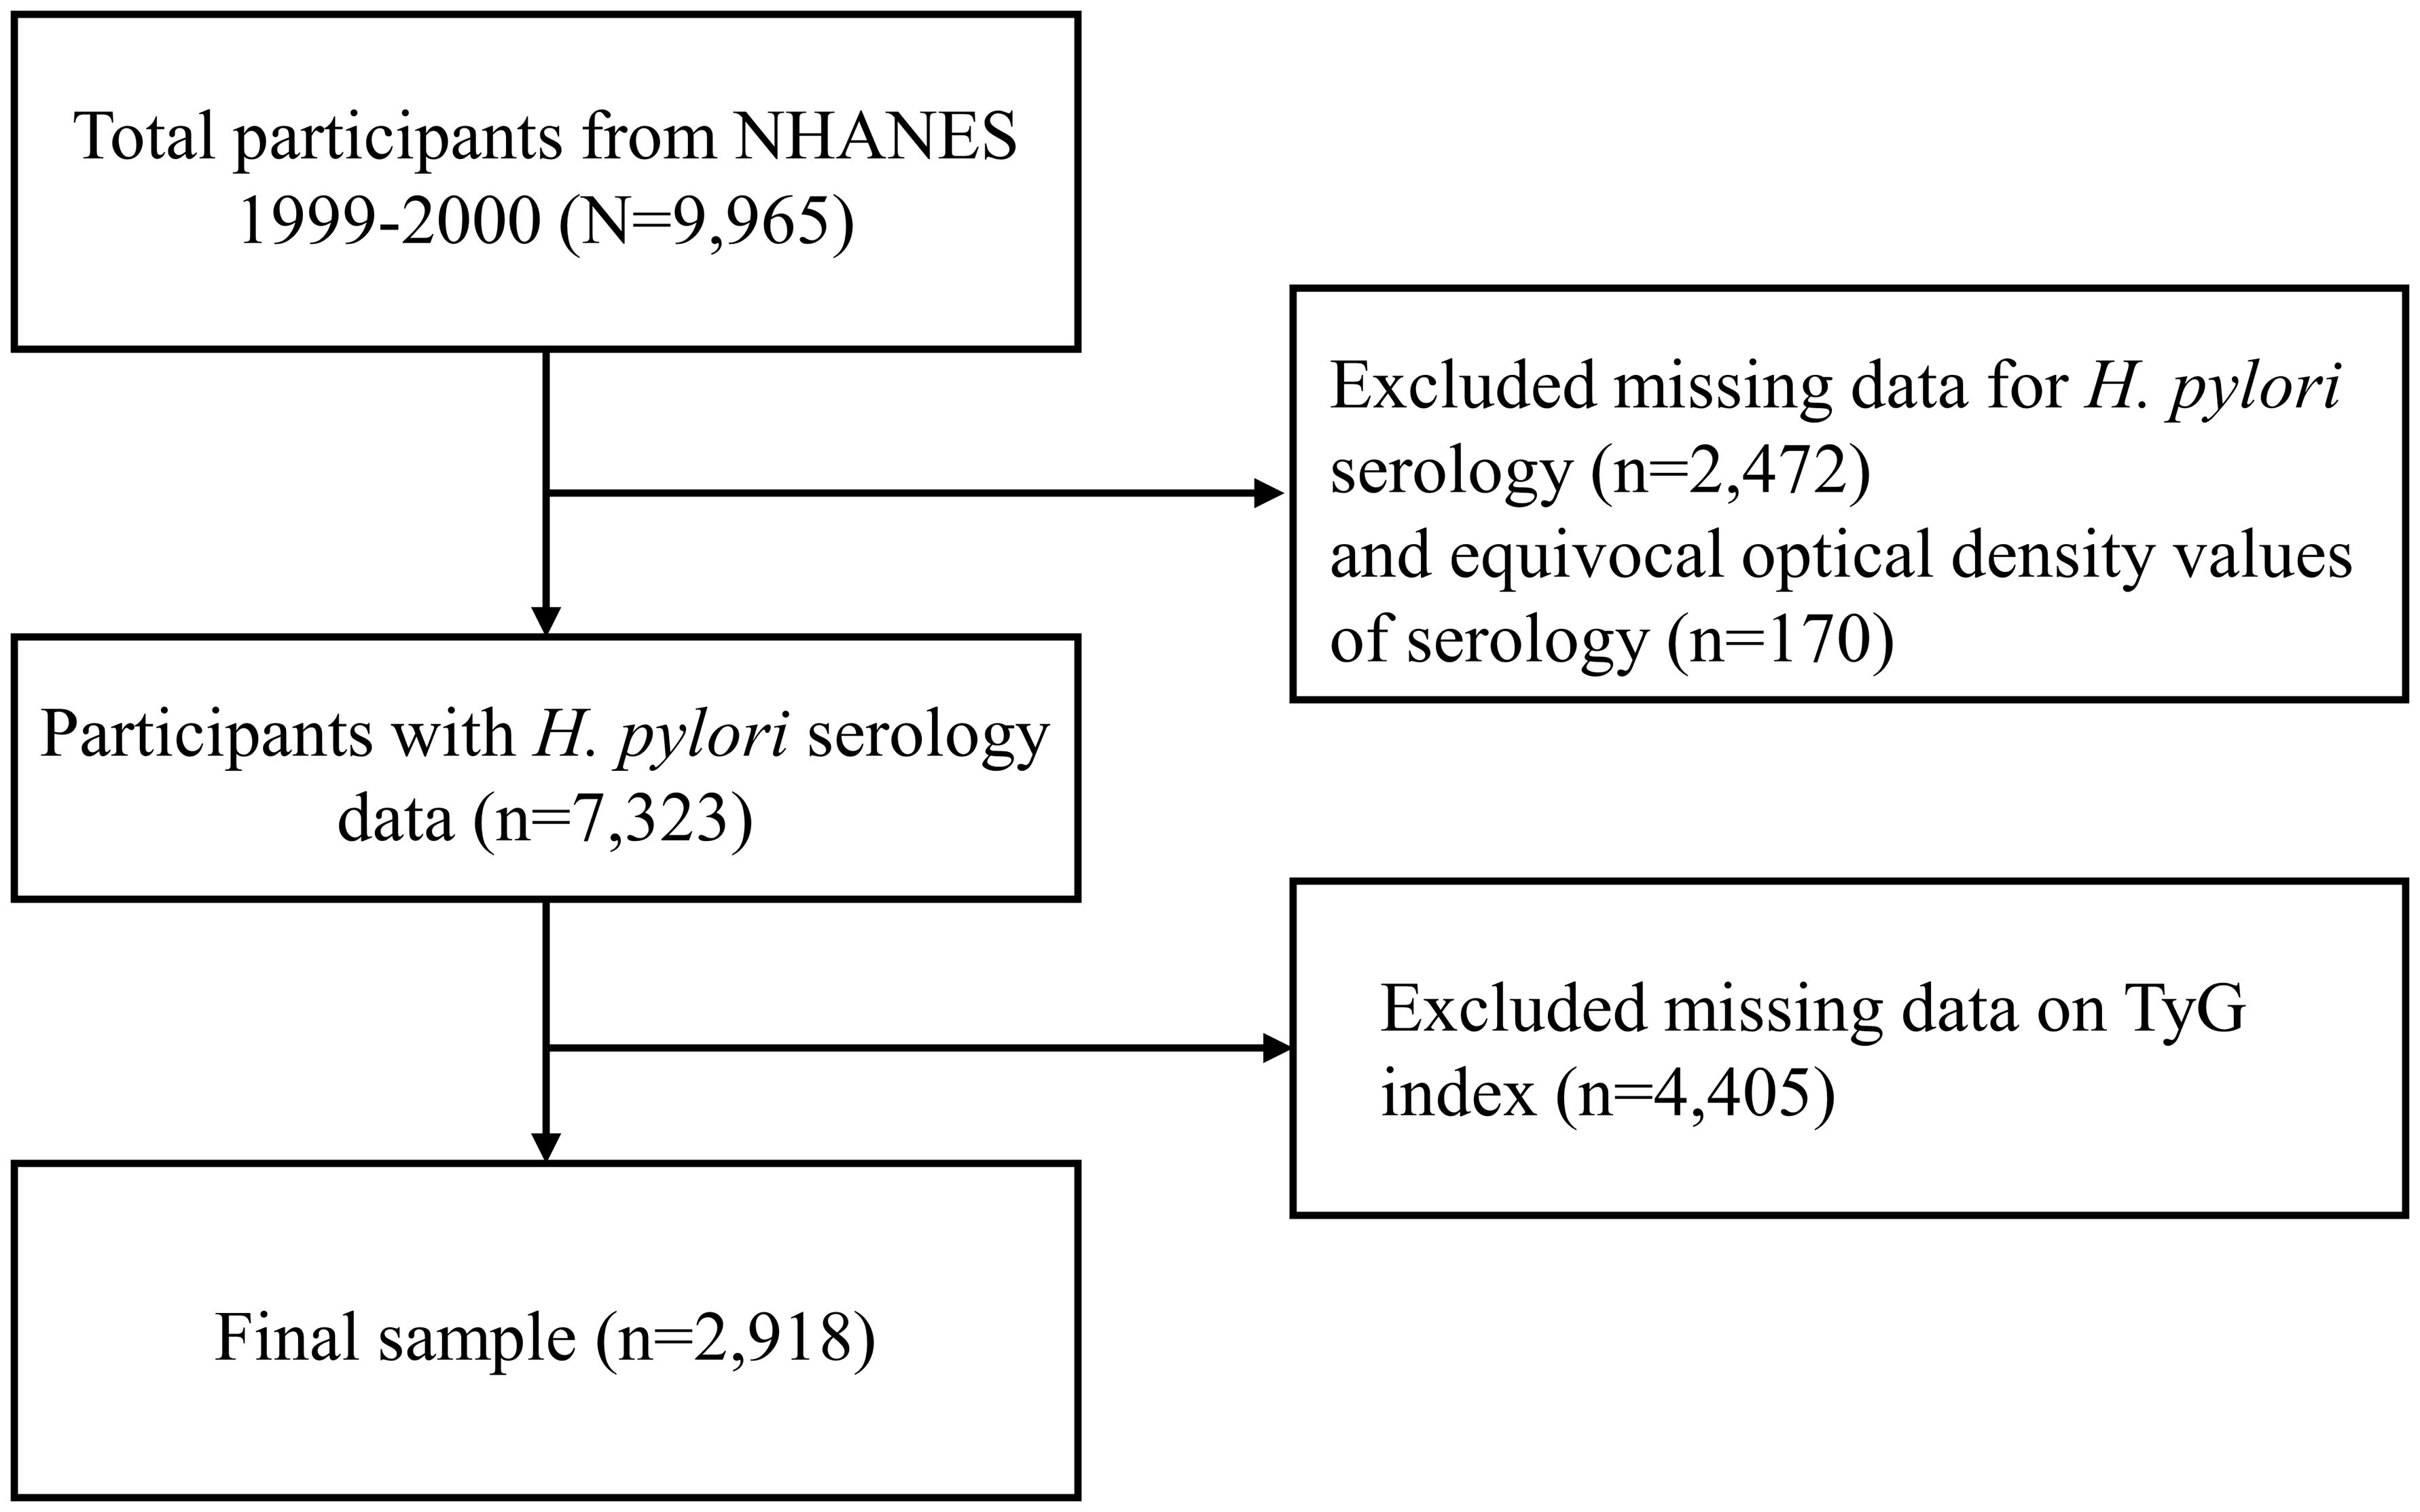
Figure 1. Flow chart for inclusion and exclusion of the study participants.
Exposure and outcome definitions
Assessment of TyG index
The TyG index was calculated by TyG = ln [fasting triglyceride (mg/dL) × fasting blood glucose (mg/dL)/2] (22). The concentrations of triglyceride and fasting blood glucose (FBG) were measured by enzymatic assay using an automated biochemical analyzer. Participants were required to fast for at least 8 hours but no more than 24 hours prior to the measurement of glucose and lipid. Notably, the TyG index was considered as an exposure variable within the framework of the design of this study.
H. pylori status
H. pylori infection was defined as an outcome variable. H. pylori was evaluated by detection of immunoglobulin G (IgG) antibody using Enzyme-Linked Immunosorbent Assay (ELISA) (23). Standard ELISA cut-offs were employed to categorize participants into H. pylori seropositive (optical density (OD) value ≥ 1.1) or seronegative (OD value < 0.9). Equivocal values (0.9 - 1.1) were excluded from the analysis to ensure accurate statistical outcomes in this study (23).
Assessment of covariates
The study incorporated a variety of covariates to explain potential confounders. These covariates included a range of demographic and health-related variables, including age (in years), sex, race, education level, poverty-to-income ratio (PIR), smoking status (never/former/now), alcohol use (yes/no), hypertension, diabetes, cardiovascular diseases (CVD), and body mass index (BMI). Missing covariate data were handled using multiple imputation methods. Subgroup analysis was performed by dividing age into two groups (<60 and ≥60). Race included Mexican American, non-Hispanic white, non-Hispanic black, and other race. Educational levels were categorized as below high school, high school or above high school. Participants were categorized into normal (<25 kg/m2), overweight (25 to <30 kg/m2), and obese (≥30 kg/m2) groups based on BMI. Hypertension was diagnosed by systolic blood pressure 140 mmHg and/or diastolic blood pressure ≥90 mmHg, or self-reported physician diagnosis of hypertension, or self-reported use of hypertension medication. Diabetes was diagnosed by glycated hemoglobin A1c (HbA1c) ≥ 6.5%, or self-reported physician diagnosis of diabetes, or self-reported use of glucose-lowering medications.
Statistical analysis
This study incorporates complex sample design and sample weights in accordance with NHANES analytic standards. Weighted baseline characteristics of participants were compared through H. pylori-negative and H. pylori-positive patients. Continuous variables were expressed as mean ± standard error (SE), while categorical variables were reported as frequency and weighted percentage. The baseline characteristics among the different groups were compared using Chi-square test, Student’s t test, and Fisher’s exact test, as appropriate (24). Based on previous studies, all participants population was divided into four groups (Quartile 1 (Q1), Q2, Q3, Q4) based on the quartiles of TyG index (25, 26). The logistic regression analysis used Q1 as the baseline reference category. The utilization of quartile categorization assists in detecting possible non-linear association and threshold effects between TyG index and H. pylori infection. Weighted multivariate logistic regression models were used to assess the independent association between H. pylori infection and TyG index in four different models. In Model 1, covariates were not adjusted. Model 2 was adjusted for age, sex, and race. Model 3 was adjusted for age, sex, race, education, BMI, and PIR. Model 4 was further adjusted for potential confounders, including age, sex, race, education, BMI, PIR, smoking, alcohol use, hypertension, DM, and CVD. Regression analysis results were reported as odds ratio (OR) values and 95% confidence intervals (CIs). Moreover, subgroup analyses were performed to evaluate possible heterogeneity. Interactions with age, sex, race, and BMI were tested. Subgroup covariates were analyzed using fully adjusted Model 4. To assess the robustness of our findings, sensitivity analyses were conducted by excluding individuals with cardiovascular disease, those using lipid-lowering medications, patients with diabetes, or those receiving glucose-lowering therapies. In addition, the relationship between FBG and H. pylori seropositivity was analyzed using weighted multivariable logistic regression analysis and compared with the TyG index.
All analyses were performed using R software (R version 4.3.2). P < 0.05 was considered statistically significant.
Results
Baseline characteristics of study participants
The study ultimately included a sample size of 2,918 individuals, including 1,101 (37.7%) H. pylori seropositive patients (Table 1). The weighted mean age of all individuals was 41.05 ± 0.66 years, of which 50.8% were females and 49.2% were males. The average fasting glucose and triglycerides for all participants were 98.89 ± 0.88 (mg/dL) and 136.46 ± 3.61 (mg/dL), respectively. The weighted mean TyG index was 8.62 ± 0.02. The average TyG index values were significantly higher in the H. pylori positive group (8.74 ± 0.03) compared to the H. pylori negative group (8.57 ± 0.03) (P < 0.001). The TyG index quartiles were Q1 (6.94 < TyG ≤ 8.08), Q2 (8.08 < TyG ≤ 8.50), Q3 (8.50 < TyG ≤ 8.96), and Q4 (8.96 < TyG ≤ 12.48). In addition, the H. pylori positive group showed a higher age (P < 0.001), lower education level (P < 0.001), and lower PIR (P < 0.001) compared with the H. pylori negative group.
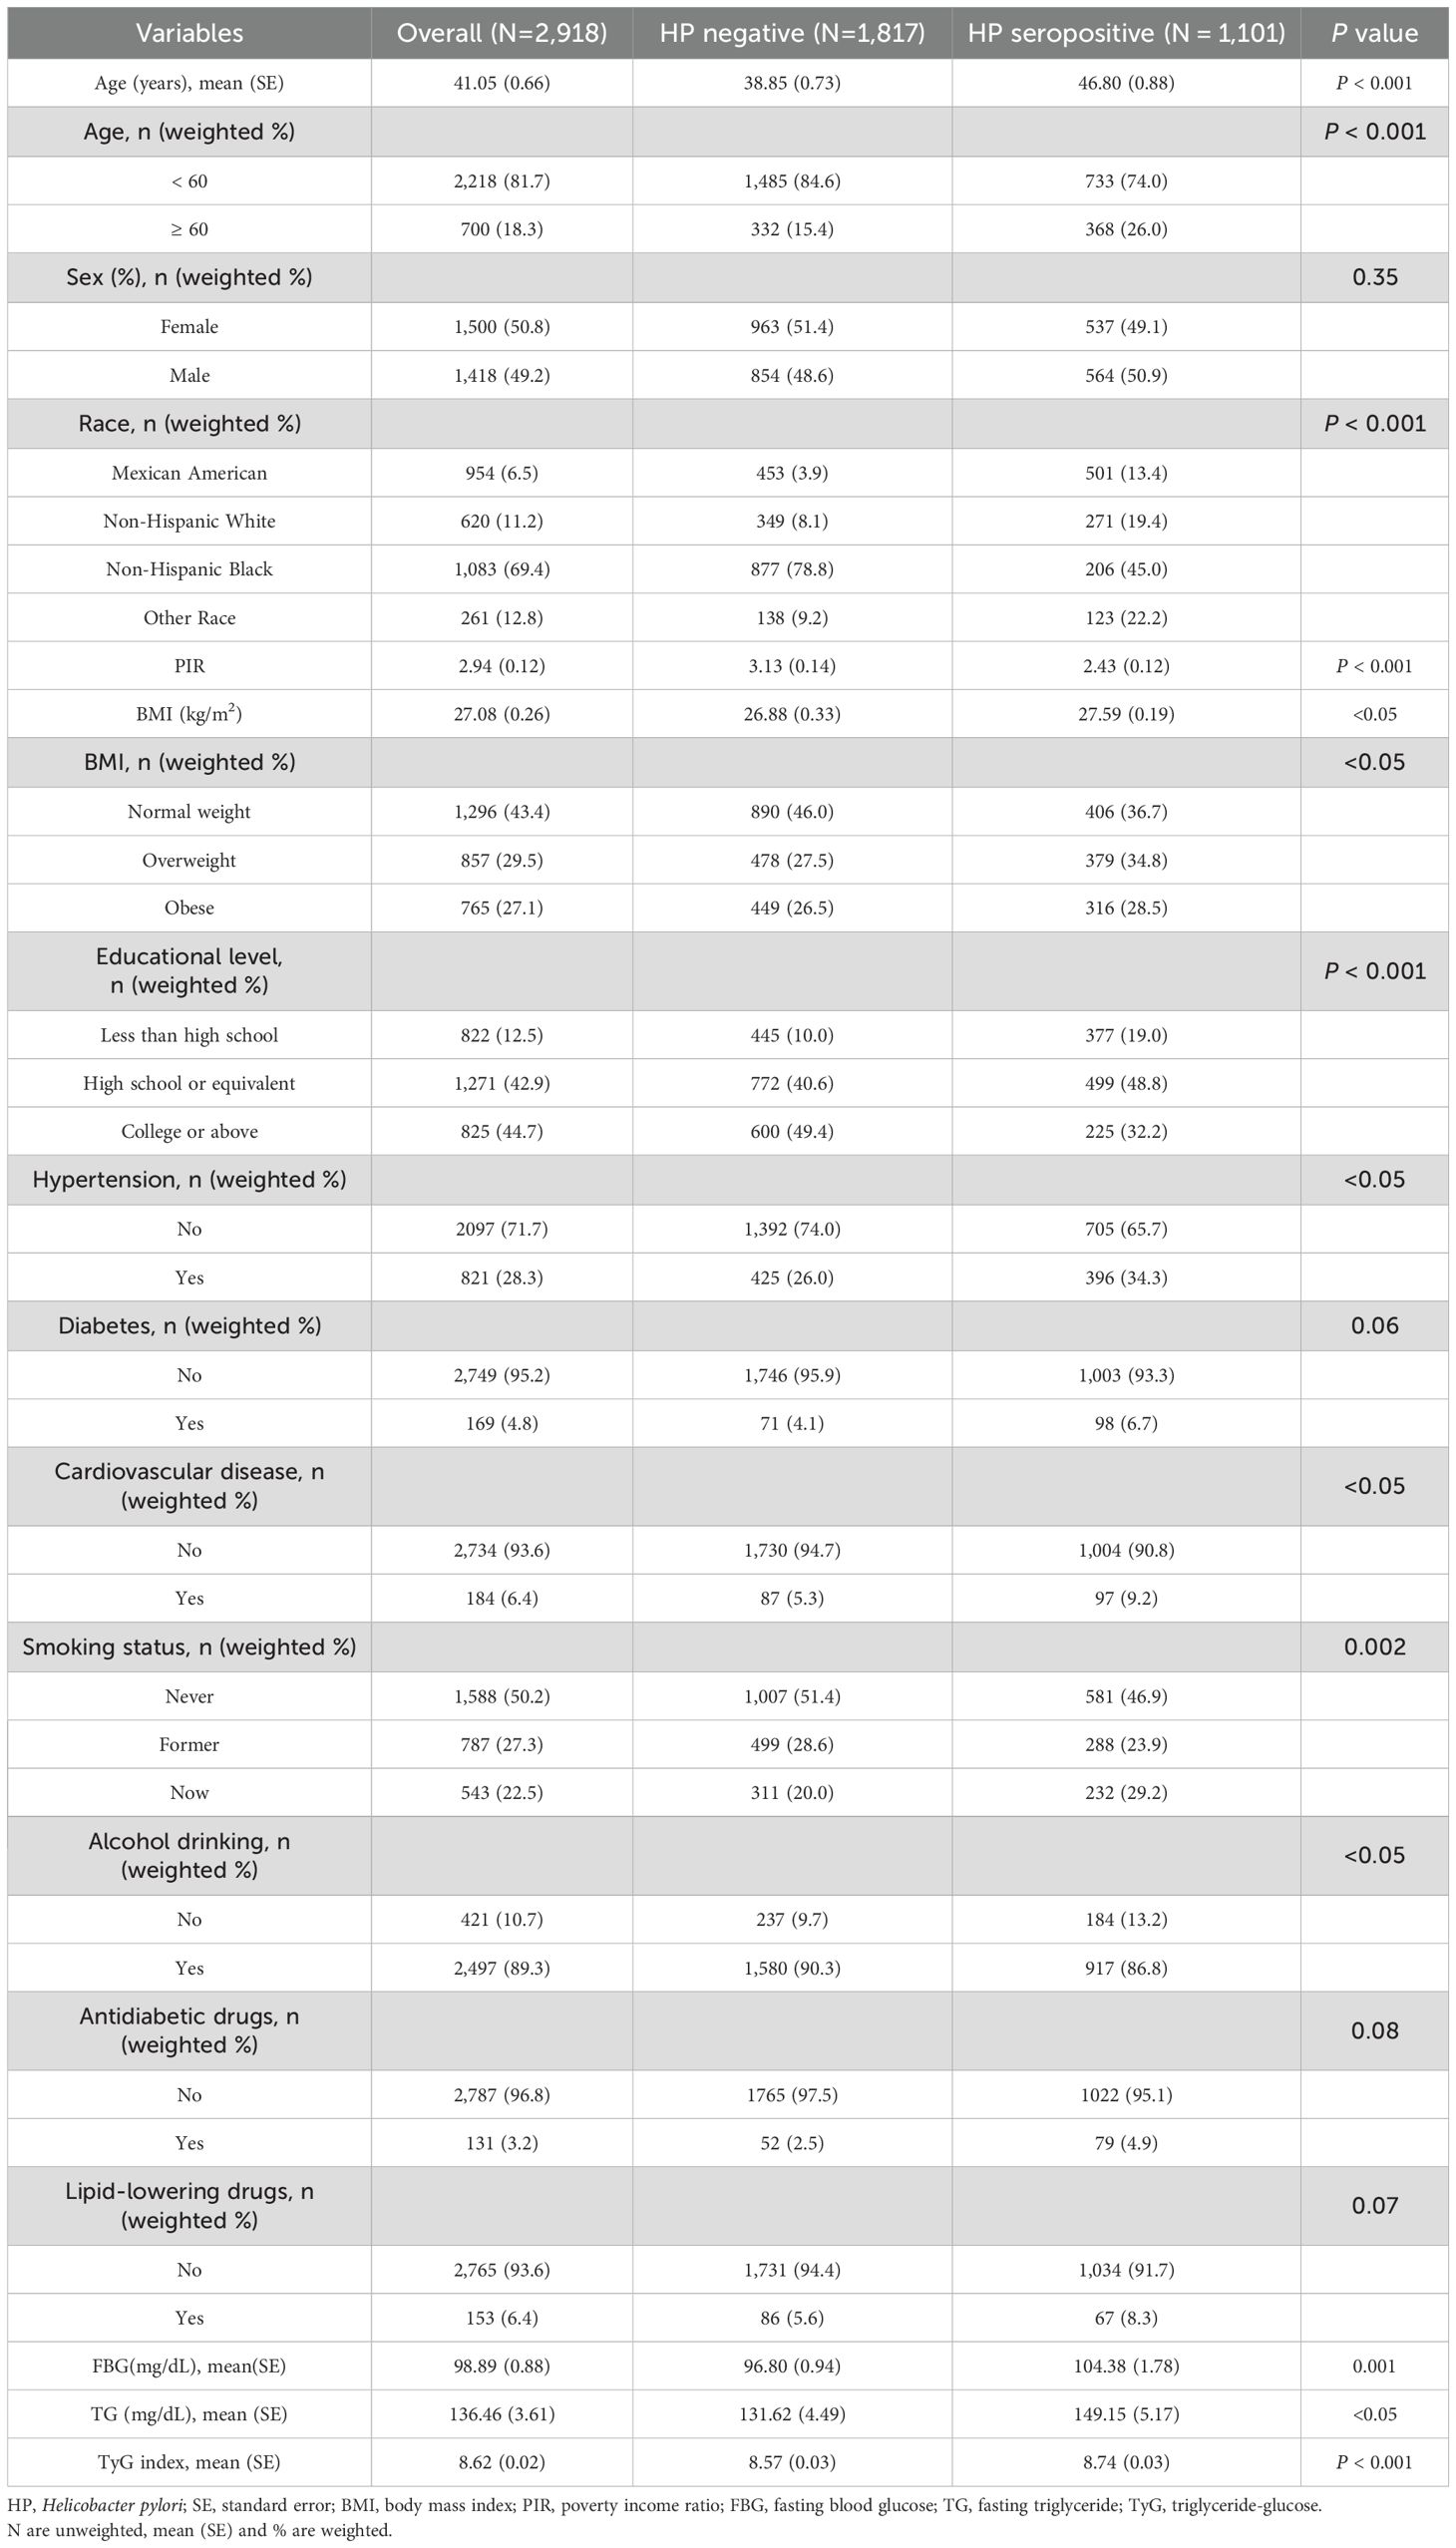
Table 1. Weighted baseline characteristics of participants with different H. pylori infection status.
Higher TyG index is associated with higher likelihood of H. pylori infection
The results of weighted logistic regression were presented in Table 2.
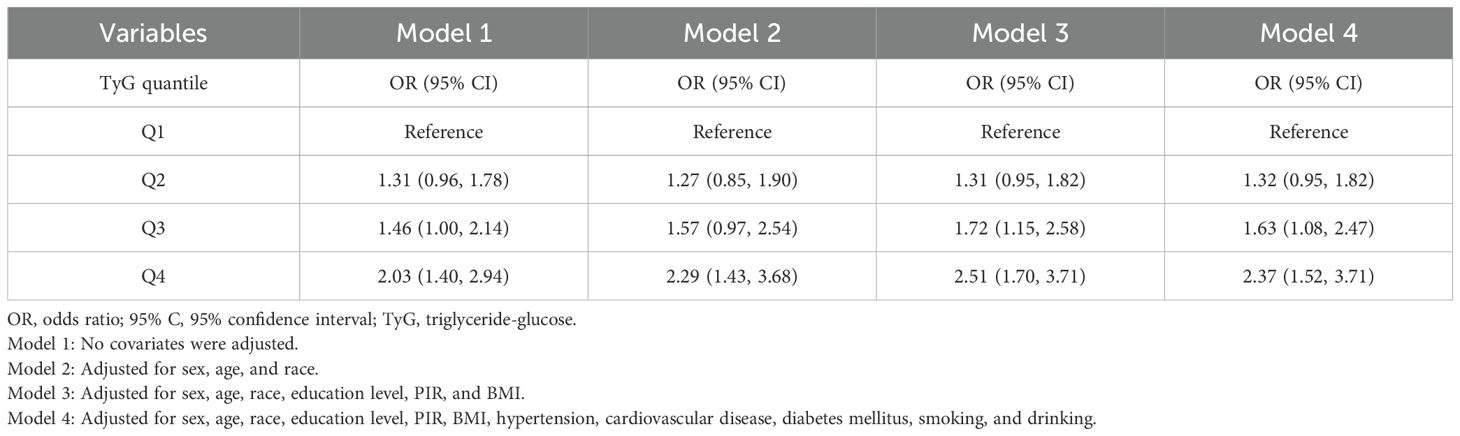
Table 2. ORs and 95% CIs for H. pylori infection according to TyG index.
The positive association between H. pylori infection and the TyG index in the Q4 quartile compared with the lowest quartile (Q1) persisted in Model 2 (OR = 2.29; 95%CI: 1.43 to 3.68) and Model 3 (OR = 2.51; 95%CI: 1.70 to 3.71). After adjusting for all potential confounders in Model 4, we found a progressive and significant increase in the risk of H. pylori seropositivity in increasing quartiles of the TyG index. Specifically, the fourth quartile of the TyG index showed the highest odds of H. pylori infection compared to Q1, with an OR of 2.37 (95%CI: 1.52 to 3.71, P < 0.001).
Subgroup analysis
The results of subgroup analyses are displayed in Figure 2. Interestingly, the positive association between TyG index and H. pylori infection was pronounced in participants under 60 years of age (OR = 1.58; 95% CI: 1.21 to 2.06), Mexican Americans (OR = 1.90; 95% CI: 1.32 to 2.71), non-Hispanic white (OR = 1.74; 95% CI: 1.31 to 2.32), and individuals with a BMI < 30. However, no correlation with the P for interaction meeting the statistical significance was detected in all subgroup analyses, indicating that the association was not dependent on age, sex, race, and BMI (P > 0.05).
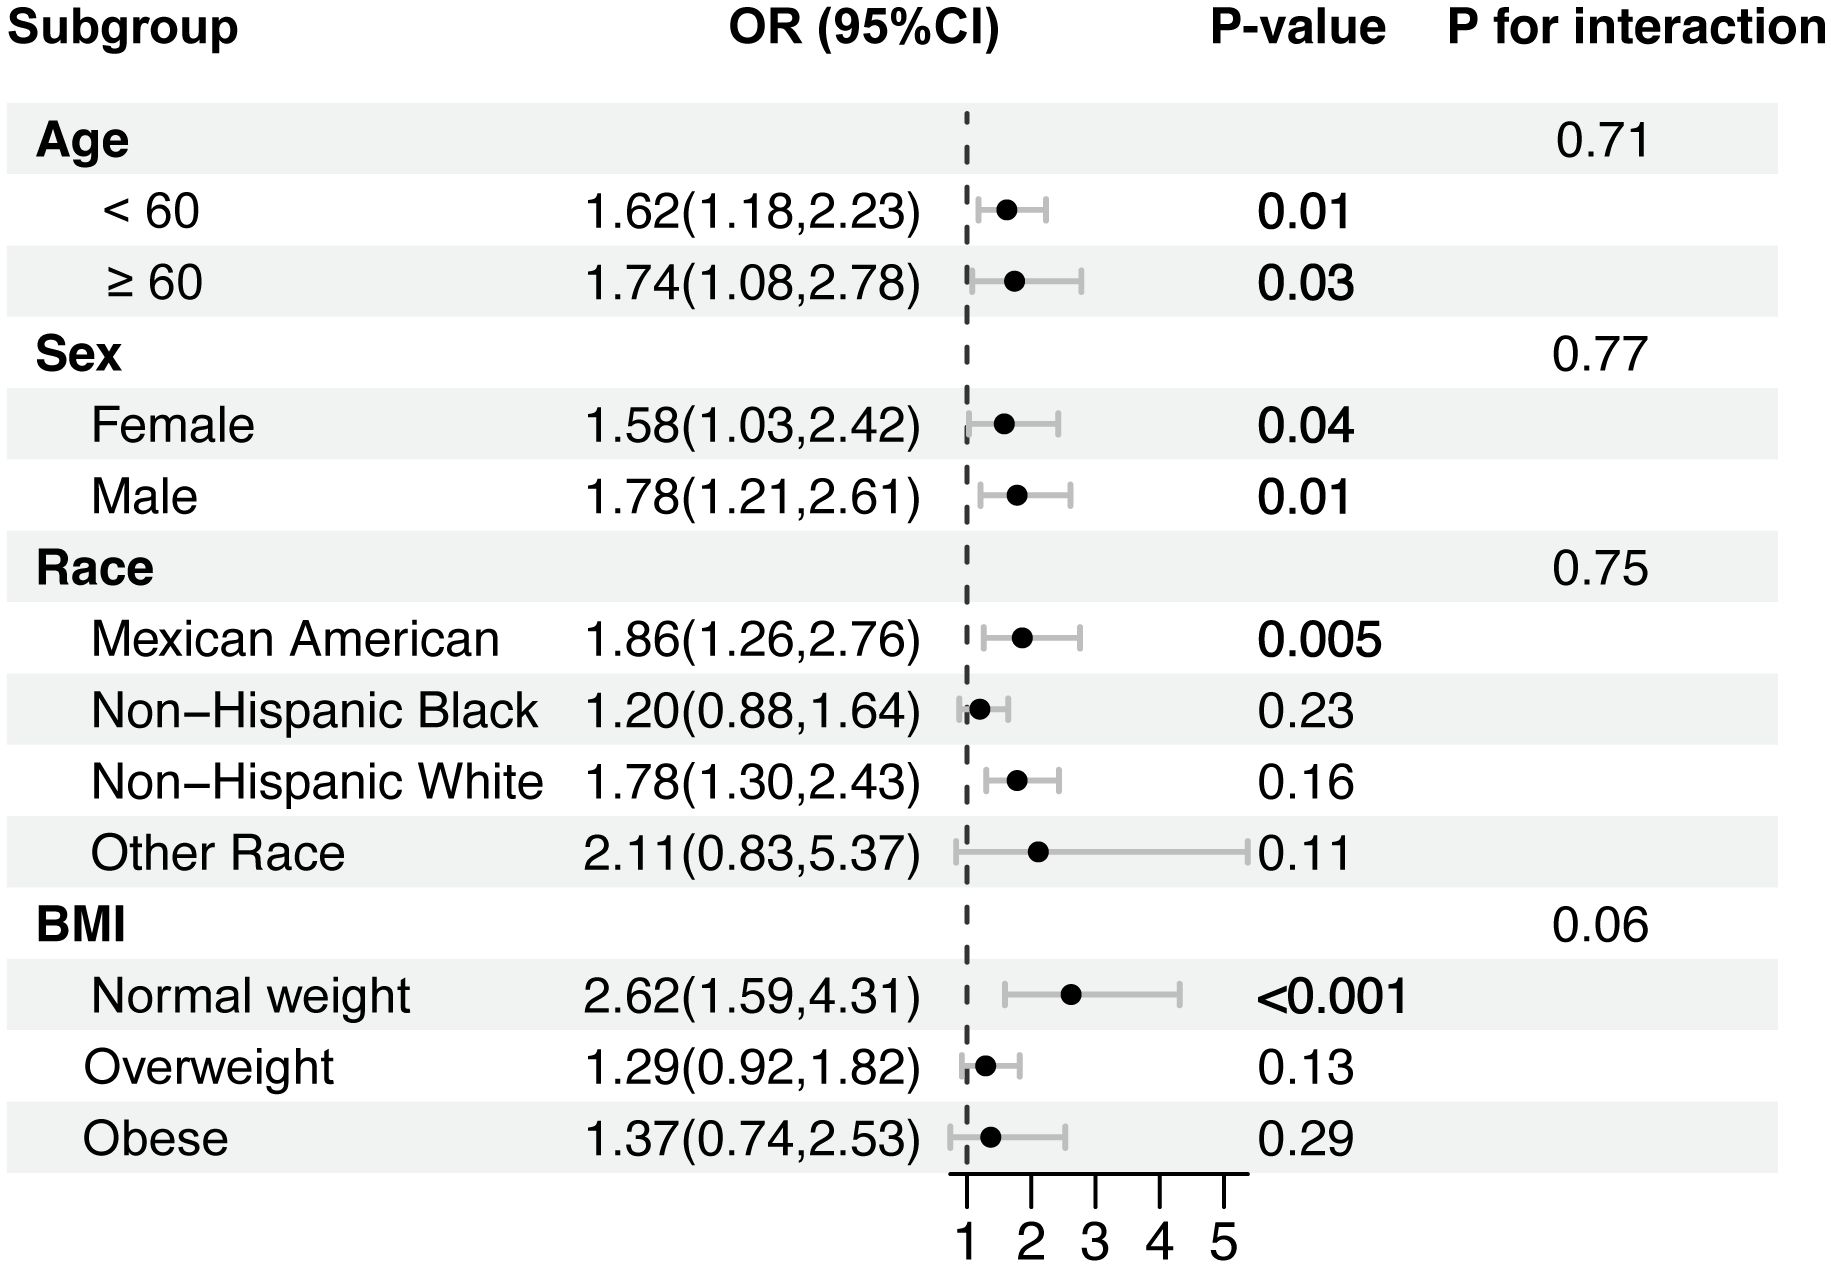
Figure 2. Subgroup analysis for the association between the TyG index and H. pylori infection.
Sensitivity and additional analyses
Sensitivity analysis indicated that the association between TyG index and H. pylori infection remained strong even after excluding participants with CVD or taking lipid-lowering medications, as well as patients with diabetes or taking glucose-lowering medications (Supplementary Table 1). To assess whether TyG index is more closely related to H. pylori infection than FBG, the relationship between FBG and H. pylori infection was further analyzed. Compared to the reference group in the lowest quartile, participants in the highest quartile of FBG showed an OR of 1.81 (95% CI: 1.30 to 2.51) in Model 4 (Supplementary Table 2), which was lower than that observed in the highest quartile of TyG index (OR = 2.37; 95%CI: 1.52 to 3.71).
Discussion
Previous studies have reported the relevance of H. pylori infection to several other pathologic factors (23, 27–29). Interestingly, Xiong et al. found that higher dietary inflammatory index (DII) was associated with an increased risk of H. pylori infection and was related to a higher risk of all-cause mortality only in H. pylori infected individuals (23). The DII is a scoring system that evaluates the potential inflammatory levels of dietary components. Inflammation has been reported to be positively associated with IR (30). In addition, gastric H. pylori colonization has been reported to be correlated with impaired glucose tolerance (27). A Japanese cross-sectional study showed that H. pylori infection significantly and independently promoted IR in a large asymptomatic population (11). The TyG index, on the other hand, is a new indicator that has been used to assess IR status in recent years. The main finding of this study was that H. pylori infection was positively associated with TyG index. The mean value of TyG index for all participants in this study was 8.62 ± 0.02. The mean TyG index values for H. pylori seropositivity and seronegativity were 8.74 ± 0.03 and 8.57 ± 0.03, respectively. Subgroup analyses and interaction tests showed that the association was not dependent on age, sex, race, and BMI. A clinical study showed that H. pylori seropositivity was associated with higher homeostatic model assessment for IR (HOMA-IR) values in patients with DM (31). Besides, a NHANES-based study reported a significant association between H. pylori seropositivity and metabolic score for IR (METS-IR) (32). These evidences further support the correlation between H. pylori infection and IR. Our findings are consistent with those of previous studies but provide additional insight into the extent of the association between H. pylori infection and TyG index.
The potential mechanisms explaining the relationship between TyG index and H. pylori infection remain to be further explored, and there may be several possible explanations as follows. Firstly, H. pylori seropositive patients suffer from poor IR. The study revealed a correlation between H. pylori infection and IR in pediatric populations (33). In addition, a meta-analysis involving 206,911 individuals also demonstrated that a higher risk of H. pylori infection was associated with IR (13). A randomized, double-blind, placebo-controlled trial demonstrated that the eradication of H. pylori improved glucose homeostasis in patients with T2DM by decreasing pro-inflammatory factors and fasting insulin levels (34). Mechanistically, the higher expression of suppressor of cytokine signaling 3 (SOCS3) is thought to exacerbate IR (35, 36). In vivo and in vitro experiments have shown that H. pylori infection could up-regulate SOCS3 expression by down-regulating miR-203 (12). Knockdown of SOCS3 attenuates H. pylori-induced impairment of insulin signaling (12). It has been shown that H. pylori infection affects the production of metabolic hormones involved in energy homeostasis (37), which may be another potential mechanism for H. pylori-related IR. Interestingly, it was revealed that diet-induced IR exacerbated by H. pylori may be associated with gut dysbacteriosis (14). Another report emphasized that there is a continuous crosstalk between H. pylori and the gut microbiota, which is involved in intestinal inflammation (37). In addition, studies suggest that the role of H. pylori in impaired glucose tolerance may be enhanced by higher BMI levels (14, 27). Notably, H. pylori infection has also been reported to be associated with higher HbA1c level and the development of T2DM (27, 38). Although increasing studies have reported a positive association between H. pylori and IR (11, 13), large-scale prospective studies are still needed to validate their association in the future.
Secondly, reverse causality may also explain the relationship between higher levels of TyG and higher odds of H. pylori infection. Notably, a higher TyG index not only implies IR, but also symbolizes adverse health conditions associated with diabetes, cardiovascular disease, obesity, hypertension, metabolic syndrome, and disorders of lipid metabolism (39–41). A hospital-based case study tested fecal antigen on 148 participants and showed that patients with DM were more likely to be infected with H. pylori in comparison with non-diabetic individuals (42). Diabetes-induced IR and chronic inflammation impair cellular and humoral immunity in patients, thereby enhancing individuals’ susceptibility to infection (43). Indeed, diabetic patients are also associated with impaired gastric secretions, gastrointestinal motility dysfunction, and aggravated gastric mucosal atrophy (44, 45). The impaired mucosal immunity and damage to the gastric epithelium provide an environment for H. pylori to colonize the gastric epithelium, thus enhancing susceptibility to infection (46). Although the association between T2DM and higher rates of H. pylori infection is controversial (47–49), once infected with H. pylori, patients with T2DM may be at higher risk for gastric cancer (50). Therefore, early detection and prompt treatment of H. pylori infection should be a priority to reduce the risk of gastric cancer in patients with T2DM. Furthermore, a recent meta-analysis reported that H. pylori infection increases the risk of coronary heart disease (CHD) (51). Chronic H. pylori infection triggers immune responses and activates inflammatory cytokines (52). Prolonged exposure to these inflammatory cytokines induces a chronic inflammatory cascade and changes in lipid metabolism. Thus, these changes may contribute to the development of atherosclerosis. A large cohort and long-term follow-up study involving more than 1,100 subjects suggested that the eradication of H. pylori prevents the development of CHD (53).
Advantages and limitations
This study presents several advantages. Firstly, this study is based on the NHANES database, which is a reliable source. Secondly, confounders were adjusted to ensure that the results of this study were convincing. Thirdly, the potential effects of hypoglycemic and lipid-lowering drugs on TyG index were fully considered in this study. Sensitivity analysis was used to assess the robustness of our findings. Moreover, we assessed whether the relationship between TyG index and H. pylori seroprevalence was closer than fasting glucose.
However, some limitations of this study should not be overlooked. To begin with, this paper is based on the U.S. NHANES database, which is not fully representative of populations around the world. Then, due to the cross-sectional study design, we could not identify a causal relationship between TyG index and H. pylori infection. Therefore, our findings must be interpreted with caution and viewed as primary evidence worthy of further study. Furthermore, the use of H. pylori IgG serology as a marker of infection does not distinguish between current and past infections. This may have influenced our results, as the persistence of IgG antibodies could lead to an overestimation of active infection rates. Future studies using more specific methods, such as the urea breath test, could provide more accurate assessments of current infection status. Last but not least, This study utilized laboratory data collected during NHANES 1999-2000, which may raise concerns about the accuracy of techniques used at that time. However, NHANES adheres to rigorous quality control and standardization protocols, and the methods employed were state-of-the-art and well-validated. While the age of the data is a limitation, our findings are consistent with more recent studies (54, 55), supporting the robustness of our results.
Conclusions
Our findings demonstrate a significant positive association between TyG index levels and risk of H. pylori infection, suggesting its potential utility as a predictive biomarker. Nevertheless, additional large-scale studies are essential accurately determine the precise causal relationship underlying this association.
Data availability statement
Publicly available datasets were analyzed in this study. These data can be found here: https://www.cdc.gov/nchs/nhanes/.
Author contributions
DL: Conceptualization, Data curation, Software, Writing – original draft. CM: Data curation, Writing – original draft. YX: Conceptualization, Funding acquisition, Writing – review & editing. YZ: Conceptualization, Funding acquisition, Writing – review & editing.
Funding
The author(s) declare that financial support was received for the research and/or publication of this article. This study was supported by grants from the National Natural Science Foundation of China (82374426), the domestic first class construction discipline of Chinese Medicine in Hunan University of Chinese Medicine, the Postgraduate Scientific Research Innovation Project of Hunan University of Chinese Medicine (2024CX022), and the National Administration of Traditional Chinese Medicine, Construction Project of Inheritance Studio of National Famous Traditional Chinese Medicine Experts ([2022] No. 75).
Acknowledgments
The authors thank Jun Xu for her assistance with language.
Conflict of interest
The authors declare that the research was conducted in the absence of any commercial or financial relationships that could be construed as a potential conflict of interest.
Publisher’s note
All claims expressed in this article are solely those of the authors and do not necessarily represent those of their affiliated organizations, or those of the publisher, the editors and the reviewers. Any product that may be evaluated in this article, or claim that may be made by its manufacturer, is not guaranteed or endorsed by the publisher.
Supplementary material
The Supplementary Material for this article can be found online at: https://www.frontiersin.org/articles/10.3389/fendo.2025.1443705/full#supplementary-material
References
1. Hooi J, Lai WY, Ng WK, Suen M, Underwood FE, Tanyingoh D, et al. Global prevalence of helicobacter pylori infection: systematic review and meta-analysis. Gastroenterology. (2017) 153:420–9. doi: 10.1053/j.gastro.2017.04.022
2. Shuman J, Lin AS, Westland MD, Bryant KN, Piazuelo MB, Reyzer ML, et al. Remodeling of the gastric environment in Helicobacter pylori-induced atrophic gastritis. mSystems. (2024) 9:e0109823. doi: 10.1128/msystems.01098-23
3. Uemura N, Okamoto S, Yamamoto S, Matsumura N, Yamaguchi S, Yamakido M, et al. Helicobacter pylori infection and the development of gastric cancer. N Engl J Med. (2001) 345:784–9. doi: 10.1056/NEJMoa001999
4. Parsonnet J, Friedman GD, Vandersteen DP, Chang Y, Vogelman JH, Orentreich N, et al. Helicobacter pylori infection and the risk of gastric carcinoma. N Engl J Med. (1991) 325:1127–31. doi: 10.1056/NEJM199110173251603
5. Doheim MF, Altaweel AA, Elgendy MG, Elshanbary AA, Dibas M, Ali A, et al. Association between Helicobacter Pylori infection and stroke: a meta-analysis of 273,135 patients. J Neurol. (2021) 268:3238–48. doi: 10.1007/s00415-020-09933-x
6. Zhang L, Chen Z, Xia X, Chi J, Li H, Liu X, et al. Helicobacter pylori infection selectively increases the risk for carotid atherosclerosis in young males. Atherosclerosis. (2019) 291:71–7. doi: 10.1016/j.atherosclerosis.2019.10.005
7. Wernly S, Semmler G, Völkerer A, Flamm M, Aigner E, Niederseer D, et al. Helicobacter pylori and cardiovascular risk: Only a dead Helicobacter is a good Helicobacter. Helicobacter. (2022) 27:e12928. doi: 10.1111/hel.12928
8. Liu Y, Shuai P, Chen W, Liu Y, Li D. Association between Helicobacter pylori infection and metabolic syndrome and its components. Front Endocrinol (Lausanne). (2023) 14:1188487. doi: 10.3389/fendo.2023.1188487
9. Chen Y, Yang C, You N, Zhang J. Relationship between Helicobacter pylori and glycated hemoglobin: a cohort study. Front Cell Infect Microbiol. (2023) 13:1196338. doi: 10.3389/fcimb.2023.1196338
10. Wan Z, Song L, Hu L, Hu M, Lei X, Huang Y, et al. Helicobacter pylori infection is associated with diabetes among Chinese adults. J Diabetes Investig. (2020) 11:199–205. doi: 10.1111/jdi.13102
11. Gunji T, Matsuhashi N, Sato H, Fujibayashi K, Okumura M, Sasabe N, et al. Helicobacter pylori infection significantly increases insulin resistance in the asymptomatic Japanese population. Helicobacter. (2009) 14:144–50. doi: 10.1111/j.1523-5378.2009.00705.x
12. Zhou X, Liu W, Gu M, Zhou H, Zhang G. Helicobacter pylori infection causes hepatic insulin resistance by the c-Jun/miR-203/SOCS3 signaling pathway. J Gastroenterol. (2015) 50:1027–40. doi: 10.1007/s00535-015-1051-6
13. Azami M, Baradaran HR, Dehghanbanadaki H, Kohnepoushi P, Saed L, Moradkhani A, et al. Association of Helicobacter pylori infection with the risk of metabolic syndrome and insulin resistance: an updated systematic review and meta-analysis. Diabetol Metab Syndr. (2021) 13:145. doi: 10.1186/s13098-021-00765-x
14. He C, Yang Z, Cheng D, Xie C, Zhu Y, Ge Z, et al. Helicobacter pylori infection aggravates diet-induced insulin resistance in association with gut microbiota of mice. EBioMedicine. (2016) 12:247–54. doi: 10.1016/j.ebiom.2016.09.010
15. Dikaiakou E, Vlachopapadopoulou EA, Paschou SA, Athanasouli F, Panagiotopoulos I, Kafetzi M, et al. Triglycerides-glucose (TyG) index is a sensitive marker of insulin resistance in Greek children and adolescents. Endocrine. (2020) 70:58–64. doi: 10.1007/s12020-020-02374-6
16. Simental-Mendía LE, Rodríguez-Morán M, Guerrero-Romero F. The product of fasting glucose and triglycerides as surrogate for identifying insulin resistance in apparently healthy subjects. Metab Syndr Relat Disord. (2008) 6:299–304. doi: 10.1089/met.2008.0034
17. Liang D, Liu C, Wang Y. The association between triglyceride-glucose index and the likelihood of cardiovascular disease in the U.S. population of older adults aged ≥ 60 years: a population-based study. Cardiovasc Diabetol. (2024) 23:151. doi: 10.1186/s12933-024-02248-5
18. Park HM, Lee HS, Lee YJ, Lee JH. The triglyceride-glucose index is a more powerful surrogate marker for predicting the prevalence and incidence of type 2 diabetes mellitus than the homeostatic model assessment of insulin resistance. Diabetes Res Clin Pract. (2021) 180:109042. doi: 10.1016/j.diabres.2021.109042
19. Liu L, Qin M, Ji J, Wang W. Correlation between hearing impairment and the Triglyceride Glucose Index: based on a national cross-sectional study. Front Endocrinol (Lausanne). (2023) 14:1216718. doi: 10.3389/fendo.2023.1216718
20. Qin Z, Zhao J, Geng J, Chang K, Liao R, Su B. Higher triglyceride-glucose index is associated with increased likelihood of kidney stones. Front Endocrinol (Lausanne). (2021) 12:774567. doi: 10.3389/fendo.2021.774567
21. Curtin LR, Mohadjer LK, Dohrmann SM, Montaquila JM, Kruszan-Moran D, Mirel LB, et al. The national health and nutrition examination survey: sample design, 1999-2006. Vital Health Stat 2. (2012), 1–39.
22. Guerrero-Romero F, Simental-Mendía LE, González-Ortiz M, Martínez-Abundis E, Ramos-Zavala MG, Hernández-González SO, et al. The product of triglycerides and glucose, a simple measure of insulin sensitivity. Comparison with the euglycemic-hyperinsulinemic clamp. J Clin Endocrinol Metab. (2010) 95:3347–51. doi: 10.1210/jc.2010-0288
23. Xiong YJ, Du LL, Diao YL, Wen J, Meng XB, Gao J, et al. Association of dietary inflammatory index with helicobacter pylori infection and mortality among US population. J Transl Med. (2023) 21:538. doi: 10.1186/s12967-023-04398-8
24. Fan H, Liu Z, Zhang X, Wu S, Shi T, Zhang P, et al. Thyroid stimulating hormone levels are associated with genetically predicted nonalcoholic fatty liver disease. J Clin Endocrinol Metab. (2022) 107:2522–9. doi: 10.1210/clinem/dgac393
25. Zheng H, Chen G, Wu K, Wu W, Huang Z, Wang X, et al. Relationship between cumulative exposure to triglyceride-glucose index and heart failure: a prospective cohort study. Cardiovasc Diabetol. (2023) 22:239. doi: 10.1186/s12933-023-01967-5
26. Tan L, Liu Y, Liu J, Zhang G, Liu Z, Shi R. Association between insulin resistance and uncontrolled hypertension and arterial stiffness among US adults: a population-based study. Cardiovasc Diabetol. (2023) 22:311. doi: 10.1186/s12933-023-02038-5
27. Chen Y, Blaser MJ. Association between gastric Helicobacter pylori colonization and glycated hemoglobin levels. J Infect Dis. (2012) 205:1195–202. doi: 10.1093/infdis/jis106
28. Krueger WS, Hilborn ED, Converse RR, Wade TJ. Environmental risk factors associated with Helicobacter pylori seroprevalence in the United States: a cross-sectional analysis of NHANES data. Epidemiol Infect. (2015) 143:2520–31. doi: 10.1017/S0950268814003938
29. Wang J, Liu D, Xie Y. Association between Helicobacter pylori infection and serum thyroid stimulating hormone in the National Health and Nutrition Examination Survey 1999-2000. Front Endocrinol (Lausanne). (2022) 13:1018267. doi: 10.3389/fendo.2022.1018267
30. Wu H, Ballantyne CM. Metabolic inflammation and insulin resistance in obesity. Circ Res. (2020) 126:1549–64. doi: 10.1161/CIRCRESAHA.119.315896
31. Vafaeimanesh J, Bagherzadeh M, Heidari A, Motii F, Parham M. Diabetic patients infected with helicobacter pylori have a higher Insulin Resistance Degree. Caspian J Intern Med. (2014) 5:137–42.
32. Qiu J, Yu Y, Liu D, Chen S, Wang Y, Peng J, et al. Association between non-insulin-based insulin resistance surrogate makers and Helicobacter pylori infection: a population-based study. BMC Gastroenterol. (2025) 25:25. doi: 10.1186/s12876-025-03610-x
33. Ozdem S, Akcam M, Yilmaz A, Artan R. Insulin resistance in children with Helicobacter pylori infection. J Endocrinol Invest. (2007) 30:236–40. doi: 10.1007/BF03347431
34. Bonfigli AR, Boemi M, Festa R, Bonazzi P, Brandoni G, Spazzafumo L, et al. Randomized, double-blind, placebo-controlled trial to evaluate the effect of Helicobacter pylori eradication on glucose homeostasis in type 2 diabetic patients. Nutr Metab Cardiovasc Dis. (2016) 26:893–8. doi: 10.1016/j.numecd.2016.06.012
35. Emanuelli B, Peraldi P, Filloux C, Sawka-Verhelle D, Hilton D, Van Obberghen E. SOCS-3 is an insulin-induced negative regulator of insulin signaling. J Biol Chem. (2000) 275:15985–91. doi: 10.1074/jbc.275.21.15985
36. Pedroso JA, Buonfiglio DC, Cardinali LI, Furigo IC, Ramos-Lobo AM, Tirapegui J, et al. Inactivation of SOCS3 in leptin receptor-expressing cells protects mice from diet-induced insulin resistance but does not prevent obesity. Mol Metab. (2014) 3:608–18. doi: 10.1016/j.molmet.2014.06.001
37. Khosravi Y, Seow SW, Amoyo AA, Chiow KH, Tan TL, Wong WY, et al. Helicobacter pylori infection can affect energy modulating hormones and body weight in germ free mice. Sci Rep. (2015) 5:8731. doi: 10.1038/srep08731
38. Hsieh MC, Wang SS, Hsieh YT, Kuo FC, Soon MS, Wu DC. Helicobacter pylori infection associated with high HbA1c and type 2 diabetes. Eur J Clin Invest. (2013) 43:949–56. doi: 10.1111/eci.12124
39. Zhang M, Wang B, Liu Y, Sun X, Luo X, Wang C, et al. Cumulative increased risk of incident type 2 diabetes mellitus with increasing triglyceride glucose index in normal-weight people: The Rural Chinese Cohort Study. Cardiovasc Diabetol. (2017) 16:30. doi: 10.1186/s12933-017-0514-x
40. Nam KW, Kwon HM, Jeong HY, Park JH, Kwon H, Jeong SM. High triglyceride-glucose index is associated with subclinical cerebral small vessel disease in a healthy population: a cross-sectional study. Cardiovasc Diabetol. (2020) 19:53. doi: 10.1186/s12933-020-01031-6
41. Zhu B, Wang J, Chen K, Yan W, Wang A, Wang W, et al. A high triglyceride glucose index is more closely associated with hypertension than lipid or glycemic parameters in elderly individuals: a cross-sectional survey from the Reaction Study. Cardiovasc Diabetol. (2020) 19:112. doi: 10.1186/s12933-020-01077-6
42. Devrajani BR, Shah SZ, Soomro AA, Devrajani T. Type 2 diabetes mellitus: A risk factor for Helicobacter pylori infection: A hospital based case-control study. Int J Diabetes Dev Ctries. (2010) 30:22–6. doi: 10.4103/0973-3930.60008
43. Shoelson SE, Lee J, Goldfine AB. Inflammation and insulin resistance. J Clin Invest. (2006) 116:1793–801. doi: 10.1172/JCI29069
44. Lyrenås EB, Olsson EH, Arvidsson UC, Orn TJ, Spjuth JH. Prevalence and determinants of solid and liquid gastric emptying in unstable type I diabetes. Relationship to postprandial blood glucose concentrations. Diabetes Care. (1997) 20:413–8. doi: 10.2337/diacare.20.3.413
45. Kinoshita M, Igarashi S, Kume E, Saito N, Arakawa K. Fasting induces impairment of gastric mucosal integrity in non-insulin-dependent diabetic (db/db) mice. Aliment Pharmacol Ther. (2000) 14:359–66. doi: 10.1046/j.1365-2036.2000.00710.x
46. Borody T, Ren Z, Pang G, Clancy R. Impaired host immunity contributes to Helicobacter pylori eradication failure. Am J Gastroenterol. (2002) 97:3032–7. doi: 10.1111/j.1572-0241.2002.07121.x
47. Quatrini M, Boarino V, Ghidoni A, Baldassarri AR, Bianchi PA, Bardella MT. Helicobacter pylori prevalence in patients with diabetes and its relationship to dyspeptic symptoms. J Clin Gastroenterol. (2001) 32:215–7. doi: 10.1097/00004836-200103000-00006
48. Oluyemi A, Anomneze E, Smith S, Fasanmade O. Prevalence of a marker of active helicobacter pylori infection among patients with type 2 diabetes mellitus in Lagos, Nigeria. BMC Res Notes. (2012) 5:284. doi: 10.1186/1756-0500-5-284
49. Demir M, Gokturk HS, Ozturk NA, Kulaksizoglu M, Serin E, Yilmaz U. Helicobacter pylori prevalence in diabetes mellitus patients with dyspeptic symptoms and its relationship to glycemic control and late complications. Dig Dis Sci. (2008) 53:2646–9. doi: 10.1007/s10620-007-0185-7
50. Chen YL, Cheng KC, Lai SW, Tsai IJ, Lin CC, Sung FC, et al. Diabetes and risk of subsequent gastric cancer: a population-based cohort study in Taiwan. Gastric Cancer. (2013) 16:389–96. doi: 10.1007/s10120-012-0197-7
51. Tong L, Wang BB, Li FH, Lv SP, Pan FF, Dong XJ. An updated meta-analysis of the relationship between helicobacter pylori infection and the risk of coronary heart disease. Front Cardiovasc Med. (2022) 9:794445. doi: 10.3389/fcvm.2022.794445
52. Crabtree JE, Shallcross TM, Heatley RV, Wyatt JI. Mucosal tumour necrosis factor alpha and interleukin-6 in patients with Helicobacter pylori associated gastritis. Gut. (1991) 32:1473–7. doi: 10.1136/gut.32.12.1473
53. Kim SB, Kim N, Park J, Hwang IC, Lim SH, Song DH, et al. Preventive effect of Helicobacter pylori eradication on the coronary heart diseases depending on age and sex with a median follow-up of 51 months. Helicobacter. (2023) 28:e12969. doi: 10.1111/hel.12969
54. Talebi G, Saffarian P, Hakemi-Vala M, Sadeghi A, Yadegar A. The effect of Helicobacter pylori-derived extracellular vesicles on glucose metabolism and induction of insulin resistance in HepG2 cells. Arch Physiol Biochem. (2024) 2:316–27. doi: 10.1080/13813455.2024.2418494
Keywords: triglyceride-glucose (TyG) index, Helicobacter pylori (H. pylori), insulin resistance, National Health and Nutrition Examination Survey (NHANES), cross-sectional study
Citation: Long D, Mao C, Xu Y and Zhu Y (2025) Association between triglyceride-glucose index and Helicobacter pylori infection: a cross-sectional study. Front. Endocrinol. 16:1443705. doi: 10.3389/fendo.2025.1443705
Received: 04 June 2024; Accepted: 31 March 2025;
Published: 22 April 2025.
Edited by:
Åke Sjöholm, Gävle Hospital, SwedenReviewed by:
Michal Kasher Meron, Tel Aviv University, IsraelAbebaw Worede, University of Gondar, Ethiopia
Copyright © 2025 Long, Mao, Xu and Zhu. This is an open-access article distributed under the terms of the Creative Commons Attribution License (CC BY). The use, distribution or reproduction in other forums is permitted, provided the original author(s) and the copyright owner(s) are credited and that the original publication in this journal is cited, in accordance with accepted academic practice. No use, distribution or reproduction is permitted which does not comply with these terms.
*Correspondence: Yin Xu, NjczMDE4ODcyQHFxLmNvbQ==; Ying Zhu, aG56eWZ5enlAMTI2LmNvbQ==