 Eman Alfadhli1,2*
 Ishraq Darandari1Maha Altaweel1Sara Alharbi1Asma Jadw1Ghadi Aljohani1Sarah Mohammad1
- 1Medicine Department, College of Medicine, Taibah University, Medina, Saudi Arabia
- 2Medicine Department, King Faisal Specialist Hospital & Research center, Medina, Saudi Arabia
Objectives: To explore differences in body composition between individuals with type 2 diabetes mellitus (T2DM) and those without diabetes in Medina, Saudi Arabia, stratified by sex and age.
Methods: A cross-sectional study was conducted at Taibah University, four primary care centers, and diabetes center in Medina, Saudi Arabia, from July to September 2023, involving 630 adults with and without T2DM. Body composition was assessed using a bioelectrical impedance analysis (BIA), measuring weight, body mass index (BMI), total body fat, visceral fat (VF), muscle mass, and bone mass. Participants were grouped into three categories: young age (18–40 years), middle age (41–60 years), and older age (>60 years). Body composition differences between groups were analyzed using independent t-tests.
Results: Of the 630 participants, 42.4% had T2DM. Among young women with T2DM, BMI, total body fat, VF, muscle mass, and bone mass were significantly higher (p < 0.001) compared to women without diabetes. However, their muscle and bone mass percentages were lower. In contrast, no significant differences were found between middle-aged women with and without T2DM. Among older women, those with T2DM had significantly higher BMI (p = 0.030) and VF (p = 0.007). For men, body composition differences were mostly non-significant across age groups, except for lower muscle mass percentage in young men with T2DM (p = 0.013).
Conclusion: Sex- and age-specific differences in body composition exist between adults with and without T2DM. These findings highlight the importance of tailored strategies in T2DM prevention and management. Future research should examine underlying mechanisms and evaluate the impact of targeted interventions.
Introduction
Type 2 diabetes mellitus (T2DM) is a chronic metabolic disorder closely linked to obesity, a major public health concern and a primary contributor to the disease (1, 2). The global prevalence of both obesity and T2DM has been rising at an alarming rate (3). This interrelationship is often referred to as “diabesity,” highlighting the complex and bidirectional nature of the two conditions (4–6). A key factor driving this association is body composition, particularly the accumulation of visceral fat (VF), which is strongly associated with insulin resistance and the pathogenesis of T2DM (7, 8).
Obesity is often assessed using metrics like body mass index (BMI) and waist circumference (WC). While useful, these metrics are limited in their ability to differentiate between fat mass and lean mass, which may obscure important metabolic differences in individuals with T2DM (9). As a result, more advanced methods such as body composition analysis are used to provide a clearer distinction between fat and lean tissue distribution (10).
Among body composition assessment tools, dual-energy X-ray absorptiometry (DXA) is often considered one of the most comprehensive imaging techniques among non-invasive methods (9). However, its high cost and limited accessibility make it less feasible for routine use in large-scale studies or clinical practice. Bioelectrical impedance analysis (BIA), by contrast, offers a cost-effective, non-invasive, and widely available alternative for assessing key body composition indicators such as total body fat, VF, muscle mass, and bone mass (10, 11). BIA has proven especially valuable in population screening and large-scale epidemiological studies due to its simplicity and speed (12).
Despite the close association between body composition and T2DM, few studies have investigated body composition patterns among individuals with T2DM, particularly in in Middle Eastern populations (13–15). Moreover, the influence of sex and age on these patterns remains underexplored, leaving a gap in understanding body composition differences in T2DM (16–18). Therefore, this study aims to investigate body composition differences among adults with and without T2DM in Medina, Saudi Arabia, using BIA, while stratifying by sex and age group. Understanding variations in body fat and lean mass may help tailor lifestyle or pharmacologic interventions according to patient demographics, ultimately improving diabetes prevention and management strategies.
Methods
This cross-sectional study included 630 adults recruited from Taibah University, four primary care centers, and the Diabetes Center in Medina, Saudi Arabia. Participants were recruited through announcements and direct invitations at the participating centers. Non-T2DM individuals were recruited from the same centers, including staff members, patient companions, and those attending for routine health check-ups. While this method may introduce selection bias, particularly among non-T2DM individuals, efforts were made to include participants of diverse ages and both genders to enhance sample variety. The study was conducted between July and September 2023. Ethical approval was granted by the Research Ethics Committee of Taibah University, College of Medicine, Medina, Saudi Arabia (Approval Code: STU-22-002), and informed consent was obtained from all participants.
Eligible candidates were Saudi individuals, aged 18 and older, with or without T2DM and willingness to participate. Exclusion criteria included individuals with type 1 diabetes, pregnancy, severe comorbidities, including cancer, acute illness, and chronic liver, kidney, or heart disease. Individuals on steroid medications, dietary supplements, or those engaged in athletic or physically demanding occupations were excluded from the study.
To screen for undiagnosed T2DM among non-T2DM participants, capillary blood glucose measurements were obtained from fasting or random finger-prick samples. While laboratory-based venous plasma glucose testing is the gold standard for definitive diagnosis, capillary blood glucose testing offers a rapid and convenient method for initial screening, albeit with some limitations in accuracy. Participants meeting the American Diabetes Association’s (ADA) diagnostic criteria for diabetes (19), including fasting glucose levels ≥126 mg/dL or random plasma glucose levels ≥200 mg/dL, underwent confirmatory Hemoglobin A1c (HbA1c) testing. The HbA1c testing was performed using standard laboratory procedures, with a cut-off value of 6.5% to diagnose T2DM, in line with the ADA guidelines (19). Individuals with confirmed T2DM were excluded from the study.
Data collection involved recording demographic information (age, sex, and exercise frequency). For participants with T2DM, additional information was gathered on diabetes duration, hypoglycemic medication usage, and the most recent HbA1c levels, sourced from self-reports and medical records.
Body composition was assessed using the Eufy body composition analyzer (Model T9147, P1, the full-body Smart Scale, Anker Technology Ltd, Birmingham, United Kingdom) which estimates weight, BMI, fat mass, and muscle mass via BIA. Although validation studies for this specific model are limited, similar consumer-grade BIA devices have shown acceptable correlation with DXA in previous research (10). Body composition measurements were taken from participants at least two hours after the last food intake and exercise to minimize the effects on measurement accuracy. Participants wore light clothing and removed any metallic items to avoid interference with the measurements.
Participants were categorized into three age groups: young adults (18–40 years), middle-aged adults (41–60 years), and older adults (>60 years) These age groups were chosen to align with common demographic classifications and to capture potential age-related differences in body composition. Body composition data were analyzed to compare differences between individuals with and without T2DM, considering sex and age group.
Statistical analysis
The Statistical Package for the Social Sciences, version 26.0 (SPSS Inc., Chicago, IL) was used to analyze the data. Normality of continuous variables was assessed using the Kolmogorov–Smirnov test and visual inspection via histograms and Q-Q plots. Continuous data were presented as mean and standard deviation (SD), whereas categorical variables were represented as frequencies and percentages. Categorical variables were analyzed using the Chi-square test, and Fisher’s exact test was used to determine whether there was a significant association between body compositions and T2DM across age groups and sex. Independent t-tests were used to calculate differences in body composition between T2DM and non-T2DM by age group and sex. A P-value of less than 0.05 was considered statistically significant. No adjustments were made for multiple comparisons; therefore, results should be interpreted with caution due to the increased risk of Type I error.
Results
A total of 633 individuals were initially enrolled in the study. After screening, three individuals from the non-T2DM group were newly diagnosed with T2DM and excluded. The final sample comprised 630 participants: 42.4% with T2DM and 57.6% without T2DM. Of these, 257 (40.8%) were male and 373 (59.2%) were female. Table 1 presents the baseline demographic and clinical characteristics by T2DM status. The participants had a mean age of 48.5 ± 12.7 years, and 58.3% of participants fell into the middle-age group. Statistical analysis revealed no significant differences in mean age between individuals with and without T2DM within each age group (p values > 0.05). Also, there were no significant differences in exercise frequency between T2DM and non-T2DM groups (p = 0.19), as shown in Table 1.
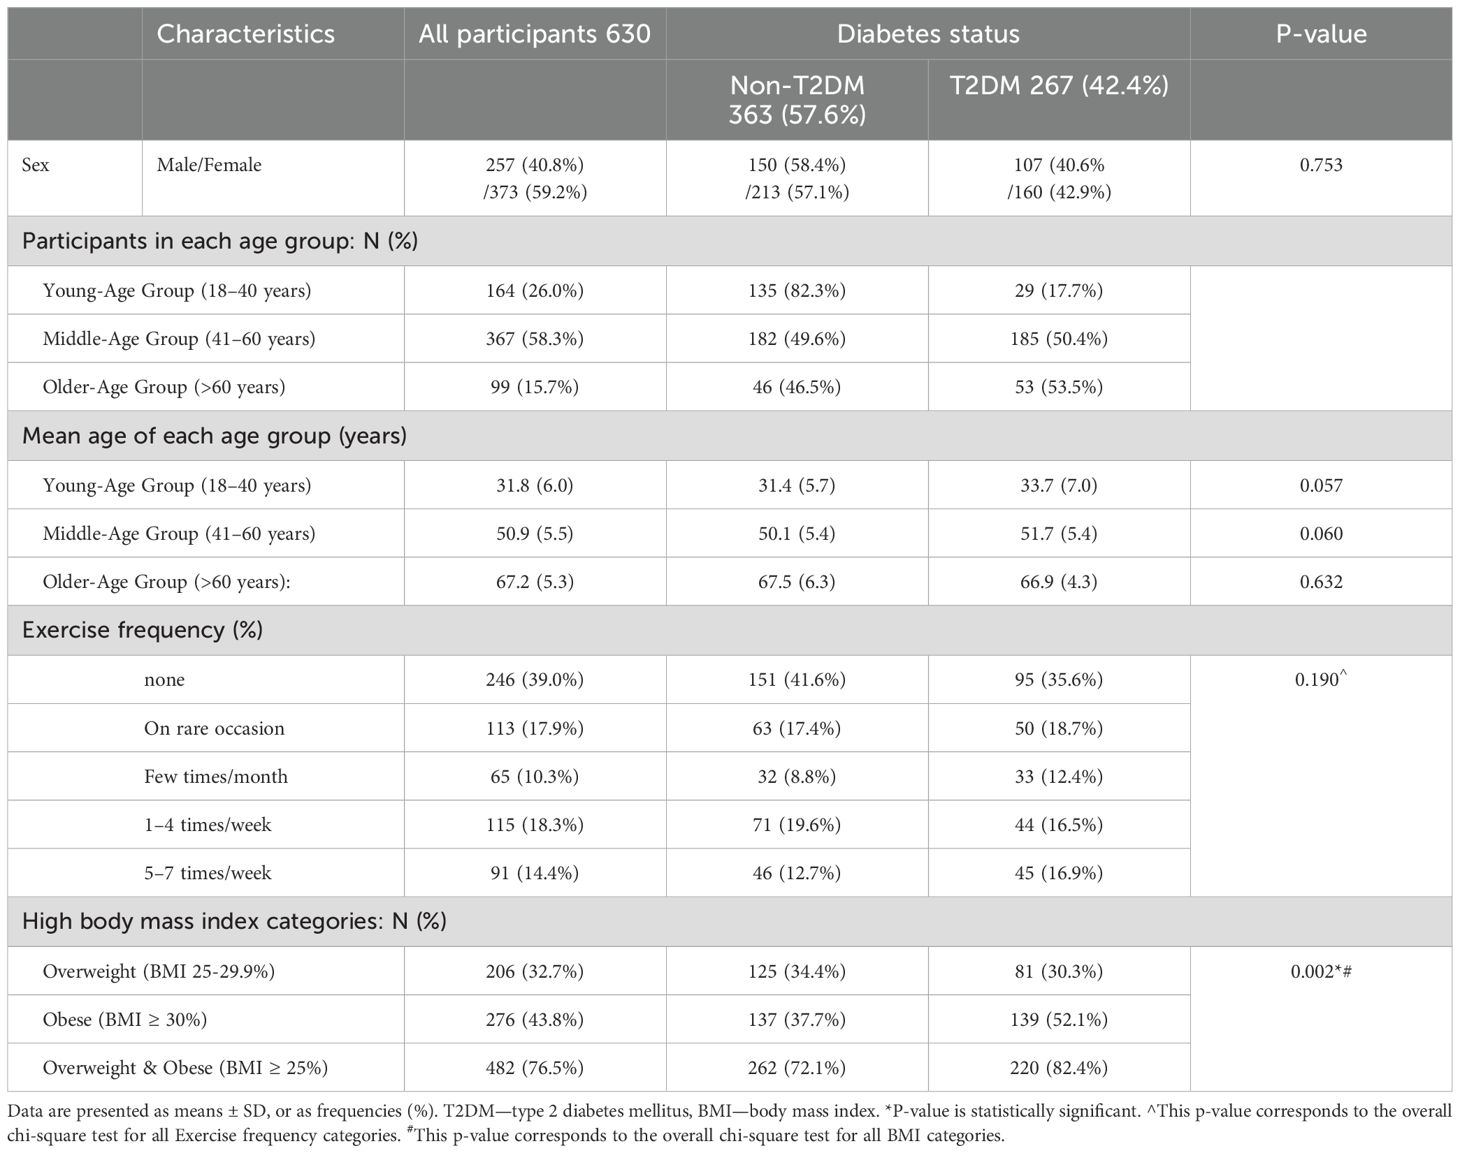
Table 1. Baseline demographic and clinical characteristics of participants by T2DM status.
Among T2DM group, the mean diabetes duration was 9.6 ± 7.8 years, and the mean HbA1c level was 8.1% ± 1.8. The frequency of treatment modalities among individuals with T2DM are provided in Figure 1.
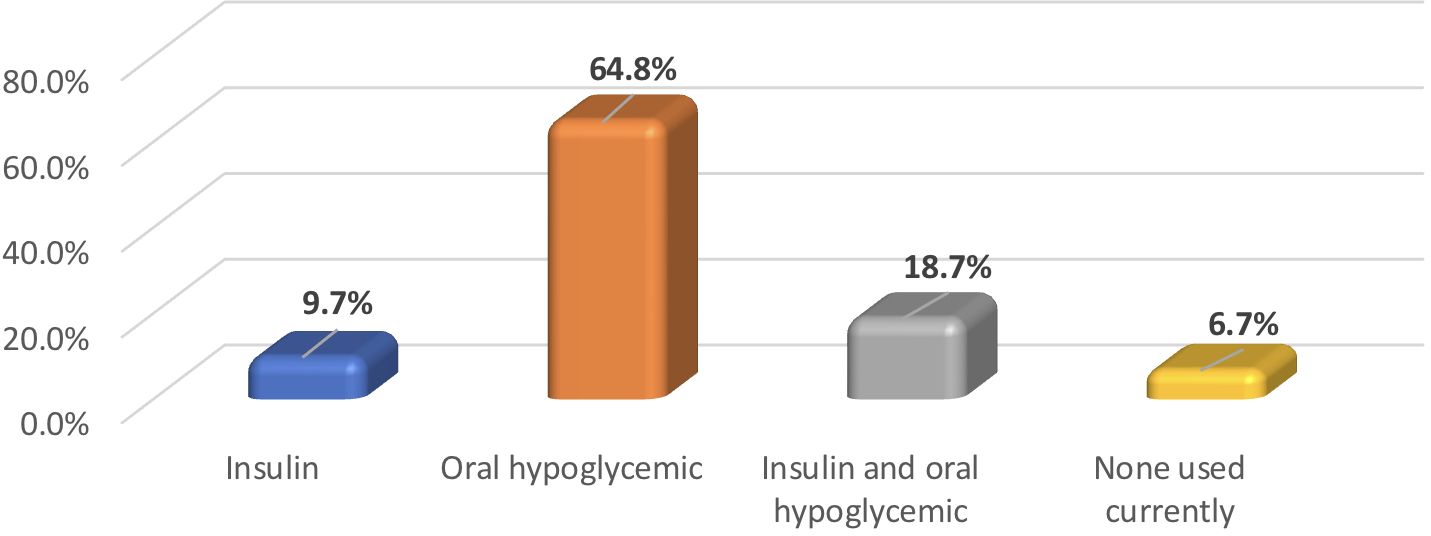
Figure 1. Frequency of hypoglycemia treatment modalities utilized by participants with T2DM (N = 267).
Overall, individuals with T2DM exhibited higher rates of obesity; mean BMI (29.6 ± 4.3 kg/m²) compared to non-T2DM individuals (27.8 ± 3.9 kg/m²); p < 0.001). Sex and age were pivotal factors associated with differences in body composition, as visually summarized in Table 2 which presents body composition parameters stratified by age group and sex.
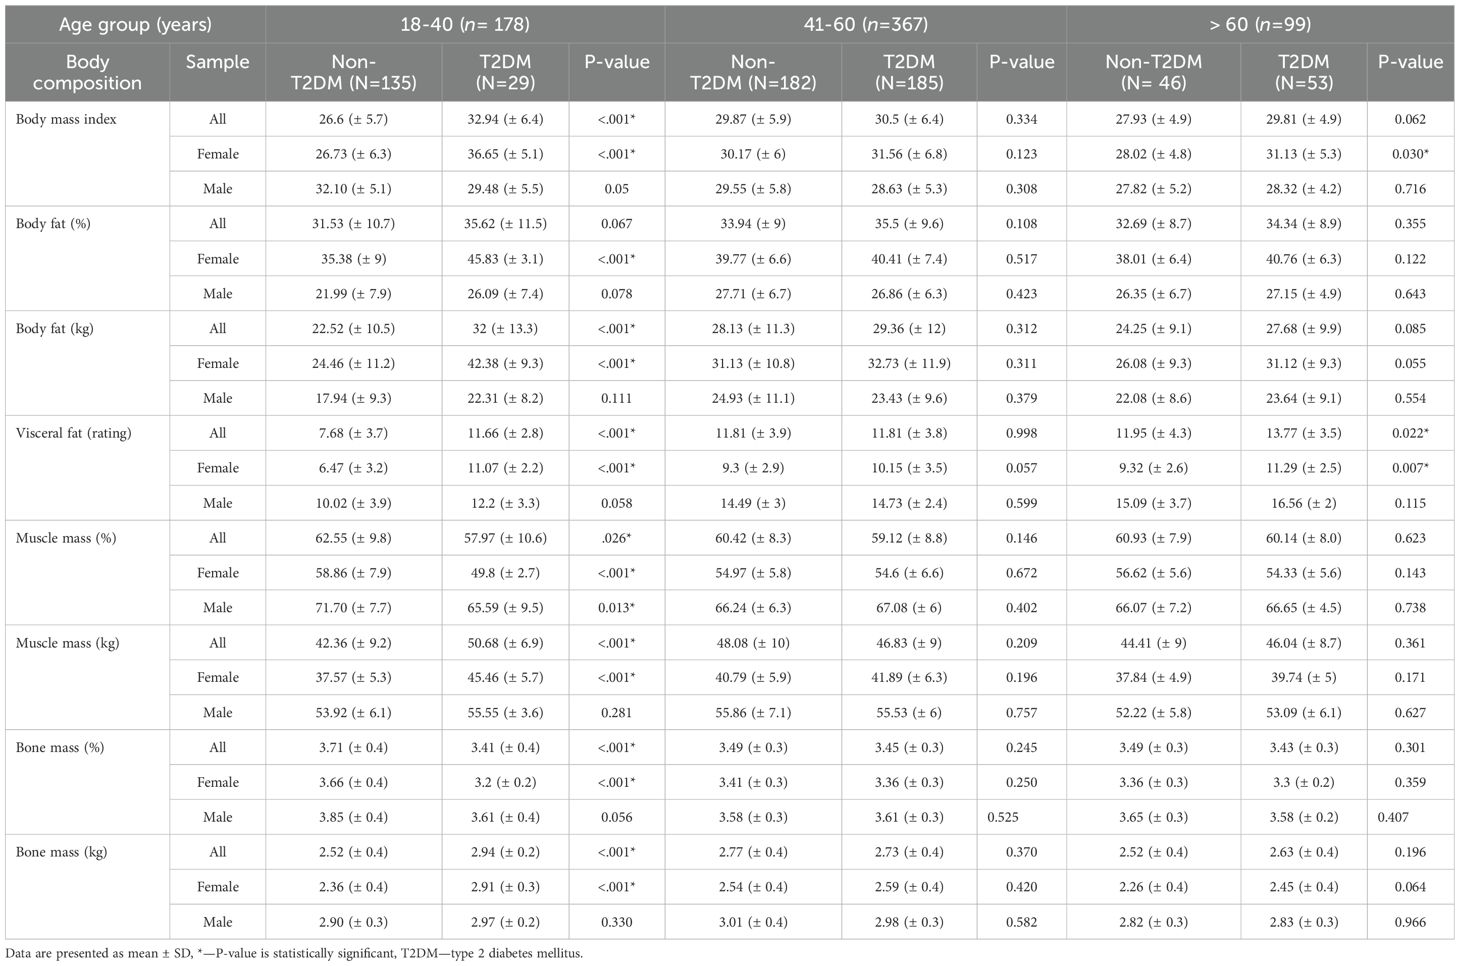
Table 2. Comparison of body composition between participants with or without T2DM stratified by age group and sex.
Young-Age Group (18–40 years): As illustrated in Table 2, participants with T2DM displayed elevated BMI, total body fat, VF, muscle mass, and bone mass compared to their non-T2DM counterparts; p-values <0.05. Conversely, they showed lower percentages of muscle and bone mass; p-value <0.05. Notably, this pattern persisted exclusively among young women when the data were analyzed by sex and age. In contrast, the young adult male group, non-T2DM individuals had a higher BMI compared to those with T2DM (32.10 vs. 29.48 kg/m²), with borderline significance (p = 0.05). Despite this, they exhibited a significantly higher muscle mass percentage (71.70 vs. 65.59) (p = 0.013), indicating a more favorable body composition despite the higher BMI.
Middle-Age Group (41–60 years): No significant differences in body composition were observed between individuals with and without T2DM in either sex (p-values > 0.05), refer to Table 2.
Older-Age Group (>60 years): Similarly, most body composition parameters did not differ significantly between individuals with and without T2DM. However, older women with T2DM had significantly higher BMI (p = 0.030) and visceral fat (p = 0.007) compared to their non-T2DM counterparts, as shown in Table 2.
Discussion
This study highlights significant sex- and age-specific variations in body composition among individuals with T2DM. Our primary findings revealed that body composition differs notably by T2DM status in young women, with differences also seen in older women but to a lesser extent. These age-related differences did not manifest in middle-aged women or men in most age groups, except for a reduced muscle mass in young men with T2DM.
Previous studies have shown that individuals with T2DM tend to have higher body fat, particularly VF, compared to non-T2DM counterparts (15–18, 20, 21). Elevated VF is strongly associated with insulin resistance, a key factor in the development of T2DM, as it releases pro-inflammatory cytokines that disrupt insulin signaling and exacerbate metabolic dysfunctions (22–24). Our study, likewise, demonstrated a higher prevalence of obesity among individuals with T2DM but stands out by specifically examining the influence of sex and age on body composition, offering insights that previous studies have not fully explored (15–18, 20, 21).
Our findings indicate that hormonal and metabolic changes related to sex and age differentially may affect fat distribution and insulin sensitivity (24–26). Hormonal factors significantly influence body composition by affecting fat distribution and muscle mass. Estrogen tends to promote fat storage in women, while testosterone supports muscle growth in men (26). Consequently, women generally exhibit higher levels of body fat than men do, whereas men have greater muscle mass compared to women (26). Given this natural discrepancy, any additional fat accumulation in women tends to be more noticeable and may have unfavorable effects, potentially increasing the risk of developing T2DM. Conversely, the higher muscle mass typically observed in men may counterbalance some of the adverse effects of excess body fat, potentially attenuating differences in body composition between men with and without T2DM (23). Our study supports this concept, showing that lower muscle mass in young men may increase their susceptibility to T2DM, even if their body fat does not rise (27). This correlation might stem from skeletal muscles being a primary target of insulin action and representing a major site for insulin-mediated glucose uptake in the body (28). Interventions aimed at reducing VF and preserving muscle mass—such as resistance training and dietary modifications—are well-established strategies for preventing and managing T2DM. These interventions enhance insulin sensitivity, improve glucose metabolism, and help maintain a healthier body composition (29).
In our study, young women with T2DM exhibited higher absolute values for BMI, fat mass, muscle mass, and bone mass compared to non-T2DM controls, yet showed lower relative proportions of muscle and bone mass. While obesity increases all components of body composition due to greater mechanical loading and overall body size, individuals with T2DM—particularly when obesity is present—often experience a disproportionate increase in fat mass relative to muscle and bone. This altered composition may reflect a bidirectional relationship: excess adiposity contributes to insulin resistance and increases the risk of T2DM, while established T2DM may impair muscle growth and compromise bone quality through chronic hyperglycemia, insulin resistance, and inflammation (30, 31). Previous studies have shown that T2DM negatively affects bone metabolism, often reducing bone quality despite normal or elevated BMD (30, 31). The observation of this pattern in young women may relate to sex-specific differences in body composition and disease onset, as women typically have higher fat mass than men, and early-life obesity increases the risk of developing T2DM, especially in females, who tend to have higher body fat than males (24). These findings emphasize the importance of evaluating both absolute and relative body composition in metabolic risk assessment and highlight the need for further research to clarify these associations.
In the current study, older women with T2DM exhibited higher BMI and VF levels compared to non-T2DM women. The interplay between aging and menopausal hormonal shifts may act synergistically to exacerbate adverse changes in fat and muscle distribution. Both aging and menopause are characterized by an increase in fat mass and a decrease in muscle mass. These physiological changes not only contribute to increased adiposity but also reduce insulin sensitivity, thereby elevating the risk of developing T2DM (25, 32). Estrogen exerts direct protective effects on pancreatic β-cells and estrogen deficiency after menopause increases the risk of diabetes (24, 26). All women in the older group were postmenopausal, which likely contributed to the observed differences in adiposity between women with and without T2DM.
The absence of significant differences in body composition between middle-aged women with and without T2DM, in contrast to the younger and older groups, is intriguing and warrants further investigations. One possible explanation may be the relative stability in lifestyle habits—such as diet, physical activity, and healthcare engagement—that often characterizes this life stage, potentially buffering against more pronounced metabolic changes. Also, the 41–60 age range corresponds to the menopausal transition, during which some women may still be premenopausal or perimenopausal, while others may be postmenopausal, leading to heterogeneity in hormonal status that may obscure group-level differences. This variability in menopausal timing and progression could mask potential associations between T2DM and body composition in this cohort. Furthermore, it is possible that metabolic changes associated with T2DM in this group are more subtle or occur at a slower pace, becoming more apparent only in later life. As our study did not specifically assess menopausal status, hormone levels, or detailed lifestyle factors, future research should incorporate these variables to better understand the nuanced interplay between hormonal transitions, lifestyle, and body composition in middle-aged women with T2DM.
This study has several limitations. First, its cross-sectional design limits the ability to draw causal inferences. The relatively small sample size of young adults with T2DM is another limitation that may affect the generalizability of our findings. However, the presence of significant differences in this smaller subgroup suggests that obesity and elevated visceral fat accumulation among young women contributes to earlier T2DM onset. This pattern may reflect regional factors such as dietary shifts, sedentary lifestyles, and a genetic predisposition to central adiposity and insulin resistance in Saudi Arabian populations. While caution is needed when generalizing to other part of the world, the underlying mechanisms are likely relevant across populations and warrant further research in larger, more diverse cohorts. Furthermore, while we assessed exercise frequency, we did not use standardized frameworks of exercise, which may affect the comparability of our findings with other studies. Additionally, there is potential for recall bias in physical activity assessment, which may further limit the accuracy of this measure. Other factors, such as hormonal status, lifestyle habits (including dietary patterns), and genetic predispositions, were not examined, yet they could play significant roles in shaping body composition in individuals with T2DM. Future studies should incorporate longitudinal designs, standardized assessments of physical activity and dietary intake, and hormonal profiling to better understand the interplay between sex, age, and T2DM on body composition. It would also be valuable to stratify future analyses by menopausal status in women and testosterone levels in men to clarify hormonal contributions to observed trends.
In conclusion, this study contributes to the existing body of knowledge on the higher prevalence of obesity among individuals with T2DM, but stands out by demonstrating significant sex- and age-specific differences. These findings emphasize the need for tailored preventive and therapeutic strategies—for example, targeting adiposity in both young and older women, particularly those with elevated VF, and emphasizing muscle mass strengthening in young men and preservation in older men. Incorporating both age and sex into the design of interventions may lead to more effective and personalized approaches to the prevention and management of T2DM.
Data availability statement
The original contributions presented in the study are included in the article. Further inquiries can be directed to the corresponding author.
Ethics statement
Scientific research ethics committee decision from Taibah university. The studies were conducted in accordance with the local legislation and institutional requirements. The participants provided their written informed consent to participate in this study.
Author contributions
EA: Formal analysis, Resources, Supervision, Writing – original draft, Writing – review & editing. ID: Data curation, Formal analysis, Investigation, Methodology, Resources, Writing – original draft, Writing – review & editing. MA: Conceptualization, Data curation, Funding acquisition, Investigation, Project administration, Resources, Writing – original draft, Writing – review & editing. SA: Conceptualization, Formal analysis, Investigation, Methodology, Software, Validation, Visualization, Writing – original draft, Writing – review & editing. AJ: Conceptualization, Data curation, Methodology, Project administration, Resources, Validation, Writing – original draft, Writing – review & editing. GA: Data curation, Funding acquisition, Investigation, Methodology, Resources, Software, Validation, Writing – original draft, Writing – review & editing. SM: Conceptualization, Data curation, Formal analysis, Investigation, Resources, Validation, Visualization, Writing – original draft, Writing – review & editing.
Funding
The author(s) declare that no financial support was received for the research and/or publication of this article.
Conflict of interest
The authors declare that the research was conducted in the absence of any commercial or financial relationships that could be construed as a potential conflict of interest.
Publisher’s note
All claims expressed in this article are solely those of the authors and do not necessarily represent those of their affiliated organizations, or those of the publisher, the editors and the reviewers. Any product that may be evaluated in this article, or claim that may be made by its manufacturer, is not guaranteed or endorsed by the publisher.
References
1. Chandrasekaran P and Weiskirchen R. The role of obesity in type 2 diabetes mellitus—An overview. Int J Mol Sci. (2024) 25:1882.
2. Klein S, Gastaldelli A, Yki-Järvinen H, and Scherer PE. Why does obesity cause diabetes? Cell Metab. (2022) 34:11–20.
3. Ampofo AG and Boateng EB. Beyond 2020: Modelling obesity and diabetes prevalence. Diabetes Res Clin Practice. (2020) 167:108362.
5. Ruze R, Liu T, Zou X, Song J, Chen Y, Xu R, et al. Obesity and type 2 diabetes mellitus: connections in epidemiology, pathogenesis, and treatments. Front Endocrinol (Lausanne). (2023) 14:1–23.
6. Aleidi SM, Dahabiyeh LA, Gu X, Al Dubayee M, Alshahrani A, Benabdelkamel H, et al. Obesity connected metabolic changes in type 2 diabetic patients treated with metformin. Front Pharmacol. (2021) 11:1–14.
7. Dhokte S and Czaja K. Visceral adipose tissue: the hidden culprit for type 2 diabetes. Nutrients. (2024) 16:1015.
8. Borst S, Conover C, and Bagby G. Association of resistin with visceral fat and muscle insulin resistance. Cytokine. (2005) 32:39–44.
9. Messina C, Albano D, Gitto S, Tofanelli L, Bazzocchi A, Ulivieri FM, et al. Body composition with dual energy X-ray absorptiometry: from basics to new tools. Quantitative Imaging Med Surgery. (2020) 10:1687–98.
10. Ward LC. Bioelectrical impedance analysis for body composition assessment: reflections on accuracy, clinical utility, and standardization. Eur J Clin Nutrition. (2018) 73:194–9.
11. Dehghan M and Merchant AT. Is bioelectrical impedance accurate for use in large epidemiological studies? Nutr J. (2008) 7:1–7.
12. Khalil SF, Mohktar MS, and Ibrahim F. The theory and fundamentals of bioimpedance analysis in clinical status monitoring and diagnosis of diseases. Sensors (Switzerland). (2014) 14:10895–928.
13. Chen Y, He D, Yang T, Zhou H, Xiang S, Shen L, et al. Relationship between body composition indicators and risk of type 2 diabetes mellitus in Chinese adults. BMC Public Health. (2020) 20:1–6.
14. Lin CL, Yu NC, Wu HC, Lee YY, Lin WC, Chiu IY, et al. Association of body composition with type 2 diabetes: A retrospective chart review study. Int J Environ Res Public Health. (2021) 18(9):4421.
15. Owolabi L, Adebisi S, Danborno B, and Buraimoh A. Comparative evaluation of body composition analysis in type-2 diabetes mellitus patients and healthy Nigerians using bioelectric impedance analysis technique. Niger J Basic Clin Sci. (2016) 13:13.
16. Jahanlou AS and Jahanlou P. Comparison of muscle mass, total body water and total body protein in type II diabetics with healthy matched adults by bioelectrical impedance analysis. J Nutr Food Secur. (2021) 6:383–9.
17. Darokar AG, Phatak MS, Thobani BA, and Patel AK. Assessment of body composition by bioelectrical impedance analysis in type 2 diabetes mellitus women of central India. Int J Life-Sciences Sci Res. (2016) 2:457–61.
18. Solanki JD, Makwana AH, Mehta HB, Gokhale PA, and Shah CJ. Body composition in type 2 diabetes: Change in quality and not just quantity that matters. Int J Prev Med. (2015) 6:122.
19. ElSayed NA, Aleppo G, Aroda VR, Bannuru RR, Brown FM, Bruemmer D, et al. Classification and diagnosis of diabetes: standards of care in diabetes—2023. Diabetes Care. (2022) 46:S19–40.
20. Buyinza R, Nsamba J, Muyingo A, Matovu N, Nabirye G, Kantengwa A, et al. Body composition of type 2 diabetes patients in Uganda: A case-control study. J Public Health Afr. (2023) 14(1):2249.
21. Abulmeaty MMA, Aljuraiban GS, Alaidarous TA, and Alkahtani NM. Body composition and the components of metabolic syndrome in type 2 diabetes: The roles of disease duration and glycemic control. Diabetes Metab Syndr Obes. (2020) 13:1051–9.
22. Gallagher D, Kelley DE, Yim JE, Spence N, Albu J, Boxt L, et al. Adipose tissue distribution is different in type 2 diabetes. Am J Clin Nutrition. (2009) 89:807–14.
23. Müller MJ, Lagerpusch M, Enderle J, Schautz B, Heller M, and Bosy-Westphal A. Beyond the body mass index: tracking body composition in the pathogenesis of obesity and the metabolic syndrome. Obesity Rev. (2012) 13:6–13.
24. Cornier MA, Després JP, Davis N, Grossniklaus DA, Klein S, Lamarche B, et al. Assessing adiposity. Circulation. (2011) 124:1996–2019.
25. Al-Sofiani ME, Ganji SS, and Kalyani RR. Body composition changes in diabetes and aging. J Diabetes Complications. (2019) 33:451–9.
26. Frank AP, De Souza Santos R, Palmer BF, and Clegg DJ. Determinants of body fat distribution in humans may provide insight about obesity-related health risks. J Lipid Res. (2018) 60:1710–9.
27. Park JH, Lee MY, Shin HK, Yoon KJ, Lee J, and Park JH. Lower skeletal muscle mass is associated with diabetes and insulin resistance: A cross-sectional study. Diabetes Metab Res Rev. (2023) 39:e3681. doi: 10.1002/dmrr.3681
28. Merz KE and Thurmond DC. Role of skeletal muscle in insulin resistance and glucose uptake. Compr Physiol. (2020) 10:785–809. doi: 10.1002/cphy.c190029
29. Khalafi M, Maleki AH, Sakhaei MH, Rosenkranz SK, Pourvaghar MJ, Ehsanifar M, et al. The effects of exercise training on body composition in postmenopausal women: a systematic review and meta-analysis. Front Endocrinol. (2023) 14.
30. Sanches CP, Vianna AGD, and Barreto FD. The impact of type 2 diabetes on bone metabolism. Diabetol Metab Syndr. (2017) 9:85. doi: 10.1186/s13098-017-0278-1
31. Shahen VA, Gerbaix M, Koeppenkastrop S, Lim SF, McFarlane KE, Nguyen ANL, et al. Multifactorial effects of hyperglycemia, hyperinsulinemia and inflammation on bone remodeling in type 2 diabetes mellitus. Cytokine Growth Factor Rev. (2020) 55:109–18. doi: 10.1016/j.cytogfr.2020.04.001
Keywords: type 2 diabetes mellitus, body composition, bioelectrical impedance analysis, obesity, body fat, visceral fat
Citation: Alfadhli E, Darandari I, Altaweel M, Alharbi S, Jadw A, Aljohani G and Mohammad S (2025) Body composition patterns among type 2 diabetes mellitus patients versus nondiabetic adults in Saudi Arabia. Front. Endocrinol. 16:1494452. doi: 10.3389/fendo.2025.1494452
Received: 10 September 2024; Accepted: 26 May 2025;
Published: 18 June 2025.
Edited by:
Åke Sjöholm, Gävle Hospital, SwedenReviewed by:
Jorge Felipe Argenta Model, Federal University of Rio Grande do Sul, BrazilEmad Issak, Ain Shams University, Egypt
Copyright © 2025 Alfadhli, Darandari, Altaweel, Alharbi, Jadw, Aljohani and Mohammad. This is an open-access article distributed under the terms of the Creative Commons Attribution License (CC BY). The use, distribution or reproduction in other forums is permitted, provided the original author(s) and the copyright owner(s) are credited and that the original publication in this journal is cited, in accordance with accepted academic practice. No use, distribution or reproduction is permitted which does not comply with these terms.
*Correspondence: Eman Alfadhli, ZW1mYWRobGlAdGFpYmFodS5lZHUuc2E=