 Tobias Stemann Lau1,2,3*
 Lars Bossen1,2Daniel Guldager Kring Rasmussen4
 Federica Genovese4
 Morten Karsdal4
 Anne Kirstine Arveschoug2,5Henning Grønbæk1,2,3
 Gitte Dam1,2,3
- 1Department of Hepatology and Gastroenterology, Aarhus University Hospital, Aarhus, Denmark
- 2European Neuroendocrine Tumor Society (ENETS) Center of Excellence, Aarhus University Hospital, Aarhus, Denmark
- 3Department of Clinical Medicine, Aarhus University, Aarhus, Denmark
- 4Nordic Bioscience A/S, Herlev, Denmark
- 5Department of Nuclear Medicine and PET-Centre, Aarhus University, Aarhus, Denmark
Introduction: Decline in kidney function due to renal fibrosis is a potential side effect in patients with neuroendocrine neoplasm (NEN) undergoing Peptide Receptor Radionuclide Therapy (PRRT). We aimed to investigate the potential of circulating fibrosis markers reflecting formation and degradation of collagens in predicting decline in kidney function in NEN-patients undergoing PRRT.
Material and methods: We included NEN-patients referred for PRRT treatment. We measured two biomarkers of type III and VI collagen formation, reflecting fibrogenesis (PRO-C3 and PRO-C6), and a degradation biomarker of type III collagen, reflecting fibrolysis (C3M) in serum and urine before initiation of PRRT and after each treatment. A kidney function test was performed before initiation of PRRT and three months after end of treatment (EOT) and when possible 6, 12, 18, and 24 months after EOT. We performed a linear mixed model to evaluate differences in the levels of fibrosis markers between patients who declined in kidney function vs patients who did not.
Results: Fourteen patients (57% men and median age 67 years (IQR: 61-75)), completed PRRT treatment with at least one kidney function test following EOT. Median time from EOT to last kidney function test was 12 months (IQR: 12-21). Six patients (43%) experienced a more than 25% decline in kidney function from baseline to last kidney function test. For urinary (u) C3M, the overall linear mixed model was marginally significant (p = 0.078). Specifically, after the first treatment (74 ng/mg (95% CI: 49-113) vs 135 ng/mg (95% CI: 93-194)) and three months after EOT (56 ng/mg (95% CI: 37-86) vs 118 (95% CI: 81-173)), levels of uC3M were significantly lower in patients who subsequently had decline in kidney function.
Conclusion: At specific time points, levels of uC3M significantly differed in patients who subsequently declined in kidney function. From these exploratory results, we believe that uC3M holds the potential as a prognostic biomarker, and we suggest that this should be further investigated in larger studies to draw firm conclusions about the usefulness.
1 Introduction
Neuroendocrine neoplasms (NENs) are tumors arising from neuroendocrine cells distributed throughout the body, most often in the gastroenteropancreatic system or the lungs. Depending on the production of hormones and other vasoactive substances, patients present with different symptoms and complications. The prognosis differs significantly depending on differentiation and grade (1, 2).
Fibrosis development is a common complication to NENs and affects both morbidity and mortality (3) and occurs both locally adjacent to the tumor and at distant sites. Overall, fibrosis development is either tumor-dependent due to hormone production or treatment induced. Even though not fully understood, serotonin is thought to be the main driver of tumor-dependent fibrosis which encompasses mesenteric desmoplasia and carcinoid heart disease (4, 5).
Peptide receptor radionuclide therapy (PRRT) is a well-established treatment for patients with disseminated NENs and can lead to irreversible renal impairment and chronic kidney disease (CKD) due to treatment-induced fibrosis (6–9). In the presence of CKD, further treatment options are limited, and the mortality is increased. No available biomarkers can identify particularly vulnerable patients that are at increased risk of kidney impairment following PRRT treatment. Such biomarkers would be of great interest to tailor and personalize treatment and minimize the risk of future irreversible kidney damage in PRRT treated NEN patients.
CKD is characterized by renal (tubulo-interstitial) fibrosis formation with an imbalanced collagen turnover resulting in excessive collagen deposition in the extracellular matrix (10–14). This is the case regardless of the underlying etiology. During both formation and degradation of collagens, small measurable fragments are released into the circulation. These fragments are measurable when structural changes occur even before any functional manifestations occur. In fact, changes in fibrosis marker levels may happen before irreversible fibrosis is present and before any decline in the glomerular filtration rate has occurred (14) which underlines the huge potential for these markers in detecting fibrosis at very early stages.
In recent years, several markers reflecting formation and degradation of collagens have been investigated as both diagnostic, prognostic, and predictive markers in a wide range of diseases including different cancers and liver-, lung-, and kidney fibrosis. Two of the markers, the collagen type VI formation marker PRO-C6 and the collagen type III degradation marker C3M correlated to kidney function in cross-sectional studies (15–19). Interestingly, they also showed potential in predicting adverse renal outcomes in prospective studies in different cohorts of patients with kidney disease (17, 20–25). In patients with NENs, no prospective studies have investigated fibrosis markers as predictors of a decline in kidney function. In a previous cross-sectional study, we demonstrated an association between kidney function and serum PRO-C6, urine PRO-C6, and urine C3M in NEN-patients who had finished PRRT treatment (15). In the present study, we hypothesize that the fibrosis markers hold potential as prognostic markers. Therefore, we aimed to prospectively investigate the potential of these fibrosis markers in predicting decline in kidney function in NEN-patients undergoing PRRT.
2 Methods
2.1 Study design and patients
This study was an observational, prospective cohort study conducted at Aarhus University Hospital, Denmark at the Department of Hepatology and Gastroenterology, ENETS Center of Excellence in collaboration with Department of Nuclear Medicine and PET Centre.
Eligible patients were patients diagnosed with NEN (all primary localizations) prior to PRRT treatment. Exclusion criteria were age under 18 years and other cancers than NEN. Patients were recruited from the Department of Hepatology and Gastroenterology, ENETS Center of Excellence at Aarhus University Hospital, Denmark.
2.2 Procedures
2.2.1 PRRT
All included patients were treated with PRRT on a clinical indication and by standard protocols and renal protection protocols following international guidelines at the Department of Nuclear Medicine and PET Centre at Aarhus University Hospital from 2017 to 2019 (26, 27). Isotopes used were either 177Lu or 90Y. The interval between two PRRT treatments were between 8 and 14 weeks. Usually, a PRRT treatment cycle consists of four treatments.
2.2.2 Kidney function test
Before the first PRRT treatment, all patients had their baseline kidney function determined by either 51Cr-EDTA or 99mTc-DTPA plasma clearance at the Department of Nuclear Medicine and PET Centre at Aarhus University Hospital, Denmark. For all patients, a follow up kidney function test was performed three months after the last PRRT treatment, and if possible after 6 months, 12 months, 18 months, and 24 months. This was part of the standard clinical follow up after PRRT. The measured kidney function obtained by 51Cr-EDTA or 99mTc-DTPA plasma clearance is expressed as ‘Standard-GFR’.
2.2.3 Blood- and urine samples
Baseline blood- and urine samples for measurement of fibrosis markers were drawn before PRRT treatment (visit 1); either the day before or at the same day as the first PRRT. Follow up blood- and urine samples were drawn either the day before or at the same day as the following PRRT treatment. This was repeated before all PRRT treatments (visit 2, 3, and 4). Time between two PRRT treatments were between 8 and 14 weeks. The last follow up blood- and urine samples were drawn three months after the last PRRT treatment (visit 5).
2.3 Biochemical analysis
Three different fibrosis markers were measured in both serum and urine. A type III collagen formation biomarker (PRO-C3), a type VI collagen formation biomarker (PRO-C6), and a type III degradation biomarker (C3M). Measurements of the fibrosis markers were carried out as previously described (15). Urine measurements were normalized by urine creatinine and carried out as previously described (15).
2.4 Statistics
Patient baseline characteristics are presented as median and interquartile range (IQR) or number and percentage. Patients were divided into two groups according to development in their kidney function; those who experienced a 25% or more decline in kidney function during follow up (i.e., change from baseline test to the last follow up test available) (decline in kidney function), and those who did not (preserved kidney function). Comparisons between those two groups were performed using χ2 test or Fisher’s exact test for categorical variables and Mann-Whitney U test for continuous variables.
A linear mixed model with random intercept was used to estimate means of each of the fibrosis markers at all visits and to evaluate overall differences between the two groups for each biomarker. If the overall linear mixed model was statistically significant (or marginally significant) for a specific biomarker, we went on to evaluate differences of the estimated means both within groups and between the two groups using the linear mixed model. All analyses performed in the linear mixed model were performed on log-transformed data and were back-transformed when reported.
Finally, we evaluated the cross-sectional correlations between each of the fibrosis markers and the kidney function at baseline and three months after the last treatment. This was done using the Spearman’s correlation.
3 Results
3.1 Baseline characteristics
A total of 20 patients were referred for PRRT in the recruitment period and all accepted enrollment in the study. Six of these died during treatment before a follow up kidney function test was performed. Thus, 14 patients were included in the final analysis. Patients were divided into two groups; Those who experienced a 25% or more decrease in kidney function during the follow period compared to baseline (decline in kidney function), and those who did not (preserved kidney function) (Figure 1).
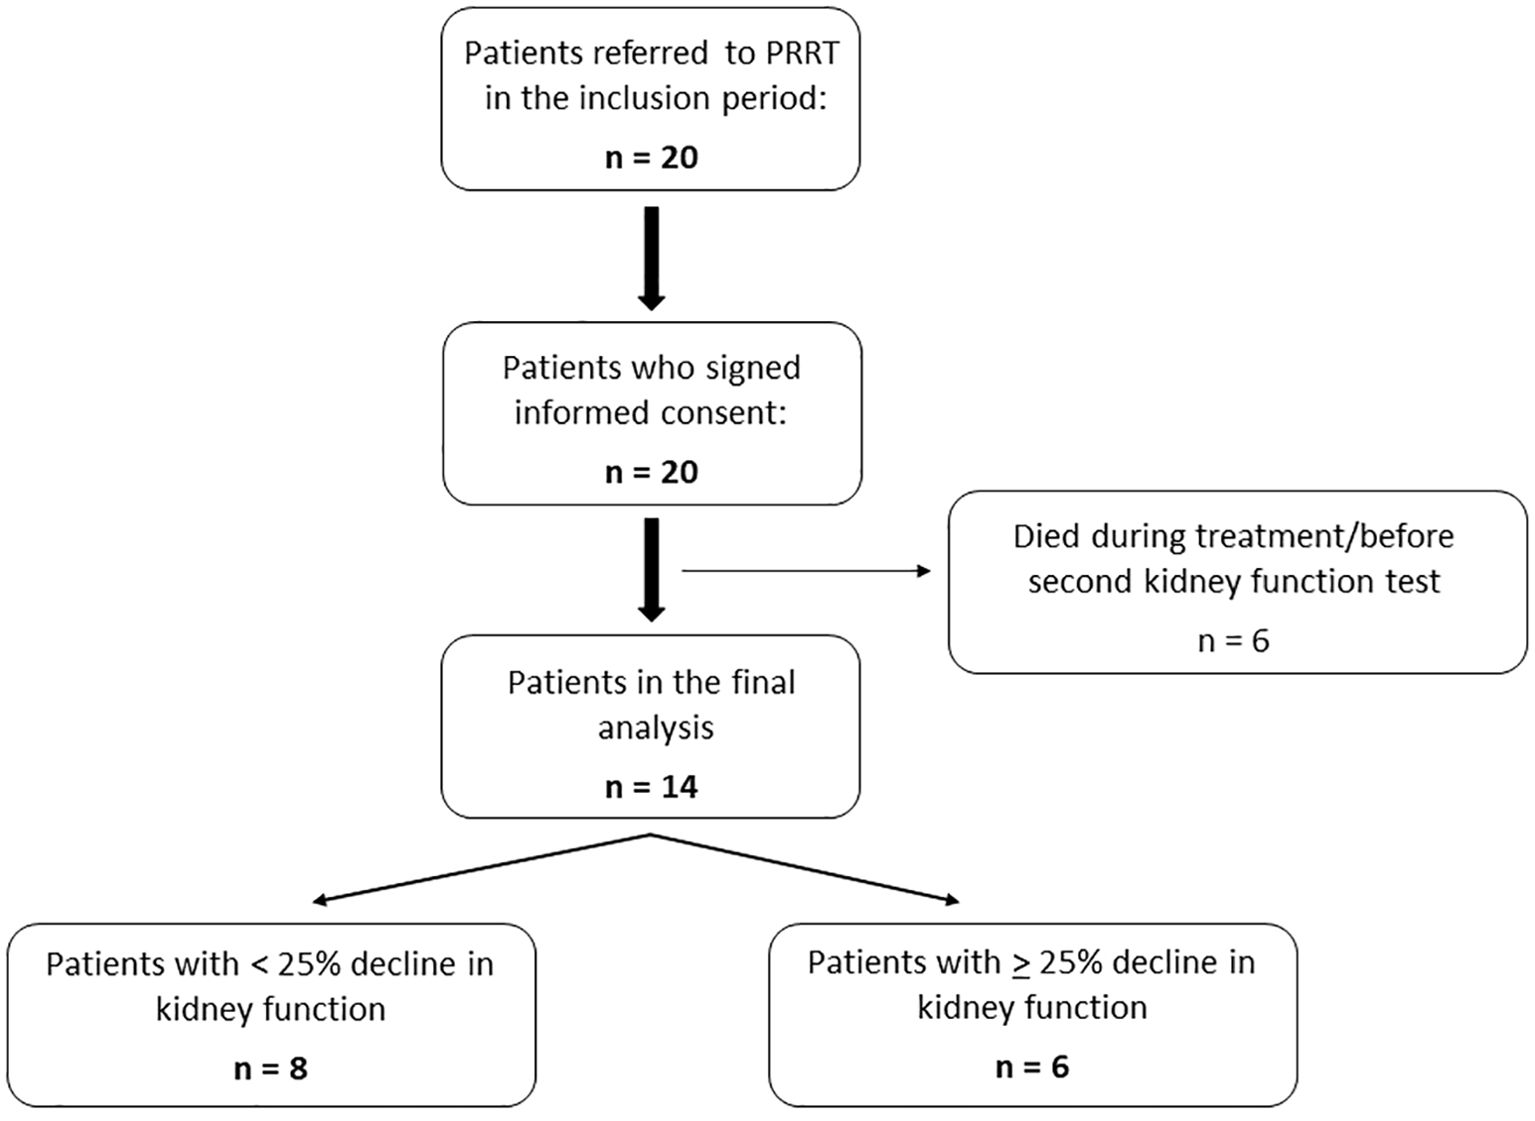
Figure 1. Flow chart of patients included.
Eight (57%) of the patients were men, and the median age was 67 years. Most common tumor localization was the small intestine (57%) followed by pancreas (36%) and lungs (7%). There were no major differences in baseline characteristics between the two groups (Table 1).
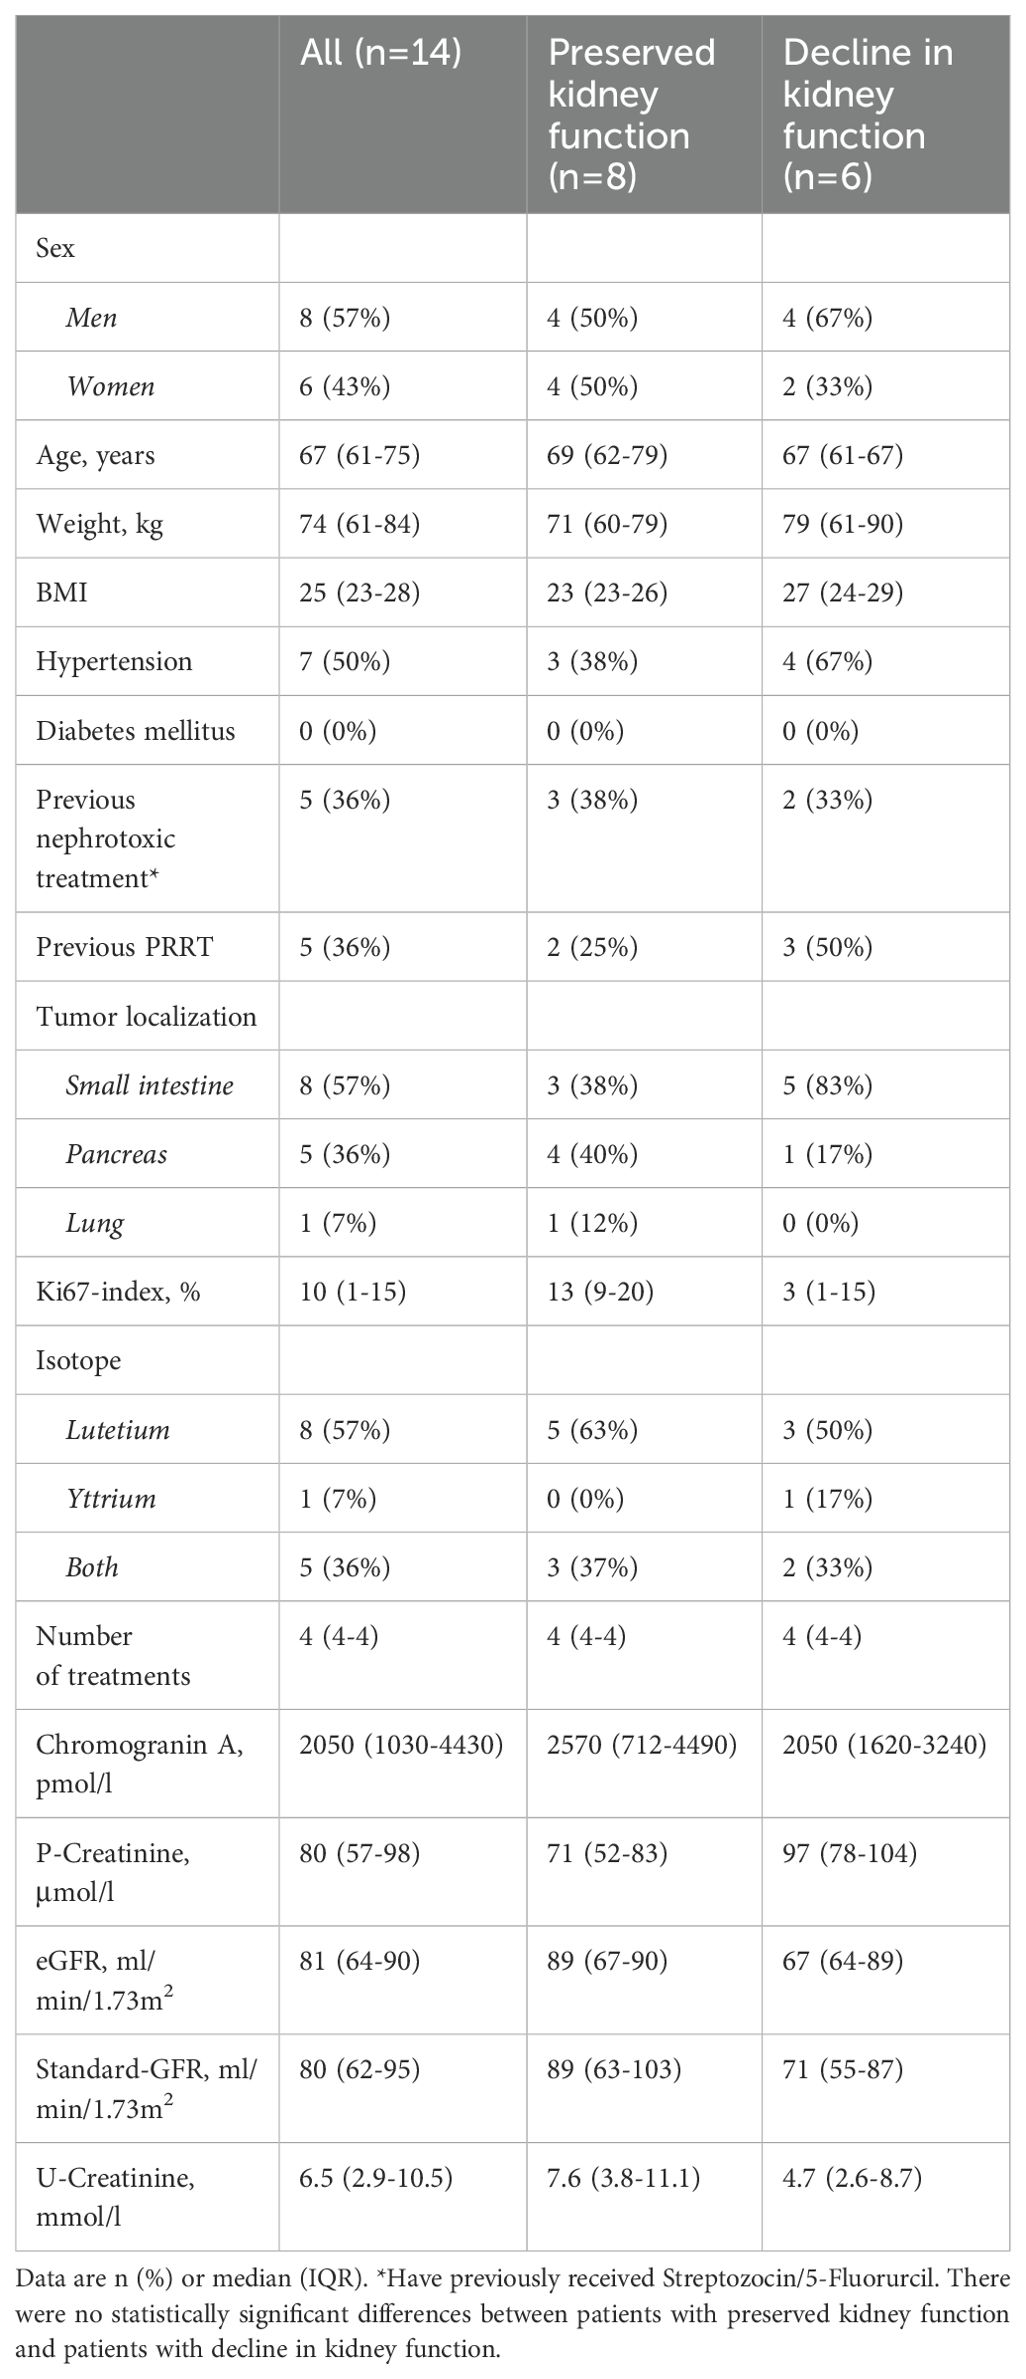
Table 1. Baseline characteristics.
3.2 Kidney function
Six patients (43%) developed a more than 25% decline in kidney function from their baseline kidney function test to the last kidney function test available. For this group of patients, the baseline median standard-GFR was 71 ml/min/1.73 m2 (IQR: 55-87) and the median standard-GFR at the last kidney function test was 44 ml/min/1.73 m2 (IQR: 33-50). Three months after EOT, the median standard-GFR was 54 ml/min/1.73 m2 (IQR: 50-75). For the group of patients with preserved kidney function, the baseline median was 89 ml/min/1.73 m2 (IQR: 63-103) and the end of follow-up median was 87 ml/min/1.73 m2 (IQR: 56-98). Three months after EOT the median standard-GFR was 85 ml/min/1.73 m2 (IQR: 61-91) (Table 2). The median follow-up time from end of PRRT treatment to last kidney function test was 12 months (IQR: 12-21) for all patients. For the group of patients with decline in kidney function, the follow-up time was 16.5 months (IQR: 12-23) and for the group with preserved kidney function, the follow-up time was 12 months (IQR: 9-16).
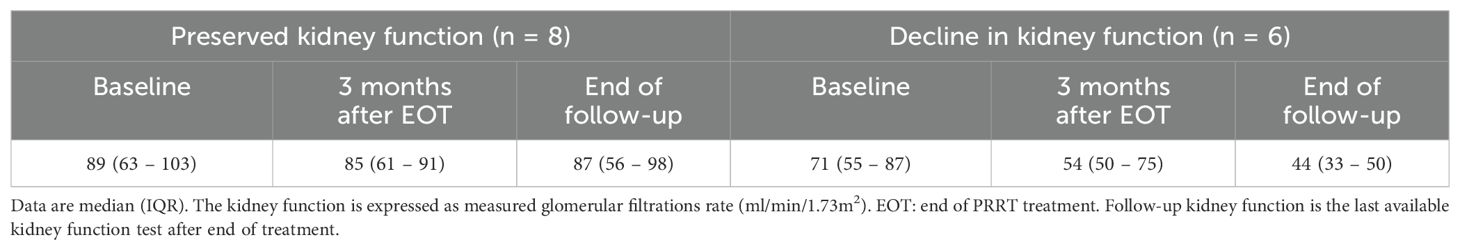
Table 2. Baseline and follow-up kidney function according to group.
The estimated glomerular filtration rates (eGFR) from each visit are shown in Supplementary Table 3.
The cumulative PRRT dose administered was 29.9 Giga becquerel (GBq) (21.7 – 29.6) (median (IQR)) for patients with preserved kidney function and 25.8 GBq (20.1 – 29.6) for patients who declined in kidney function.
3.3 Fibrosis markers
The linear mixed model was performed for all biomarkers to test for overall differences between the two groups. For uC3M, the overall model revealed marginally significance (p = 0.078), while for the rest of the biomarkers the overall linear mixed model was non-significant (sPRO-C3: p = 0.52, sPRO-C6: p = 0.14, sC3M: p = 0.77, uPRO-C3: p = 0.22, uPRO-C6: p = 0.56).
When further testing for differences in uC3M at specific time points, we observed significantly lower levels of uC3M after the first PRRT treatment (74 ng/mg (95% CI: 49-113) vs 135 ng/mg (95% CI: 93-194), p=0.04) and three months after EOT (56 ng/mg (95% CI: 37-86) vs 118 (95% CI: 81-173) p=0.01) in the group of patients who subsequently declined in kidney function (Figure 2; Supplementary Table 1).
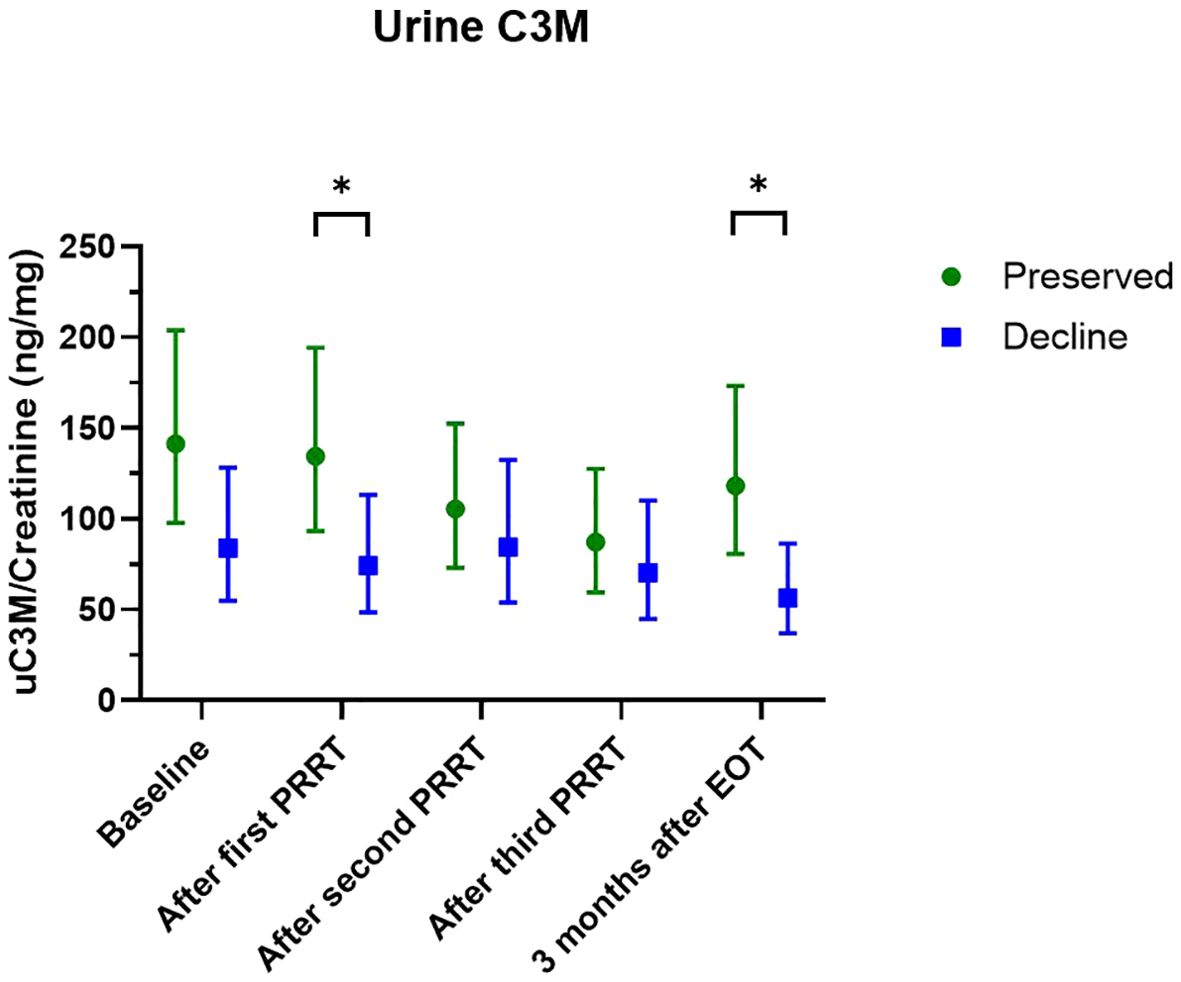
Figure 2. Levels of uC3M at each visit according to groups. Data are presented as estimated means and 95% confidence interval. Data are log-transformed and presented in this figure as back-transformed. Comparisons between groups are performed using linear mixed model. Green color: preserved kidney function-group, blue color: decline in kidney function-group. *P-value < 0.05.
Raw data of all the fibrosis markers are presented in Supplementary Table 2, Supplementary Figures 1, 2.
3.4 Correlation between fibrosis markers and kidney function
We observed a significant correlation between sPRO-C6 and kidney function three months after EOT (spearman’s rho: -0.60, p: 0.03) (Table 3). For the remaining fibrosis markers, no statistically significant correlations to kidney function were observed, however uPRO-C6 at three months after EOT (spearman’s rho: -0.45, p: 0.13), and uC3M at baseline (spearman’s rho: 0.44, p: 0.12) had moderate correlations (Table 3).
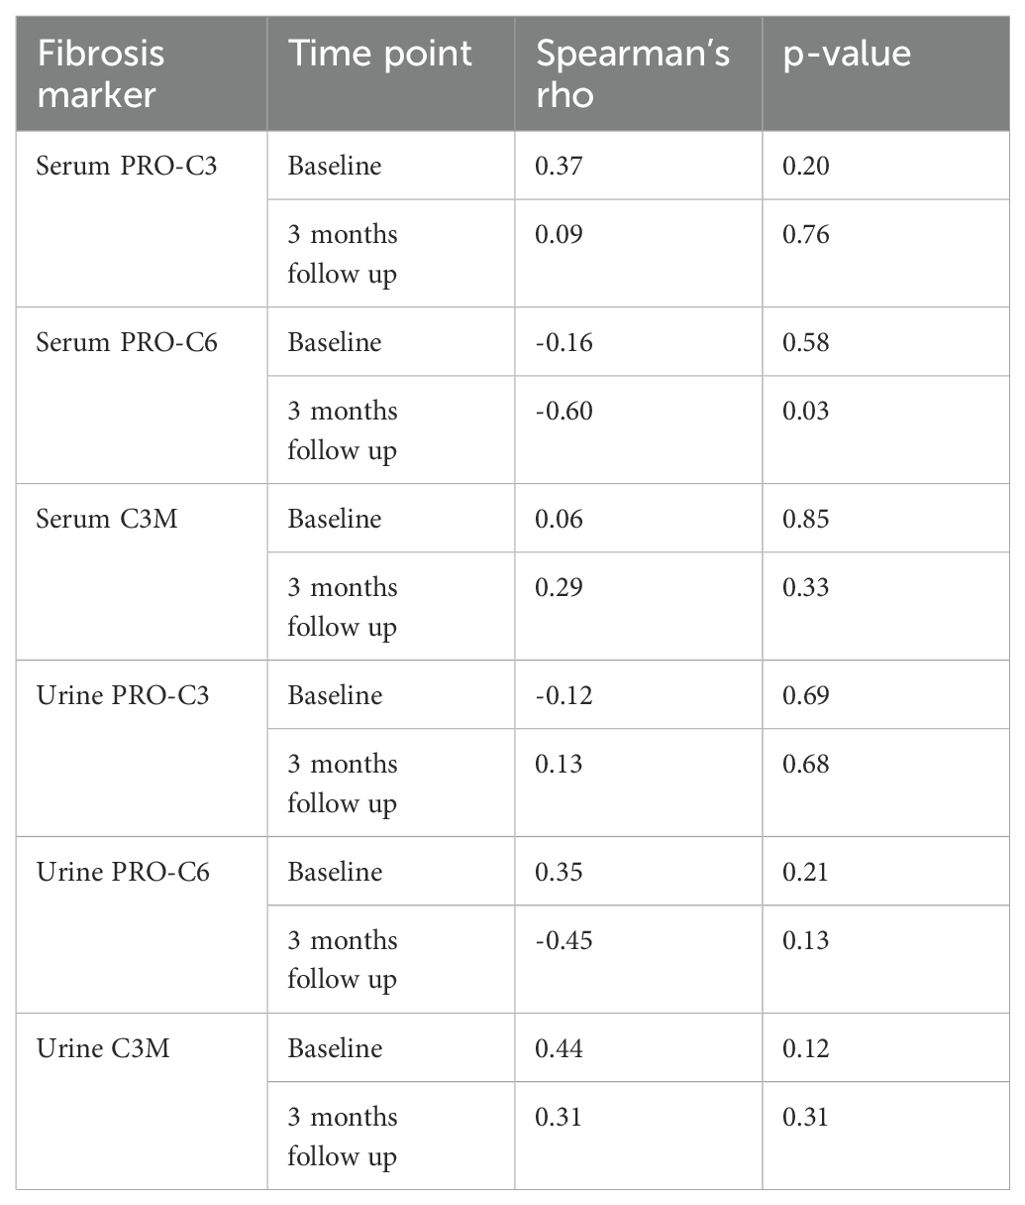
Table 3. Spearman’s correlation between fibrosis markers and kidney function.
4 Discussion
In this prospective and exploratory cohort study, we investigated the potential of non-invasive fibrosis markers as prognostic markers for decline in kidney function in NEN-patients undergoing PRRT treatment. The overall levels of uC3M differed between patients who preserved and patients who declined in kidney function with significantly lower levels at the initiation of PRRT treatment and three months after EOT in patients who subsequently declined in kidney function, suggesting that uC3M holds the potential as a prognostic marker of future kidney function decline. However, these results are exploratory and larger studies are needed to draw firm conclusions about the usefulness.
Several previous prospective studies have investigated PRO-C6 and C3M as prognostic markers in different etiologies of CKD. Interestingly, most of these studies have confirmed an association between PRO-C6 and C3M with incidence of adverse kidney outcomes. Genovese et al. (17, 23) and Pilemann-Lyberg et al. (22) observed decreasing levels of uC3M with decreasing kidney function and an inverse association between uC3M and disease progression. However, after adjustment this association was non-significant in the latter study (22). Furthermore, Genovese et al. (17) demonstrated that baseline levels of uC3M were significantly lower in patients who subsequently had a decline in the kidney function (17). This is in line with our study where levels of uC3M after first treatment and after EOT were lower in the group of patients who subsequently experienced a decline in kidney function. This emphasizes the potential of uC3M to predict future kidney function decline.
Sparding et al. (21), Pilemann-Lyberg et al. (22), and Møller et al. (25) demonstrated that serum/plasma PRO-C6 (endotrophin) was independently associated with decline in kidney function in cohorts of patients with different etiology of kidney disease. Neprasova et al. (24) showed that PRO-C6 improved the prognostic ability of adverse renal outcomes when added to more common clinical variables. In our study, we were unable to demonstrate any overall differences in the levels of sPRO-C6 between patients who preserved and patients who declined in kidney function.
Results on urinary PRO-C6 are conflicting. One study showed an increased risk of kidney disease progression with higher levels of uPRO-C6 (20) whereas another study showed a protective effect of high uPRO-C6 levels (22). We were unable to demonstrate any association between uPRO-C6 and decline in kidney function.
In this study, the correlations between kidney function and three of the markers, sPRO-C6, uPRO-C6, and uC3M, were of moderate strength and they were comparable to previous studies (20, 21). This underscores the potential of the fibrosis markers as prognostic markers of decline in kidney function.
The lack of coherence between our findings and previous studies may be caused by the relatively small number of patients included in our study and hence a risk of type 2 error. Also, the pattern of changes in the fibrosis markers may depend on the etiology of the kidney disease, e.g. diabetic nephropathy, hypertension, IgA nephropathy etc. However, in larger studies of patients with CKD of several mixed etiologies both Rasmussen et al. (20) and Genovese et al. (23), demonstrated that the fibrosis markers were useful as prognostic markers of disease progression.
It is also important to consider the kidney function at the time of fibrosis marker measurement. In our study, the baseline GFR is 80 ml/min/1.73m2. This is considerable higher than the baseline GFR in most of the comparable studies. This may indicate that the fibrosis markers are more useful when some degree of kidney impairment is already present. This aligns with the results from Pilemann-Lyberg et al. (22) as the baseline mean eGFR was 82 ml/min/1.73m2 and they observed an independent association between sPRO-C6 and decline in eGFR for patients with baseline eGFR >30 and >45 ml/min/1.73m2. This association was insignificant for patients with eGFR >60 ml/min/1.73m2. In this study, no decline in kidney function was observed during the PRRT treatment. However, three months after the end of treatment, some renal impairment was observed, and at the end of follow up this impairment was even more pronounced. In contrast, lower levels of uC3M were observed already after the first PRRT treatment, which might indicate that changes in the fibrosis markers precedes the functional kidney impairment.
Little is known about the histopathological changes in the kidney following PRRT. There is a general understanding that chronic kidney disease is characterized by renal tubulointerstitial fibrosis regardless of the etiology (10–13). To our knowledge, only one case report has investigated the histopathology in patients with chronic kidney failure following PRRT (28). Kidney biopsies from three patients showed typical signs of thrombotic microangiopathy involving the glomeruli, arterioles, and small arteries, and, furthermore, tubular atrophy and interstitial fibrosis were dominant in all three cases. However, the number of kidney biopsies are too low to draw any firm conclusions about fibrosis.
The proportion of patients experiencing decline in kidney function following PRRT is remarkably high in this study (43%) compared with previous studies (8, 29). Even though not statistically significant, there appeared to be a higher proportion of patients with hypertension, prior PRRT treatments, and Yttrium-based treatments in the group of patients experiencing a decline in kidney function. Additionally, the baseline standard-GFR prior to PRRT tended to be lower in this group, although this was also not statistically significant. These are all factors that potentially contribute to a greater decrease in renal function following PRRT, and this may explain the high number of patients experiencing decline in kidney function following PRRT. The lack of statistical significance between the groups is likely to be attributable to the low number of patients.
A major strength of this study is the accurate measurement of the glomerular filtration rate using the 51Cr-EDTA or 99mTc-DTPA plasma clearance test instead of estimated glomerular filtration rate based on serum creatinine. However, the number of patients is low making the study vulnerable to type 2 errors. Six patients died during treatment and were not included in the final analysis due to missing follow up test. Due to the explorative design of the study, several statistical tests are performed which increases the risk of type 1 errors. Furthermore, our patient population is heterogenous encompassing all primary tumors including small intestinal NENs which are more likely to cause fibrotic complications (e.g. mesenteric fibrosis and carcinoid heart disease) than pancreatic and lung NENs. The contribution of fibrosis markers from other organs than the kidney could potentially interfere with the interpretation of the results. These limitations taken into consideration, our results should be interpreted cautiously and are meant as exploratory results that can serve as guidance when larger studies concerning fibrosis markers in patients with NENs are planned.
In conclusion, we investigated the potential of non-invasive fibrosis markers as prognostic markers of decline in kidney function in NEN-patients undergoing PRRT. After the first PRRT treatment and three months after EOT, we observed lower levels of uC3M in patients who subsequently experienced a decline in kidney function. These results suggest that uC3M holds the potential as a prognostic marker. However, the results should be considered exploratory, and one should be cautious in drawing firm conclusions about the usefulness. For this purpose, we suggest that larger prospective studies are carried out.
Data availability statement
The original contributions presented in the study are included in the article/Supplementary Material. Further inquiries can be directed to the corresponding author.
Ethics statement
The studies involving humans were approved by De Videnskabsetiske Komitéer for Region Midtjylland (case number 1-10-72-164-17). The studies were conducted in accordance with the local legislation and institutional requirements. The participants provided their written informed consent to participate in this study.
Author contributions
TS: Conceptualization, Data curation, Formal Analysis, Funding acquisition, Investigation, Methodology, Visualization, Writing – original draft, Writing – review & editing, Project administration. LB: Investigation, Project administration, Supervision, Writing – review & editing. DR: Conceptualization, Data curation, Formal Analysis, Methodology, Writing – review & editing, Validation. FG: Conceptualization, Methodology, Supervision, Writing – review & editing, Validation. MK: Conceptualization, Methodology, Resources, Writing – review & editing. AA: Investigation, Resources, Supervision, Writing – review & editing. HG: Conceptualization, Investigation, Methodology, Resources, Supervision, Writing – review & editing, Funding acquisition. GD: Conceptualization, Investigation, Methodology, Project administration, Resources, Supervision, Writing – review & editing, Funding acquisition.
Funding
The author(s) declare that financial support was received for the research and/or publication of this article. This study was supported by unconditional grants from IPSEN, Helsefonden, Samnordic, Region Midtjyllands Sundhedsvidenskabelige Forskningsfond, Dansk Kraeftforskningsfond, and Kraeftens Bekaempelse. Henning Grønbaek received research funding from Intercept, Abbvie, NOVO Nordisk Foundation, ARLA Food for Health, and ADS AIPHIA Development Services. Consultant Astra Zenica, NOVO Nordisk, Ipsen, and data monitoring committee at CAMURUS.
Acknowledgments
We would like to thank the employees at the laboratory of Department of Hepatology and Gastroenterology, Aarhus University Hospital who have been helpful in drawing blood- and urine samples from the participating patients. Also, thank you to colleagues at Department of Hepatology and Gastroenterology for inputs regarding the statistics and thank you to the Data science unit at Nordic Bioscience who supervised the statistics.
Conflict of interest
Authors FG, MK and DR were full-time employees and stockholders at Nordic Bioscience A/S at the time the research was performed.
The authors declare that the research was conducted in the absence of any commercial or financial relationships that could be construed as a potential conflict of interest.
Publisher’s note
All claims expressed in this article are solely those of the authors and do not necessarily represent those of their affiliated organizations, or those of the publisher, the editors and the reviewers. Any product that may be evaluated in this article, or claim that may be made by its manufacturer, is not guaranteed or endorsed by the publisher.
Supplementary material
The Supplementary Material for this article can be found online at: https://www.frontiersin.org/articles/10.3389/fendo.2025.1495369/full#supplementary-material
References
1. Oberg K, Knigge U, Kwekkeboom D, and Perren A. Neuroendocrine gastro-entero-pancreatic tumors: esmo clinical practice guidelines for diagnosis, treatment and follow-up. Ann Oncol. (2012) 23 Suppl 7:vii124–30. doi: 10.1093/annonc/mds295
2. Nagtegaal ID, Odze RD, Klimstra D, Paradis V, Rugge M, Schirmacher P, et al. The 2019 who classification of tumours of the digestive system. Histopathology. (2020) 76:182–8. doi: 10.1111/his.13975
3. Laskaratos FM, Rombouts K, Caplin M, Toumpanakis C, Thirlwell C, and Mandair D. Neuroendocrine tumors and fibrosis: an unsolved mystery? Cancer. (2017) 123:4770–90. doi: 10.1002/cncr.31079
4. Gustafsson BI, Hauso O, Drozdov I, Kidd M, and Modlin IM. Carcinoid heart disease. Int J Cardiol. (2008) 129:318–24. doi: 10.1016/j.ijcard.2008.02.019
5. Druce MR, Bharwani N, Akker SA, Drake WM, Rockall A, and Grossman AB. Intra-abdominal fibrosis in a recent cohort of patients with neuroendocrine (‘Carcinoid’) tumours of the small bowel. QJM: monthly J Assoc Physicians. (2010) 103:177–85. doi: 10.1093/qjmed/hcp191
6. Severi S, Grassi I, Nicolini S, Sansovini M, Bongiovanni A, and Paganelli G. Peptide receptor radionuclide therapy in the management of gastrointestinal neuroendocrine tumors: efficacy profile, safety, and quality of life. Onco Targets Ther. (2017) 10:551–7. doi: 10.2147/ott.s97584
7. Bodei L, Cremonesi M, Ferrari M, Pacifici M, Grana CM, Bartolomei M, et al. Long-term evaluation of renal toxicity after peptide receptor radionuclide therapy with 90y-dotatoc and 177lu-dotatate: the role of associated risk factors. Eur J Nucl Med Mol Imaging. (2008) 35:1847–56. doi: 10.1007/s00259-008-0778-1
8. Valkema R, Pauwels SA, Kvols LK, Kwekkeboom DJ, Jamar F, de Jong M, et al. Long-term follow-up of renal function after peptide receptor radiation therapy with (90)Y-dota(0),Tyr(3)-octreotide and (177)Lu-dota(0), tyr(3)-octreotate. J Nucl Med. (2005) 46 Suppl 1:83s–91s.
9. Strosberg J, El-Haddad G, Wolin E, Hendifar A, Yao J, Chasen B, et al. Phase 3 trial of (177)Lu-dotatate for midgut neuroendocrine tumors. New Engl J Med. (2017) 376:125–35. doi: 10.1056/NEJMoa1607427
10. Schainuck LI, Striker GE, Cutler RE, and Benditt EP. Structural-functional correlations in renal disease. II. The Correlations. Hum Pathol. (1970) 1:631–41. doi: 10.1016/s0046-8177(70)80061-2
11. Bohle A, Mackensen-Haen S, and von Gise H. Significance of tubulointerstitial changes in the renal cortex for the excretory function and concentration ability of the kidney: A morphometric contribution. Am J Nephrol. (1987) 7:421–33. doi: 10.1159/000167514
12. Boor P, Ostendorf T, and Floege J. Renal fibrosis: novel insights into mechanisms and therapeutic targets. Nat Rev Nephrol. (2010) 6:643–56. doi: 10.1038/nrneph.2010.120
13. Liu Y. Cellular and molecular mechanisms of renal fibrosis. Nat Rev Nephrol. (2011) 7:684–96. doi: 10.1038/nrneph.2011.149
14. Genovese F, Manresa AA, Leeming DJ, Karsdal MA, and Boor P. The extracellular matrix in the kidney: A source of novel non-invasive biomarkers of kidney fibrosis? Fibrogenesis Tissue Repair. (2014) 7:4. doi: 10.1186/1755-1536-7-4
15. Lau TS, Bossen L, Guldager Kring Rasmussen D, Karsdal M, Genovese F, Arveschoug AK, et al. Association between fibrosis markers and kidney function following peptide receptor radionuclide therapy in patients with neuroendocrine tumours. Scandinavian J Clin Lab Invest. (2022) 82(6):446–53. doi: 10.1080/00365513.2022.2119598
16. Stribos EGD, Nielsen SH, Brix S, Karsdal MA, Seelen MA, van Goor H, et al. Non-invasive quantification of collagen turnover in renal transplant recipients. PloS One. (2017) 12:e0175898. doi: 10.1371/journal.pone.0175898
17. Genovese F, Boor P, Papasotiriou M, Leeming DJ, Karsdal MA, and Floege J. Turnover of type iii collagen reflects disease severity and is associated with progression and microinflammation in patients with iga nephropathy. Nephrol dialysis Transplant. (2016) 31:472–9. doi: 10.1093/ndt/gfv301
18. Rasmussen DGK, Boesby L, Nielsen SH, Tepel M, Birot S, Karsdal MA, et al. Collagen turnover profiles in chronic kidney disease. Sci Rep. (2019) 9:16062. doi: 10.1038/s41598-019-51905-3
19. Sparding N, Genovese F, Rasmussen DGK, Karsdal MA, Neprasova M, Maixnerova D, et al. Endotrophin, a collagen type vi-derived matrikine, reflects the degree of renal fibrosis in patients with iga nephropathy and in patients with anca-associated vasculitis. Nephrol dialysis Transplant. (2022) 37:1099–108. doi: 10.1093/ndt/gfab163
20. Rasmussen DGK, Fenton A, Jesky M, Ferro C, Boor P, Tepel M, et al. Urinary endotrophin predicts disease progression in patients with chronic kidney disease. Sci Rep. (2017) 7:17328. doi: 10.1038/s41598-017-17470-3
21. Sparding N, Rasmussen DGK, Genovese F, Karsdal MA, Hornum M, Feldt-Rasmussen B, et al. Circulating levels of endotrophin are prognostic for long-term mortality after aki. Kidney360. (2022) 3:809–17. doi: 10.34067/kid.0000422021
22. Pilemann-Lyberg S, Rasmussen DGK, Hansen TW, Tofte N, Winther SA, Holm Nielsen S, et al. Markers of collagen formation and degradation reflect renal function and predict adverse outcomes in patients with type 1 diabetes. Diabetes Care. (2019) 42:1760–8. doi: 10.2337/dc18-2599
23. Genovese F, Rasmussen DGK, Karsdal MA, Jesky M, Ferro C, Fenton A, et al. Imbalanced turnover of collagen type III is associated with disease progression and mortality in high-risk chronic kidney disease patients. Clin Kidney J. (2021) 14:593–601. doi: 10.1093/ckj/sfz174
24. Neprasova M, Maixnerova D, Sparding N, Genovese F, Karsdal MA, Koprivova H, et al. Serum and urine biomarkers related to kidney fibrosis predict kidney outcome in czech patients with iga nephropathy. Int J Mol Sci. (2023) 24(3):2064. doi: 10.3390/ijms24032064
25. Møller AL, Tougaard NH, Rasmussen DGK, Genovese F, Rønn PF, Hansen TW, et al. Endotrophin as a risk marker of mortality and kidney complications in a type 1 diabetes cohort. Front Mol Biosci. (2023) 10:1229579. doi: 10.3389/fmolb.2023.1229579
26. Staanum PF, Frellsen AF, Olesen ML, Iversen P, and Arveschoug AK. Practical kidney dosimetry in peptide receptor radionuclide therapy using [(177)Lu]Lu-dotatoc and [(177)Lu]Lu-dotatate with focus on uncertainty estimates. EJNMMI Phys. (2021) 8:78. doi: 10.1186/s40658-021-00422-2
27. Bodei L, Mueller-Brand J, Baum RP, Pavel ME, Hörsch D, O’Dorisio MS, et al. The joint iaea, eanm, and snmmi practical guidance on peptide receptor radionuclide therapy (Prrnt) in neuroendocrine tumours. Eur J Nucl Med Mol Imaging. (2013) 40:800–16. doi: 10.1007/s00259-012-2330-6
28. Moll S, Nickeleit V, Mueller-Brand J, Brunner FP, Maecke HR, and Mihatsch MJ. A new cause of renal thrombotic microangiopathy: yttrium 90-dotatoc internal radiotherapy. Am J Kidney Dis. (2001) 37:847–51. doi: 10.1016/S0272-6386(01)80135-9
Keywords: PRRT, fibrosis markers, biomarkers, neuroendocrine neoplasms, neuroendocrine tumors, kidney fibrosis
Citation: Stemann Lau T, Bossen L, Rasmussen DGK, Genovese F, Karsdal M, Arveschoug AK, Grønbæk H and Dam G (2025) Fibrosis markers as prognostic markers of decline in kidney function in patients with neuroendocrine neoplasms undergoing peptide receptor radionuclide therapy. Front. Endocrinol. 16:1495369. doi: 10.3389/fendo.2025.1495369
Received: 12 September 2024; Accepted: 05 June 2025;
Published: 27 June 2025.
Edited by:
Pernille Holmager, University of Copenhagen, DenmarkReviewed by:
Alberto Bongiovanni, IRCCS Istituto Romagnolo per lo Studio dei Tumori (IRST) “Dino Amadori”, ItalyEsben Carlsen, Rigshospitalet, Denmark
Copyright © 2025 Stemann Lau, Bossen, Rasmussen, Genovese, Karsdal, Arveschoug, Grønbæk and Dam. This is an open-access article distributed under the terms of the Creative Commons Attribution License (CC BY). The use, distribution or reproduction in other forums is permitted, provided the original author(s) and the copyright owner(s) are credited and that the original publication in this journal is cited, in accordance with accepted academic practice. No use, distribution or reproduction is permitted which does not comply with these terms.
*Correspondence: Tobias Stemann Lau, dG9iaWx1QHJtLmRr