 Suwan Qian1,2†
 Yang Liu
 Wei Wang
 Shuna Zhao
 Wenkui Yu
 Zhihui Tong
- 1Department of Critical Care Medicine, Nanjing Jinling Hospital, Affiliated Hospital of Medical School, Nanjing University, Nanjing, China
- 2Department of Critical Care Medicine, Nanjing Drum Tower Hospital, Affiliated Hospital of Medical School, Nanjing University, Nanjing, China
- 3Department of Critical Care Medicine, Affiliated Jinling Hospital, School of Medicine, Southeast University, Nanjing, China
- 4Department of Endocrinology, Nanjing Jinling Hospital, Affiliated Hospital of Medical School, Nanjing University, Nanjing, China
- 5Health Medicine Department, Jinling Hospital, Affiliated Hospital of Medical School, Nanjing University, Nanjing, China
- 6Department of Critical Care Medicine, Jinling Hospital, Nanjing Medical University, Nanjing, Jiangsu, China
Background: To assess whether glucose variability (GV) during acute pancreatitis (AP) predicts post-acute pancreatitis diabetes mellitus (PPDM-A), significantly affecting patient life quality.
Methods: This study was performed during 2016–2020 at Jinling Hospital, with a 3-year follow-up for each patient. Cox proportional hazards model was used to evaluate the association of GV with the possibility of developing PPDM-A. Dose-response relationships of GV with the three-year probability of PPDM-A were characterized based on a restricted cubic splines (RCS) model. GV was analyzed to predict the ability for PPDM-A by calculating area under the receiver operating characteristic curves (AUCs).
Results: PPDM-A rates rose from 16% at one year to 27.3% at three years post-AP. Multivariate Cox analysis indicated that the largest amplitude of glycemic excursions (LAGE) exhibited independent association with an increased PPDM-A risk within 3 years (HR = 1.21, 95% CI: 1.05–1.38, P <0.01). RCS results identified optimum LAGE threshold as 5.1, with significantly higher 3-year PPDM-A rates of abnormal LAGE group (LAGE ≥5.1 mmol/L) when compared with normal LAGE group (LAGE <5.1 mmol/L, P <0.001). AUCs for LAGE in predicting PPDM-A incidence in 12, 24, and 36 months were 0.883 (95% CI: 0.862–0.930), 0.916 (95% CI: 0.887-0.945), and 0.926 (95% CI: 0.895-0.948), respectively.
Conclusions: LAGE in hospital stay accurately predicts PPDM-A. Further investigation plays an essential role in determining whether GV-targeting interventions can confer favorable clinical outcomes.
Introduction
Post-acute pancreatitis diabetes mellitus (PPDM-A) is a specifical diabetes subtype that develops following acute pancreatitis (AP) and is characterized by impaired insulin secretion and glucose metabolism (1–3). It is associated with higher rates of morbidity and mortality, as well as a decreased quality of life (4). The reported incidence of PPDM-A varies widely in different studies, ranging from 5% to 70% (5–8). This variability can be caused by differences in study populations, follow-up durations, and diagnostic criteria. In the Chinese population, recent studies have provided specific epidemiological data: A multicenter retrospective cohort study involving 1,804 patients reported a 6.2% PPDM-A prevalence over a median follow-up of 3.04 years (9); Additionally, Ma et al. constructed a nomogram for predicting PPDM-A in a Chinese cohort of 616 patients, and identified that 20.0% of participants developed diabetes within 3 months of AP onset (10). While traditional risk factors for PPDM-A, such as etiology, obesity, and severity of AP, have been widely investigated, there is still conflicting evidence among a variety of studies (6, 7, 11–16). Therefore, it is essential to identify individuals at high risk for PPDM-A during the recovery phase from an AP episode, which is a vital component of the ‘holistic prevention of pancreatitis’ approach (17).
Several studies showed that in‐hospital hyperglycemia might be a potential indicator for the development of PPDM-A and its associated complications (9, 10, 18). However, these findings have primarily depended on single time point assessments of admission blood glucose or fasting blood glucose levels. This approach, focusing on static blood glucose measurements, may not fully capture the association of dynamic glucose fluctuations with patient prognosis. In recent years, there has been an increasing interest in exploring the impact of glucose variability (GV) on the clinical prognosis of hospitalized individuals. Studies have exhibited significant correlations between increased GV during hospitalization and poorer short- and long-term outcomes. Mendez et al. investigated non-critically ill hospitalized patients (medical/surgical units), finding GV independently predicted prolonged hospitalization (19), while Akirov et al. studied general surgery ward populations (non-cardiac/non-trauma), reporting high GV increased 30-day mortality risk by 78% (20). A study specifically highlighted the predictive value of early-stage GV in plasma glucose levels for the development of diabetes (17). Despite the obtained findings, the specific role of GV in the context of risk stratification and prediction of PPDM-A has not been thoroughly investigated. In addition, the lack of an optimum threshold for GV indices in accurately predicting PPDM-A and effectively stratifying risk has limited the clinical application.
Therefore, a study was performed on Chinese adults following AP by collecting their medical records and conducting telephone follow-ups. This cohort study was used to determine PPDM-A cumulative rates within a 3-year period and to investigate potential risk factors in association with its development. Therefore, this study specifically aimed to (1) propose the novel GV dynamic index and determine optimum threshold of GV indices for enhancing risk stratification, and (2) explore the association of GV indices with the development PPDM-A.
Methods
Study design and ethics statement
This cohort study was performed to explore all inpatients who experienced a first attack of AP between January 1, 2016, and December 31, 2020, at the Therapy Center for Severe Acute Pancreatitis (SAP), Jinling Hospital. Data were acquired based on Electronic Medical Record system (AP-Database), with an approval from the Institutional Review Board (2019NZKY-003-03). Analysis was conducted following the specific regulations. Moreover, no informed consents were needed in this retrospective study. To protect privacy, patient information was anonymized and deidentified. Our study was carried out strictly following Declaration of Helsinki and corresponding ethical guidelines.
Study participants
Subjects enrolled in this study were adults (>18 years) experiencing the initial AP attack. Exclusion criteria were presented as follows: I. Individuals with impaired fasting glucose (IFG, 5.6-6.9 mmol/L) or HbA1c levels ≥5.7% (indicating prediabetes) (21). It should be noted that baseline BMI and HbA1c were not included as risk factors. Most participants had SAP with hypercatabolic states (22), making acute-phase BMI unreliable due to fluid shifts and weight loss (23). HbA1c accuracy may be compromised by anemia, acute kidney injury, or hypoalbuminemia (24). II. Those with other pancreatic injuries, including pancreatectomy, trauma, neoplasms, hemochromatosis, cystic fibrosis, rare genetic diseases, and fibrocalculous pancreatopathy; III. Individuals undergoing severe cardiac/hepatic/renal insufficiency, or those diagnosed with malignancies; IV. Pregnant or postpartum individuals; and V. Individuals with over10% missing data. Defined as missing 3 or more items among 26 core clinical indicators; these indicators include demographic characteristics, AP-related factors, glucose-related metrics, biochemical/inflammatory markers, and complication/prognosis data, detailed in Data Extraction section.
Data extraction
Demographics (such as sex and age), duration of hospitalization, AP cause and severity, levels of pancreatic enzymes (amylase and lipase), blood glucose levels, serum calcium, interleukin-6 (IL-6), C-reactive protein (CRP), hepatic and renal function markers, lipid profiles, infection status, white blood cell count (WBC), hematocrit (HCT), and platelet count (PLT) were extracted from the AP-Database. Trained professionals were responsible for follow-up visits of subjects after hospital discharge. Follow-up visits were performed through telephone for those who were unable to visit our center. The above indicators constitute 26 core items, with glucose-related metrics (LAGE, SD, CV) merged as one to avoid overcounting. An individual is deemed to have ‘over 10% data missingness’ if missing 3+ of these 26 items and thus excluded.
Definitions and classifications
Based on Atlanta classification after revision, AP was diagnosed according to two among these three criteria (25): (1) sudden severe and persistent upper abdominal pain usually radiating to the back. (2) serum lipase and/or amylase levels ≥ 3-fold upper limit of normal, and (3) representative imaging results consistent with AP on abdominal ultrasound, contrast-enhanced CT, and MRI. AP severity was classified into mild, moderate and severe following revised Atlanta classification (25). Subjects of study were categorized into mild AP when they did not have systemic or local complications or organ failure. Moderate AP was defined in patients developing systemic or local complications without persistent organ failure (< 48 h). Severe AP was defined in patients with persistent single/multiple organ failure (> 48h). Consistent with 2021 American Diabetes Association (ADA) standards, PPDM-A was defined as new-onset diabetes following AP (>3 months) without underlying diabetes prior to AP attack (26).
Definition of GV indices and abnormal GV
The GV indices, including Standard Deviation of Blood Glucose (SDBG), Largest Amplitude of Glycemic Excursions (LAGE), and Coefficient of Variation (CV) are employed to assess blood glucose level variability among people with diabetes. Firstly, serum glucose levels measured in the course of disease were detected in all patients. Subsequently, SDBG was defined as arithmetic SDBG values. CV was defined as the SDBG to average blood glucose level ratio. LAGE was calculated as the difference between the highest and lowest blood glucose values (mmol/L) recorded during a 24-hour observation period, serving as a key metric of glycemic variability independent of average glucose concentrations (27). In healthy adults with normal glucose tolerance, a LAGE value of under 5.7 mmol/L is considered within the normal physiological range (28).In our study, frequent capillary blood glucose (CBG) measurements (finger-prick) offer a clinically feasible method for LAGE calculation. CBG was measured every 2 hours and LAGE was calculated as the difference between the maximum and minimum glucose value across a 24-hour period (requiring 12 measurements). LAGE values were averaged across three monitoring days to enhance reliability. To identify the GV index most strongly associated with the occurrence of PPDM-A within three years, least absolute shrinkage and selection operator (LASSO) regression were used. This model allowed us to screen the most relevant GV index from the above-mentioned indices. To further analyze the optimum thresholds of these GV indices, RCS regression was used for evaluating dose-response associations of indices of GV with the 3-year probability of PPDM-A. Regression involved possible confounding factor adjustment at 5, 25, 75, and 95th percentiles of GV indices. The optimum threshold was GVs value that corresponded to lower limit of HR 95% CI > 1. Therefore, GV value ≥ threshold was deemed as having aberrant GV; otherwise, they were classified as having normal GV.
Statistical analyses
A Shapiro–Wilk test was used to evaluate continuous variables were normally distributed. Based on the findings, continuous variables were indicated by mean and standard deviation or median and interquartile range. Normally-distributed data were compared by t-test, whereas non-normally-distributed counterparts were compared by adopting Mann-Whitney test.
Hazard ratio (HR) having 95% confidence intervals (CI) was calculated by using univariate and multivariate Cox proportional hazards regression models. Variables satisfying P < 0.05 through univariate regression and clinically relevant characteristics were selected as candidate risk factors. LASSO regression satisfying P < 0.05 was used to screen best-fit covariates in multivariate regression (Supplementary Figure 1). Correlation heatmaps were plotted to test multi-collinearity among variables in the multivariate COX regression models (Supplementary Figure 2).
In addition, 3-year PPDM-A incidence was evaluated by drawing Kaplan–Meier survival curves, which was compared with Logrank test in abnormal and normal LAGE groups. Area under receiver operating characteristic (ROC) curves (AUC) was calculated to assess the PPDM prediction ability. Delong test was utilized to compare ROC curves.
Subgroup analyses stratified by different factors, including age (≤50, >50 years), gender, individuals with or without walled-off necrosis(WON), and those with recurring AP, were performed. Moreover, the association of abnormal GV with the above subgroup variables was analyzed, and the correlation of abnormal GV with 3-year PPDM-A incidence was analyzed in every subgroup.
P < 0.05 (two-tailed) represented statistical significance. R Programming Language (version 4.0.3) and STATA (version.15.0) were used for statistical analyses. R packages “ggrcs” [0.2.4 version] and “rms” [6.2–0 version] were utilized to visualize and analyze the RCS model; “survival” [3.2–11 version] was used in survival analysis; “timeROC” [0.4 version] was applied to estimate time-dependent ROC curve and AUC); whereas “forestplot” [2.0.1 version] was used to visualize forest plots during sensitivity analysis.
Results
Finally, totally 388 subjects satisfying the eligibility criteria were enrolled for analysis. DM was observed in 27.3% (106/388) of patients after the onset of AP(Figure 1). PPDM-A developed in 62, 91, and 106 patients at 1, 2, and 3 years after the onset of AP, with cumulative rates of 16%, 23.5%, and 27.3%, respectively.
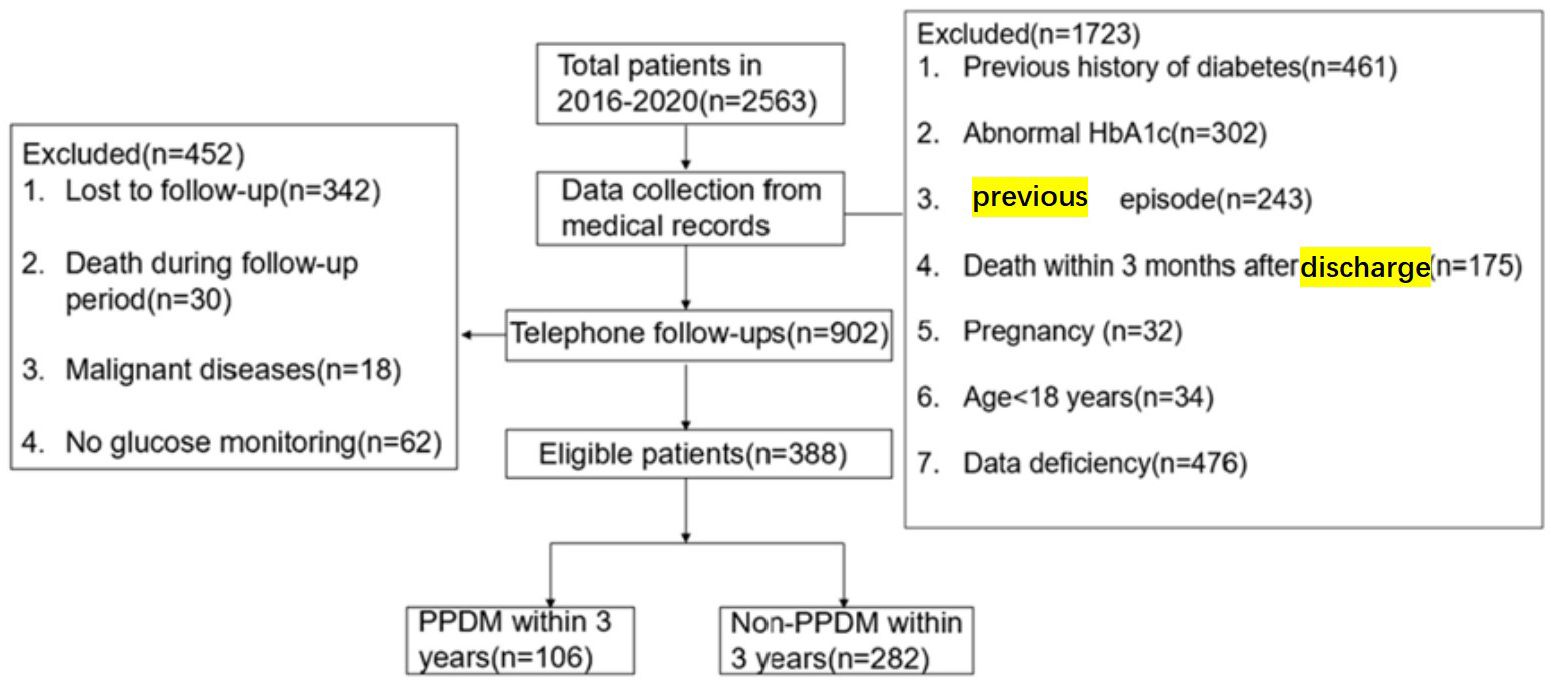
Figure 1. Flow-chart of the study group selection process.
Patient features
Table 1 displays patient demographic and clinical data, with 388 cases being included in this study. Based on diabetes, patients were classified into two groups. There were no significant differences in terms of gender and age between the two groups. However, individuals with PPDM-A showed longer hospital stays (12 (6–39) vs 7 (4–18), p<0.001), elevated levels of uric acid (UA), triglycerides (TG), procalcitonin (PCT), amylase, IL-6, CRP, admission blood glucose (ABG), LAGE, coefficient of variation (CV), and HCT (all P < 0.05), as well as a higher severity of AP (P = 0.006) in relative to non-diabetic patients. Individuals with PPDM-A had a higher incidence of hyperlipidemic AP (p<0.001) than those who had normal glucose levels, and they also exhibited a higher AP recurrence rate, as well as a higher occurrence of Wall-off necrosis (WON), acute kidney injury (AKI), acute respiratory distress syndrome (ARDS), and infected pancreatic necrosis (IPN) when compared with individuals without diabetes (all P < 0.05).
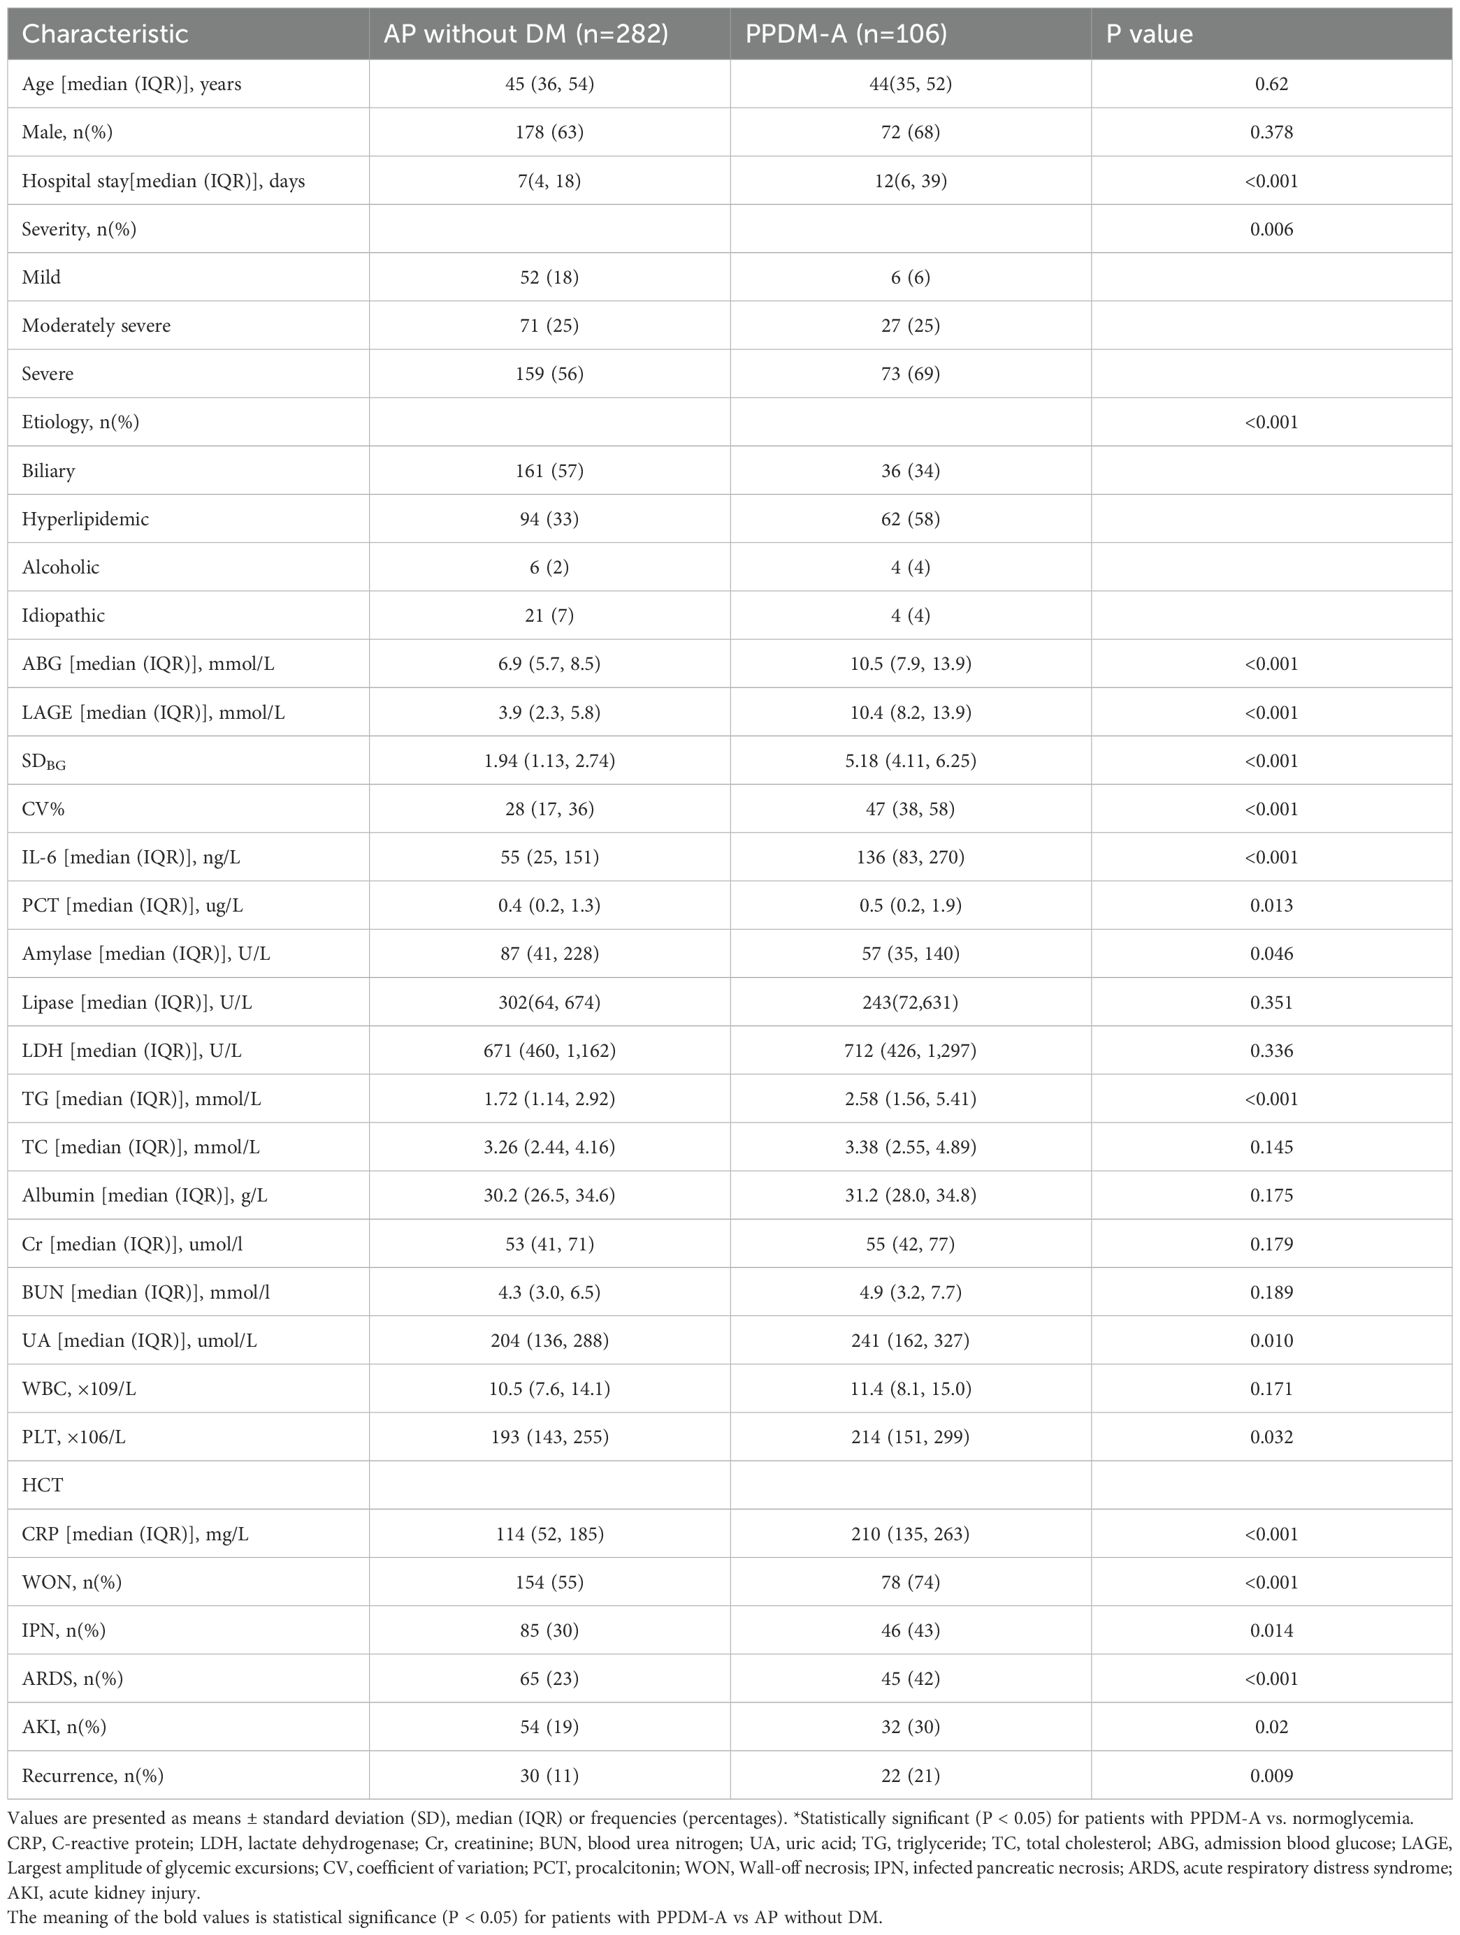
Table 1. Patient demographics and clinical characteristics.
Relationship of GV indices and clinical features to PPDM-A incidence
Univariate Cox regression analysis indicated that elevated levels of ABG, LAGE, SDBG, and CV, as well as a higher recurrence rate of AP, occurrence of WON, IPN, ARDS, and AKI, longer hospital stays, elevated IL-6, TG, Cr, BUA, HCT, PLT, and CRP, as well as the severity and etiology of AP, were all associated with an increased risk of 3-year probability of PPDM-A (Table 2).

Table 2. Univariate and multivariate association of LAGE and 3-year incidence of PPDM-A in COX regression model.
Consistent with the -2log-likelihood and binomial family type measure, LASSO regression was conducted out with R software through 10-fold K cross-validation to centralize and normalize those involved variables and to select the optimum lambda value. “Lambda.lse” provides the model with least independent variables yet high performance. Finally, those 5 potential risk factors from the candidate variables were selected by LASSO regression, including LAGE, IL-6, PLT, CRP, and LDH. In addition, the most significant features selected by LASSO were adopted for multivariate Cox proportional hazards analyses.
The multivariate Cox regression analysis identified the higher levels LAGE (aHR = 1.21, 95% CI: 1.05–1.38, P <0.001), CRP (aHR = 1.04, 95% CI: 1.02–1.07, P = 0.001), IL-6 (aHR = 1.01, 95% CI: 1.00–1.01, P = 0.004), LDH (aHR=1.01, 95% CI: 1.00–1.01, P <0.001) and PLT (aHR = 1.02, 95% CI: 1.01–1.04, P = 0.003) as independent prognostic factors for PPDM-A.
Multivariate RCS analyses adjusted for IL-6, CRP, LDH, and platelet count suggested that LAGE was correlated with 3-year probability of PPDM-A in AP cases (Figure 2). The dose–response curve morphology exhibited monotonic increase. The lower limits of 95% CI associated with HR for 3-year probability of PPDM-A were > 1 at LAGE ≥ 5.1 mmol/L. Therefore, the optimum threshold was LAGE = 5.1 mmol/L. LAGE < 5.1 mmol/L and LAGE ≥ 5.1mmol/L were deemed as normal and abnormal LAGE, respectively.

Figure 2. Association between LAGE and the incidence of PPDM-A within 3 years in AP patients. Models are adjusted for etiology, CRP, Plt, and LOS. The blue line and light blue area represent the estimated hazard ratio and its 95% confidence interval. The red vertical line represents LAGE = 5.1 mmol/L. CI confidence intervals, HR hazard ratio.
In the normal LAGE group, increasing LAGE levels were not significantly correlated with the 3-year likelihood of developing PPDM-A. However, for abnormal LAGE group, the increasing LAGE levels were related to a higher PPDM-A risk over 3 years.
Clinical outcomes for both LAGE groups
Participants were categorized into normal (205, 52.8%) or abnormal LAGE group (183, 47.2%). The baseline clinical characteristics showed significant variances between the two groups. Compared to the normal LAGE group, patients with abnormal LAGE (≥5.1 mmol/L) had significantly longer hospital stays, higher rates of severe acute pancreatitis, more frequent hyperlipidemic etiology, and increased complications such as ARDS, AKI, and walled-off necrosis (Table 3). Moreover, patients with abnormal LAGE exhibited a higher incidence of PPDM-A within 3 years compared with those with normal LAGE. (Supplementary Figure 3, Log-rank P < 0.001).

Table 3. Baseline clinical characteristics of patients stratified by the optimal cutoff point of LAGE.
Predicting ability of LAGE for PPDM-A incidence
Differences in predicting ability of LAGE, and the etiology of AP and IL-6 for PPDM-A at different time points were compared by using time-dependent ROC curve analysis. The AUCs of the LAGE in determining 1-, 2-, 3-year PPDM-A risk were 0.883 (95% CI: 0.862–0.930), 0.916 (95% CI: 0.887-0.945), 0.926 (95% CI: 0.895-0.948), separately (Figure 3a). The CRP discrimination was 0.66 (95% CI: 0.575–0.735), 0.70 (95% CI: 0.633–0.765), and 0.69 (95% CI: 0.636–0.752) in determining 1-year, 2-year, 3-year probability of PPDM-A respectively. (Figure 3b). In previous studies, the etiology of AP has been regarded as the risk factor related to DM occurrence after AP, and AUC of the etiology of AP for 3-year incidence of PPDM-A was 0.60 (95% CI: 0.544-0.657) (Figure 3c).
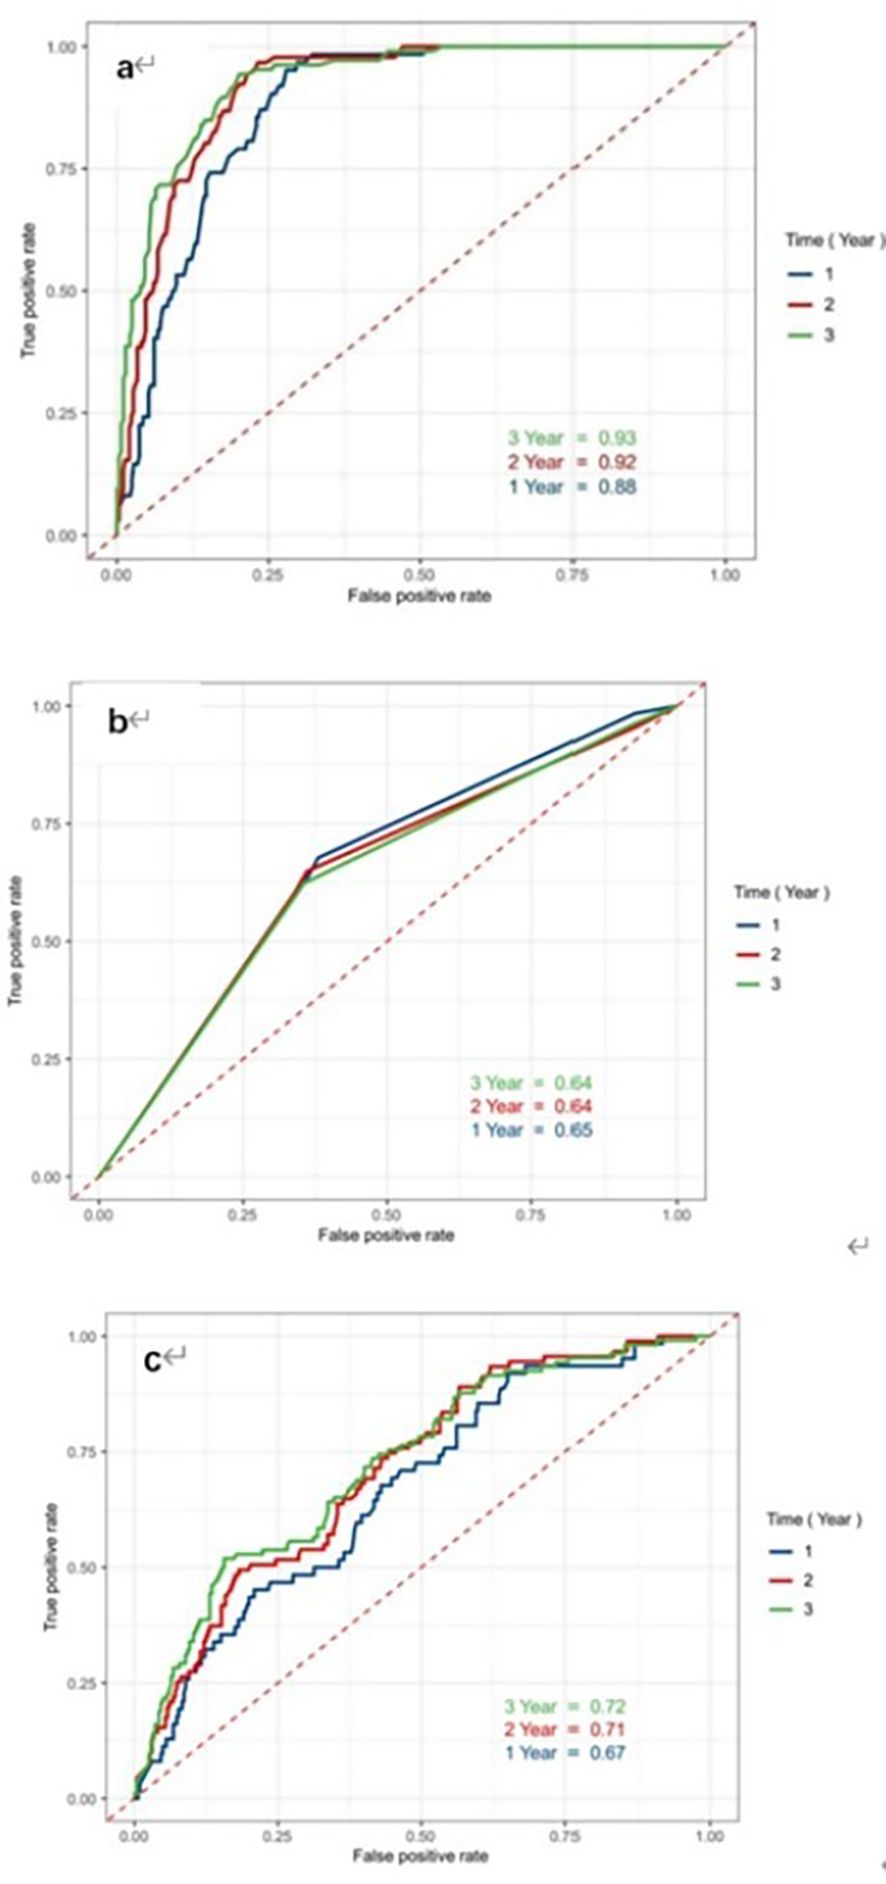
Figure 3. Receiver Operating Characteristic curves of indicators LAGE, CRP and etiology to predict the risk of developing PPDM-A within 1 year, 2 years and 3 years. (a) LAGE; (b) CRP; (c) etiology of AP; ROC receiver operating characteristic, AUC the area under the receiver operating characteristic curves.
Sensitivity analysis on the correlation of abnormal LAGE with 3-year PPDM-A incidence
Participants of abnormal LAGE group exhibited the significantly increased PPDM-A risk over 3 years compared with those in normal LAGE group, even when some confounders were adjusted (aHR =41.75, 95% CI:15.36–113.49, P < 0.001). Moreover, abnormal LAGE was consistently associated with an elevated possibility of developing PPDM-A within 3 years across various subgroups, including patients aged >50 and ≤50 years, men and women, participants with/without WON, and those with recurring AP. It is vital to emphasize that even in patients with non-severe AP, the abnormal LAGE group still exhibited a relatively higher incidence of PPDM-A over 3 years (HR = 41.66, 95% CI:9.95–174.47) (Figure 4).
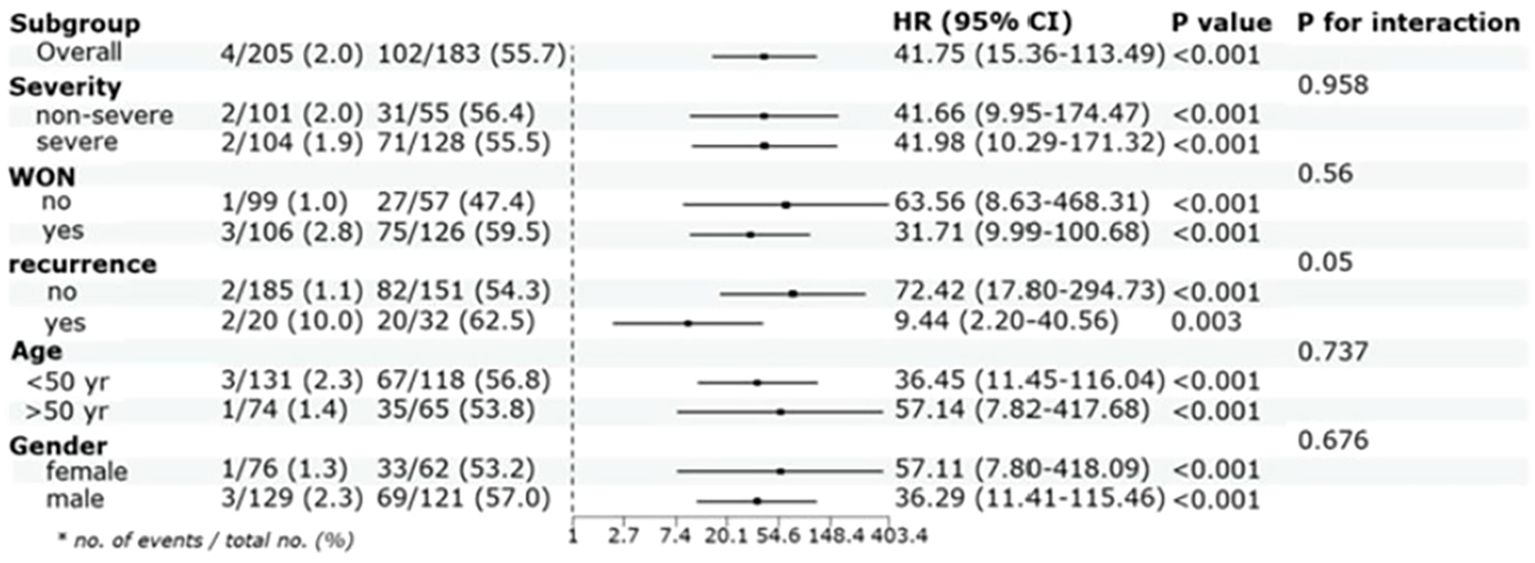
Figure 4. Cox proportional hazards analysis evaluating LAGE in various stratifications. HR was evaluated by abnormal LAGE and normal LAGE and were adjusted for CRP, IL-6, PLT and LDH, HR:hazard ratio, CI:confidence interval, yr: year.
Discussion
Individuals with PPDM-A confront a significant risk to their health and lives due to frequent hypoglycemia episodes and complications (1, 29–31). Our study was aimed at providing a more comprehensive understanding of PPDM-A, building on our 2016 research that had limitations in scope and definition (32, 33). It was found that the prevalence of PPDM-A increased from 16% at one year to 27.3% at three years after AP onset, which is higher than the 23% cumulative incidence reported in meta-analyses (6, 34). This discrepancy may be caused by methodological differences and regional variations (12, 16).
In this study, we innovatively demonstrated the predictive value of GV for PPDM-A, identifying LAGE = 5.1 mmol/L as optimum threshold in risk stratification. Our findings were strong in different subgroups, even for non-severe AP patients. Elevated glucagon and pancreatic polypeptide levels, alongside decreased ghrelin and peptide YY responses, are characteristics of PPDM-A and could serve as potential biomarkers (35). Our research builds on the known association of GV with mortality and diabetes, demonstrating it as the significant risk factor related to PPDM-A. Different from previous studies concentrating on early glucose fluctuations, our analysis considered the entire disease course, from admission to discharge, providing a more comprehensive assessment of GV’s predictive value for PPDM-A development (19, 20, 36, 37).
Abnormal blood glucose levels in hospitalization are related to the higher PPDM-A risk (16–18). Univariate analysis suggested that the glucose level at admission served as the risk factor related to PPDM-A development within 3 years. However, the glucose level at admission lacked significant correlation with PPDM-A in the multivariate model. Lasso regression was employed to eliminate the interference of multiple covariates between admission glucose and glycemic variability, enhancing the credibility of our results. Nevertheless, single-point measurements could not sufficiently indicate the real association of blood glucose with PPDM-A, while LAGE was the dynamic factor overcoming static data limitations. Sensitivity analysis suggested that our results were robust.
This study aimed to focus on clarifying the candidate mechanisms between blood glucose fluctuations and new-onset DM development in AP patients. A plausible explanation for our findings refers to that exposure to fluctuating glucose levels heightens oxidative stress, causing pronounced endothelial dysfunction (38, 39). This, in turn, exacerbates the systemic inflammatory response and insulin resistance, therefore elevating an individual’s risk of developing hyperglycemia in the future (40, 41). Clinically, elevated LAGE (>5.1 mmol/L) predicts hyperglycemic excursions (>4.4 mmol/L) and hypoglycemic risk (>3.48 mmol/L), while inversely associating with time-in-range in type 2 diabetes (42–44).
The association between PPDM-A and elevated serum LDH levels can be attributed to several factors. AP results in extensive tissue damage and an inflammatory response, causing the release of LDH from damaged cells into the blood. Hypoxia and metabolic disturbances during pancreatic inflammation further exacerbate tissue damage, which can increase LDH levels. Elevated LDH levels also reflect the severity of pancreatic necrosis and inflammation, which are related to pancreatic beta-cell dysfunction and increased insulin resistance, leading to diabetes (45).
In addition to LAGE and LDH, increased IL-6 and CRP were also significantly associated with the PPDM-A development. This aligns with research findings indicating that increased IL-6 levels after AP are associated with a higher risk of hyperglycemia (46). IL-6 and CRP increase during inflammation, impacting glucose metabolism through insulin resistance (47, 48). This can lead to impaired insulin receptor phosphorylation, inhibiting glycogen synthesis and promoting glucose release (49–51). Further investigations are necessary to understand the link of abnormal glucose metabolism with adipocytokines for better preventive and therapeutic strategies for PPDM-A.
The higher basic platelet level is the candidate indicator for a higher thrombosis risk, enhanced inflammatory response, while decreased vascular endothelial function (52). The increase in platelet count has been shown as a potential predictor for PPDM-A in this study. This is likely resulted from the inflammatory response triggered by AP which can cause insulin resistance and impaired glucose metabolism. The elevated platelet count may reflect the ongoing inflammation and oxidative stress in the body, which are known risk factors associated with diabetes occurrence (53). It is important to monitor patients with elevated platelet counts following AP closely for developing diabetes, as early intervention and management can contribute to preventing or delaying the onset of the disease.
Furthermore, the relationship between AP severity and the risk of PPDM-A requires careful interpretation. Evidence regarding AP severity as a risk factor is mixed, with some studies supporting the link and others finding no significant association(6,7,10,11). In our study, AP severity was significantly associated with PPDM-A in univariate analysis (Table 2), and patients in the high LAGE group had a higher incidence of severe AP (Table 3). However, AP severity was not retained as an independent predictor in the multivariate model after LASSO regression. We propose a plausible explanation wherein the impact of AP severity on PPDM-A is largely mediated through its effect on LAGE. More intense inflammatory insults and metabolic stress during AP likely predispose patients to greater glycemic excursions. The resulting glucose variability, quantified by LAGE, then acts as a more direct and measurable driver of future diabetes risk. Therefore, these findings suggest that while the initial injury and severity set the stage, the subsequent metabolic and inflammatory dysregulation, particularly glucose variability, may be more proximal determinants of PPDM-A risk.
However, this study had several limitations that need to be acknowledged. First, as a retrospective analysis conducted at a single institution using electronic medical records, this study may be subject to recall and selection biases commonly associated with historically documented patient information. Therefore, the generalizability of the conclusions should be confirmed in future multi-center, prospective studies with larger cohorts. Second, the inability to obtain blood specimens during the follow-up period precluded the assessment of islet function (e.g., by insulin or C-peptide release tests), although such functional evaluations would have substantially strengthened the investigation of PPDM-A’s pathological mechanisms. Third, while in-hospital glucose monitoring enabled the assessment of GV during the acute phase of AP, the absence of glucose monitoring data in the chronic phase limited a comprehensive evaluation of its association with PPDM-A and restricted insights into the temporal dynamics of GV’s impact. In addition, conventional metabolic indices such as BMI and HOMA-IR were not included in our analysis due to concerns regarding their reliability in the acute phase of severe pancreatitis. This decision was based on two main considerations: (1) the impracticality of obtaining accurate anthropometric measurements in critically ill patients, and (2) the substantial confounding effect of acute pancreatitis–related β-cell dysfunction on insulin resistance indices (21–24).
Conclusion
To conclude, this study indicated that secondary diabetes is prevalent among AP patients. GV exerts a vital role in risk prediction for PPDM-A. Abnormal GV is the efficient way to stratify and manage risk, which can be used to predict the possibility of PPDM-A clinically. More prospective research is needed to clarify the mechanisms of GV promoting the incidence of PPDM-A and to determine whether GV interventions positively influences the improvement of clinical outcome.
Data availability statement
The raw data supporting the conclusions of this article will be made available by the authors, without undue reservation.
Ethics statement
Data were acquired based on Electronic Medical Record system (AP-Database), with an approval from the Institutional Review Board (2019NZKY-003-03). The studies were conducted in accordance with the local legislation and institutional requirements. The participants provided their written informed consent to participate in this study.
Author contributions
SQ: Conceptualization, Formal Analysis, Investigation, Writing – original draft. YL: Data curation, Methodology, Writing – review & editing. WW: Investigation, Writing – review & editing. WN: Investigation, Writing – review & editing. SZ: Investigation, Writing – review & editing. YX: Supervision, Writing – review & editing. PG: Funding acquisition, Investigation, Supervision, Writing – review & editing. WY: Supervision, Writing – review & editing. ZT: Conceptualization, Funding acquisition, Investigation, Methodology, Supervision, Writing – review & editing.
Funding
The author(s) declare financial support was received for the research and/or publication of this article. This work was supported by funding from the National Natural Science Foundation of China (No. 82270678and 82102275).
Conflict of interest
The authors declare that the research was conducted in the absence of any commercial or financial relationships that could be construed as a potential conflict of interest.
The reviewer LL declared a shared affiliation, with no collaboration, with one of the authors, YL, to the handling editor at the time of the review.
Publisher’s note
All claims expressed in this article are solely those of the authors and do not necessarily represent those of their affiliated organizations, or those of the publisher, the editors and the reviewers. Any product that may be evaluated in this article, or claim that may be made by its manufacturer, is not guaranteed or endorsed by the publisher.
Supplementary material
The Supplementary Material for this article can be found online at: https://www.frontiersin.org/articles/10.3389/fendo.2025.1501530/full#supplementary-material
References
1. Cho J, Scragg R, and Petrov MS. Risk of mortality and hospitalization after post-pancreatitis diabetes mellitus vs type 2 diabetes mellitus: a population-based matched cohort study. Am J Gastroenterol. (2019) 114:804–12. doi: 10.14309/ajg.0000000000000225
2. Cho J, Walia M, Scragg R, and Petrov MS. Frequency and risk factors for mental disorders following pancreatitis: a nationwide cohort study. Curr Med Res Opin. (2019) 35:1157–64. doi: 10.1080/03007995.2018.1560748
3. Cho J, Scragg R, and Petrov MS. Use of insulin and the risk of progression of pancreatitis: a population-based cohort study. Clin Pharmacol Ther. (2020) 107:580–7. doi: 10.1002/cpt.1644
4. Petrov MS. Diabetes of the exocrine pancreas: American Diabetes Association-compliant lexicon. Pancreatology. (2017) 17:523–6. doi: 10.1016/j.pan.2017.06.007
5. Pendharkar SA, Mathew J, Zhao J, Windsor JA, Exeter DJ, and Petrov MS. Ethnic and geographic variations in the incidence of pancreatitis and postpancreatitis diabetes mellitus in New Zealand: a nationwide populationbased study. New Zeal Med J. (2017) 130:55–68.
6. Das SLM, Singh PP, Phillips ARJ, Murphy R, Windsor JA, and Petrov MS. Newly diagnosed diabetes mellitus after acute pancreatitis: a systematic review and meta-analysis. Gut. (2014) 63:818–31. doi: 10.1136/gutjnl-2013-305062
7. Shen H-N, Yang C-C, Chang Y-H, Lu C-L, and Li C-Y. Risk of diabetes mellitus after first-attack acute pancreatitis: a national population-based study. Am J Gastroenterol. (2015) 110:1698–706. doi: 10.1038/ajg.2015.356
8. Bharmal SH, Cho J, Alarcon Ramos GC, Ko J, Stuart CE, Modesto AE, et al. Trajectories of glycaemia following acute pancreatitis: a prospective longitudinal cohort study with 24 months follow-up. J Gastroenterol. (2020) 55:775–88. doi: 10.1007/s00535-020-01682-y
9. Lv Y, Zhang J, Yang T, Sun J, Hou J, Chen Z, et al. Non-alcoholic fatty liver disease (NAFLD) is an independent risk factor for developing new-onset diabetes after acute pancreatitis: A multicenter retrospective cohort study in Chinese population. Front Endocrinol. (2022) 13:903731. doi: 10.3389/fendo.2022.903731
10. Ma J-H, Yuan Y-J, Lin S-H, and Pan J-Y. Nomogram for predicting diabetes mellitus after the first attack of acute pancreatitis. Eur J Gastroenterol Hepatol. (2019) 31:323–8. doi: 10.1097/MEG.0000000000001307
11. Wu D, Xu Y, Zeng Y, and Wang X. Endocrine pancreatic function changes after acute pancreatitis. Pancreas. (2011) 40:1006–11. doi: 10.1097/MPA.0b013e31821fde3f
12. Ho T-W, Wu J-M, Kuo T-C, Yang C-Y, Lai H-S, Hsieh S-H, et al. Change of both endocrine and exocrine insufficiencies after acute pancreatitis in non-diabetic patients: a nationwide population-based study. Medicine. (2015) 94:e1123. doi: 10.1097/MD.0000000000001123
13. Lee Y-K, Huang M-Y, Hsu C-Y, and Su Y-C. Bidirectional relationship between diabetes and acute pancreatitis: a population-based cohort study in Taiwan. Medicine. (2016) 95:e2448. doi: 10.1097/MD.0000000000002448
14. Petrov MS. Panorama of mediators in postpancreatitis diabetes mellitus. Curr Opin Gastroenterol. (2020) 36:443–51. doi: 10.1097/MOG.0000000000000654
15. Gillies NA, Pendharkar SA, Singh RG, Asrani VM, and Petrov MS. Lipid metabolism in patients with chronic hyperglycemia after an episode of acute pancreatitis. Diabetes Metab Syndr. (2017) 11:S233–S41. doi: 10.1016/j.dsx.2016.12.037. doi: 10.1097/MPA.0000000000000738.
16. Yuan L, Tang M, Huang L, Gao Y, and Li X. Risk factors of hyperglycemia in patients after a first episode of acute pancreatitis: a retrospective cohort. Pancreas. (2017) 46:209–18. doi: 10.1097/MPA.0000000000000738
17. Wu BU, Batech M, Quezada M, Lew D, Fujikawa K, Kung J, et al. Dynamic measurement of disease activity in acute pancreatitis: the pancreatitis activity scoring system. Am J Gastroenterol. (2017) 112:1144–52. doi: 10.1038/ajg.2017.114
18. Bharmal SH, Cho J, Ko J, and Petrov MS. Glucose variability during the early course of acute pancreatitis predicts two-year probability of new-onset diabetes: A prospective longitudinal cohort study. United Eur Gastroenterol J. (2022) 10:179–89. doi: 10.1002/ueg2.12190
19. Mendez CE, Mok K-T, Ata A, Tanenberg RJ, Calles-Escandon J, and Umpierrez GE. Increased glycemic variability is independently associated with length of stay and mortality in noncritically ill hospitalized patients. Diabetes Care. (2013) 36:4091–7. doi: 10.2337/dc12-2430
20. Akirov A, Shochat T, Dotan I, Diker-Cohen T, Gorshtein A, and Shimon I. Glycemic variability and mortality in patients hospitalized in general surgery wards. Surgery. (2019) 166:184–92. doi: 10.1016/j.surg.2019.02.022
21. American Diabetes Association. Standards of medical care in diabetes-2021 abridged for primary care providers. Clin Diabetes. (2021) 39:14–43. doi: 10.2337/cd21-as01
22. Petrov MS and Yadav D. Global epidemiology and holistic prevention of pancreatitis. Nat Rev Gastroenterol Hepatol. (2019) 16:175–84. doi: 10.1038/s41575-018-0087-5
23. Dang J, Chen T, Ma N, Liu Y, Zhong P, Shi D, et al. Associations between breastfeeding duration and obesity phenotypes and the offsetting effect of a healthy lifestyle. Nutrients. (2022) 14:1999. doi: 10.3390/nu14101999
24. Gallagher EJ, Le Roith D, and Bloomgarden Z. Review of hemoglobin A(1c) in the management of diabetes. J Diabetes. (2009) 1:9–17. doi: 10.1111/j.1753-0407.2009.00009.x
25. Banks PA, Bollen TL, Dervenis C, Gooszen HG, Johnson CD, Sarr MG, et al. Classification of acute pancreatitis—2012: revision of the Atlanta classification and definitions by international consensus. Gut. (2013) 62:102–11. doi: 10.1136/gutjnl-2012-302779
26. American Diabetes A. Classification and diagnosis of diabetes: standards of medical care in diabetes—2021. Diabetes Care. (2021) 44:S15–33. doi: 10.2337/dc21-S002
27. Arias-Córdova Y, Ble-Castillo JL, García-Vázquez C, Olvera-Hernández V, Ramos-García M, Navarrete-Cortes A, et al. Resistant starch consumption effects on glycemic control and glycemic variability in patients with type 2 diabetes: A randomized crossover study. Nutrients. (2021) 13:4052. doi: 10.3390/nu13114052
28. Zhou J, Jia WP, Yu M, Yu HY, Bao YQ, Ma XJ, et al. The reference values of glycemic parameters for continuous glucose monitoring and its clinical application. Zhonghua Nei Ke Za Zhi. (2007) 46:189–92.
29. Woodmansey C, McGovern AP, McCullough KA, Whyte MB, Munro NM, Correa AC, et al. Incidence, demographics, and clinical characteristics of diabetes of the exocrine pancreas (type 3c): a retrospective cohort study. Diabetes Care. (2017) 40:1486–93. doi: 10.2337/dc17-0542
30. Petrov MS. Post-pancreatitis diabetes mellitus: investigational drugs in preclinical and clinical development and therapeutic implications. Expert Opin Investig Drugs. (2021) 30:737–47. doi: 10.1080/13543784.2021.1931118
31. Jivanji CJ, Asrani VM, Windsor JA, and Petrov MS. New-onset diabetes after acute and critical illness: a systematic review. Mayo Clinic Proc. (2017) 92:762–73. doi: 10.1016/j.mayocp.2016.12.020
32. Tu J, Yang Y, Zhang J, Yang Q, Lu G, Li B, et al. Effect of the disease severity on the risk of developing new-onset diabetes after acute pancreatitis. Medicine. (2018) 97:e10713. doi: 10.1097/MD.0000000000010713
33. Tu J, Zhang J, Ke L, Yang Y, Yang Q, Lu G, et al. Endocrine and exocrine pancreatic insufficiency after acute pancreatitis: long-term follow-up study. BMC Gastroenterol. (2017) 17:114. doi: 10.1186/s12876-017-0663-0
34. Zhi M, Zhu X, Lugea A, Waldron RT, Pandol SJ, and Li L. Incidence of new onset diabetes mellitus secondary to acute pancreatitis: a systematic review and meta-analysis. Front Physiol. (2019) 10:637. doi: 10.3389/fphys.2019.00637
35. Lv Y, Lu X, Liu G, Qi L, Zhong Z, Wang X, et al. Differential diagnosis of post pancreatitis diabetes mellitus based on pancreatic and gut hormone characteristics. J Clin Endocrinol Metab. (2024) 109:2003–11. doi: 10.1210/clinem/dgae080
36. Shivaprasad C, Aiswarya Y, Kejal S, Sridevi A, Anupam B, Ramdas B, et al. Comparison of CGM-derived measures of glycemic variability between pancreatogenic diabetes and type 2 diabetes mellitus. J Diabetes Sci Technol. (2021) 15:134–40. doi: 10.1177/1932296819860133
37. Ruxer J, Mozdzan M, Loba J, Barański M, Ruxer M, and Markuszewski L. Usefulness of continuous glucose monitoring system in detection of hypoglycaemic episodes in patients with diabetes in course of chronic pancreatitis. Pol Arch Med Wewn. (2005) 114:953–7.
38. Siebel AL, Fernandez AZ, and El-Osta A. Glycemic memory associated epigenetic changes. Biochem Pharmacol. (2010) 80:1853–9. doi: 10.1016/j.bcp.2010.06.005
39. Monnier L, Mas E, Ginet C, Michel F, Villon L, Cristol J-P, et al. Activation of oxidative stress by acute glucose fluctuations compared with sustained chronic hyperglycemia in patients with type 2 diabetes. Jama. (2006) 295:1681–7. doi: 10.1001/jama.295.14.1681
40. Di Flaviani A, Picconi F, Di Stefano P, Giordani I, Malandrucco I, Maggio P, et al. Impact of glycemic and blood pressure variability on surrogate measures of cardiovascular outcomes in type 2 diabetic patients. Diabetes Care. (2011) 34:1605–9. doi: 10.2337/dc11-0034
41. Nishikawa T, Edelstein D, Du XL, Yamagishi S-i, Matsumura T, Kaneda Y, et al. Normalizing mitochondrial superoxide production blocks three pathways of hyperglycaemic damage. Nature. (2000) 404:787–90. doi: 10.1038/35008121
42. Lou Q, Yuan X, Hao S, Miller JD, Yan J, Zuo P, et al. Effects of glucose fluctuation targeted intervention on the prognosis of patients with type 2 diabetes following the first episode of cerebral infarction. J Diabetes Res. (2022) 13:858912. doi: 10.1155/2020/2532171
43. Wang S, Tan Z, Wu T, Shen Q, Huang P, Wang L, et al. Largest amplitude of glycemic excursion calculating from self-monitoring blood glucose predicted the episodes of nocturnal asymptomatic hypoglycemia detecting by continuous glucose monitoring in outpatients with type 2 diabetes. Front Endocrinol (Lausanne). (2022) 13:858912. doi: 10.3389/fendo.2022.858912
44. Zhou H, Wang W, Shen Q, Feng Z, Zhang Z, Lei H, et al. Time in range, assessed with continuous glucose monitoring, is associated with brachial-ankle pulse wave velocity in type 2 diabetes: A retrospective single-center analysis. Front Endocrinol (Lausanne). (2022) 13:1014568. doi: 10.3389/fendo.2022.1014568
45. Zrnić IK, Milić S, Fisić E, Radić M, and Stimac D. C-reactive protein and lactate dehydrogenase as single prognostic factors of severity in acute pancreatitis. Lijec Vjesn. (2007) 129:1–4.
46. Gillies N, Pendharkar SA, Asrani VM, Mathew J, Windsor JA, and Petrov MS. Interleukin-6 is associated with chronic hyperglycemia and insulin resistance in patients after acute pancreatitis. Pancreatology. (2016) 16:748–55. doi: 10.1016/j.pan.2016.06.661
47. Senn JJ, Klover PJ, Nowak IA, and Mooney RA. Interleukin-6 induces cellular insulin resistance in hepatocytes. Diabetes. (2002) 51:3391–9. doi: 10.2337/diabetes.51.12.3391
48. Rotter V, Nagaev I, and Smith U. Interleukin-6 (IL-6) induces insulin resistance in 3T3-L1 adipocytes and is, like IL-8 and tumor necrosis factor-α, overexpressed in human fat cells from insulin-resistant subjects. J Biol Chem. (2003) 278:45777–84. doi: 10.1074/jbc.M301977200
49. Senn JJ, Klover PJ, Nowak IA, Zimmers TA, Koniaris LG, Furlanetto RW, et al. Suppressor of cytokine signaling-3 (SOCS-3), a potential mediator of interleukin-6-dependent insulin resistance in hepatocytes. J Biol Chem. (2003) 278:13740–6. doi: 10.1074/jbc.M210689200
50. Dasu MR, Devaraj S, Zhao L, Hwang DH, and Jialal I. High glucose induces toll-like receptor expression in human monocytes: mechanism of activation. Diabetes. (2008) 57:3090–8. doi: 10.2337/db08-0564
51. Youssef-Elabd EM, McGee KC, Tripathi G, Aldaghri N, Abdalla MS, Sharada HM, et al. Acute and chronic saturated fatty acid treatment as a key instigator of the TLR-mediated inflammatory response in human adipose tissue, in vitro. J Nutr Biochem. (2012) 23:39–50. doi: 10.1016/j.jnutbio.2010.11.003
52. Salimi S, Lewis JP, Yerges-Armstrong LM, Mitchell BD, Saeed F, O’Connell JR, et al. Clopidogrel improves skin microcirculatory endothelial function in persons with heightened platelet aggregation. J Am Heart Assoc. (2016) 5:e003751. doi: 10.1161/JAHA.116.003751
Keywords: acute pancreatitis, post-acute pancreatitis diabetes mellitus, glucose variability, risk stratification, largest amplitude of glycemic excursions
Citation: Qian S, Liu Y, Wang W, Ni W, Zhao S, Xu Y, Gu P, Yu W and Tong Z (2025) Risk stratification and predictive value of glucose variability for the development of post-acute pancreatitis diabetes mellitus. Front. Endocrinol. 16:1501530. doi: 10.3389/fendo.2025.1501530
Received: 25 September 2024; Accepted: 13 November 2025; Revised: 07 November 2025;
Published: 01 December 2025.
Edited by:
Prof. Dr. med. Peter C Ambe, Witten/Herdecke University, GermanyReviewed by:
Brittany Bruggeman, University of Florida, United StatesLing Li, Southeast University, China
Ahmed E. Sherif, University of Edinburgh, United Kingdom
Copyright © 2025 Qian, Liu, Wang, Ni, Zhao, Xu, Gu, Yu and Tong. This is an open-access article distributed under the terms of the Creative Commons Attribution License (CC BY). The use, distribution or reproduction in other forums is permitted, provided the original author(s) and the copyright owner(s) are credited and that the original publication in this journal is cited, in accordance with accepted academic practice. No use, distribution or reproduction is permitted which does not comply with these terms.
*Correspondence: Zhihui Tong, bmp6eWFudG9sQGhvdG1haWwuY29t; Wenkui Yu, eXVkcm5qMkAxNjMuY29t; Ping Gu, Z3VwaW5nQG5qdS5lZHUuY24=
†These authors have contributed equally to this work