 Cheng Huang
 Yuhang Zhang
 Xiaoqing Yang3
 Zhichao Gao
- 1Department of Colorectal Surgery, First People’s Hospital of Xiaoshan District, Hangzhou, Zhejiang, China
- 2Department of Orthopedics, First People’s Hospital of Xiaoshan District, Hangzhou, Zhejiang, China
- 3Department of Endocrinology, First People’s Hospital of Xiaoshan District, Hangzhou, Zhejiang, China
- 4Department of Neurosurgery, First People’s Hospital of Xiaoshan District, Hangzhou, Zhejiang, China
Background: Prediabetes is a critical precursor to type 2 diabetes and poses an increasing global health challenge, particularly in China. While many individuals with prediabetes can revert to normoglycemia through lifestyle interventions, the impact of non-traditional lipid parameters on this process requires further investigation. Understanding the associations between these lipid parameters and glycemic recovery could inform more effective prevention strategies.
Methods: This study analyzed data from the Dryad public database, focusing on a cohort of 14,735 Chinese adults with prediabetes. Multivariate logistic regression models assessed the association between twelve lipid parameters and normoglycemia. Two-piecewise logistic regression was used to identify inflection points. Stratified and sensitivity analyses were conducted by age, sex, BMI, and family history of diabetes. The Area Under the Curve was calculated to compare predictive performance.
Results: During a mean follow-up of 2.94 years, 6,406 out of 14,735 participants with prediabetes (56.53%) reverted to normoglycemia. Multivariate logistic regression showed that lower levels of the atherogenic index of plasma (AIP), remnant cholesterol (RC), RC/HDL-C ratio, and LDL-C, as well as higher HDL-C, were significantly associated with a higher likelihood of normoglycemia. Except for HDL-C, all lipid parameters showed non-linear relationships with normoglycemia. While all lipid indices displayed modest discriminative ability (AUC > 0.5), AIP demonstrated the highest area under the curve (AUC = 0.579, 95% CI: 0.569–0.588). Subgroup and sensitivity analyses confirmed stronger associations in females, younger individuals (< 50 years), and those with lower BMI (< 24 kg/m²).
Conclusion: AIP, RC, and the RC/HDL-C ratio were strongly associated with reversion to normoglycemia among Chinese adults with prediabetes. AIP showed the strongest and most consistent relationship, especially in younger females with lower BMI.
1 Introduction
Prediabetes, characterized by intermediate hyperglycemia, serves as a critical precursor to diabetes and cardiovascular complications (1). Globally, the prevalence of prediabetes among adults reached 5.8% in 2021 and is projected to rise to 6.5% by 2045 (2). In China, this condition presents an even greater public health challenge: while the national diabetes prevalence stands at 12.8%, a staggering 35.2% of the population is classified as prediabetic (3). This metabolic state is highly dynamic. Up to 37% of untreated prediabetes cases may progress to type 2 diabetes within four years, but early intervention to restore normoglycemia can substantially reduce cardiovascular risks (4, 5). Restoring blood glucose levels to normal can significantly reduce the future incidence of chronic cardiovascular disease (6). However, there is limited research on similar topics. This reversibility highlights the urgent need to identify modifiable predictors of glycemic recovery.
Dyslipidemia frequently coexists with prediabetes, and elevated low-density lipoprotein cholesterol (LDL-C) and triglycerides (TG) being well-documented risk factors (7, 8). Currently, non-traditional lipid parameters—including the atherogenic index of plasma (AIP), non-HDL-C/HDL-C ratio, and total cholesterol (TC)/HDL-C ratio—may provide superior predictive value for dysglycemia progression (9–13). However, their specific roles in predicting the reversal of prediabetes remain underexplored. This is a clinically vital distinction given the divergent management goals between disease prevention and regression. Notably, recent studies indicate that reductions in remnant cholesterol (RC) and non-HDL-C/HDL-C ratio correlate with prediabetes regression to normoglycemia,implying these parameters may serve as both biomarkers and therapeutic targets (14, 15). Only a few studies have examined the restoration of normoglycemia in pre-diabetic patients, and there has been no systematic evaluation of unconventional lipid parameters in this context. As a result, it remains unclear which parameters are the best predictors.
We hypothesize that specific non-traditional lipid parameters have varying predictive capacities for normoglycemia restoration in prediabetes Chinese adults. In contrast to previous studies, the present research aims to identify the best predictors by systematically assessing the role of 12 lipid parameters in reversing prediabetes.
2 Methods
2.1 Data sources and study population
This study is a retrospective analysis. This study obtained approval from the Rich Healthcare Group Review Board, and the data were collected retrospectively. The data has been uploaded to the open-access database Dryad (16). This dataset recorded the health examination information of personnel from the Rich Healthcare Group from 2010 to 2016. The dataset includes 211,833 individuals and was gathered from 2010 to 2016 across numerous regions in China. At baseline, the original study excluded participants for the following reasons: 103,946 individuals lacked available measurements for weight and height; 1 participant had no information on gender; 152 individuals presented extreme body mass index (BMI) values (either < 15 kg/m² or > 55 kg/m²); and 31,370 participants did not have fasting plasma glucose values available. Additionally, we excluded participants who had visit intervals shorter than two years (n = 324,233) and those diagnosed with diabetes, which included 2,997 individuals identified through self-report and 4,115 individuals with a fasting plasma glucose level of ≥ 7.0 mmol/L. The researchers also excluded participants with an undefined diabetes status at follow-up (n = 6,630). Ultimately, a total of 211,833 participants were included in the original analysis. According to the research objectives, we performed a secondary selection of the population. Participants with fasting plasma glucose (FPG) levels outside the range of 5.6–6.9 mmol/L (n = 185,815) were excluded from the study. Those with missing data on HDL-C, total cholesterol (TC), LDL-C, TG, or FPG were also excluded (n = 10,631). In addition, participants whose values for any non-traditional lipid parameters exceeded three standard deviations from the mean were omitted (n = 652). Ultimately, 14,735 participants were included in the final analysis (8,329 males and 6,406 females) (Figure 1).
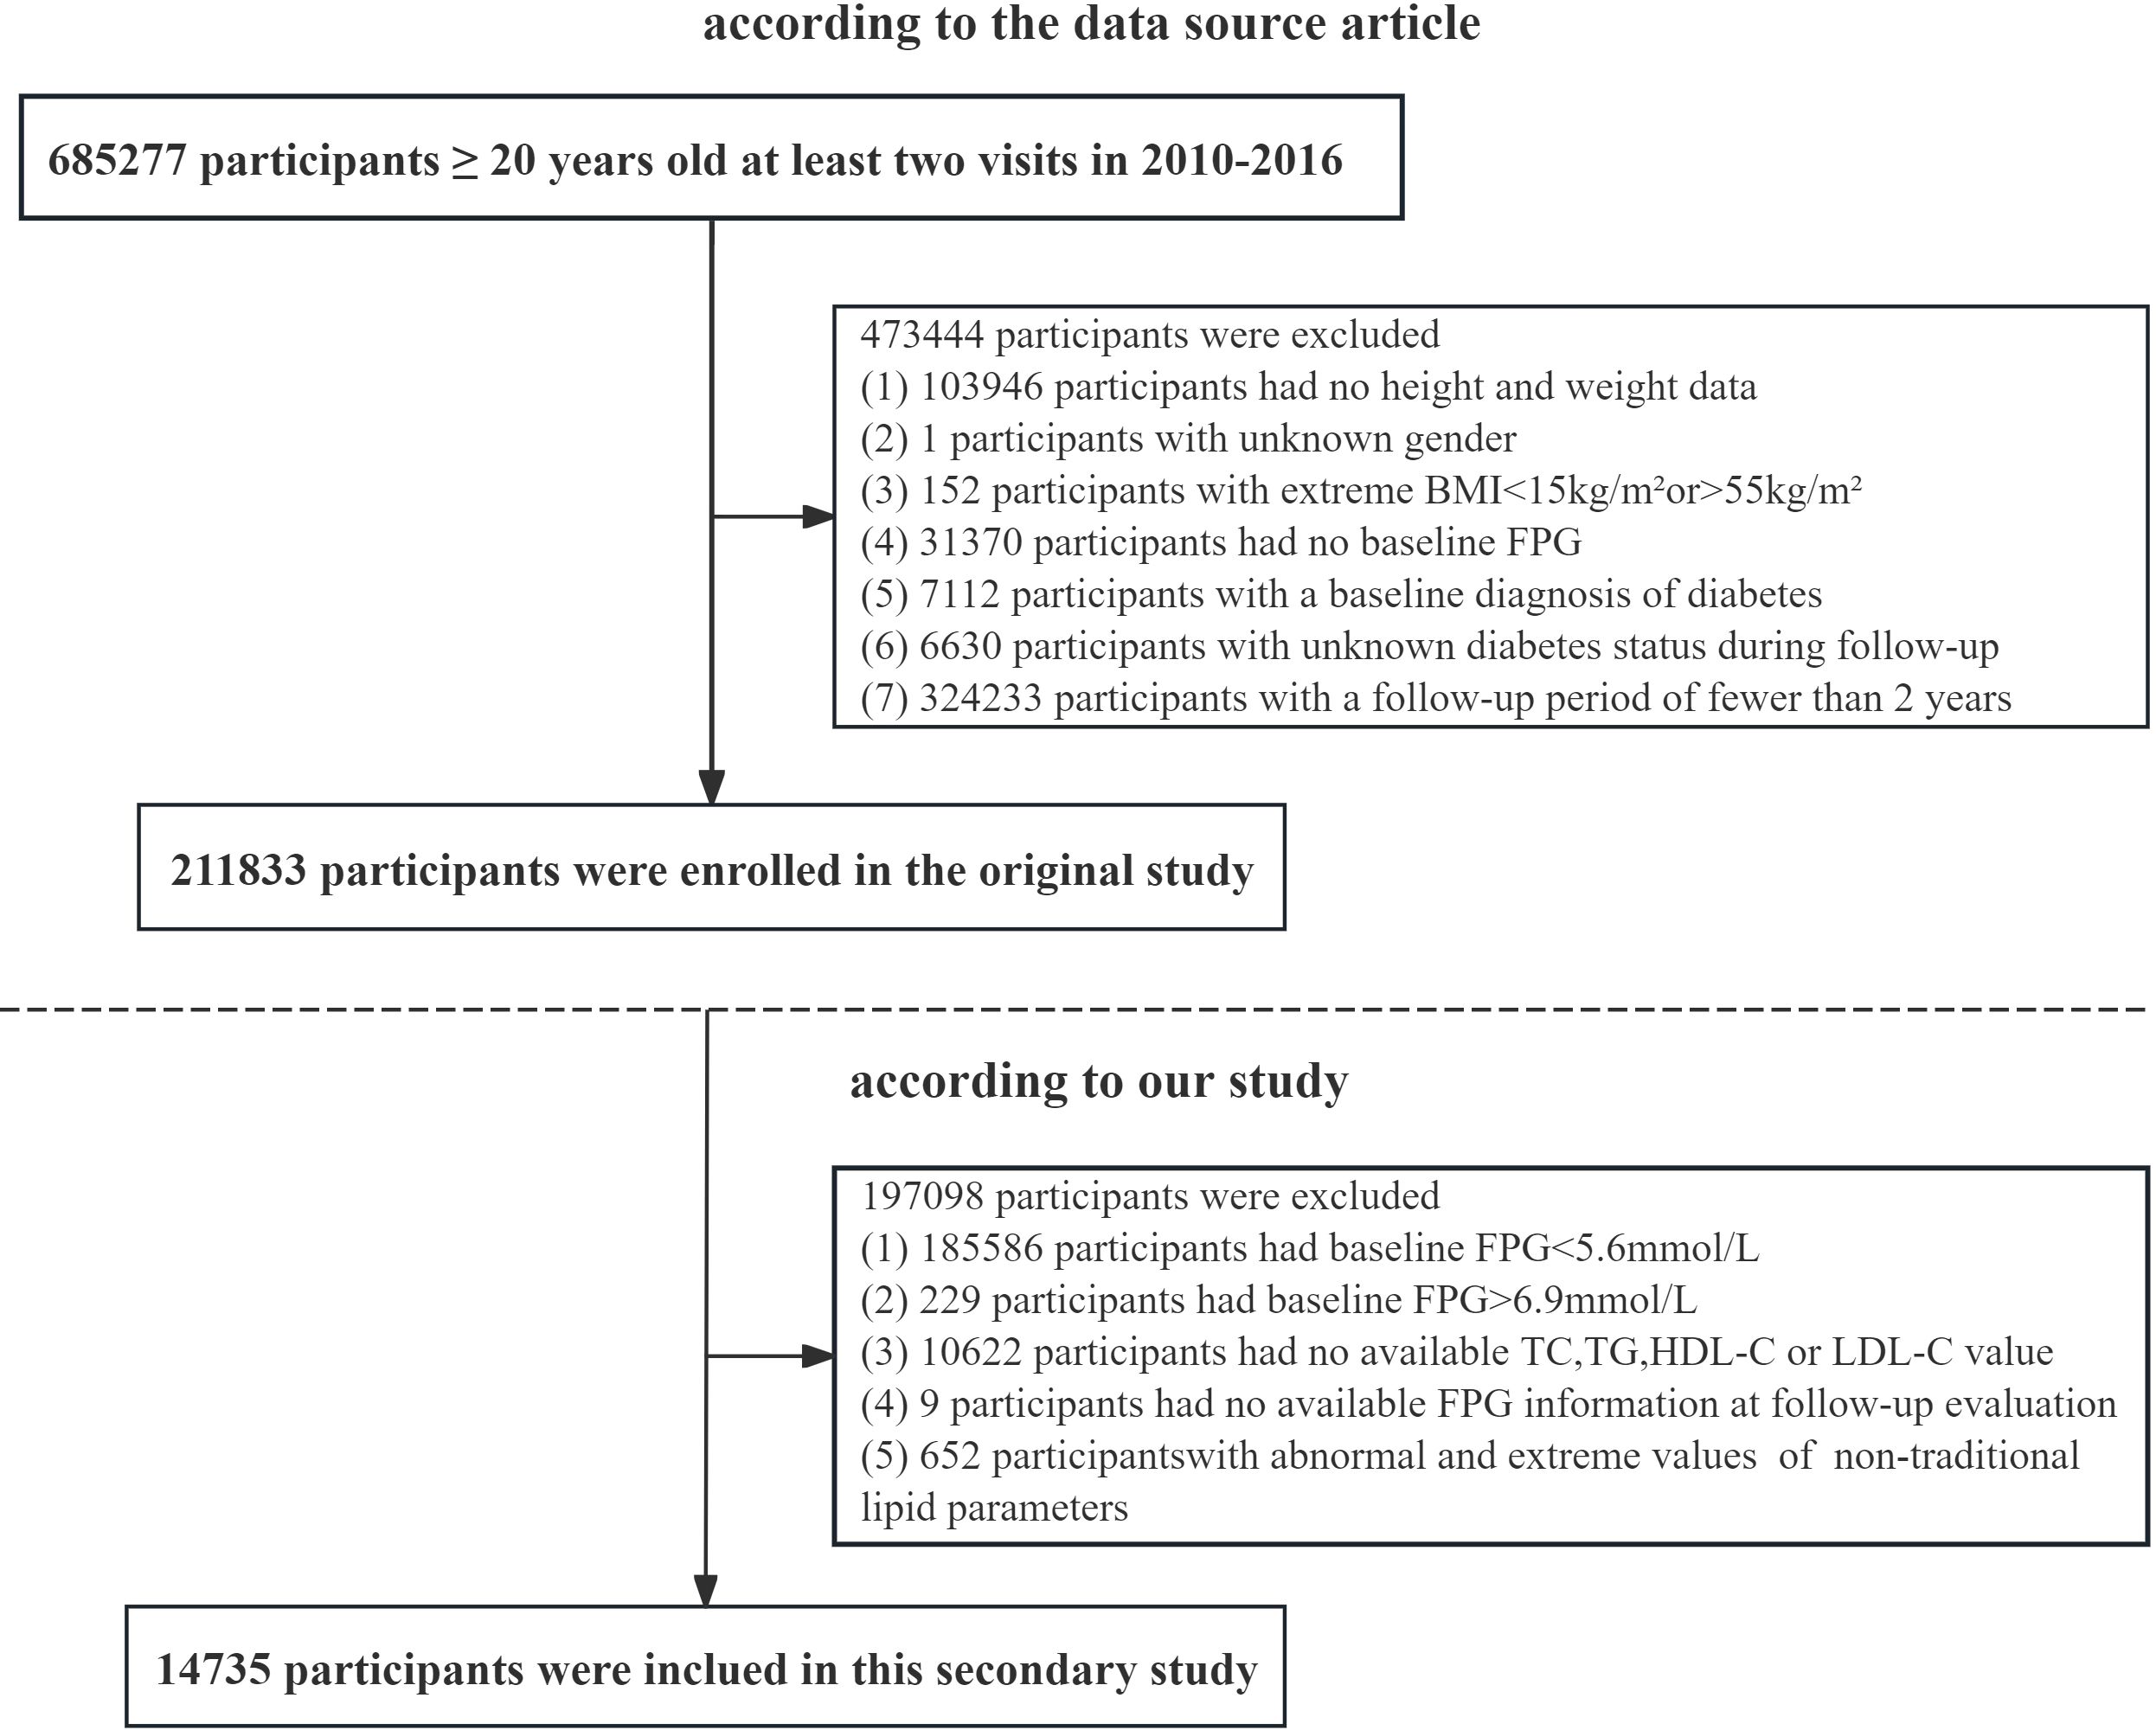
Figure 1. Flow chart of study participants.
2.2 Data collection
At each visit, participants underwent a structured health evaluation that included questionnaire-based and physical measurement components. The baseline assessment included a comprehensive questionnaire designed to elicit detailed information about personal medical history, participants’ lifestyle habits, demographic characteristics, and family history of diabetes. Physical measurements taken during each visit included blood pressure, height and weight. Additionally, information on smoking and alcohol consumption habits was collected at the beginning of the study. Participants were classified into one of three categories for each habit: current user, former user, or never user. Blood samples were obtained from each participant after they had fasted for a minimum of 10 hours. Blood samples were subsequently analyzed for a range of biochemical parameters, including HDL-C, FPG, TC, TG, LDL-C, and additional metabolic markers. Biochemical analyses were performed using a Beckman 5800 autoanalyzer, ensuring consistency and reliability of the results (16).
RC/HDL-C ratio = RC/HDL-C (17);
Non-HDL-C = TC − HDL-C (18).
Castelli’s index-II (CRI-II) is defined as the ratio of LDL-C to HDL-C (19);
Castelli’s index-I (CRI-I) is calculated as the ratio of TC to HDL-C (19);
Atherogenic coefficient (AC) is calculated as the ratio of non-HDL-C to HDL-C (10);
Lipoprotein combine index (LCI) = (TC × TG × LDL-C)/HDL-C (20);
AIP = lg (TG/HDL-C) (13);
remnant cholesterol (RC) = TC − HDL-C − LDL-C (21);
2.3 Definitions
According to the 2018 American Diabetes Association criteria, participants with FPG levels from 5.6 to 6.9 mmol/L are classified as having prediabetes (22). During the follow-up period, participants with FPG levels below 5.6 mmol/L who did not self-report a diagnosis of diabetes were categorized into the Normoglycemia group. Individuals whose FPG exceeds 5.6 mmol/L during the follow-up period will be categorized into the hyperglycemia group. Dyslipidemia was identified by any of the following criteria: TG ≥ 150 mg/dL, TC ≥ 200 mg/dL, HDL-C < 50 mg/dL in women or < 40 mg/dL in men, or LDL-C ≥ 130 mg/dL. Additionally, participants who were receiving lipid-lowering therapy were considered to have dyslipidemia (23).
2.4 Statistical analysis
Categorical variables were depicted using frequency counts and percentages. Continuous variables were expressed as mean (standard deviation) or median (interquartile range). The ANOVA and Kruskal-Wallis tests were utilized to evaluate the differences in continuous variables across various groups, while the chi-square test was employed to assess categorical variables.To address concerns regarding collinearity among the covariates, we calculated the variance inflation factor (VIF) in the multivariate models (24). Variables with a VIF exceeding a certain threshold (> 5) were deemed to exhibit collinearity. The VIF of all variables included in this study is less than 5 (Supplementary Table S1). Multiple imputation methods were employed to handle missing data, aiming to minimize the variability introduced by the absence of certain variables (25). Multivariate logistic regression model analysis the likelihood of reverting to normoglycemia in participants with prediabetes. Model 1 was calculated without adjusting for covariates. Model 2 further adjusted age, sex, SBP, DBP, BMI, family history of diabetes, and lifestyle habits (smoking and alcohol status). Model 3 further adjusted FPG, aminotransferase (ALT and AST), blood urea nitrogen (BUN), and serum creatinine (Scr) based on model 2. The variables adjusted in the multivariate logistic regression model were guided by clinical knowledge and previously published research (15, 26, 27). After adjusting for all covariates, All lipid parameters were converted into quartiles. Furthermore, a generalized additive model was used to examine the dose-response relationship between lipid parameters and normoglycemia, as well as any potential inflection points. Subsequently, we plotted Receiver Operating Characteristic (ROC) curves for each subgroup. In order to evaluate the predictive performance of each non-traditional lipid parameter, we further calculated the Area Under the Curve (AUC) to evaluate the predictive performance of each non-traditional lipid parameter. Stratified and sensitivity analyses were conducted based on age, sex, BMI, and family history of diabetes. To validate the robustness of the primary outcomes across different populations, individuals with dyslipidemia were excluded. Analyses were performed using EmpowerStats software. A two-tailed P value of less than 0.05 was deemed statistically significant.
3 Results
3.1 Baseline characteristics of participants
The final cohort comprised 14,735 prediabetic Chinese adults (mean age 50.91 ± 13.51 years; 64.3% male). Within an average follow-up period of 2.94 years, 6,406 participants (56.53%) reverted to normoglycemia. Compared to those who remained hyperglycemic, individuals achieving normoglycemia were significantly younger (47.49 ± 13.39 vs. 53.54 ± 13.01 years, P < 0.001) and more likely to be female (39.92% vs. 32.45%, P < 0.001). They also exhibited lower BMI (24.16 ± 3.27 vs. 25.25 ± 3.27 kg/m²), SBP (124.11 ± 16.99 vs. 129.99 ± 17.78 mmHg), and DBP (76.68 ± 10.87 vs. 79.75 ± 11.24 mmHg; all P < 0.001). All traditional and non-traditional lipid parameters (including TC, TG, LDL-C, LCI, AIP, RC, and RC/HDL-C ratio) were significantly lower in the normoglycemic group (P < 0.001), while HDL-C levels were higher (1.37 ± 0.29 vs. 1.33 ± 0.28 mmol/L, P < 0.001) (Table 1).
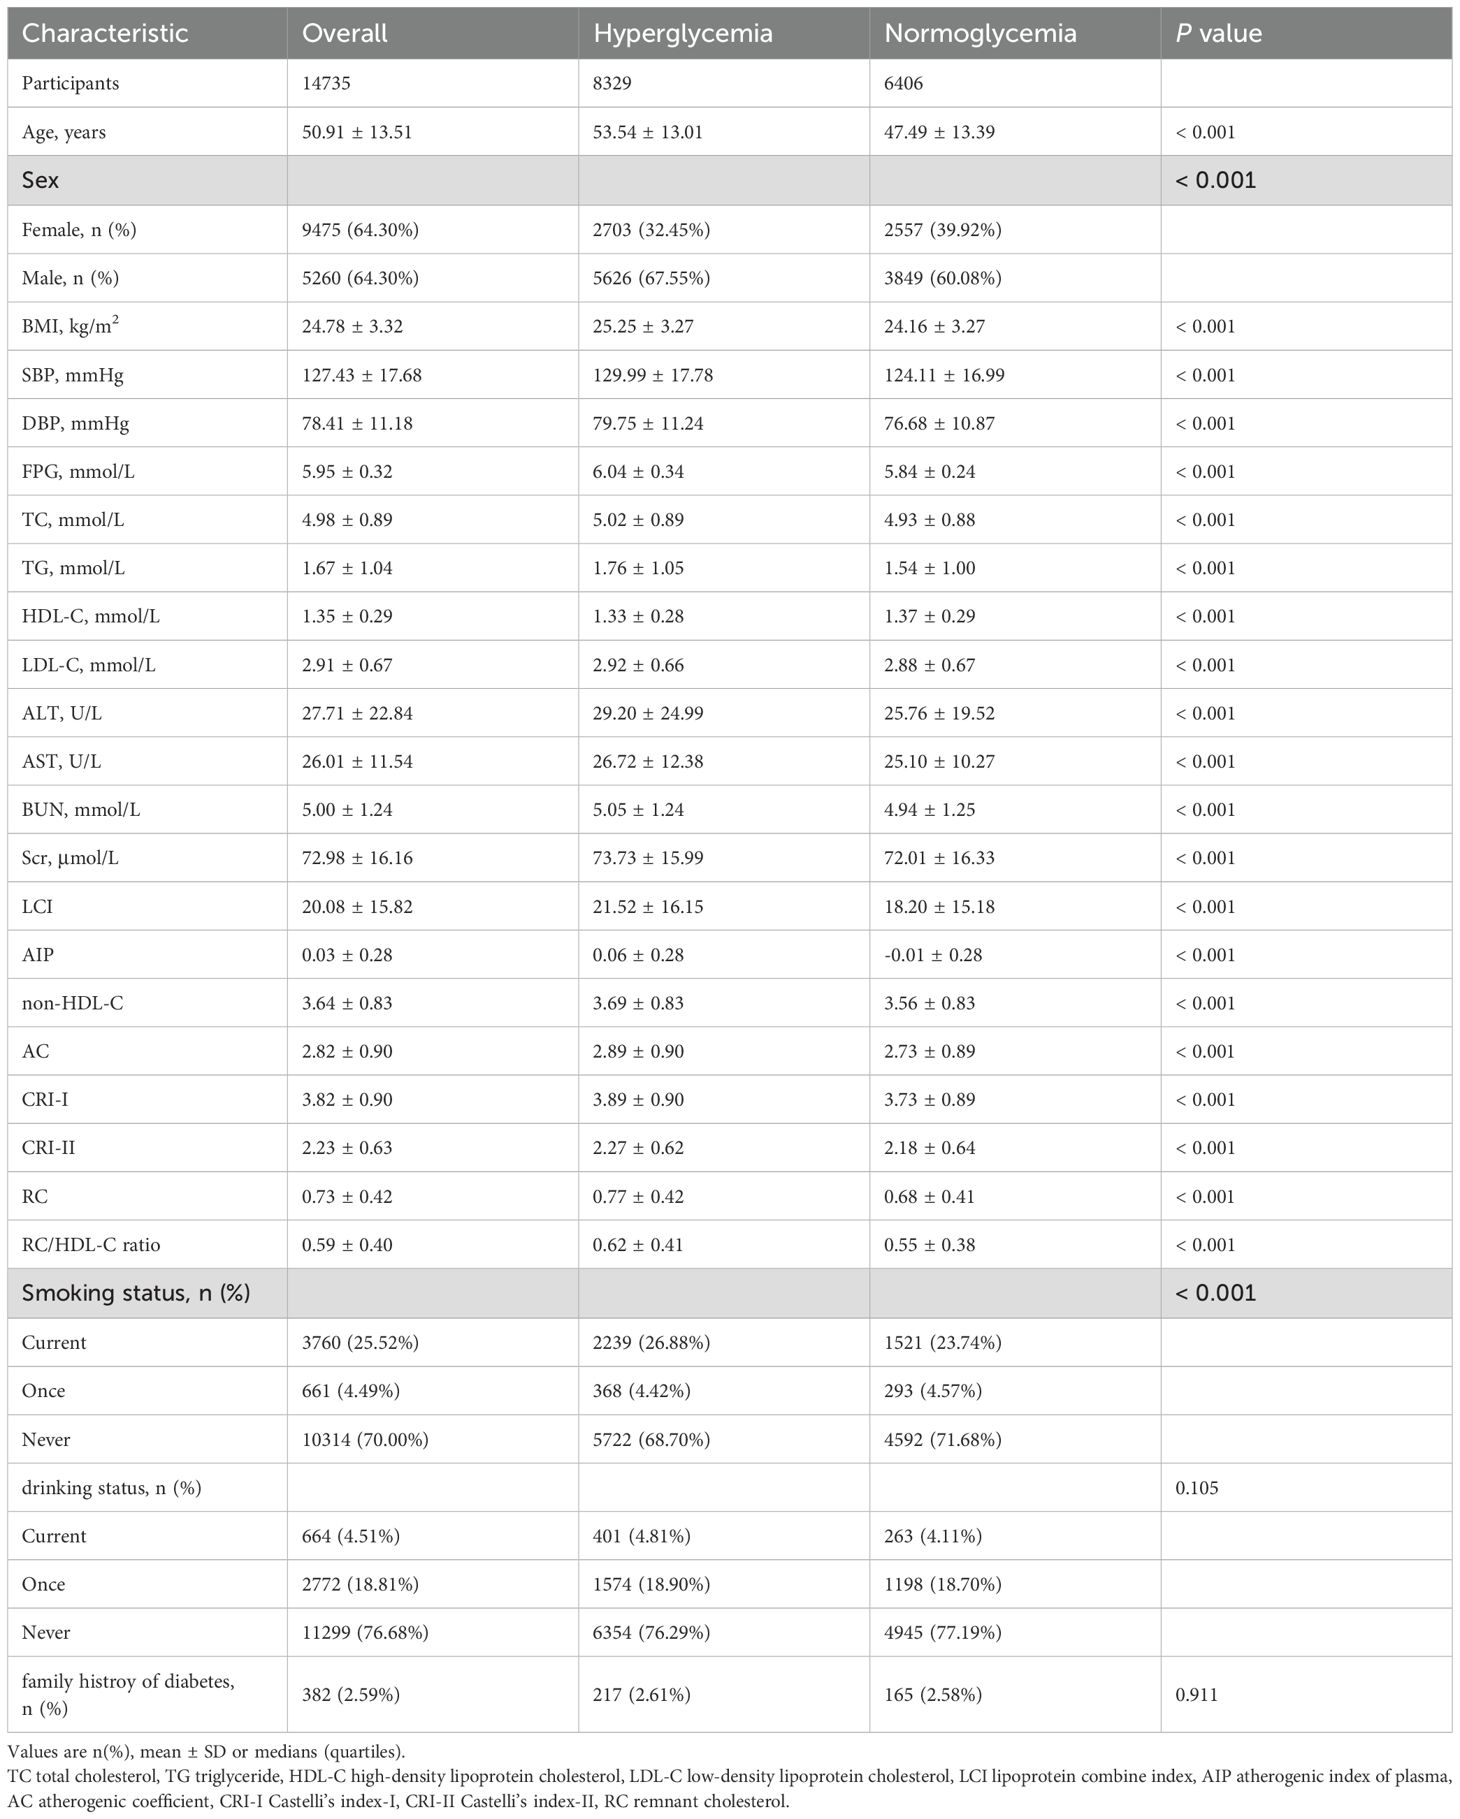
Table 1. Baseline characteristics of participants.
3.2 Relationship between lipid parameters and normoglycemia
Multivariate logistic regression identified AIP, RC, RC/HDL-C ratio, HDL-C, and LDL-C as significant predictors of normoglycemia after adjusting for covariates (Table 2). In Model 1 (unadjusted), all lipid parameters were significantly associated with normoglycemia. However, after adjustment for demographic characteristics, family history of diabetes, and lifestyle habits in Model 2, the associations for CRI-II and non-HDL-C became non-significant after adjustment (P > 0.05). In Model 3, which adjusted for all variables, AIP, RC, the RC/HDL-C ratio, HDL-C, and LDL-C maintained significant associations with normoglycemia. Specifically, an increase in AIP by one unit was associated with reductions of 61.0%, 30.7%, and 15.8% in the odds of reverting to normoglycemia in Models 1, 2, and 3, respectively. Higher levels of RC decreased the odds by 12.0% (OR 0.880, 95% CI: 0.805–0.962), while the RC/HDL-C ratio was associated with a 13.4% lower odds (OR 0.866, 95% CI: 0.788–0.951). Conversely, HDL-C saw nearly doubled odds with each unit increase (OR 1.915, 95% CI: 1.759–2.085), and LDL-C paradoxically increased the odds (OR 1.056, 95% CI: 1.017–1.097). Notably, the associations for CRI-II and non-HDL-C became non-significant after adjusting for demographic and clinical factors (P > 0.05). Figure 2 illustrates that both RC and the RC/HDL-C ratio consistently displayed negative associations with glucose recovery across quartiles. Furthermore, elevated AIP related to a decreased probability of achieving normoglycemia, particularly at moderate to high levels (P < 0.05).
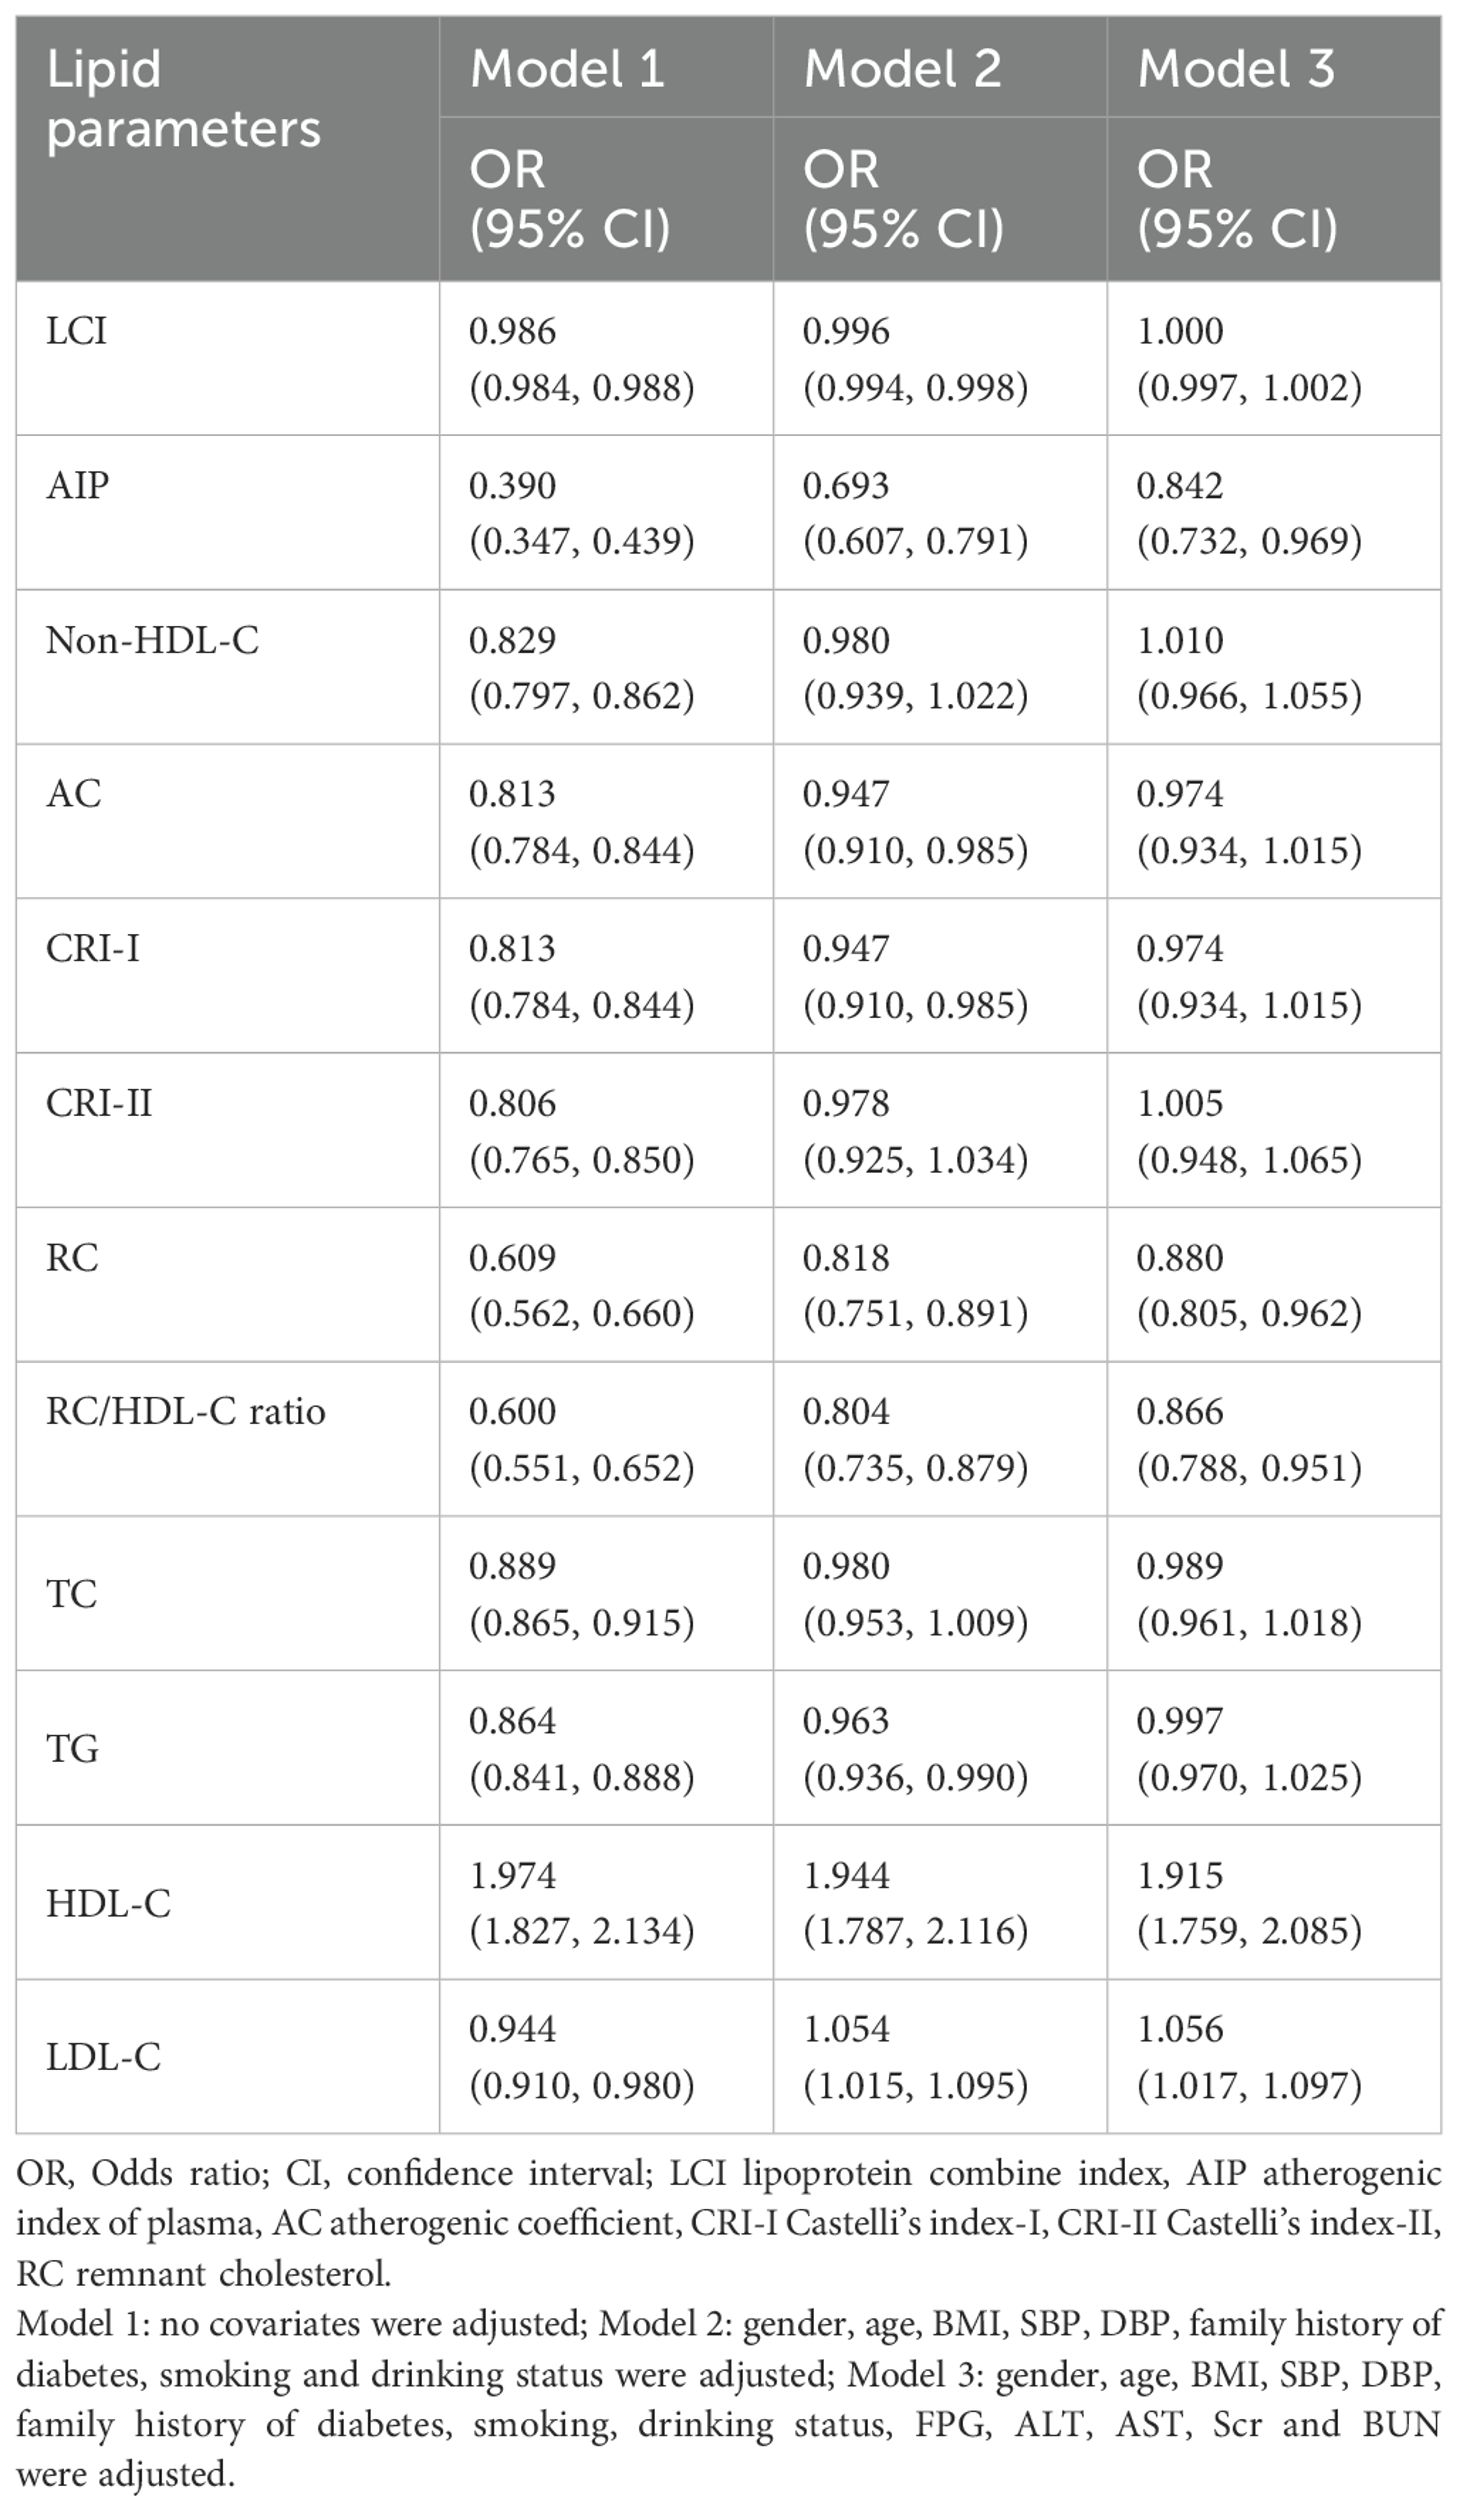
Table 2. Multivariate logistic regression analyses of the relationship between lipid parameters and normoglycemia.
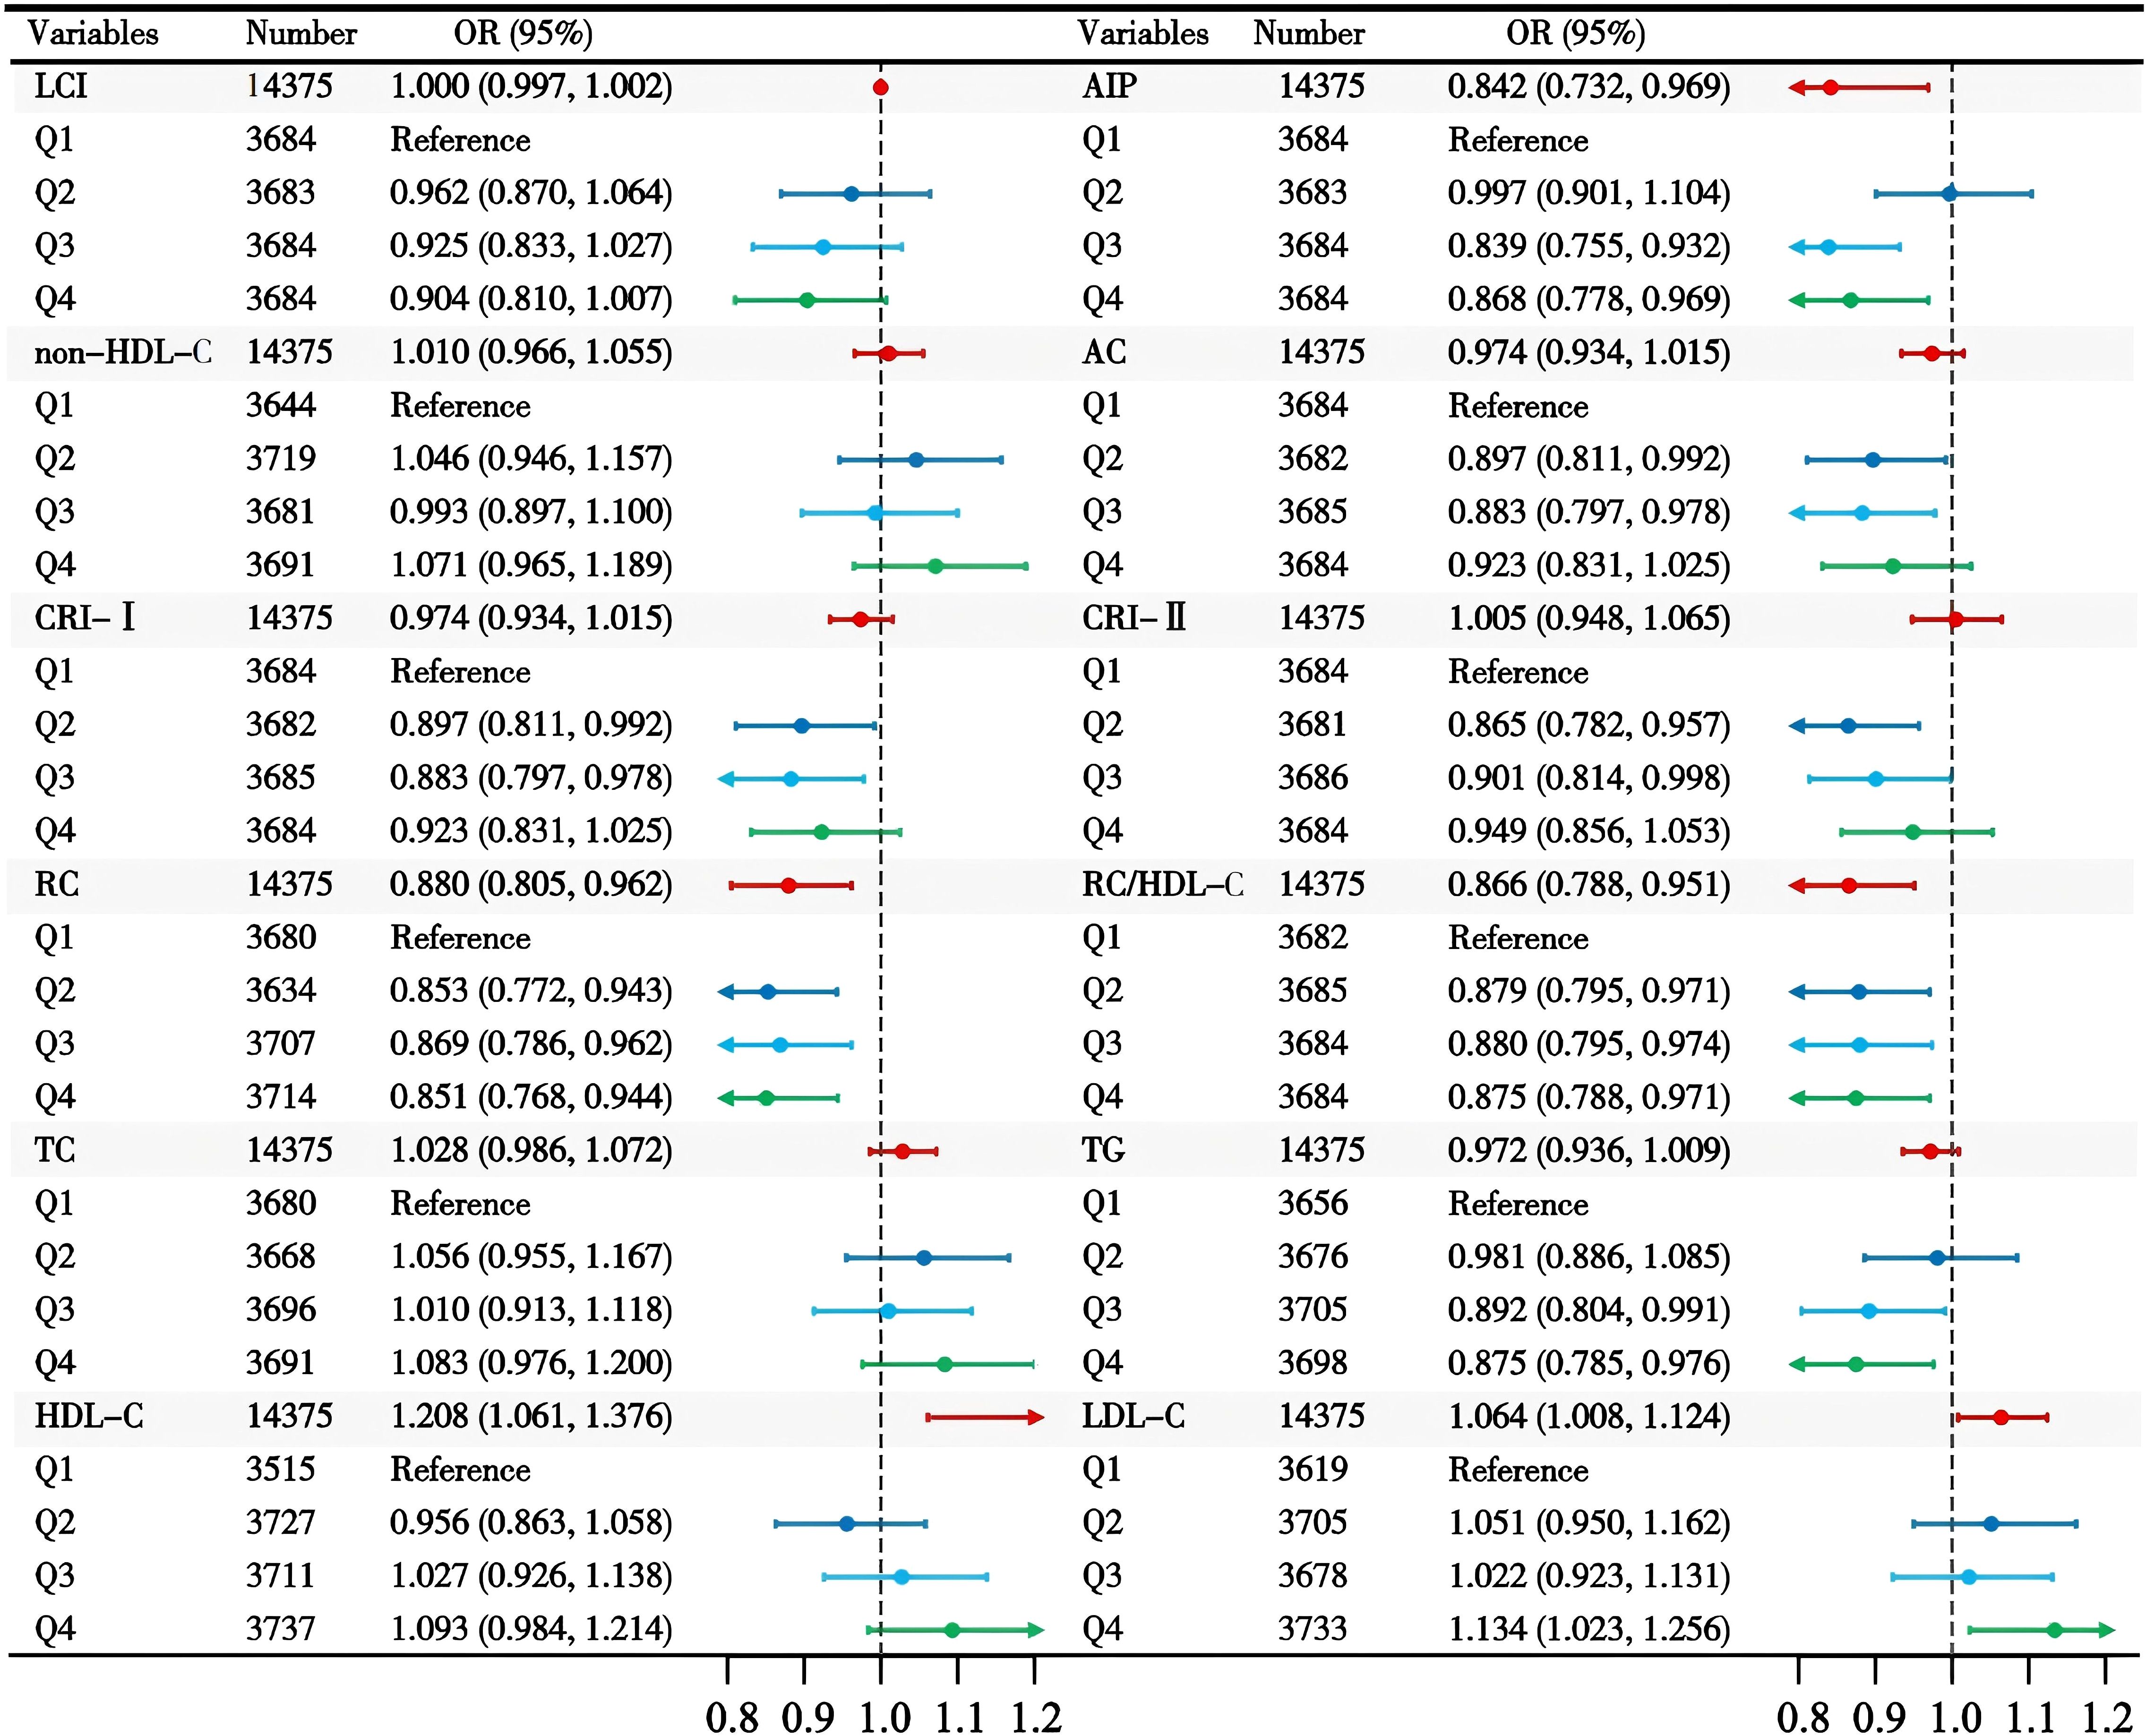
Figure 2. The association between lipid parameters and reversion to normoglycemia in individuals with prediabetes.
3.3 Inflection points and nonlinear trends of lipid parameters
The dose-response relationships depicted in Figure 3 highlight the nonlinear associations between lipid parameters and normoglycemia. Except for HDL-C, all lipid parameters exhibited nonlinear trends (Supplementary Table S2). For AIP, a sharp increase in normoglycemia probability occurred below an inflection point of -0.375 (OR 3.034, 95% CI: 1.111–8.286), while above this threshold, the negative association weakened (OR 0.778, 95% CI: 0.667–0.906). Similarly, the RC/HDL-C ratio showed accelerated negative effects below 0.106. above this level, the rate of decrease decelerates.
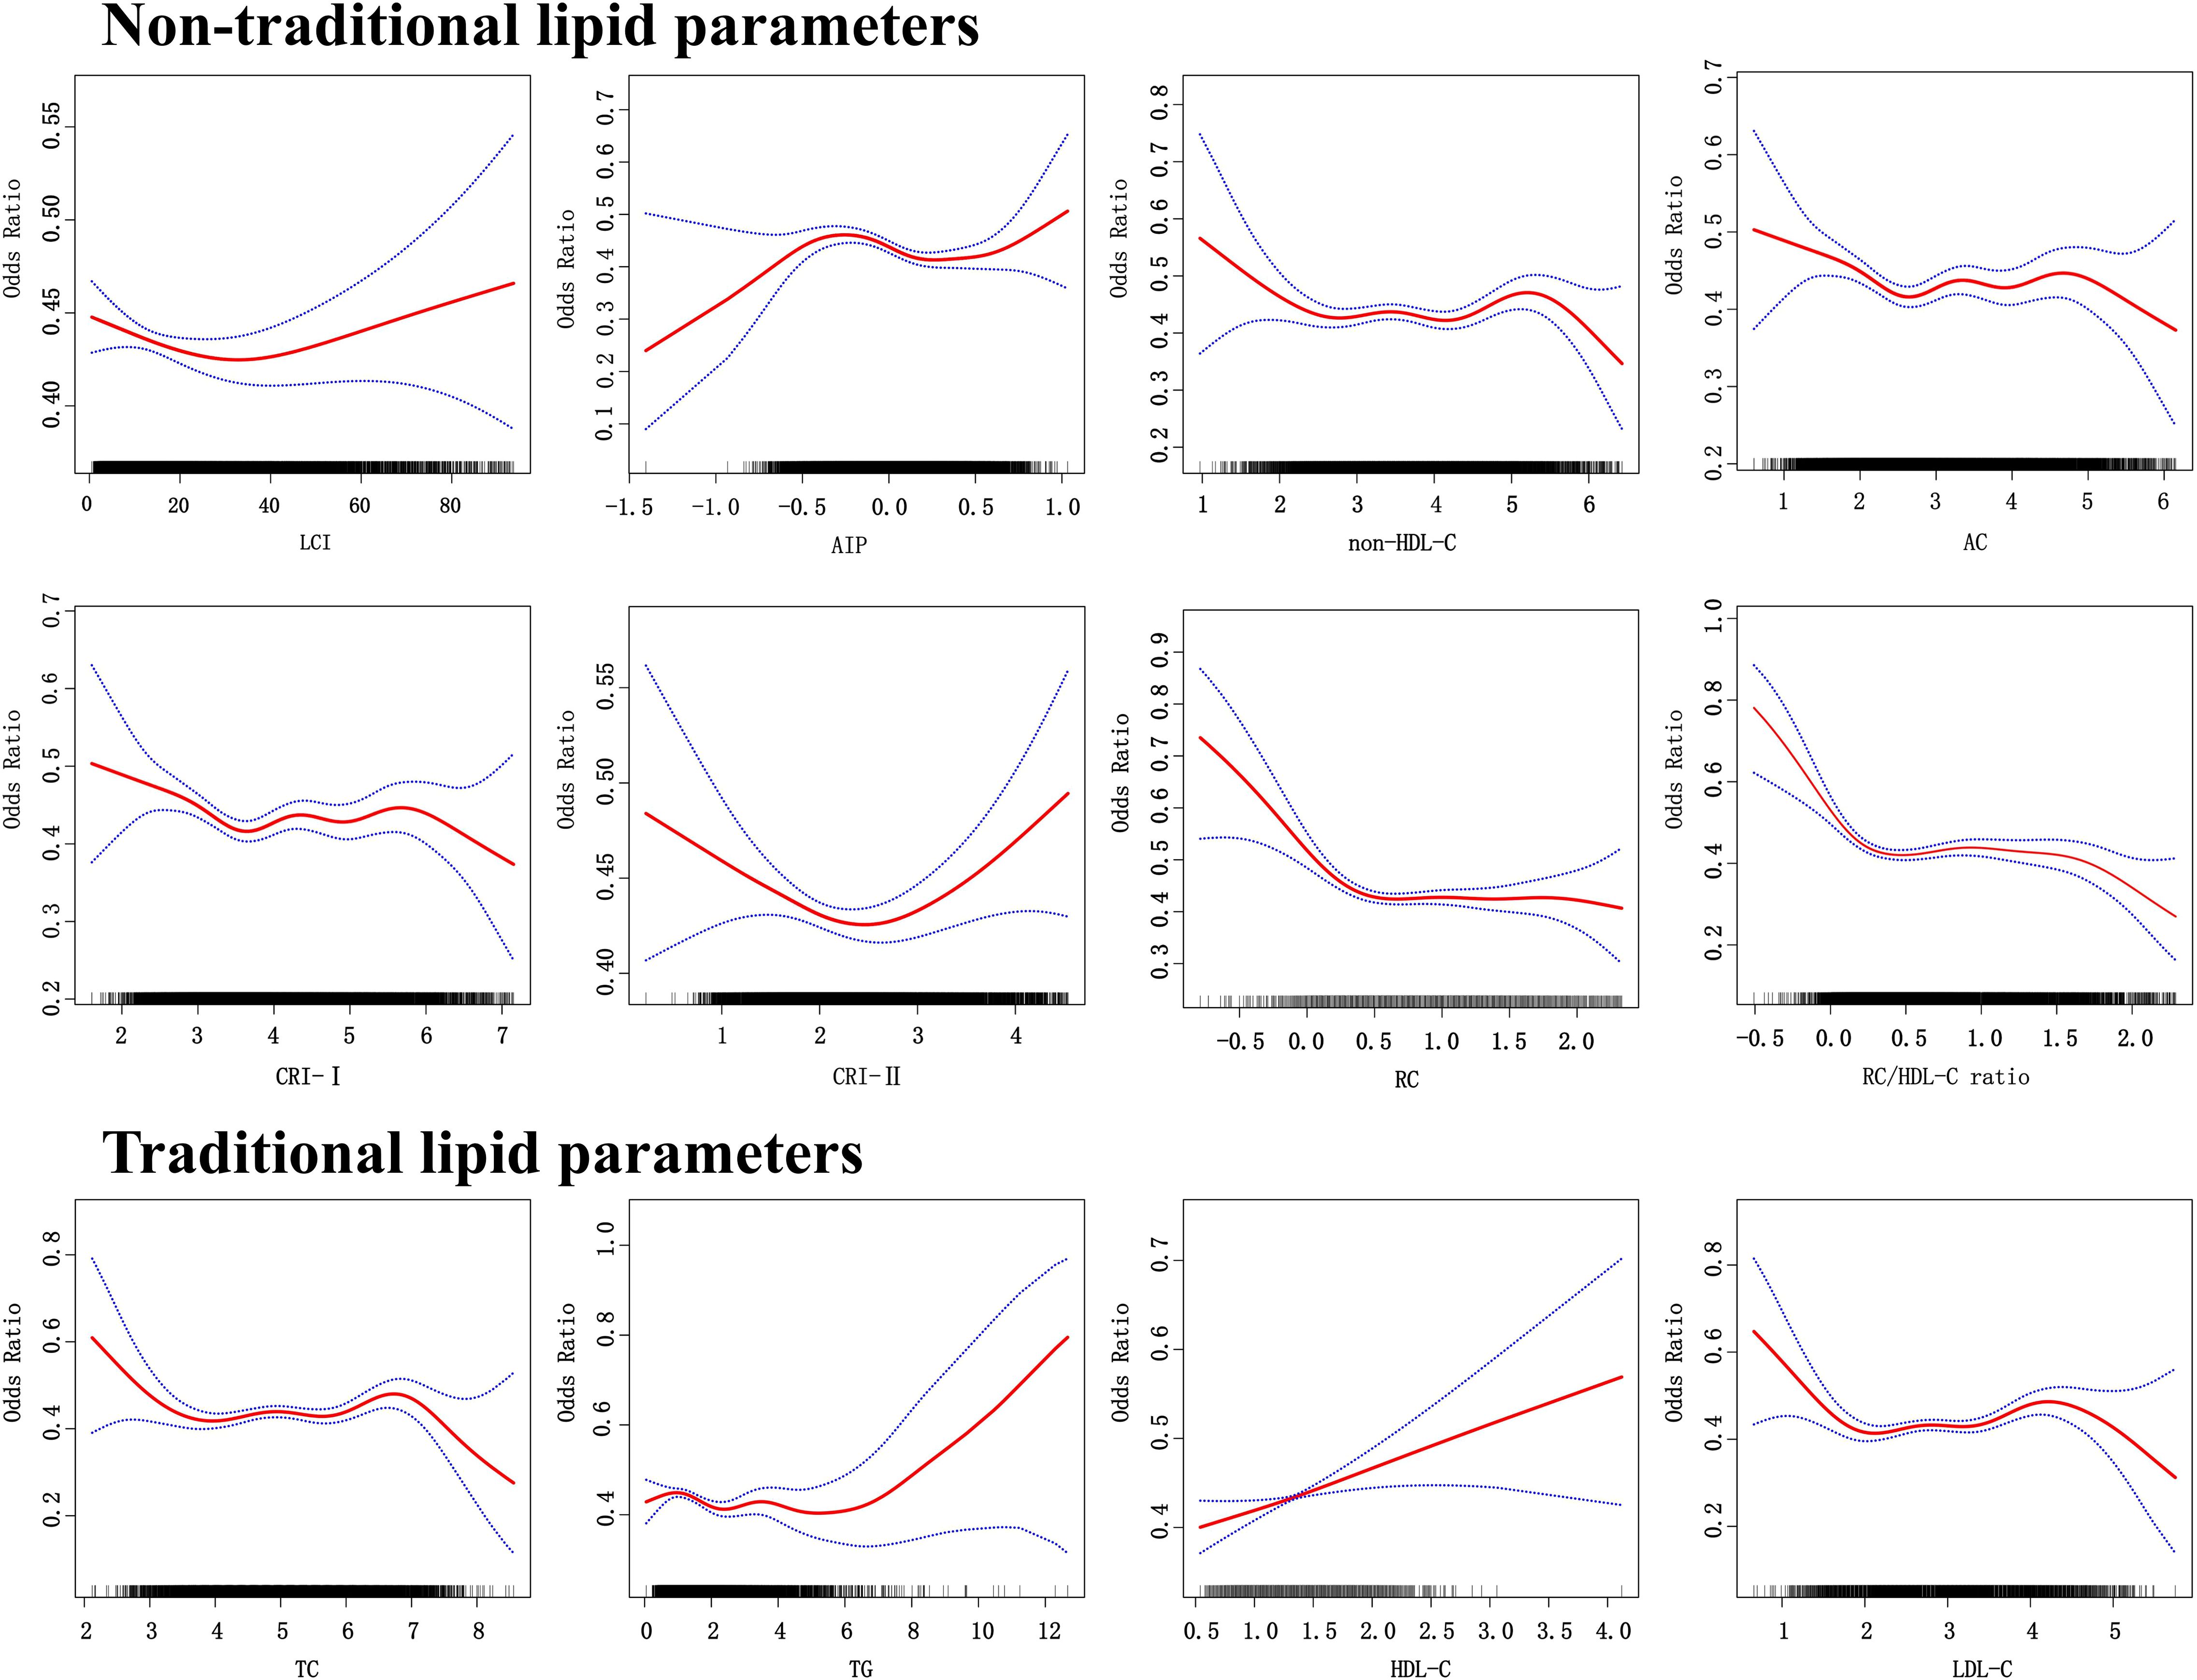
Figure 3. The dose response relationship between lipid parameters and reversion to normoglycemia in people with prediabetes.
3.4 Diagnostic utility of lipid parameters in normoglycemia identification
ROC curve analysis demonstrated that all non-traditional lipid parameters outperformed traditional measures (TG, LDL-C) in predicting normoglycemia reversion (AUC > 0.5). AIP showed the highest discriminative ability (AUC = 0.579, 95% CI: 0.569–0.588), with an optimal cutoff of 0.030 (sensitivity 57.2%, specificity 56.0%). Other strong predictors included LCI (AUC 0.575) and RC (AUC 0.559), while traditional LDL-C performed poorest (AUC 0.520) (Table 3; Figure 4).
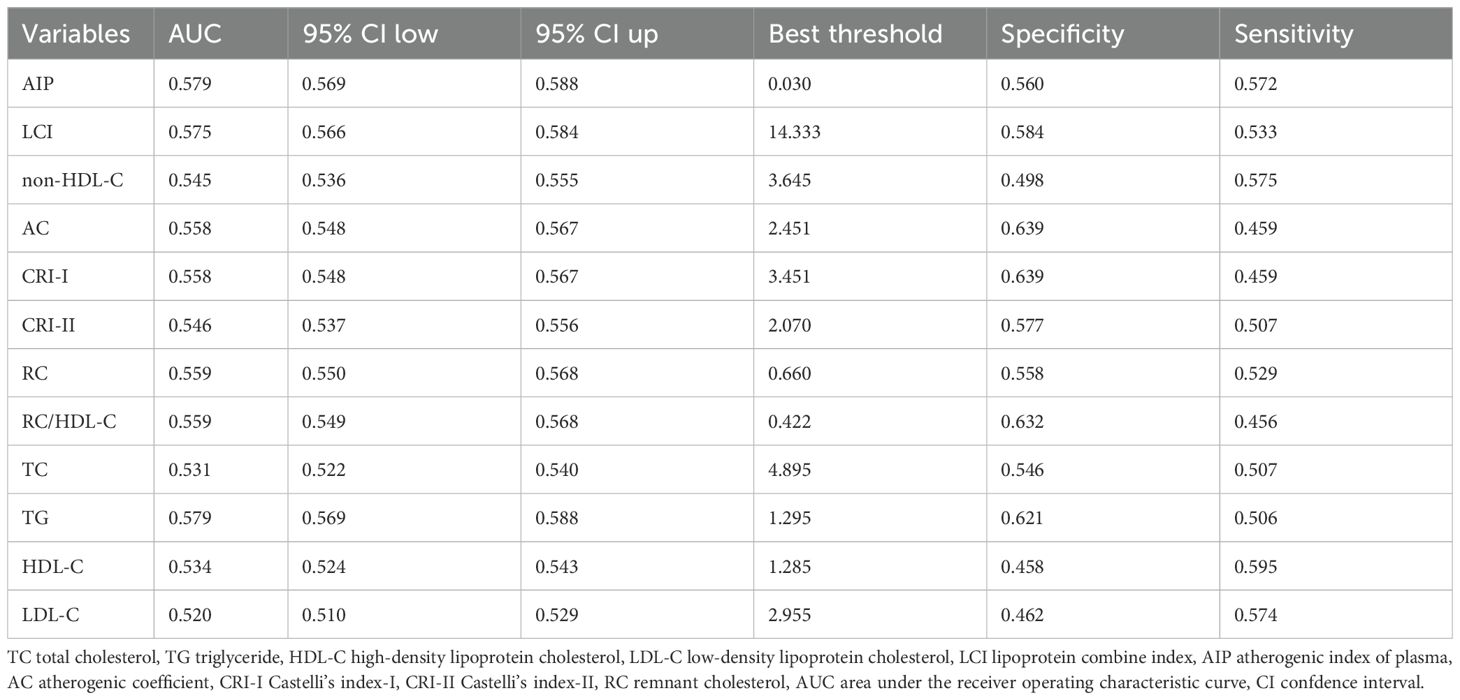
Table 3. Ability of traditional and non-traditional lipid parameters to predict normoglycemia in prediabetes.
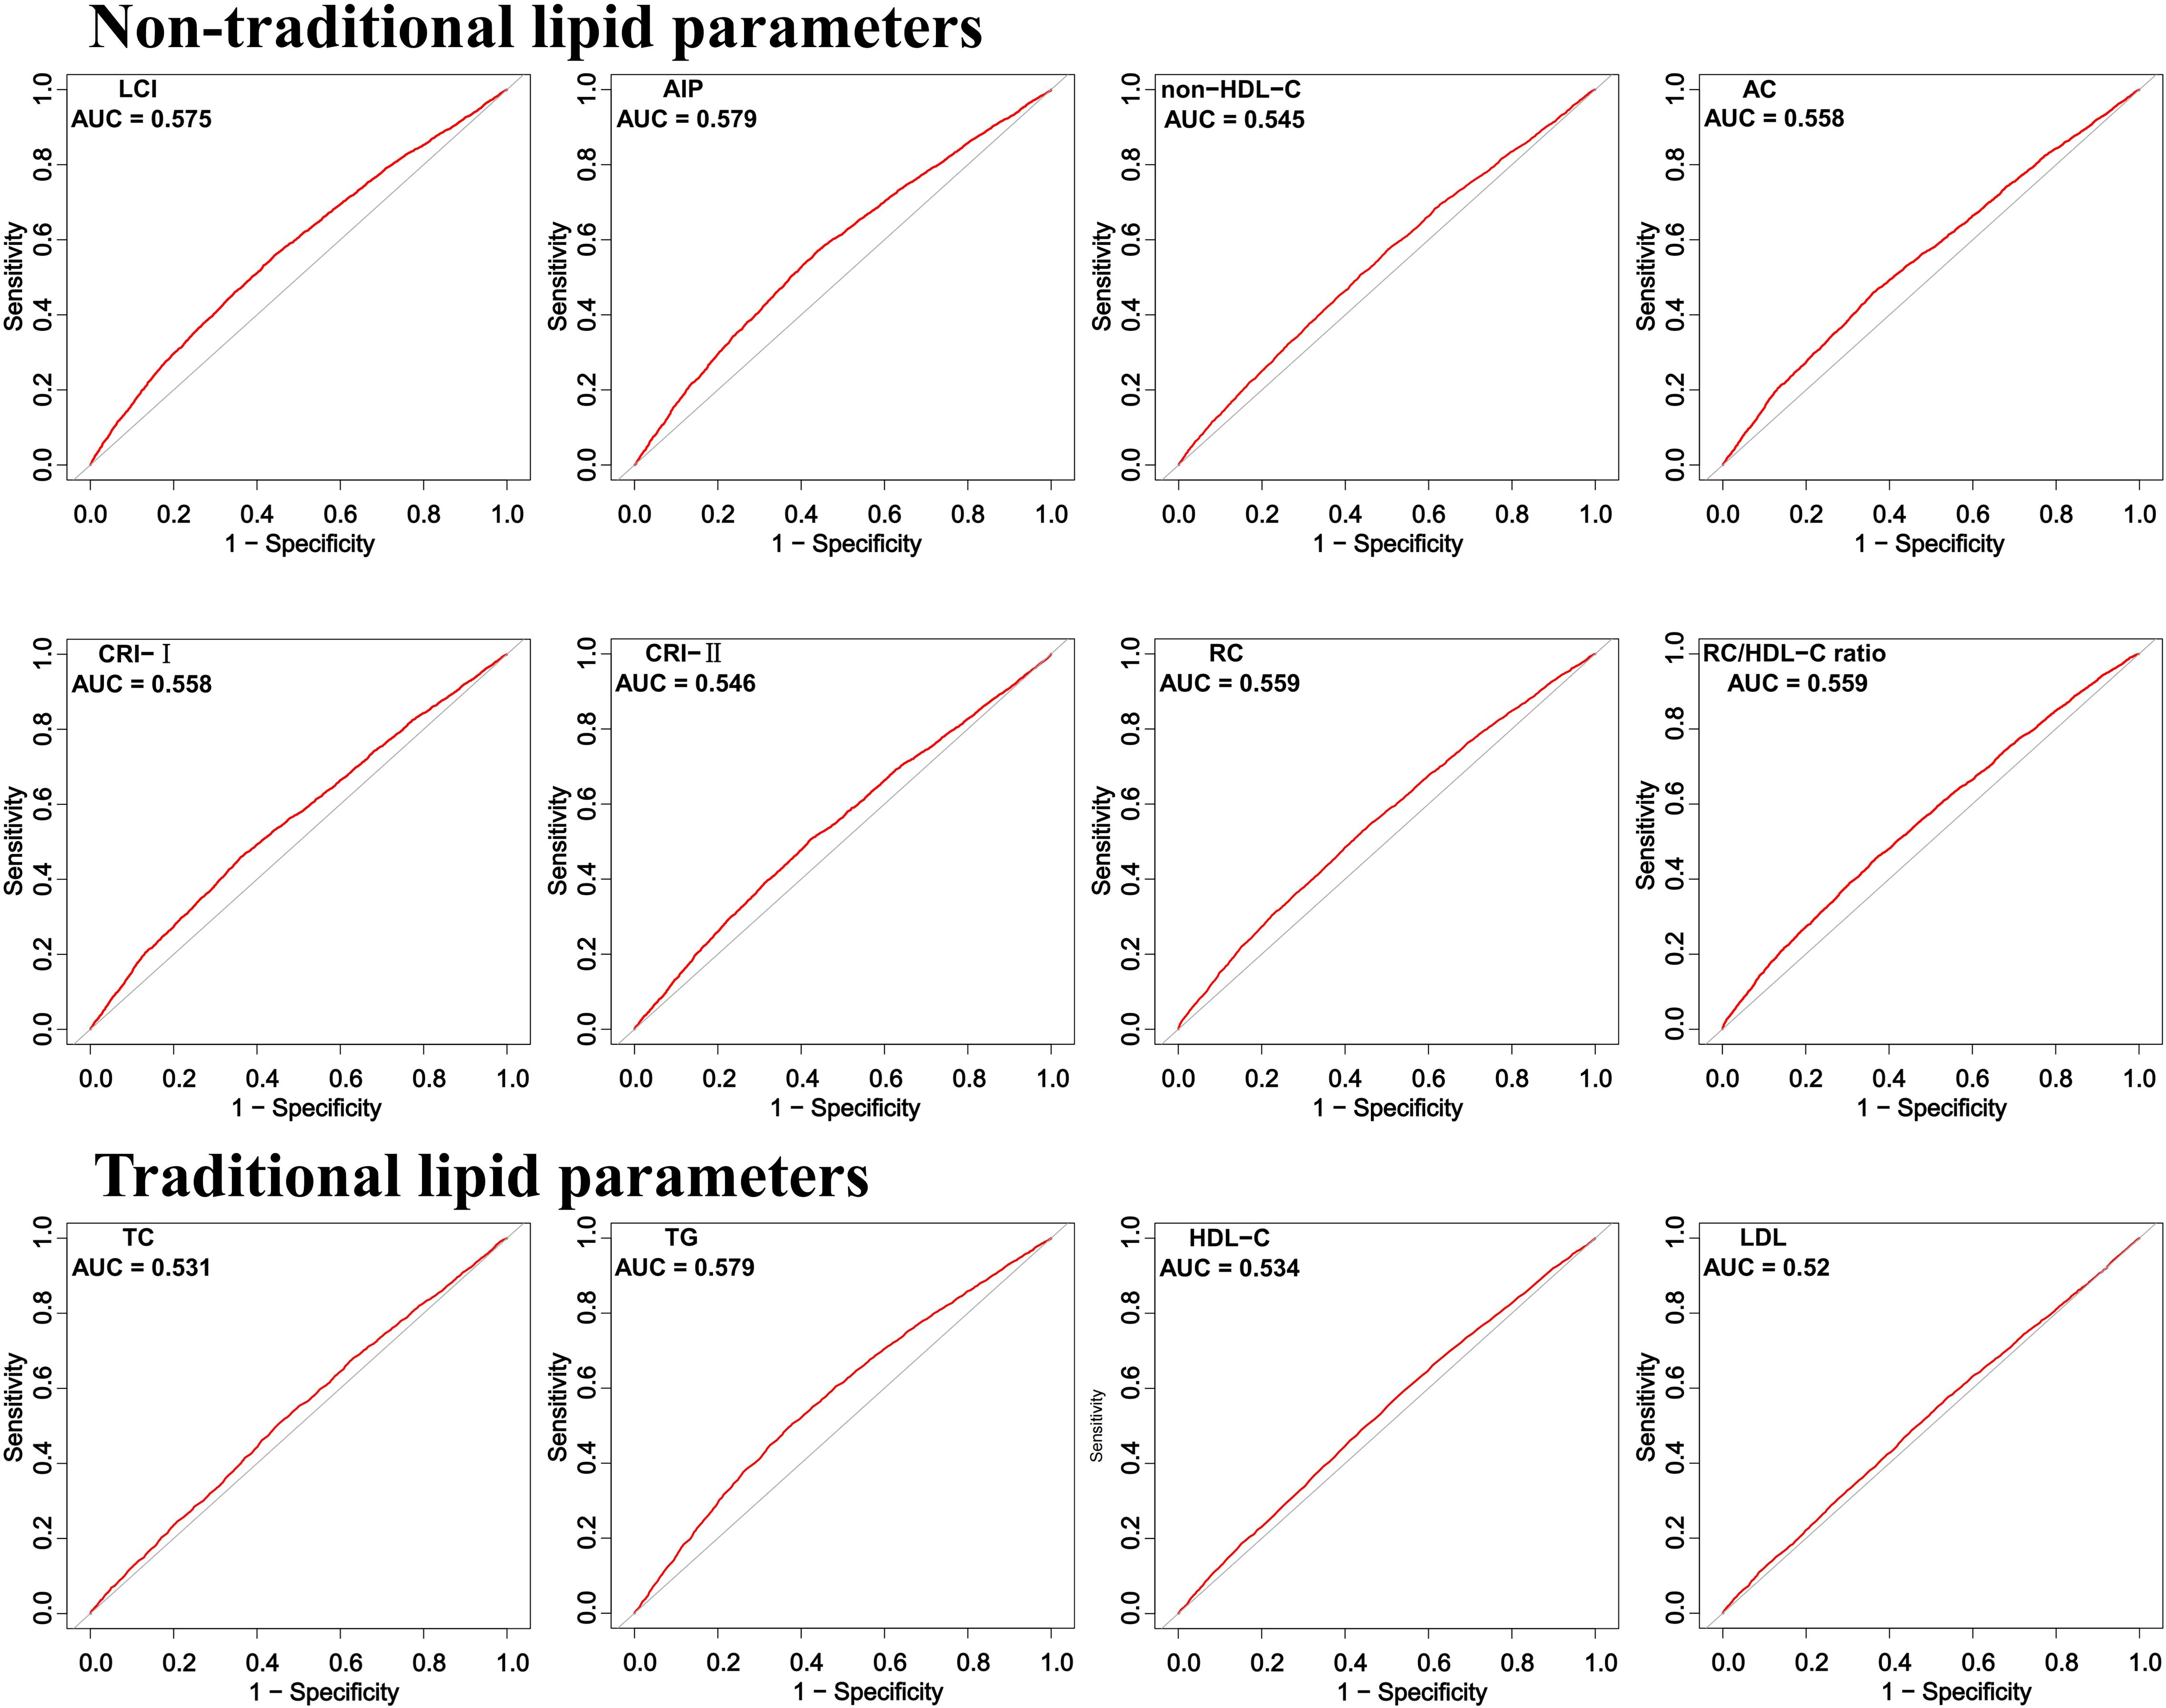
Figure 4. ROC curve analysis of the lipid parameters in predicting normoglycemia.
3.5 Sensitivity analyses
Stratification by key covariates revealed stronger associations in specific subgroups (Figure 5). In terms of sex, all lipid parameters showed stronger effects in females compared to males. Age-related associations were more pronounced in participants under 50 years, while effects were heightened in individuals with a BMI less than 24 kg/m². Additionally, stronger correlations were observed in those without a familial risk for diabetes. After excluding participants with baseline dyslipidemia, the AIP consistently emerged as the most robust marker for normoglycemia, with the lowest OR value after adjusting for all variables (model 3) (OR 0.708, 95% CI: 0.551–0.910), and AIP demonstrated the strongest predictive ability (Supplementary Tables S3, S4). Importantly, the relationship between AIP and normoglycemia remained significant regardless of age, weight, BMI, or diabetes family history, reinforcing the consistency of our primary findings (Supplementary Table S5).
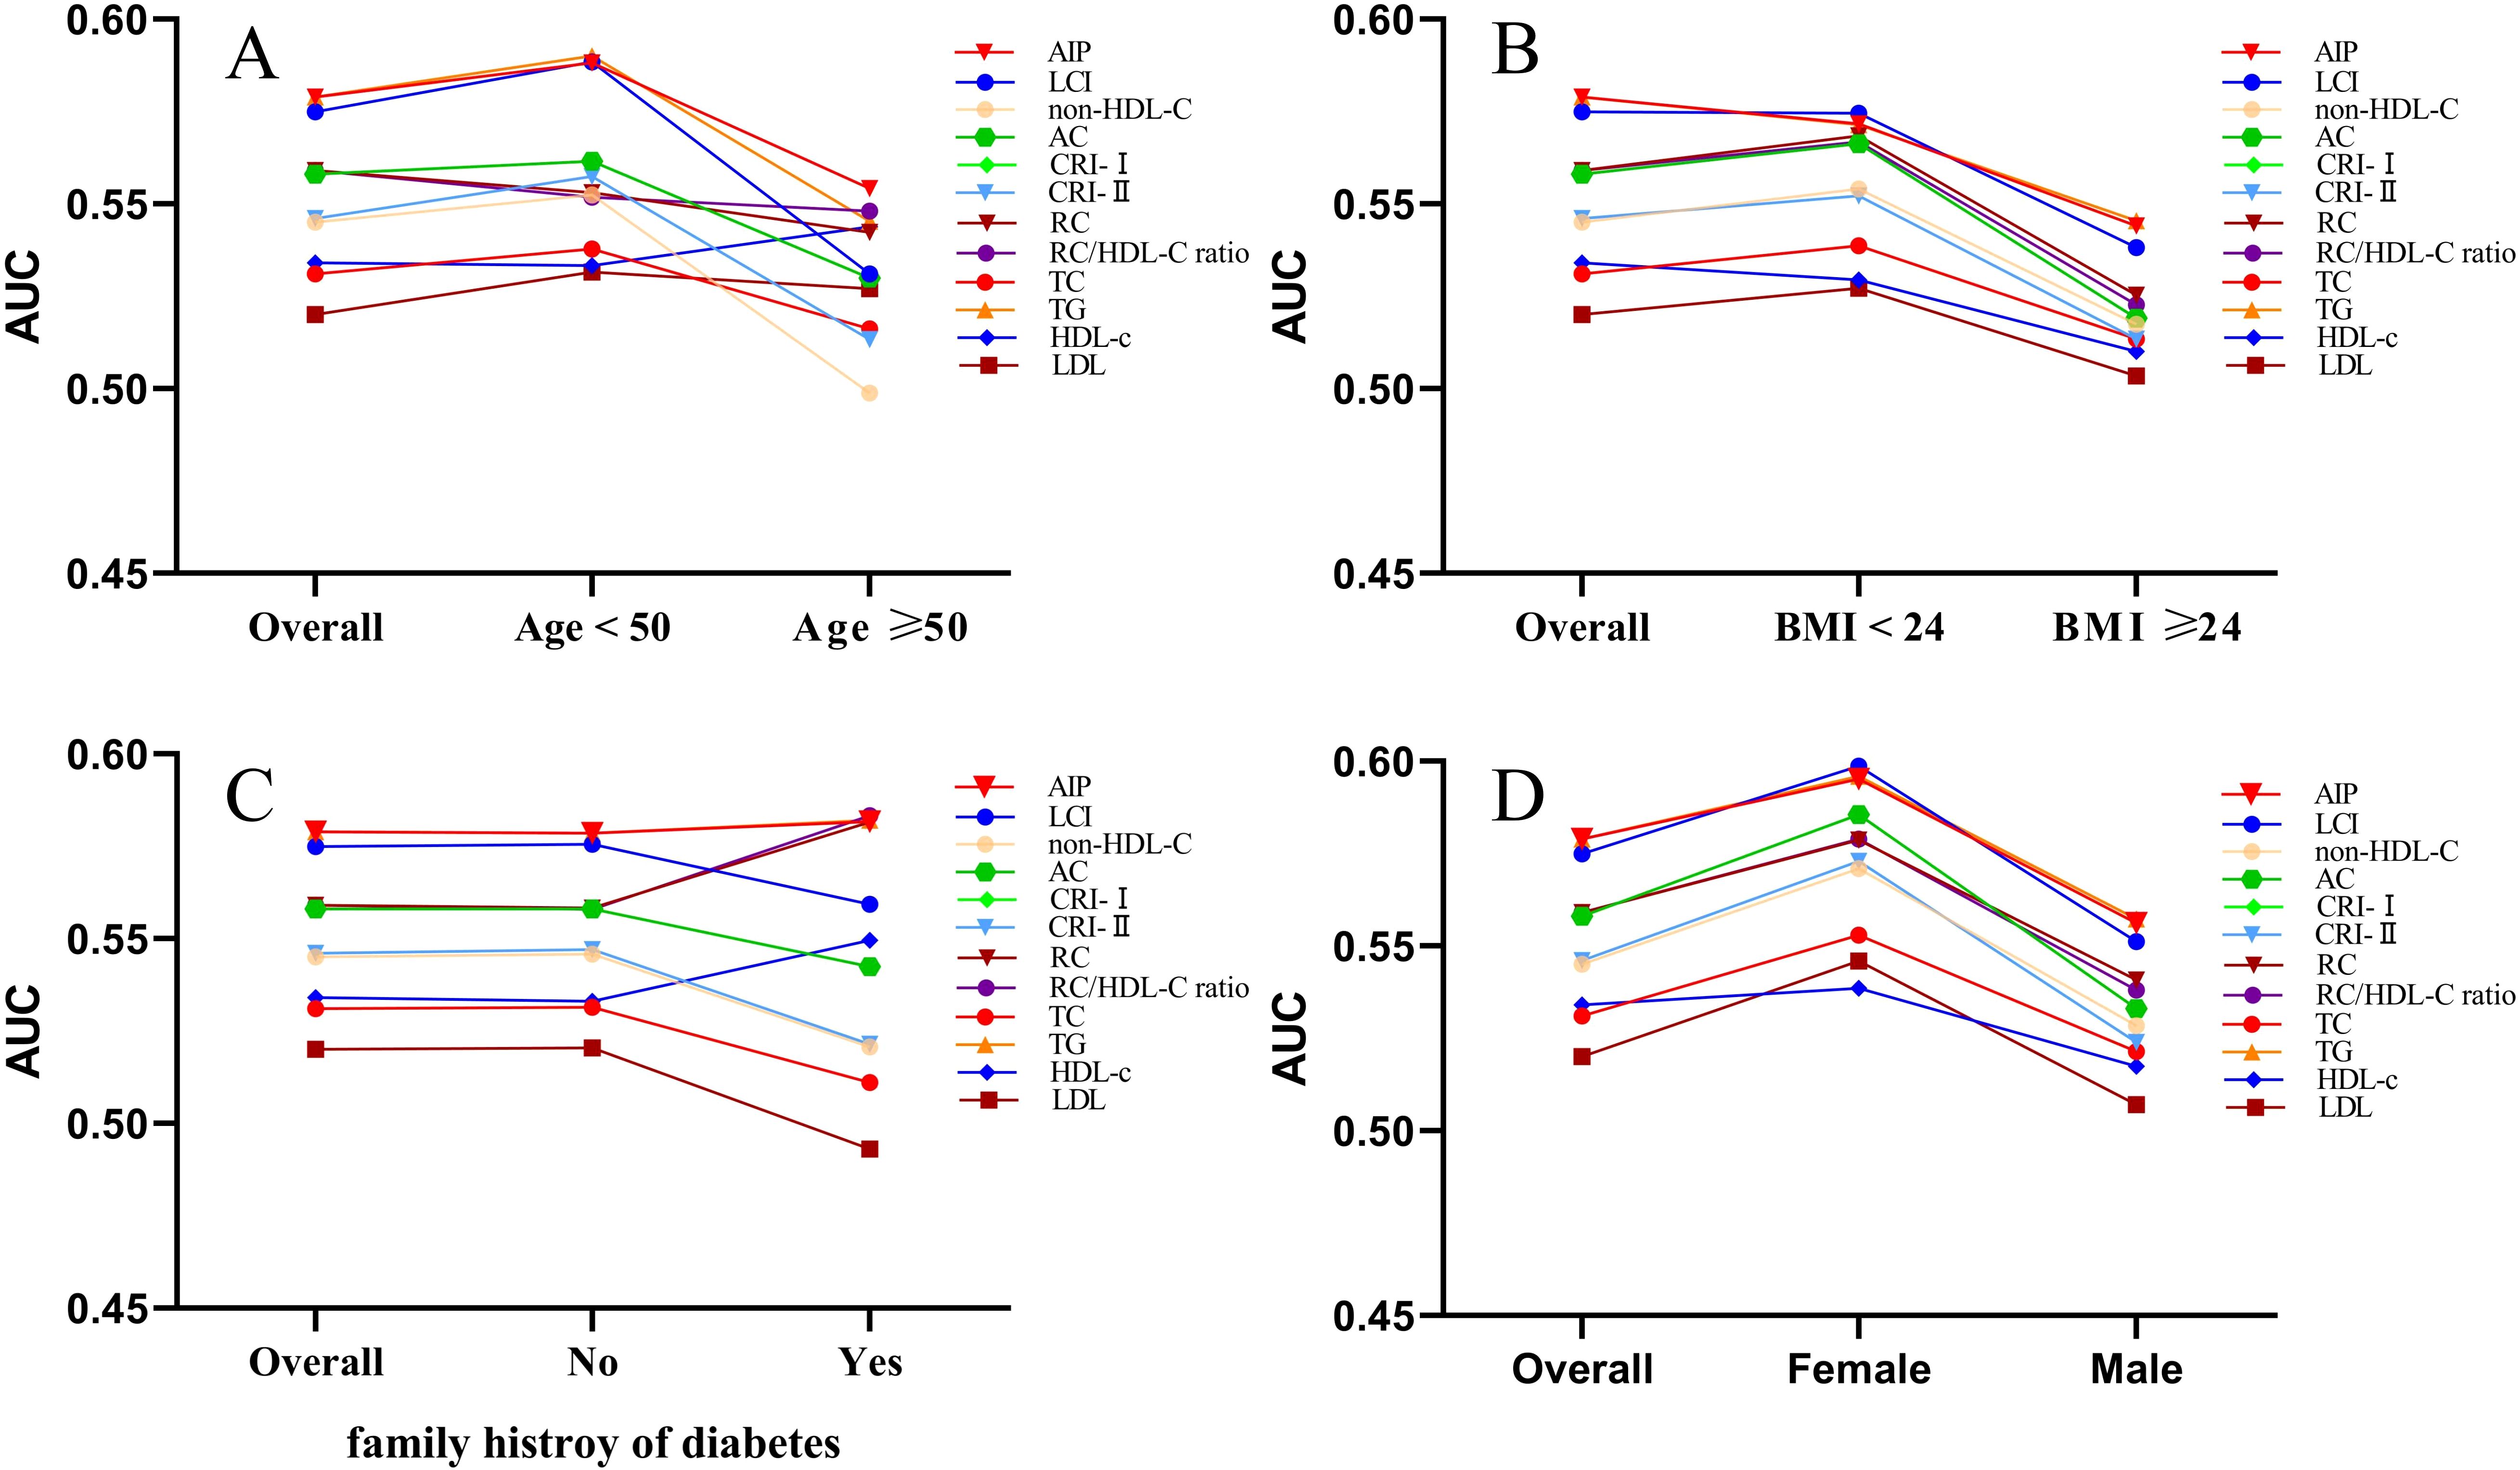
Figure 5. The AUC of lipid parameters in stratified analysis by age (A), BMI (B), family history of diabetes (C) and sex (D).
4 Discussion
This study systematically evaluates the associations and diagnostic significance of twelve lipid parameters in relation to normoglycemia among prediabetic Chinese adults. In this study, 6,406 individuals (56.53%) successfully returned to normoglycemia within an average observation period of 2.94 years. Among the parameters analyzed, only AIP, RC, RC/HDL-C ratio, HDL-C,and LDL-C showed significant association with normoglycemia. Notably, AIP demonstrated the highest diagnostic efficacy for predicting reversion to normoglycemia. Moreover, younger females with lower BMI were more likely to rrestore normal blood glucose levels.
The capacity for individuals with prediabetes to regain glucose control varies notably amaong different ethnic groups. For instance, a longitudinal study involving 9,637 Mexican individuals revealed that only 22.6% reverted to normoglycemia within a 2.5 year period (28). In contrast, 54% of participants in the UK with prediabetes returned to normoglycemia in just one year (29). Similar research results showed that 44.9% of prediabetic participants in China returned to normoglycemia after a mean follow-up period of 8.75 years (6). Furthermore, the incidence of cardiovascular events in those who returned to normoglycemia was significantly lower compared to those who developed diabetes. These findings emphasize the importance of actively managing prediabetes. Our study’s finding that 56.53% of prediabetic individuals successfully regained normoglycemia within 2.94 years highlights the potential effectiveness of targeted intervention strategies for reversing prediabetes. In comparison to select populations such as those of Chinese descent, the Mexican population exhibits a higher incidence and greater management challenges for prediabetes and diabetes, which can be attributed to a multifactorial pathogenesis. Specifically, the synergistic interaction of hypercaloric, carbohydrate-rich dietary patterns, sedentary lifestyle, and genetic susceptibility creates a permissive environment for disease development (30, 31). Socioeconomic disparities further exacerbate this landscape, as low-income demographics demonstrate disproportionate dependence on cost-effective, calorie-dense processed foods. Additionally, sociocultural factors and systemic healthcare disparities pose significant barriers to effective glycemic management, thereby perpetuating the epidemic (32, 33).
Elevated levels of lipids accelerate the progression of prediabetes, highlighting the importance of managing dyslipidemia to improve blood glucose control (3, 34, 35). Non-traditional lipid parameters, which encompass lipid indicators linked to cardiovascular health, extend beyond conventional markers (12). Historically, research has concentrated on the role of non-traditional lipid parameters in cerebrovascular diseases, including ischemic stroke and asymptomatic intracranial arterial stenosis (36, 37). Recent findings have confirmed that abnormal non-traditional lipid parameters elevate the risk of developing prediabetes (38, 39). Additionally, there is a negative nonlinear association between RC and the probability of Chinese prediabetic adults achieving normal blood glucose levels (15). Despite the established associations, limited attention has been given to the impact of non-traditional lipid parameters on achieving normoglycemia in individuals with prediabetes (15). In our study, after adjusting for all covariates, we found that AIP, RC, and the RC/HDL-C ratio were significant associations with normoglycemia. AIP is a composite indicator derived from TG and HDL-C. HDL-C is known to facilitate reverse cholesterol transport and exert regulatory effects on inflammation (40). The antioxidant and anti-inflammatory functions of HDL-C are impaired in individuals with diabetes (41). Of these parameters, AIP had the highest diagnostic utility in predicting the return to normoglycemia. This finding is particularly important as AIP is recognized as a critical modifiable risk factor for cardiovascular events (42). Furthermore, if AIP levels are not effectively managed, the risk of developing diabetes may increase (13, 43). Specifically, maintaining an AIP value below -0.375 significantly improves the chances of individuals with prediabetes reverting to normoglycemia.
The mechanisms by which lipid profiles influence normoglycemia in prediabetic patients require further exploration. The prevalence of diabetes is rapidly increasing among Asian populations, with new cases emerging at relatively younger ages and lower body mass indices compared to Western populations. This trend may be related to poorer pancreatic β-cell reserves (44). While the absence of functional β-cells is a critical factor in diabetes, their maintenance and renewal depend on self-replication (45). The capacity for β-cell self-replication declines with age, indicating that younger individuals may have a greater potential for β-cell regeneration (46). Elevated cholesterol and other lipid levels can lead to β-cell dysfunction, further complicating glucose metabolism (12, 47). Estrogen can significantly promote insulin secretion, protect the function of pancreatic β-cells, delay their failure, and maintain the stability of insulin secretion (48). The development of prediabetes represents a complex pathophysiological process. While its current diagnostic criteria primarily rely on FPG levels, integrating magnetic resonance imaging-derived metrics of fat distribution, hepatic lipid content, and polygenic risk scores could enhance patient stratification and enable precision therapeutic strategies (49).
Interestingly, our study reveals that younger prediabetic individuals and those with lower BMI are more likely to achieve normoglycemia. Additionally, men are more susceptible to obesity, and hyperglycemia when facing nutritional challenges compared to women (50). Compared to men, young women are more likely to normalize their blood glucose levels, potentially attributable to greater emphasis on health management and higher treatment compliance (51). Smoking and drinking habits are more prevalent among males, while a healthy lifestyle may play a crucial role in controlling and reversing hyperglycemic conditions (52). This contrasts with older populations, who may be more prone to unhealthy dietary habits and a sedentary lifestyle, thereby elevating their risk of developing diabetes (53). While pharmacological interventions can be beneficial, changes in lifestyle, such as adopting a healthier diet and engaging in regular physical activity, are essential for effectively managing prediabetes (54). For individuals with prediabetes, reducing calorie intake along with increasing physical activity can significantly decrease the risk of progressing to diabetes (55). Therefore, such interventions may effectively assist individuals with prediabetes in returning to normal blood glucose levels (56).
This study has several significant strengths. First, it is the first comprehensive assessment of the relationship between lipid parameters and normoglycemia in Chinese adults with prediabetes. Second, the research is based on a large cohort of 14,735 Chinese prediabetic patients, enhancing the reliability and generalizability of the findings. Finally, the study highlights that younger females and individuals with a low BMI are more likely to attain normal blood glucose levels, which helps prioritize key demographics for targeted prevention efforts in managing prediabetes.
This study has several limitations. First, as our participants were exclusively Chinese, the generalizability of the AIP threshold to other ethnicities is uncertain, and further research is needed to explore its applicability in populations with diverse genetic backgrounds. Additionally, we assessed non-traditional lipid parameters only at baseline, without considering their temporal fluctuations over time. Although we discussed possible ethnic variations in glycemic recovery rates, we did not perform comparative analyses of population-specific thresholds for key lipid parameters, such as AIP cutoff values across Chinese, Mexican, and UK cohorts. Moreover, the absence of oral glucose tolerance and HbA1c data in our cohort may have led to an underestimation of prediabetes prevalence. Finally, the lack of baseline information on gestational diabetes mellitus, dyslipidemia, and metabolic syndrome may influence the stability and generalizability of our findings.
5 Conclusion
In this study, AIP, RC, and the RC/HDL-C ratio demonstrated stronger associations with normoglycemia in Chinese adults. Notably, AIP exhibited the highest diagnostic efficacy in predicting glycemic recovery. However, future studies are required to replicate these findings externally and validate the generalizability of the AIP threshold across diverse racial and metabolic populations.
Data availability statement
The datasets presented in this study can be found in online repositories. The names of the repository/repositories and accession number(s) can be found below: Dryad public database (https://datadryad.org/stash/dataset/doi:10.5061/dryad.ft8750v).
Ethics statement
The initial study received approval from the Rich Healthcare Group Review Board, and participants’ informed consent was obtained. Consequently, additional ethical review and consent were not required for this secondary analysis research. The studies were conducted in accordance with the local legislation and institutional requirements. The participants provided their written informed consent to participate in this study.
Author contributions
CH: Data curation, Software, Writing – original draft, Writing – review & editing. YZ: Data curation, Formal analysis, Methodology, Writing – original draft, Writing – review & editing. XY: Funding acquisition, Methodology, Resources, Visualization, Writing – original draft, Writing – review & editing. GL: Conceptualization, Data curation, Methodology, Visualization, Writing – original draft, Writing – review & editing. ZG: Investigation, Methodology, Supervision, Visualization, Writing – original draft, Writing – review & editing.
Funding
The author(s) declare that financial support was received for the research and/or publication of this article. This study was supported by Hangzhou Medical and Health Science and Technology Project (NO.B20230336).
Conflict of interest
The authors declare that the research was conducted in the absence of any commercial or financial relationships that could be construed as a potential conflict of interest.
Generative AI statement
The author(s) declare that no Generative AI was used in the creation of this manuscript.
Publisher’s note
All claims expressed in this article are solely those of the authors and do not necessarily represent those of their affiliated organizations, or those of the publisher, the editors and the reviewers. Any product that may be evaluated in this article, or claim that may be made by its manufacturer, is not guaranteed or endorsed by the publisher.
Supplementary material
The Supplementary Material for this article can be found online at: https://www.frontiersin.org/articles/10.3389/fendo.2025.1502861/full#supplementary-material
References
2. Rooney MR, Fang M, Ogurtsova K, Ozkan B, Echouffo-Tcheugui JB, Boyko EJ, et al. Global prevalence of prediabetes. Diabetes Care. (2023) 46:1388–94. doi: 10.2337/dc22-2376
3. Li Y, Teng D, Shi X, Qin G, Qin Y, Quan H, et al. Prevalence of diabetes recorded in mainland China using 2018 diagnostic criteria from the American Diabetes Association: national cross sectional study. BMJ. (2020) 369:m997. doi: 10.1136/bmj.m997
4. Tuso P. Prediabetes and lifestyle modification: time to prevent a preventable disease. Permanente J. (2014) 18:88–93. doi: 10.7812/TPP/14-002
5. Tabák AG, Herder C, Rathmann W, Brunner EJ, and Kivimäki M. Prediabetes: a high-risk state for diabetes development. Lancet. (2012) 379:2279–90. doi: 10.1016/S0140-6736(12)60283-9
6. Liu X, Wu S, Song Q, and Wang X. Reversion from pre-diabetes mellitus to normoglycemia and risk of cardiovascular disease and all-cause mortality in a chinese population: A prospective cohort study. J Am Heart Assoc. (2021) 10:e019045. doi: 10.1161/JAHA.120.019045
7. Al Amri T, Bahijri S, Al-Raddadi R, Ajabnoor G, Al Ahmadi J, Jambi H, et al. The association between prediabetes and dyslipidemia among attendants of primary care health centers in Jeddah, Saudi Arabia. Diabetes Metab Syndr Obes. (2019) 12:2735–43. doi: 10.2147/DMSO.S233717
8. Hirano T. Pathophysiology of diabetic dyslipidemia. J Atheroscl Thrombosis. (2018) 25:771–82. doi: 10.5551/jat.RV17023
9. Han M, Li Q, Qie R, Guo C, Zhou Q, Tian G, et al. Association of non-HDL-C/HDL-C ratio and its dynamic changes with incident type 2 diabetes mellitus: The Rural Chinese Cohort Study. J Diabetes Its Complications. (2020) 34:107712. doi: 10.1016/j.jdiacomp.2020.107712
10. Sheng G, Kuang M, Yang R, Zhong Y, Zhang S, and Zou Y. Evaluation of the value of conventional and unconventional lipid parameters for predicting the risk of diabetes in a non-diabetic population. J Transl Med. (2022) 20:266. doi: 10.1186/s12967-022-03470-z
11. Kim J, Shin S-J, Kim Y-S, and Kang H-T. Positive association between the ratio of triglycerides to high-density lipoprotein cholesterol and diabetes incidence in Korean adults. Cardiovasc Diabetol. (2021) 20:183. doi: 10.1186/s12933-021-01377-5
12. Yang T, Liu Y, Li L, Zheng Y, Wang Y, Su J, et al. Correlation between the triglyceride-to-high-density lipoprotein cholesterol ratio and other unconventional lipid parameters with the risk of prediabetes and Type 2 diabetes in patients with coronary heart disease: a RCSCD-TCM study in China. Cardiovasc Diabetol. (2022) 21:93. doi: 10.1186/s12933-022-01531-7
13. Zheng X, Zhang X, Han Y, Hu H, and Cao C. Nonlinear relationship between atherogenic index of plasma and the risk of prediabetes: a retrospective study based on Chinese adults. Cardiovasc Diabetol. (2023) 22:205. doi: 10.1186/s12933-023-01934-0
14. Mo Z, Han Y, Cao C, Huang Q, Hu Y, Yu Z, et al. Association between non-high-density lipoprotein to high-density lipoprotein ratio and reversion to normoglycemia in people with impaired fasting glucose: a 5-year retrospective cohort study. Diabetol Metab Syndr. (2023) 15:259. doi: 10.1186/s13098-023-01237-0
15. Chen W, Hu H, Cao C, Liu D, and Han Y. Link between remnant cholesterol and the reversion to normoglycemia in Chinese adults with prediabetes: a 5-year cohort study. Sci Rep. (2024) 14:18098. doi: 10.1038/s41598-024-69169-x
16. Chen Y, Zhang X-P, Yuan J, Cai B, Wang X-L, Wu X-L, et al. Association of body mass index and age with incident diabetes in Chinese adults: a population-based cohort study. BMJ Open. (2018) 8:e021768. doi: 10.1136/bmjopen-2018-021768
17. Zeng R-X, Li S, Zhang M-Z, Li X-L, Zhu C-G, Guo Y-L, et al. Remnant cholesterol predicts periprocedural myocardial injury following percutaneous coronary intervention in poorly-controlled type 2 diabetes. J Cardiol. (2017) 70:113–20. doi: 10.1016/j.jjcc.2016.12.010
18. Brandts J, Tittel SR, Bramlage P, Danne T, Brix JM, Zimny S, et al. Low-density lipoprotein cholesterol and non-high-density lipoprotein cholesterol in type 1 diabetes and type 2 diabetes: Lipid goal attainment in a large German-Austrian diabetes registry. Diabetes Obes Metab. (2023) 25:3700–8. doi: 10.1111/dom.v25.12
19. Sangouni AA, Alizadeh M, Jamalzehi A, Hosseinzadeh M, and Parastouei K. Garlic supplementation improves intestinal transit time, lipid accumulation product and cardiometabolic indices in subjects with metabolic syndrome: A randomized controlled trial. Phytother Res: PTR. (2023) 37:2305–14. doi: 10.1002/ptr.v37.6
20. Si Y, Liu J, Han C, Wang R, Liu T, and Sun L. The correlation of retinol-binding protein-4 and lipoprotein combine index with the prevalence and diagnosis of acute coronary syndrome. Heart Vessels. (2020) 35:1494–501. doi: 10.1007/s00380-020-01627-8
21. Pan W, Han Y, Hu H, and He Y. The non-linear link between remnant cholesterol and diabetic retinopathy: a cross-sectional study in patients with type 2 diabetic mellitus. BMC Endocr Disord. (2022) 22:326. doi: 10.1186/s12902-022-01239-5
22. ElSayed NA, Aleppo G, Aroda VR, Bannuru RR, Brown FM, Bruemmer D, et al. Classification and diagnosis of diabetes: standards of care in diabetes-2023. Diabetes Care. (2023) 46:S19–40. doi: 10.2337/dc23-S002
23. Mahemuti N, Jing X, Zhang N, Liu C, Li C, Cui Z, et al. Association between systemic immunity-inflammation index and hyperlipidemia: A population-based study from the NHANES (2015-2020). Nutrients. (2023) 15:1177. doi: 10.3390/nu15051177
24. White IR, Royston P, and Wood AM. Multiple imputation using chained equations: Issues and guidance for practice. Stat Med. (2011) 30:377–99. doi: 10.1002/sim.v30.4
25. Huang X, Zhong Q, Wang H, Zhao J, Kuang Y, Guan Q, et al. Diverting colostomy is an effective procedure for ulcerative chronic radiation proctitis patients after pelvic Malignancy radiation. BMC Surg. (2020) 20:267. doi: 10.1186/s12893-020-00925-2
26. Sheng G, Liu D, Kuang M, Zhong Y, Zhang S, and Zou Y. Utility of non-high-density lipoprotein cholesterol to high-density lipoprotein cholesterol ratio in evaluating incident diabetes risk. Diabetes Metab Syndr Obes. (2022) 15:1677–86. doi: 10.2147/DMSO.S355980
27. Han Y, Hu H, Huang Z, and Liu D. Association between body mass index and reversion to normoglycemia from impaired fasting glucose among Chinese adults: a 5-year cohort study. Front Endocrinol (Lausanne). (2023) 14:1111791. doi: 10.3389/fendo.2023.1111791
28. Sevilla-González MDR, Merino J, Moreno-Macias H, Rojas-Martínez R, Gómez-Velasco DV, and Manning AK. Clinical and metabolomic predictors of regression to normoglycemia in a population at intermediate cardiometabolic risk. Cardiovasc Diabetol. (2021) 20:56. doi: 10.1186/s12933-021-01246-1
29. Bodicoat DH, Khunti K, Srinivasan BT, Mostafa S, Gray LJ, Davies MJ, et al. Incident Type 2 diabetes and the effect of early regression to normoglycaemia in a population with impaired glucose regulation. Diabetes Med. (2017) 34:396–404. doi: 10.1111/dme.2017.34.issue-3
30. Park S and Liu M. A positive causal relationship between noodle intake and metabolic syndrome: A two-sample mendelian randomization study. Nutrients. (2023) 15:2091. doi: 10.3390/nu15092091
31. Phillips CM. Nutrigenetics and metabolic disease: current status and implications for personalised nutrition. Nutrients. (2013) 5:32–57. doi: 10.3390/nu5010032
32. Breland JY, McAndrew LM, Gross RL, Leventhal H, and Horowitz CR. Challenges to healthy eating for people with diabetes in a low-income, minority neighborhood. Diabetes Care. (2013) 36:2895–901. doi: 10.2337/dc12-1632
33. Seligman HK, Jacobs EA, López A, Tschann J, and Fernandez A. Food insecurity and glycemic control among low-income patients with type 2 diabetes. Diabetes Care. (2012) 35:233–8. doi: 10.2337/dc11-1627
34. Zhang J, Xiao Y, Hu J, Liu S, Zhou Z, and Xie L. Lipid metabolism in type 1 diabetes mellitus: Pathogenetic and therapeutic implications. Front Immunol. (2022) 13:999108. doi: 10.3389/fimmu.2022.999108
35. Škrha J. Diabetes, lipids, and CV risk. Curr Atheroscler Rep. (2021) 23:8. doi: 10.1007/s11883-021-00905-8
36. Sun J, Zhang J, Xin B, Ye Z, Cai Y, Lu K, et al. Traditional and non-traditional lipid parameters in relation to parenchymal hemorrhage following endovascular treatment for acute ischemic stroke in anterior circulation. Clin Interventions Aging. (2024) 19:891–900. doi: 10.2147/CIA.S459884
37. Guo J, Wang A, Wang Y, Liu X, Zhang X, Wu S, et al. Non-traditional lipid parameters as potential predictors of asymptomatic intracranial arterial stenosis. Front Neurol. (2021) 12:679415. doi: 10.3389/fneur.2021.679415
38. Jepsen A-MK, Langsted A, Varbo A, Bang LE, Kamstrup PR, and Nordestgaard BG. Increased remnant cholesterol explains part of residual risk of all-cause mortality in 5414 patients with ischemic heart disease. Clin Chem. (2016) 62:593–604. doi: 10.1373/clinchem.2015.253757
39. Taskinen MR, Barter PJ, Ehnholm C, Sullivan DR, Mann K, Simes J, et al. Ability of traditional lipid ratios and apolipoprotein ratios to predict cardiovascular risk in people with type 2 diabetes. Diabetologia. (2010) 53:1846–55. doi: 10.1007/s00125-010-1806-9
40. Navab M, Reddy ST, Van Lenten BJ, and Fogelman AM. HDL and cardiovascular disease: atherogenic and atheroprotective mechanisms. Nat Rev Cardiol. (2011) 8:222–32. doi: 10.1038/nrcardio.2010.222
41. Morgantini C, Natali A, Boldrini B, Imaizumi S, Navab M, Fogelman AM, et al. Anti-inflammatory and antioxidant properties of HDLs are impaired in type 2 diabetes. Diabetes. (2011) 60:2617–23. doi: 10.2337/db11-0378
42. Fernández-Macías JC, Ochoa-Martínez AC, Varela-Silva JA, and Pérez-Maldonado IN. Atherogenic index of plasma: novel predictive biomarker for cardiovascular illnesses. Arch Med Res. (2019) 50:285–94. doi: 10.1016/j.arcmed.2019.08.009
43. Shi Y and Wen M. Sex-specific differences in the effect of the atherogenic index of plasma on prediabetes and diabetes in the NHANES 2011-2018 population. Cardiovasc Diabetol. (2023) 22:19. doi: 10.1186/s12933-023-01740-8
44. Chan JCN, Malik V, Jia W, Kadowaki T, Yajnik CS, Yoon K-H, et al. Diabetes in Asia: epidemiology, risk factors, and pathophysiology. JAMA. (2009) 301:2129–40. doi: 10.1001/jama.2009.726
45. Sanghez V, Razzoli M, Carobbio S, Campbell M, McCallum J, Cero C, et al. Psychosocial stress induces hyperphagia and exacerbates diet-induced insulin resistance and the manifestations of the Metabolic Syndrome. Psychoneuroendocrinology. (2013) 38:2933–42. doi: 10.1016/j.psyneuen.2013.07.022
46. Tonne JM, Sakuma T, Munoz-Gomez M, El Khatib M, Barry MA, Kudva YC, et al. Beta cell regeneration after single-round immunological destruction in a mouse model. Diabetologia. (2015) 58:313–23. doi: 10.1007/s00125-014-3416-4
47. Peng J, Zhao F, Yang X, Pan X, Xin J, Wu M, et al. Association between dyslipidemia and risk of type 2 diabetes mellitus in middle-aged and older Chinese adults: a secondary analysis of a nationwide cohort. BMJ Open. (2021) 11:e042821. doi: 10.1136/bmjopen-2020-042821
48. Tramunt B, Smati S, Grandgeorge N, Lenfant F, Arnal J-F, Montagner A, et al. Sex differences in metabolic regulation and diabetes susceptibility. Diabetologia. (2020) 63:453–61. doi: 10.1007/s00125-019-05040-3
49. Wagner R, Heni M, Tabák AG, Machann J, Schick F, Randrianarisoa E, et al. Pathophysiology-based subphenotyping of individuals at elevated risk for type 2 diabetes. Nat Med. (2021) 27:49–57. doi: 10.1038/s41591-020-1116-9
50. Kumar AA, Satheesh G, Vijayakumar G, Chandran M, Prabhu PR, Simon L, et al. Postprandial metabolism is impaired in overweight normoglycemic young adults without family history of diabetes. Sci Rep. (2020) 10:353. doi: 10.1038/s41598-019-57257-2
51. Alizadeh Z, Baradaran HR, Kohansal K, Hadaegh F, Azizi F, and Khalili D. Are the determinants of the progression to type 2 diabetes and regression to normoglycemia in the populations with pre-diabetes the same? Front Endocrinol (Lausanne). (2022) 13:1041808. doi: 10.3389/fendo.2022.1041808
52. Nabila S, Kim J-E, Choi J, Park J, Shin A, Lee S-A, et al. Associations between modifiable risk factors and changes in glycemic status among individuals with prediabetes. Diabetes Care. (2023) 46:535–43. doi: 10.2337/dc22-1042
53. Healy GN, Dunstan DW, Salmon J, Cerin E, Shaw JE, Zimmet PZ, et al. Breaks in sedentary time: beneficial associations with metabolic risk. Diabetes Care. (2008) 31:661–6. doi: 10.2337/dc07-2046
54. Galaviz KI, Weber MB, Suvada K, Gujral UP, Wei J, Merchant R, et al. Interventions for reversing prediabetes: A systematic review and meta-analysis. Am J Prev Med. (2022) 62:614–25. doi: 10.1016/j.amepre.2021.10.020
55. Gong Q, Zhang P, Wang J, Ma J, An Y, Chen Y, et al. Morbidity and mortality after lifestyle intervention for people with impaired glucose tolerance: 30-year results of the Da Qing Diabetes Prevention Outcome Study. Lancet Diabetes Endocrinol. (2019) 7:452–61. doi: 10.1016/S2213-8587(19)30093-2
Keywords: prediabetes, normoglycemia, lipid parameters, chinese, atherogenic index of plasma (AIP)
Citation: Huang C, Zhang Y, Yang X, Li G and Gao Z (2025) Associations between non-traditional lipid parameters and normoglycemic reversion in Chinese adults with prediabetes: a retrospective analysis. Front. Endocrinol. 16:1502861. doi: 10.3389/fendo.2025.1502861
Received: 27 September 2024; Accepted: 09 June 2025;
Published: 24 June 2025.
Edited by:
Mohamad Navab, UCLA Health System, United StatesReviewed by:
Pascal Gottmann, German Institute of Human Nutrition Potsdam-Rehbruecke (DIfE), GermanyYing Liao, Longyan First Hospital, China
Oksana Ryabinina, University of Cape Coast, Ghana
Afak Rasheed Salman Zaidi, University of Diyala, Iraq
Copyright © 2025 Huang, Zhang, Yang, Li and Gao. This is an open-access article distributed under the terms of the Creative Commons Attribution License (CC BY). The use, distribution or reproduction in other forums is permitted, provided the original author(s) and the copyright owner(s) are credited and that the original publication in this journal is cited, in accordance with accepted academic practice. No use, distribution or reproduction is permitted which does not comply with these terms.
*Correspondence: Zhichao Gao, YmVpaml5YUBsaXZlLmNu