 Wentao Xiao1
 Taichuan Xu
 Zhihong Fan
 Xian Zhang
- 1Department of Graduate School, Nanjing University of Chinese Medicine, Nanjing, China
- 2Department of Spine, Wuxi Affiliated Hospital of Nanjing University of Chinese Medicine, Wuxi, China
Background: The relationship of triglyceride glucose (TyG) index-related obesity indices with sarcopenia has not been studied in the U.S. population.
Methods: This cross-sectional survey utilizes data collected from the National Health and Nutrition Examination Survey spanning 2011 to 2018. The correlation between TyG-waist-to-height ratio (TyG-WHtR), TyG-weight-adjusted waist index (TyG-WWI), TyG-waist circumference (TyG-WC), TyG-body mass index (TyG-BMI), and sarcopenia was analyzed by weighted multivariate logistic regression using smoothed curves fitted to the observed nonlinear relationships and subgroup analysis were performed as well as an interaction test. Ultimately, the diagnostic validity of the four indices was evaluated in comparison with the TyG index for sarcopenia utilizing receiver operating characteristic (ROC) analysis.
Results: This study included a total of 4804 participants, with 428 of those diagnosed with sarcopenia. The study illustrated that TyG-WHtR, TyG-WWI, TyG-BMI, and TyG-WC demonstrated a notable positive association with odds of sarcopenia prevalence [TyG-WHtR: OR (95% CI): 1.51(1.33, 1.72); TyG-WWI: OR (95% CI): 1.21 (1.18, 1.24); TyG-BMI: OR (95% CI): 1.15 (1.13, 1.18), TyG-WC: OR(95%CI):1.70(1.55, 1.87)]. Compared to the lowest quartile, the top quartile had a higher prevalence of sarcopenia, such as TyG-WWI (OR= 81.89, 95% CI: 38.49, 174.22). Subgroup analysis uncovered notable disparities in the relationship between four indices with sarcopenia., across gender and BMI≥30 strata. The association between the four distinct indices and sarcopenia is nonlinear. The ROC analysis demonstrated that four indices exhibited superior diagnostic efficacy to TyG. In addition, the diagnostic validity of TyG-WWI was optimal [TyG: AUC(95%CI):0.668(0.642,0.694); TyG-WHtR: AUC(95%CI):0.714(0.688,0.739); TyG-WC: AUC(95%CI):0.715(0.691,0.739); TyG-BMI: AUC(95%CI):0.737(0.714,0.761); TyG-WWI: AUC (95%CI):0.802(0.783,0.821)].
Conclusions: TyG-WWI, TyG-WHtR, TyG-BMI, and TyG-WC are significantly positively linked to the prevalence of sarcopenia and outperform the TyG index in predicting this disorder. The TyG-related obesity indices, specifically the TyG-WWI index, have potential as reliable indicators for assessing and predicting sarcopenia.
1 Introduction
Sarcopenia, clinically characterized by progressive deterioration of skeletal muscle mass and functional capacity (1), has emerged as a critical global health challenge with substantial socioeconomic implications (2). From the age of 35, the human body experiences a gradual decline in muscle mass, with an approximate rate of 1-2% per year. After the age of 65, this rate of loss accelerates significantly, reaching up to 3% per year (3). This suggests that the risk of declining muscle quality and function commences in early adulthood, thereby further exacerbating the risk of muscle dysfunction in later life. While geriatric sarcopenia has received considerable scientific attention, muscle mass loss in younger populations remains underrecognized in clinical practice. Modern lifestyles (such as sedentary lifestyles and high-fat diets) have precipitated an epidemic surge in adiposity among younger cohorts (4, 5), and the coexistence of obesity and low muscle mass may synergistically exacerbate metabolic homeostasis disruption (6). Mounting evidence underscores the interplay between sarcopenic progression and metabolic dysregulation (7). Ongoing intensive research into sarcopenia has revealed insulin resistance (IR) as a significant factor in its progression, and simultaneously obesity can exacerbate IR and muscle atrophy (8). Consequently, the investigation of more accurate obesity-related markers of IR is essential for the timely identification of IR and the prevention of sarcopenia.
The TyG index is widely acknowledged as an efficacious and cost-effective marker for assessing IR, calculated from triglycerides and fasting glucose levels (9, 10). Recent studies have indicated that obesity indices associated with the triglyceride glucose(TyG) index offer a more precise evaluation of IR, such as the TyG-waist-to-height ratio (TyG-WHtR) (11, 12), as well as accurately reflect the risk of periodontitis, cardiovascular, diabetes, and other diseases (13–15). Prior research has established a connection between the TyG index and reduced muscle mass among the Korean population, as well as a positive correlation between the TyG index and sarcopenia among the US population (16, 17). Nevertheless, there is a paucity of studies investigating the correlation between different TyG index-related obesity indicators and sarcopenia.
Accordingly, this present study represents the first investigation into the correlation between multiple TyG index-related obesity indicators and sarcopenia, utilizing data obtained from The National Health and Nutrition Examination Survey (NHANES). Furthermore, the comparative analysis of TyG index-related obesity indicators with conventional TyG indices is undertaken with a view to identifying the optimal diagnostic efficacy, and thus providing a novel rationale to inform the prevention and evaluation of sarcopenia.
2 Methods
2.1 Study population
NHANES provides data on a range of nutritional intake, health status, and lifestyle factors within the United States, encompassing both adults and children. The sampling methods employed are sophisticated and are designed to ensure the sample population is effectively representative of the overall population (18). Before data collection, NHANES obtained approval from the NCHS Ethics Review Board and informed consent from all participants. This research gathered data from 39,156 participants across four cycles of the NHANES conducted between 2011 and 2018. The following participants were excluded from the study: those who lacked fasting blood glucose, triglyceride, height, weight, and waist circumference data; those who could not determine the muscle mass data of the limbs by dual-energy X-ray absorptiometry (DXA); and those younger than 20 years of age. Ultimately, the study included 4,804 individuals. The process of data selection and exclusion is illustrated in Figure 1.
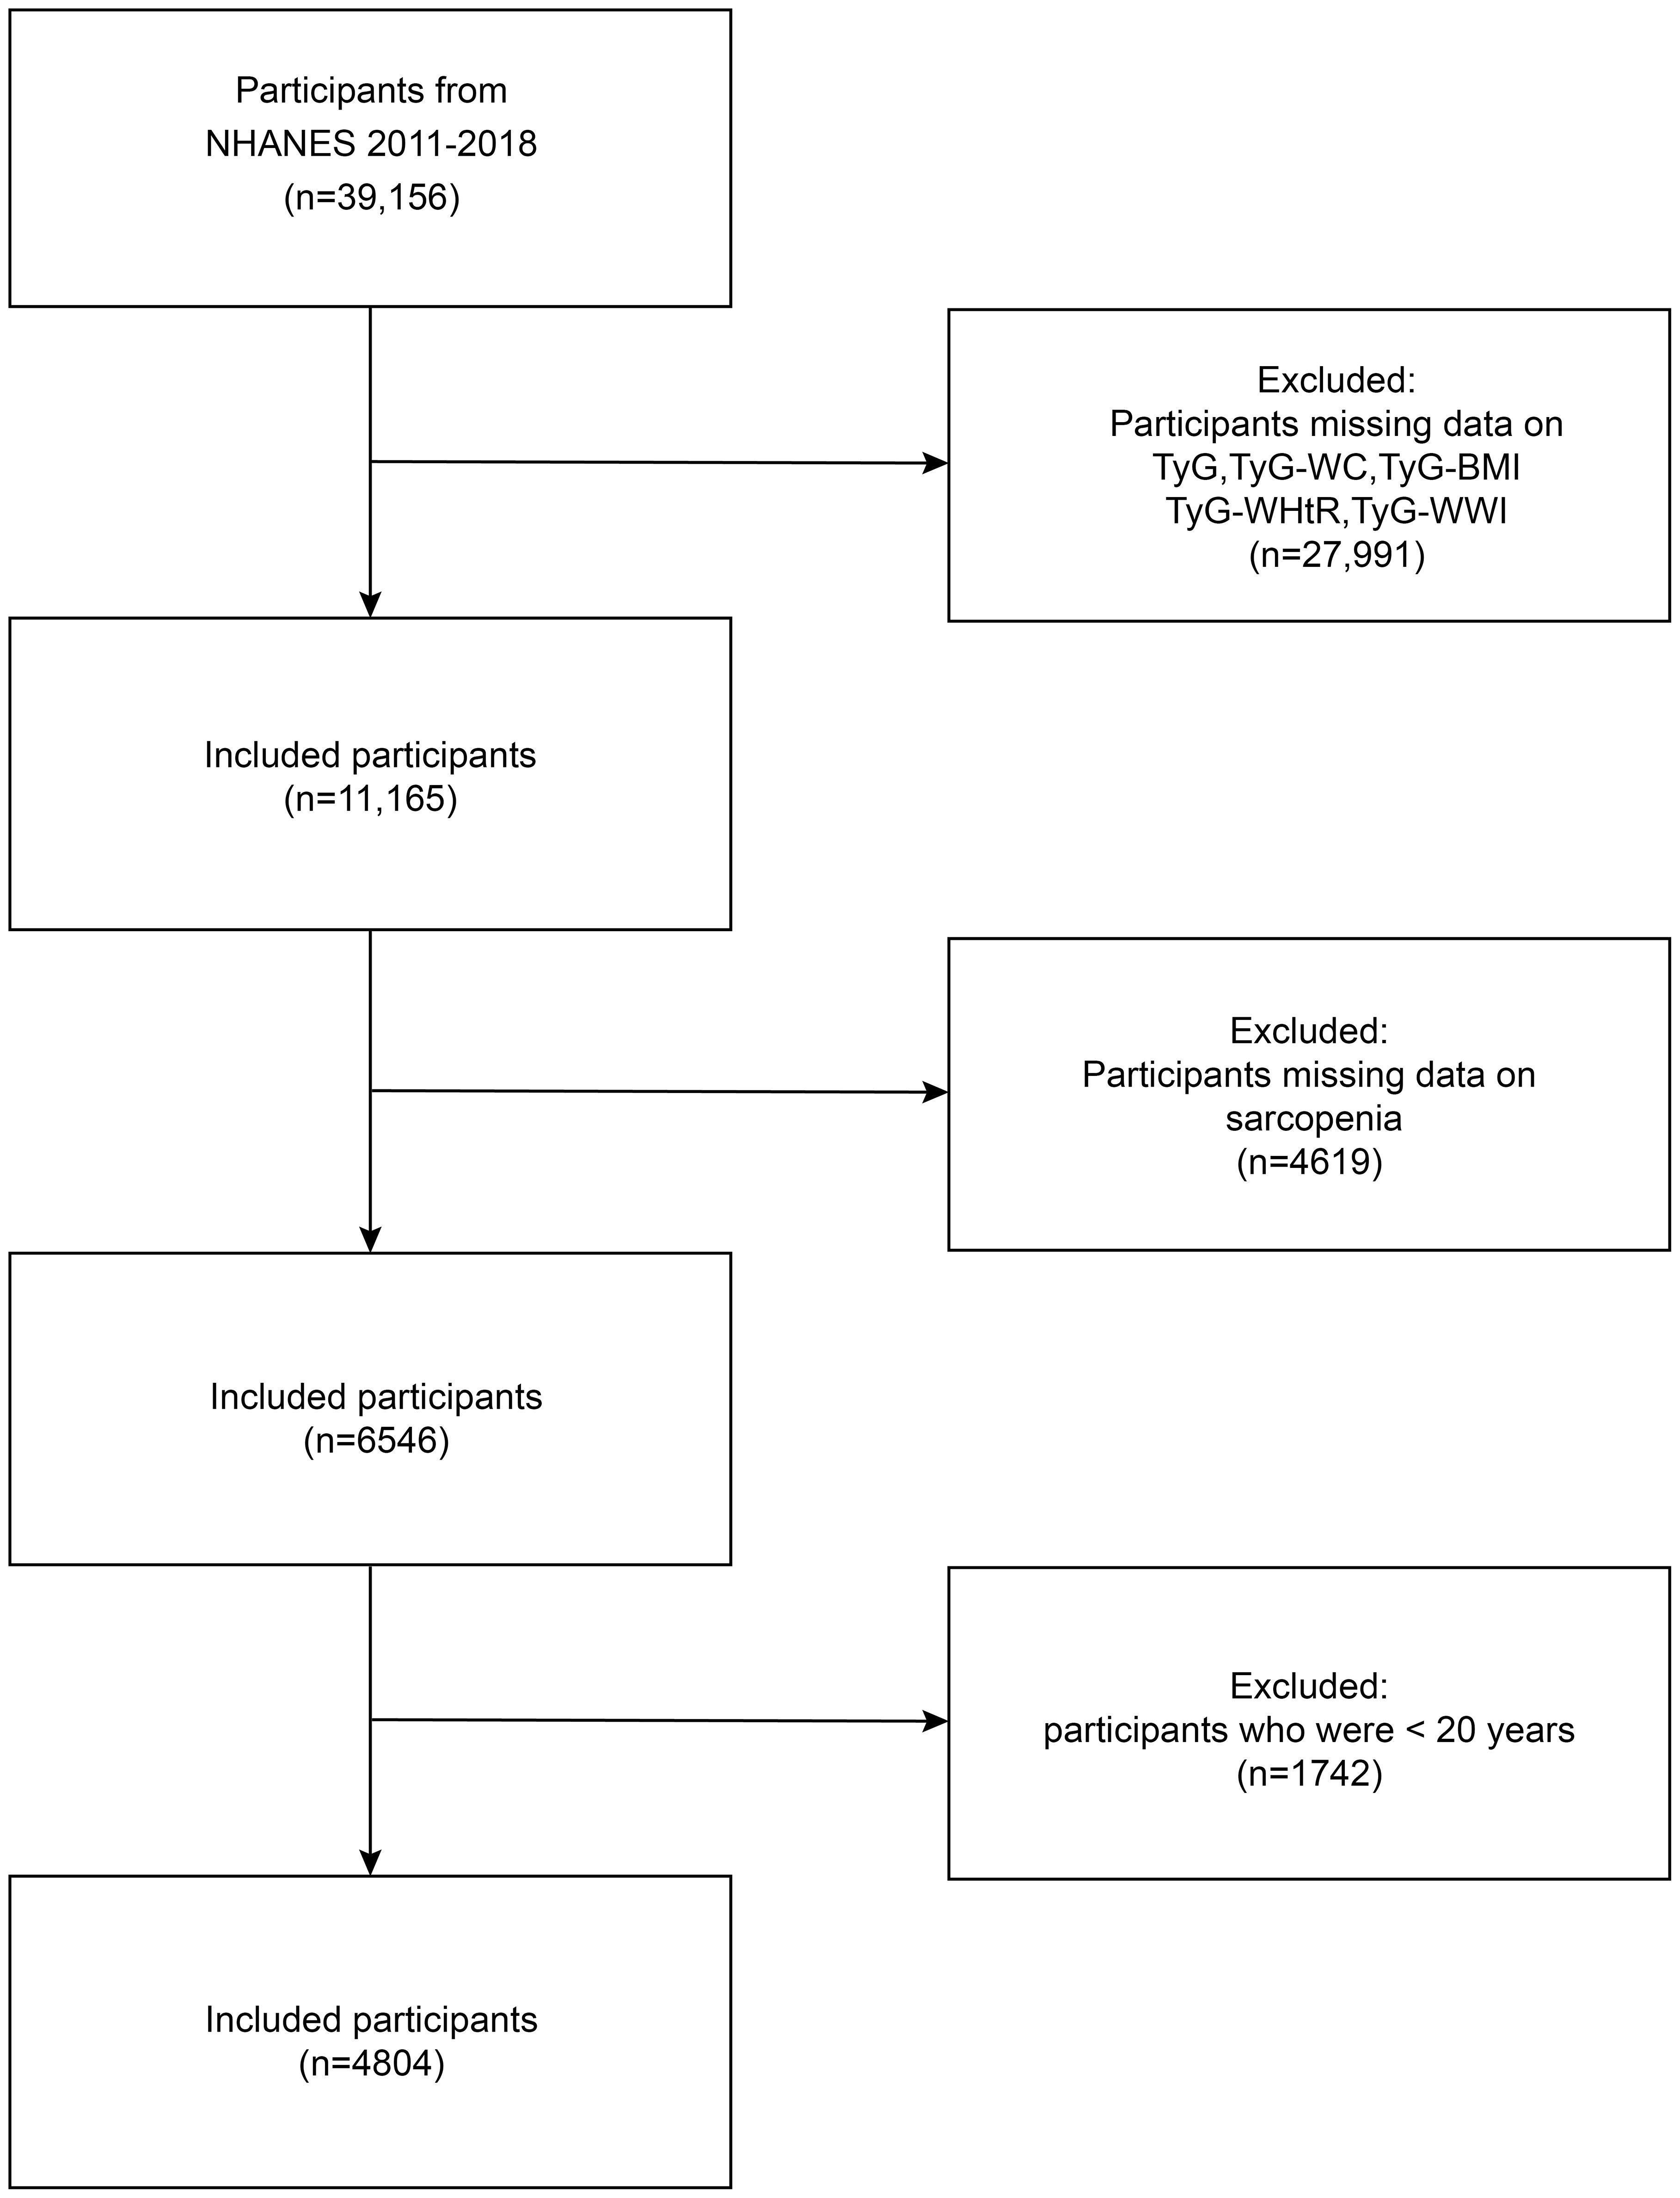
Figure 1. Flow chart of participants selection. NHANES, National Health and Nutrition Examination Survey, TyG-BMI, triglyceride glucose-body mass index, TyG-WC, triglyceride glucose-waist circumference, TyG-WHtR, triglyceride glucose-waist to height ratio, TyG-WWI, triglyceride glucose-weight-adjusted-waist index.
2.2 Definition and calculation of TyG and related obesity indicators
The TyG index is calculated from fasting blood glucose and triglyceride levels to quantify insulin resistance. Participants were required to fast for a period exceeding 8.5 hours, and blood samples were collected in the early hours of the morning and dispatched to the central laboratory where fasting glucose and triglyceride levels were measured. A comprehensive description of the laboratory procedures can be found on the official NHANES website (https://wwwn.cdc.gov/nchs/nhanes/). In addition, waist circumference, height, and weight were measured at the mobile examination center. The formula below is utilized to compute the TyG index: ln[triglyceride levels(mg/dL)×fasting glucose levels(mg/dL)/2]. Based on previous studies (14, 15), use this index to calculate other relevant obesity indices. WC was the waist circumference (cm); Body mass index(BMI)=weight(kg)/height2(m2); WHtR=WC(cm)/Height(cm); WWI=WC(cm)/√weight(kg); TyG-WHtR=TyG×WHtR;TyG-WWI=TyG×WWI; TyG-WC=TyG×WC; TyG-BMI=TyG×BMI.
2.3 Assessment of sarcopenia
The appendicular skeletal muscle mass (ASM) represents the skeletal muscle mass of the extremities, as determined by dual-energy X-ray absorptiometry (DXA). The DXA test was performed using the Hologic QDR-4500A fan-ray densitometer, and subjects were not required to fast before the test but were required to remove metal objects from their personal belongings and wear clothing without metal accessories. Pregnant women, those with a body weight greater than 136 kg, or those with a length greater than the range measured by the device were excluded. The definition of sarcopenia is derived from the guidelines established by the Foundation for the National Institutes of Health (FNIH). The sarcopenia index, calculated as ASM/BMI, is utilized to assess sarcopenia. A sarcopenia index of <0.512 for women and <0.789 for men is indicative of sarcopenia (19).
2.4 Covariates
The following covariates were included: gender, age, race, education level, poverty income ratio (PIR) smoking status, drinking status, hypertension, diabetes mellitus, moderate physical activity, triglycerides, and fasting glucose. Supplementary Table 1 provides definitions of smoking status, drink status, hypertension, diabetes, and moderate physical activity.
2.5 Statistical analysis
The statistical analysis used the R software (version 4.2.0) and the Epowerstats software. Statistical significance was determined using a P-value of <0.05. This research considered the intricate sampling design of NHANE and employed the recommended methodology for calculating sample weights to adjust the data. The weights utilized were as follows: WTMEC2YR/4. The relationships between four distinct TyG-related indices of obesity with sarcopenia were investigated by weighted multivariate logistic regression modeling, in which TyG-related obesity indices were both continuous and categorical variables. The present study employed three distinct adjustment models for its analytical procedures. Model 1 did not incorporate the use of covariates while Model 2 incorporates adjustments for gender, race, and age. Model 3 incorporates adjustments across all covariates. The non-linear relationship between the TyG-related obesity index and sarcopenia was investigated through the use of smoothed curve fitting. The subgroup analysis was also performed to investigate the effects of gender, age, BMI, diabetes mellitus, hypertension, and moderate to moderate physical activity, with further interaction tests. Furthermore, the diagnostic effectiveness of TyG, four distinct TyG-related indices of obesity in identifying sarcopenia through receiver operating characteristic (ROC) curve analysis, determining the area under the curve (AUC) to assess the sensitivity and specificity in predicting sarcopenia. Then, the area under the ROC curve of four different TyG-related obesity indices and the TyG index were compared by using the method of DeLong et al. to observe whether these indices had statistically significant differences and which index had the best predictive ability (20). Finally, The Benjamini-Hochberg (BH) method was employed to perform false discovery rate (FDR) correction on the P-value obtained by using the method of DeLong et al. and to observe whether the corrected result was significant.
3 Results
3.1 Baseline characteristics
Table 1 presents the fundamental characteristics of the participants. The study included 4,804 participants, among whom 428 met the criteria for sarcopenia, representing a prevalence of 8.91%. The mean age(95% CI) of the sarcopenic individuals was 39.57(39.03, 40.10), and the mean BMI was 28.64(28.32, 28.96). In comparison to non-sarcopenic patients, those with sarcopenia are distinguished by a higher age, a higher BMI, elevated fasting glucose and triglyceride levels, and a lower PIR and educational attainment. The prevalence of sarcopenia is elevated in men, Mexican Americans, individuals who consume alcohol, smokers, those with elevated blood pressure, diabetics, and those who do not engage in moderate physical activity.
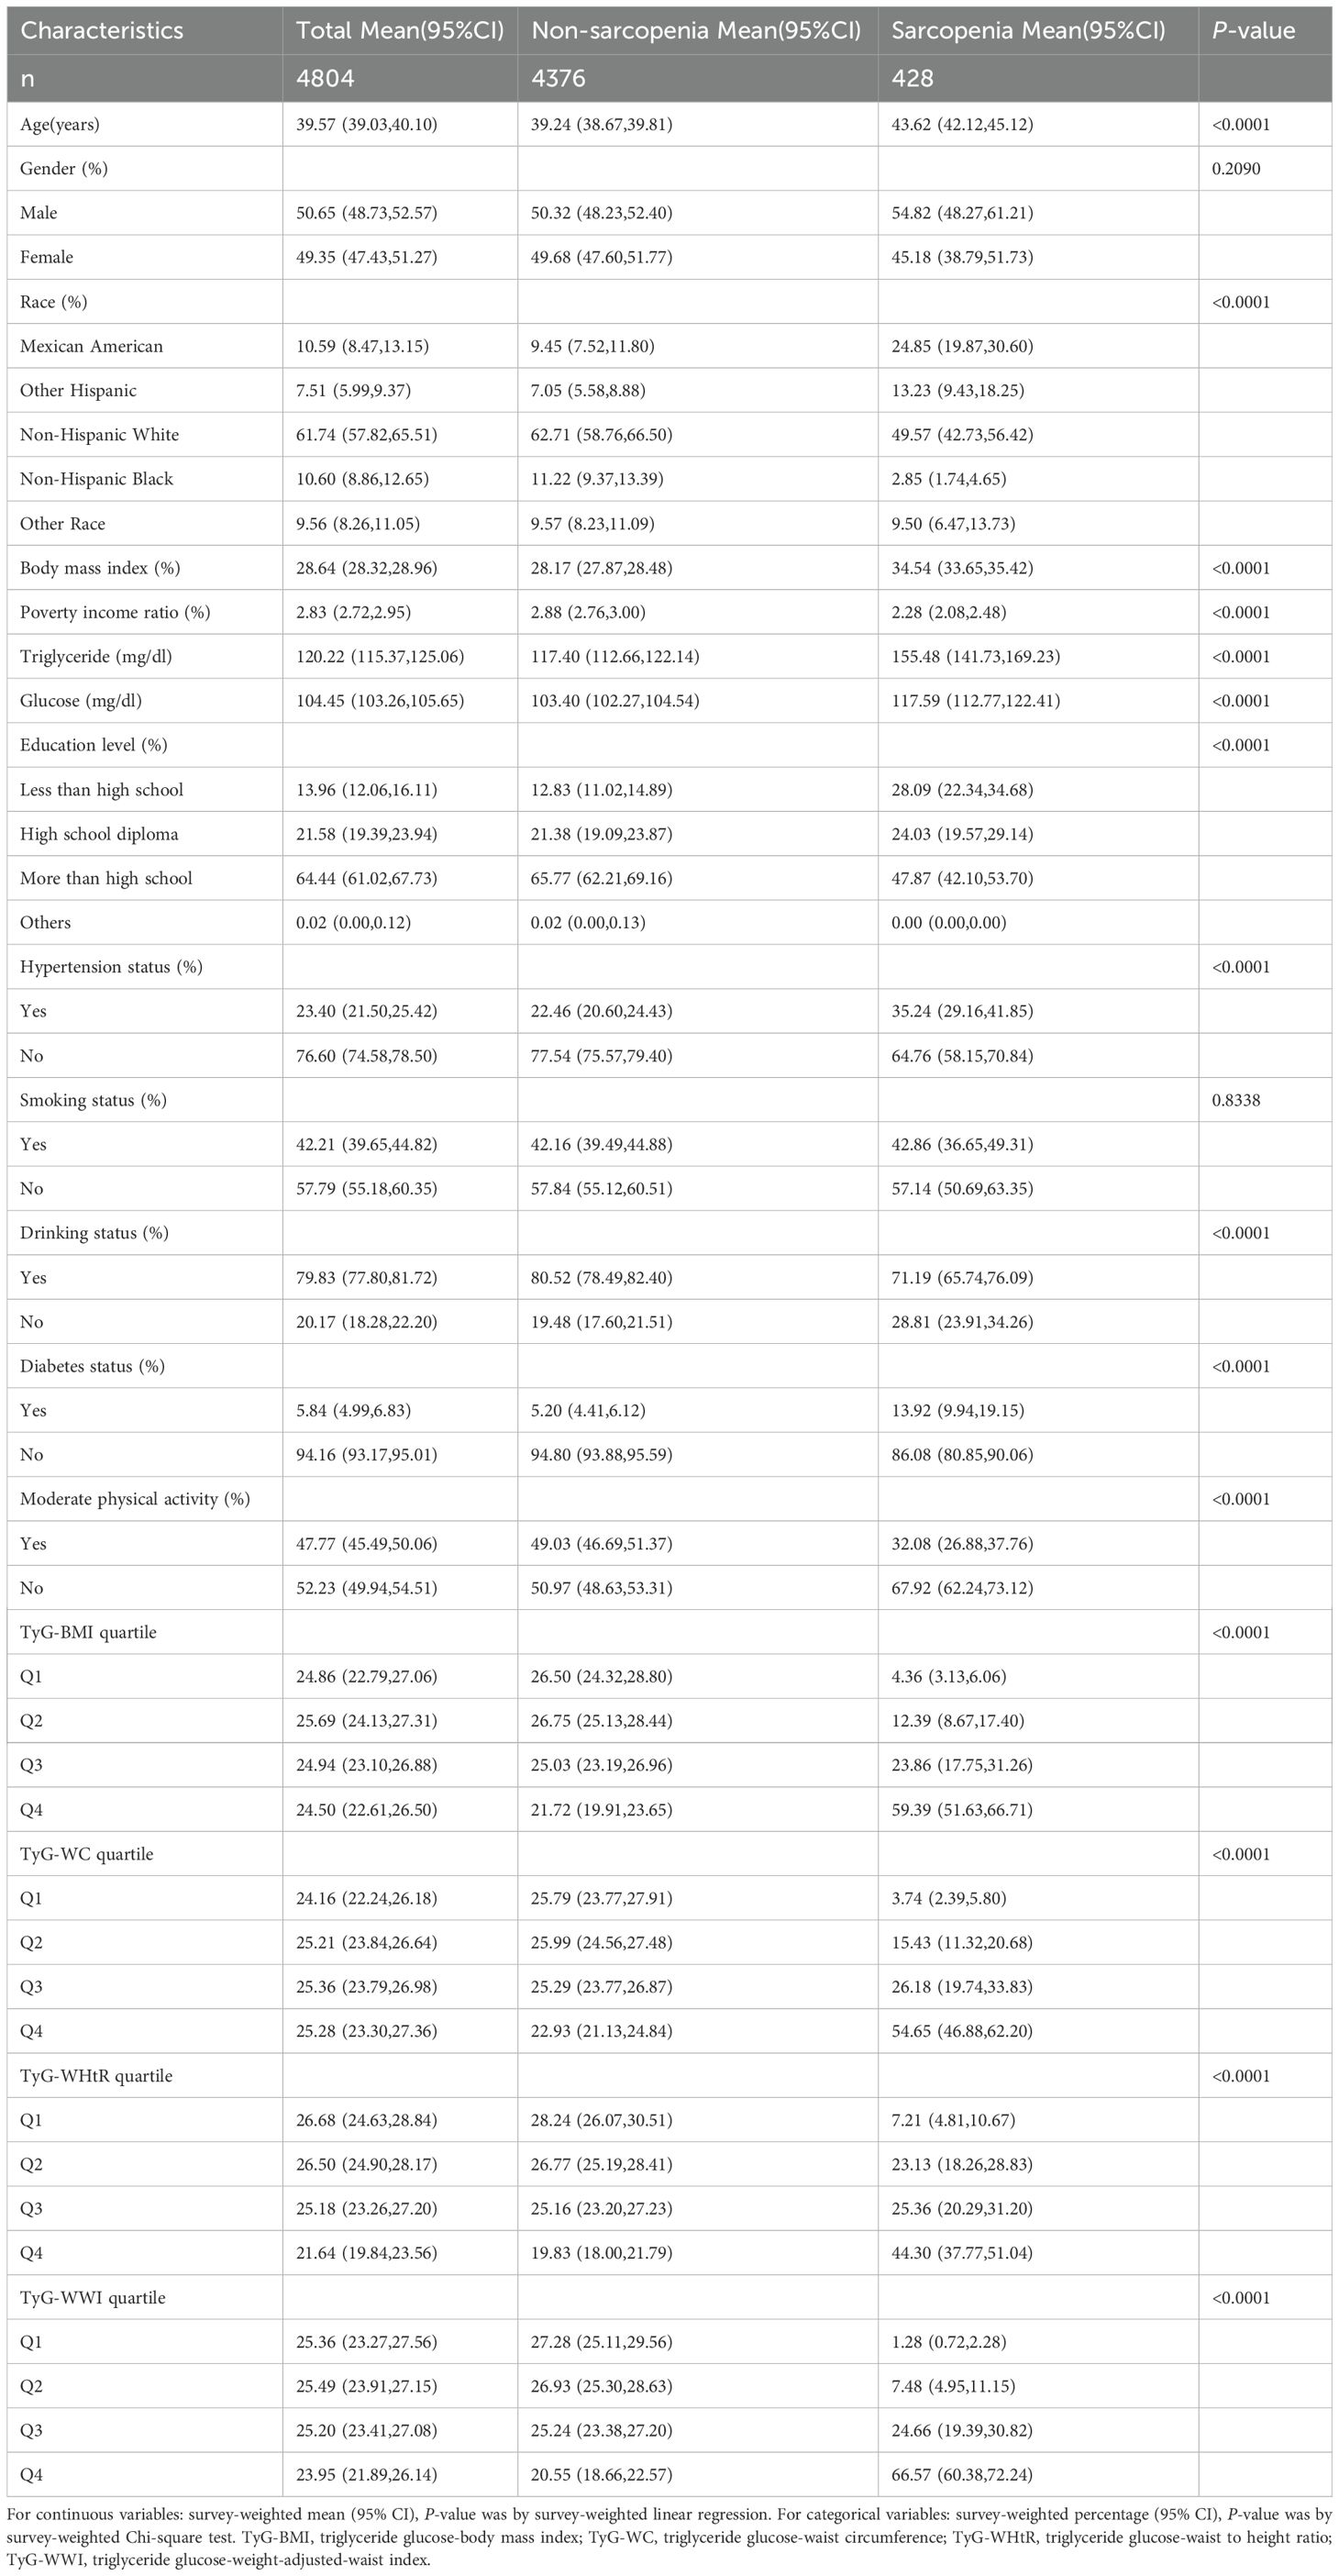
Table 1. The basic characteristics of the participants.
In order to obtain a comprehensive overview of the discrepancies in the distribution of each parameter, the individual indices were classified into quartiles. As demonstrated in Supplementary Tables 2–5, the quartiles with the highest TyG-related obesity indices demonstrated a higher prevalence of sarcopenia than the lowest.
3.2 Association between TyG-related obesity indicators and sarcopenia
As presented in Table 2, Model 3 revealed a significant positive correlation between the TyG-WWI, TyG-WHtR, TyG-BMI, and TyG-WC and the prevalence of sarcopenia after controlling for potential confounding factors[TyG-WHtR: OR (95% CI): 1.51 (1.33, 1.72); TyG-WWI: OR (95% CI): 1.21 (1.18, 1.24); TyG-BMI: OR (95% CI): 1.15 (1.13, 1.18); TyG-WC: OR (95% CI): 1.70 (1.55, 1.87)]. The prevalence of sarcopenia was 13.96 and 81.89 times higher in the highest quartile of TyG-BMI and TyG-WWI, respectively, compared to the lowest quartile (TyG-BMI: OR=13.86,95% CI:9.05, 21.23; TyG-WWI: OR=81.89,95% CI:38.49, 174.22). Furthermore, the examination of the trend showed that all indices were statistically significant (all P for trend < 0.0001).
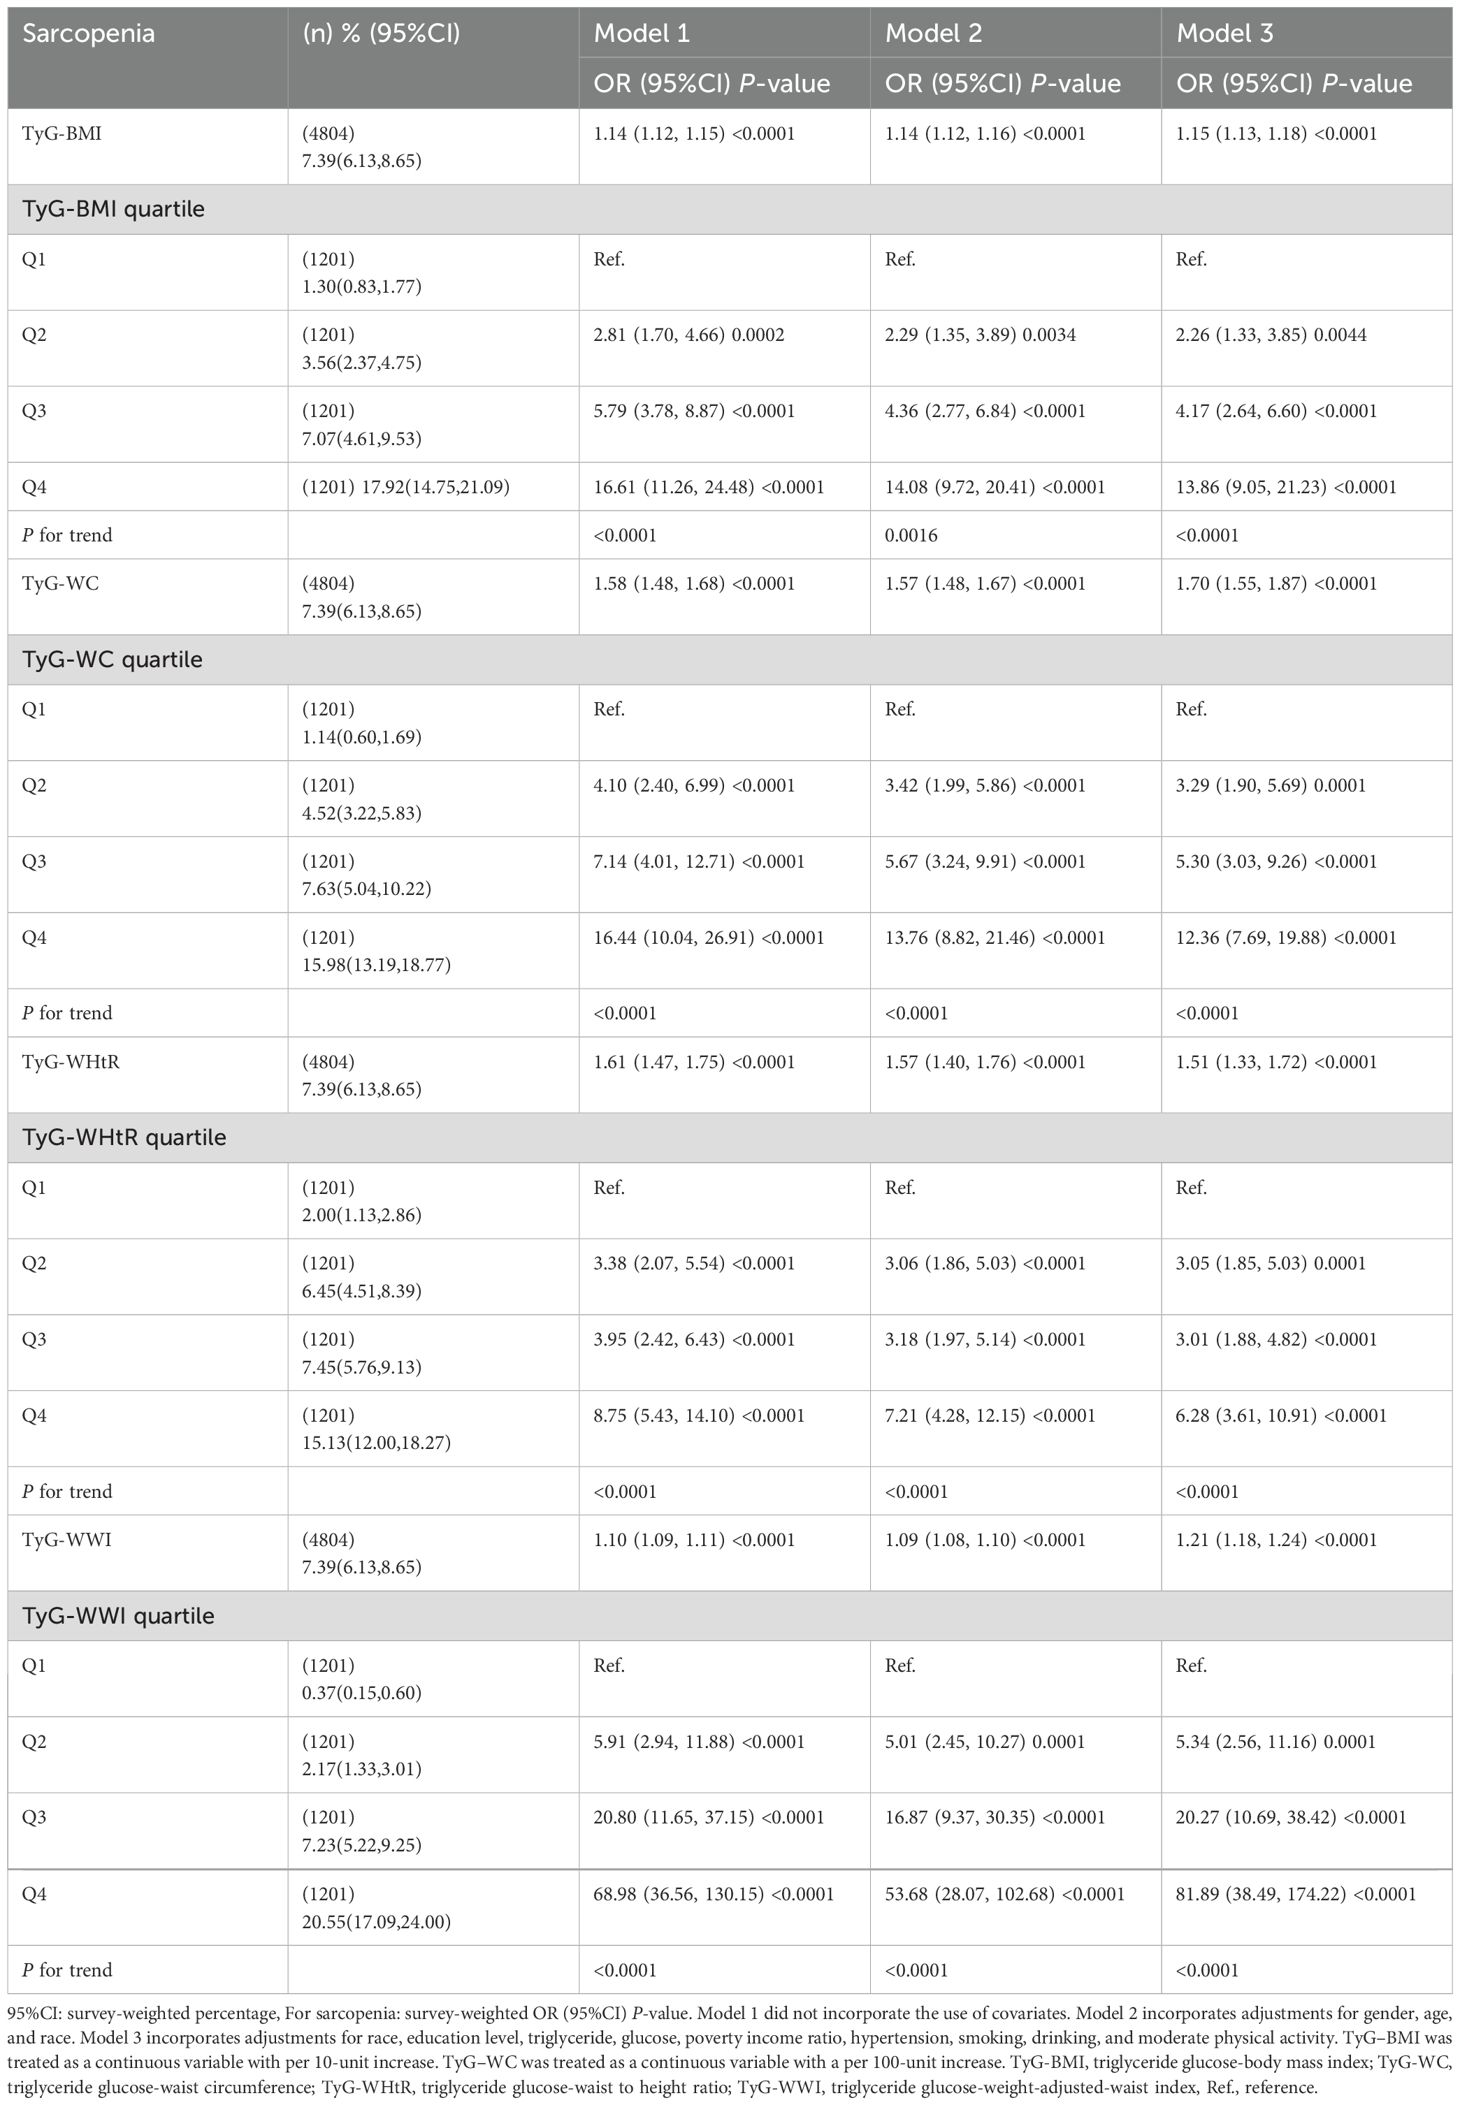
Table 2. Associations between TyG-related obesity indices and sarcopenia.
3.3 Subgroup analysis
Subgroup analysis and interaction tests were performed for gender, age, BMI, diabetes and hypertension, and moderate physical activity, as illustrated in Table 3. The correlations between TyG-BMI, TyG-WHtR, and TyG-WWI and sarcopenia differed in stratification by gender, age, BMI ≥30, diabetes mellitus, hypertension, and moderate physical activity (P<0.05). The correlations of TyG-BMI, TyG-WHtR, and TyG-WWI with sarcopenia were more significant in the stratification of gender and BMI ≥30 (P for interaction<0.05).
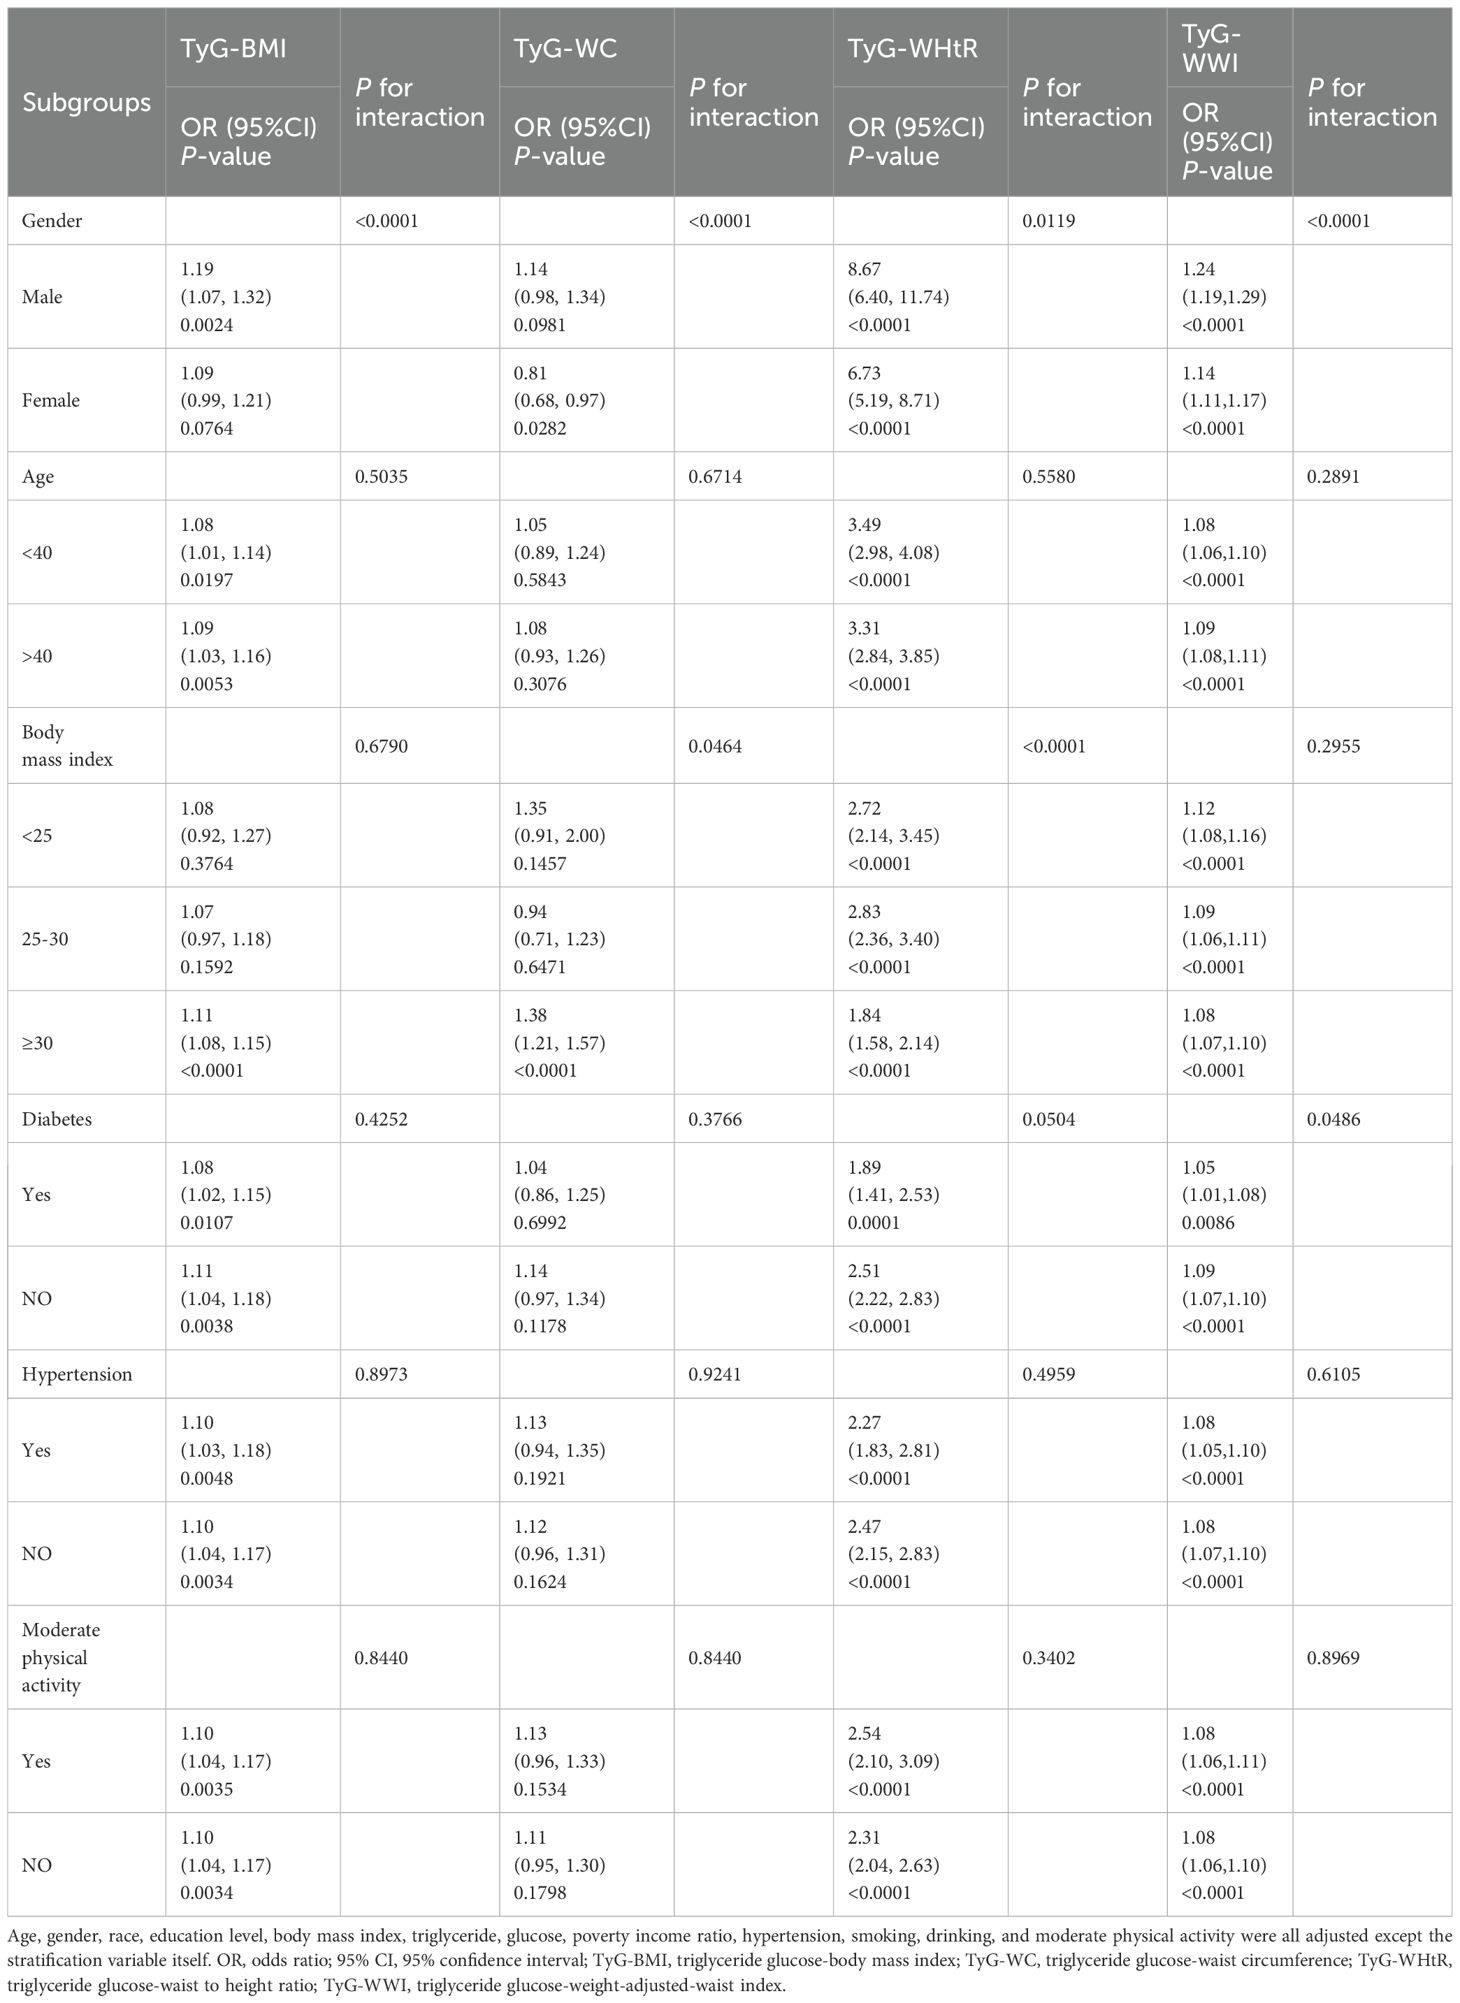
Table 3. Subgroup analysis for the association between TyG-related obesity indices and sarcopenia.
3.4 Smooth curve fitting between TyG-related obesity index and sarcopenia
As illustrated in Figure 2 following the adjustment for all covariates in accordance with Model 3, a nonlinear correlation was detected among four distinct TyG-related indices of obesity and sarcopenia.
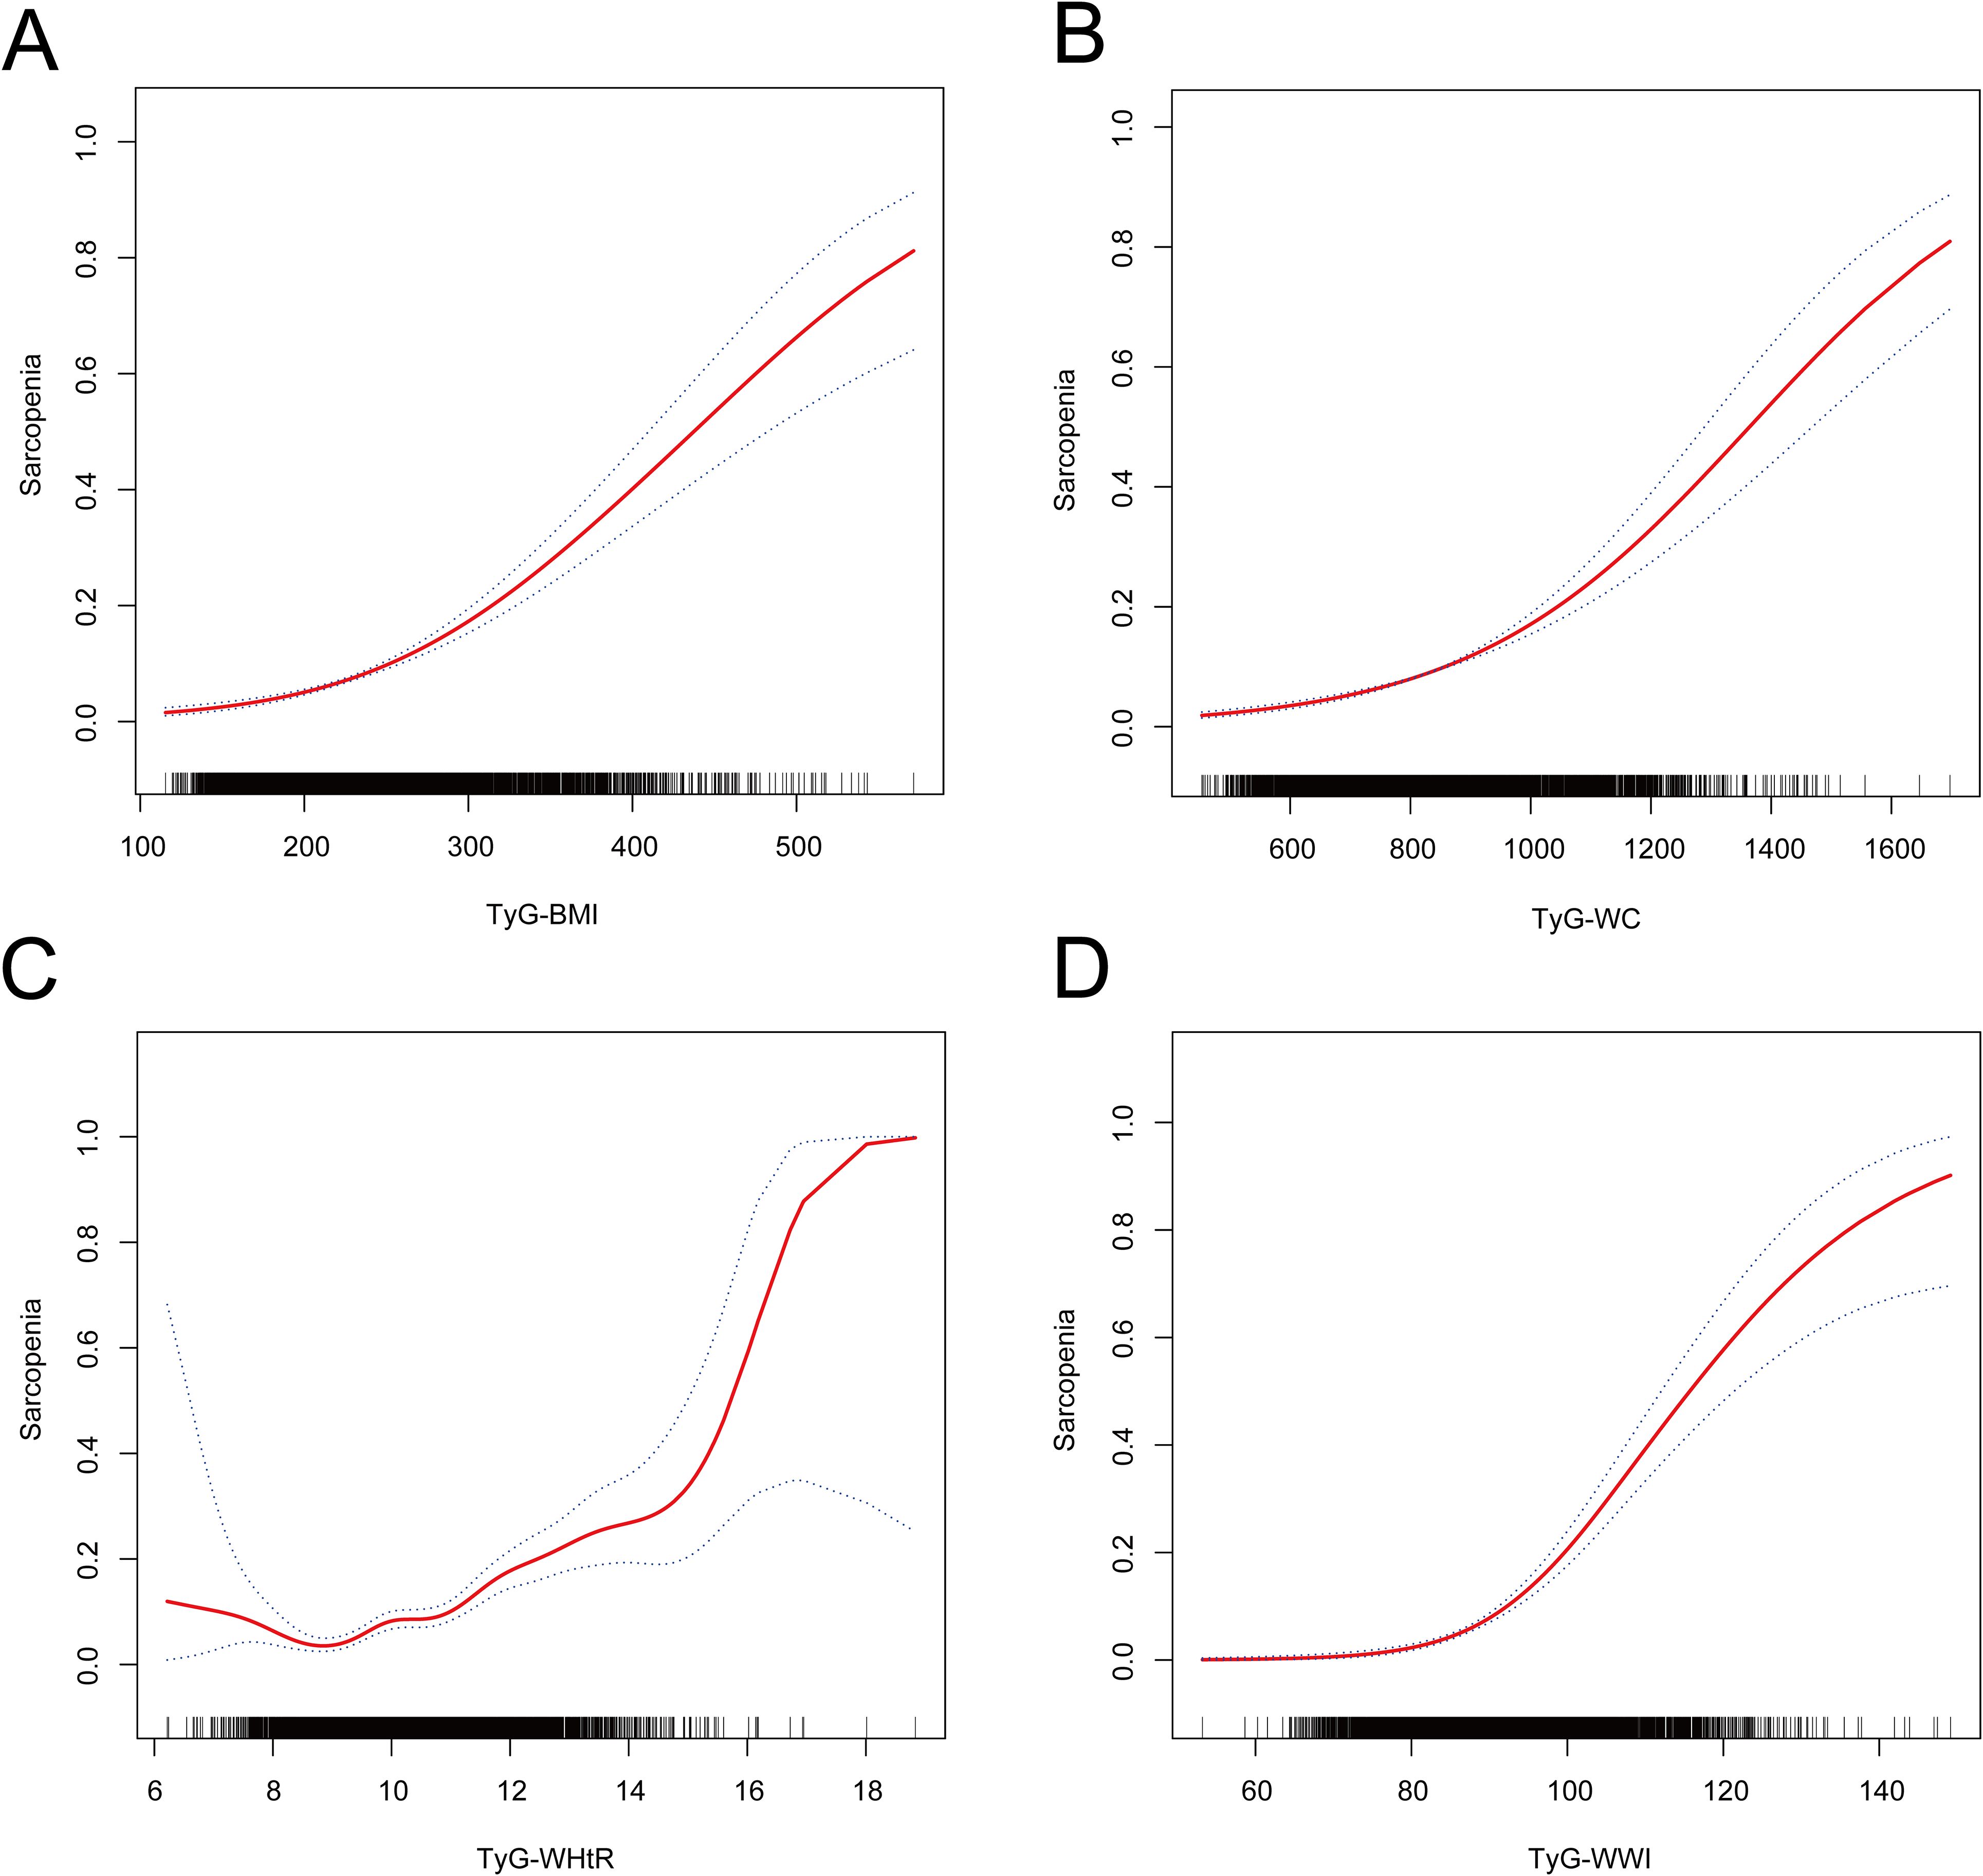
Figure 2. The non-linear relationship between TyG-related obesity indices and sarcopenia. The solid red line represents the smooth curve fit between variables. The blue bands represent the 95% confidence interval from the fit. Adjusted for age, gender, race, education level, body mass index, triglyceride, glucose, poverty income ratio, hypertension, smoking, drinking, and moderate physical activity. (A) Nonlinear relationship of TyG-BMI and sarcopenia. (B) Nonlinear relationship of TyG-WC and sarcopenia. (C) Nonlinear relationship of TyG-WHtR and sarcopenia. (D) Nonlinear relationship of TyG-WWI and sarcopenia.
3.5 ROC curve of TyG index versus TyG-related obesity index levels for diagnosis of sarcopenia
As illustrated by Figure 3 and Table 4, TyG-WWI demonstrated the optimal performance, exhibiting the highest AUC value (0.8020). In comparison with other indices, the P values were all <0.0001, following the implementation of the FDR correction, the P value remained statistically significant, signifying significantly superior predictive capabilities compared to the other indices. Further analysis shows that the critical value of TyG-WWI is 97.6575, at which time the sensitivity of diagnosing sarcopenia is 0.7313 and the specificity is 0.7283. TyG-BMI exhibited the second-best predictive performance, with an AUC value of 0.7370, which surpassed the performance of TyG, TyG-WC, and TyG-WHtR. The critical value of TyG-BMI is 246.1511, at which time its sensitivity of diagnosing sarcopenia is 0.7570 and the specificity is 0.5866. The predictive performance of TyG-WC and TyG-WHtR was relatively close, with AUC values of 0.7148 and 0.7136, respectively, and there was no statistically significant difference between them (P value=0.9503). The predictive performance of TyG was the weakest, with the lowest AUC value (0.6680), and in compared with other indices, the P values were all <0.0001, following the implementation of the FDR correction, the P value remained statistically significant, indicating significantly worse predictive performance than other indices. Therefore, TyG-WWI is the indicator with the best predictive performance among all indicators, with the highest AUC value and statistically significant evidence superior to other models. TyG-BMI’s predictive performance was second best. TyG-WC and TyG-WHtR were also effective predictors, although not as effective as TyG-BMI and TyG-WWI. TyG exhibited the poorest predictive performance.
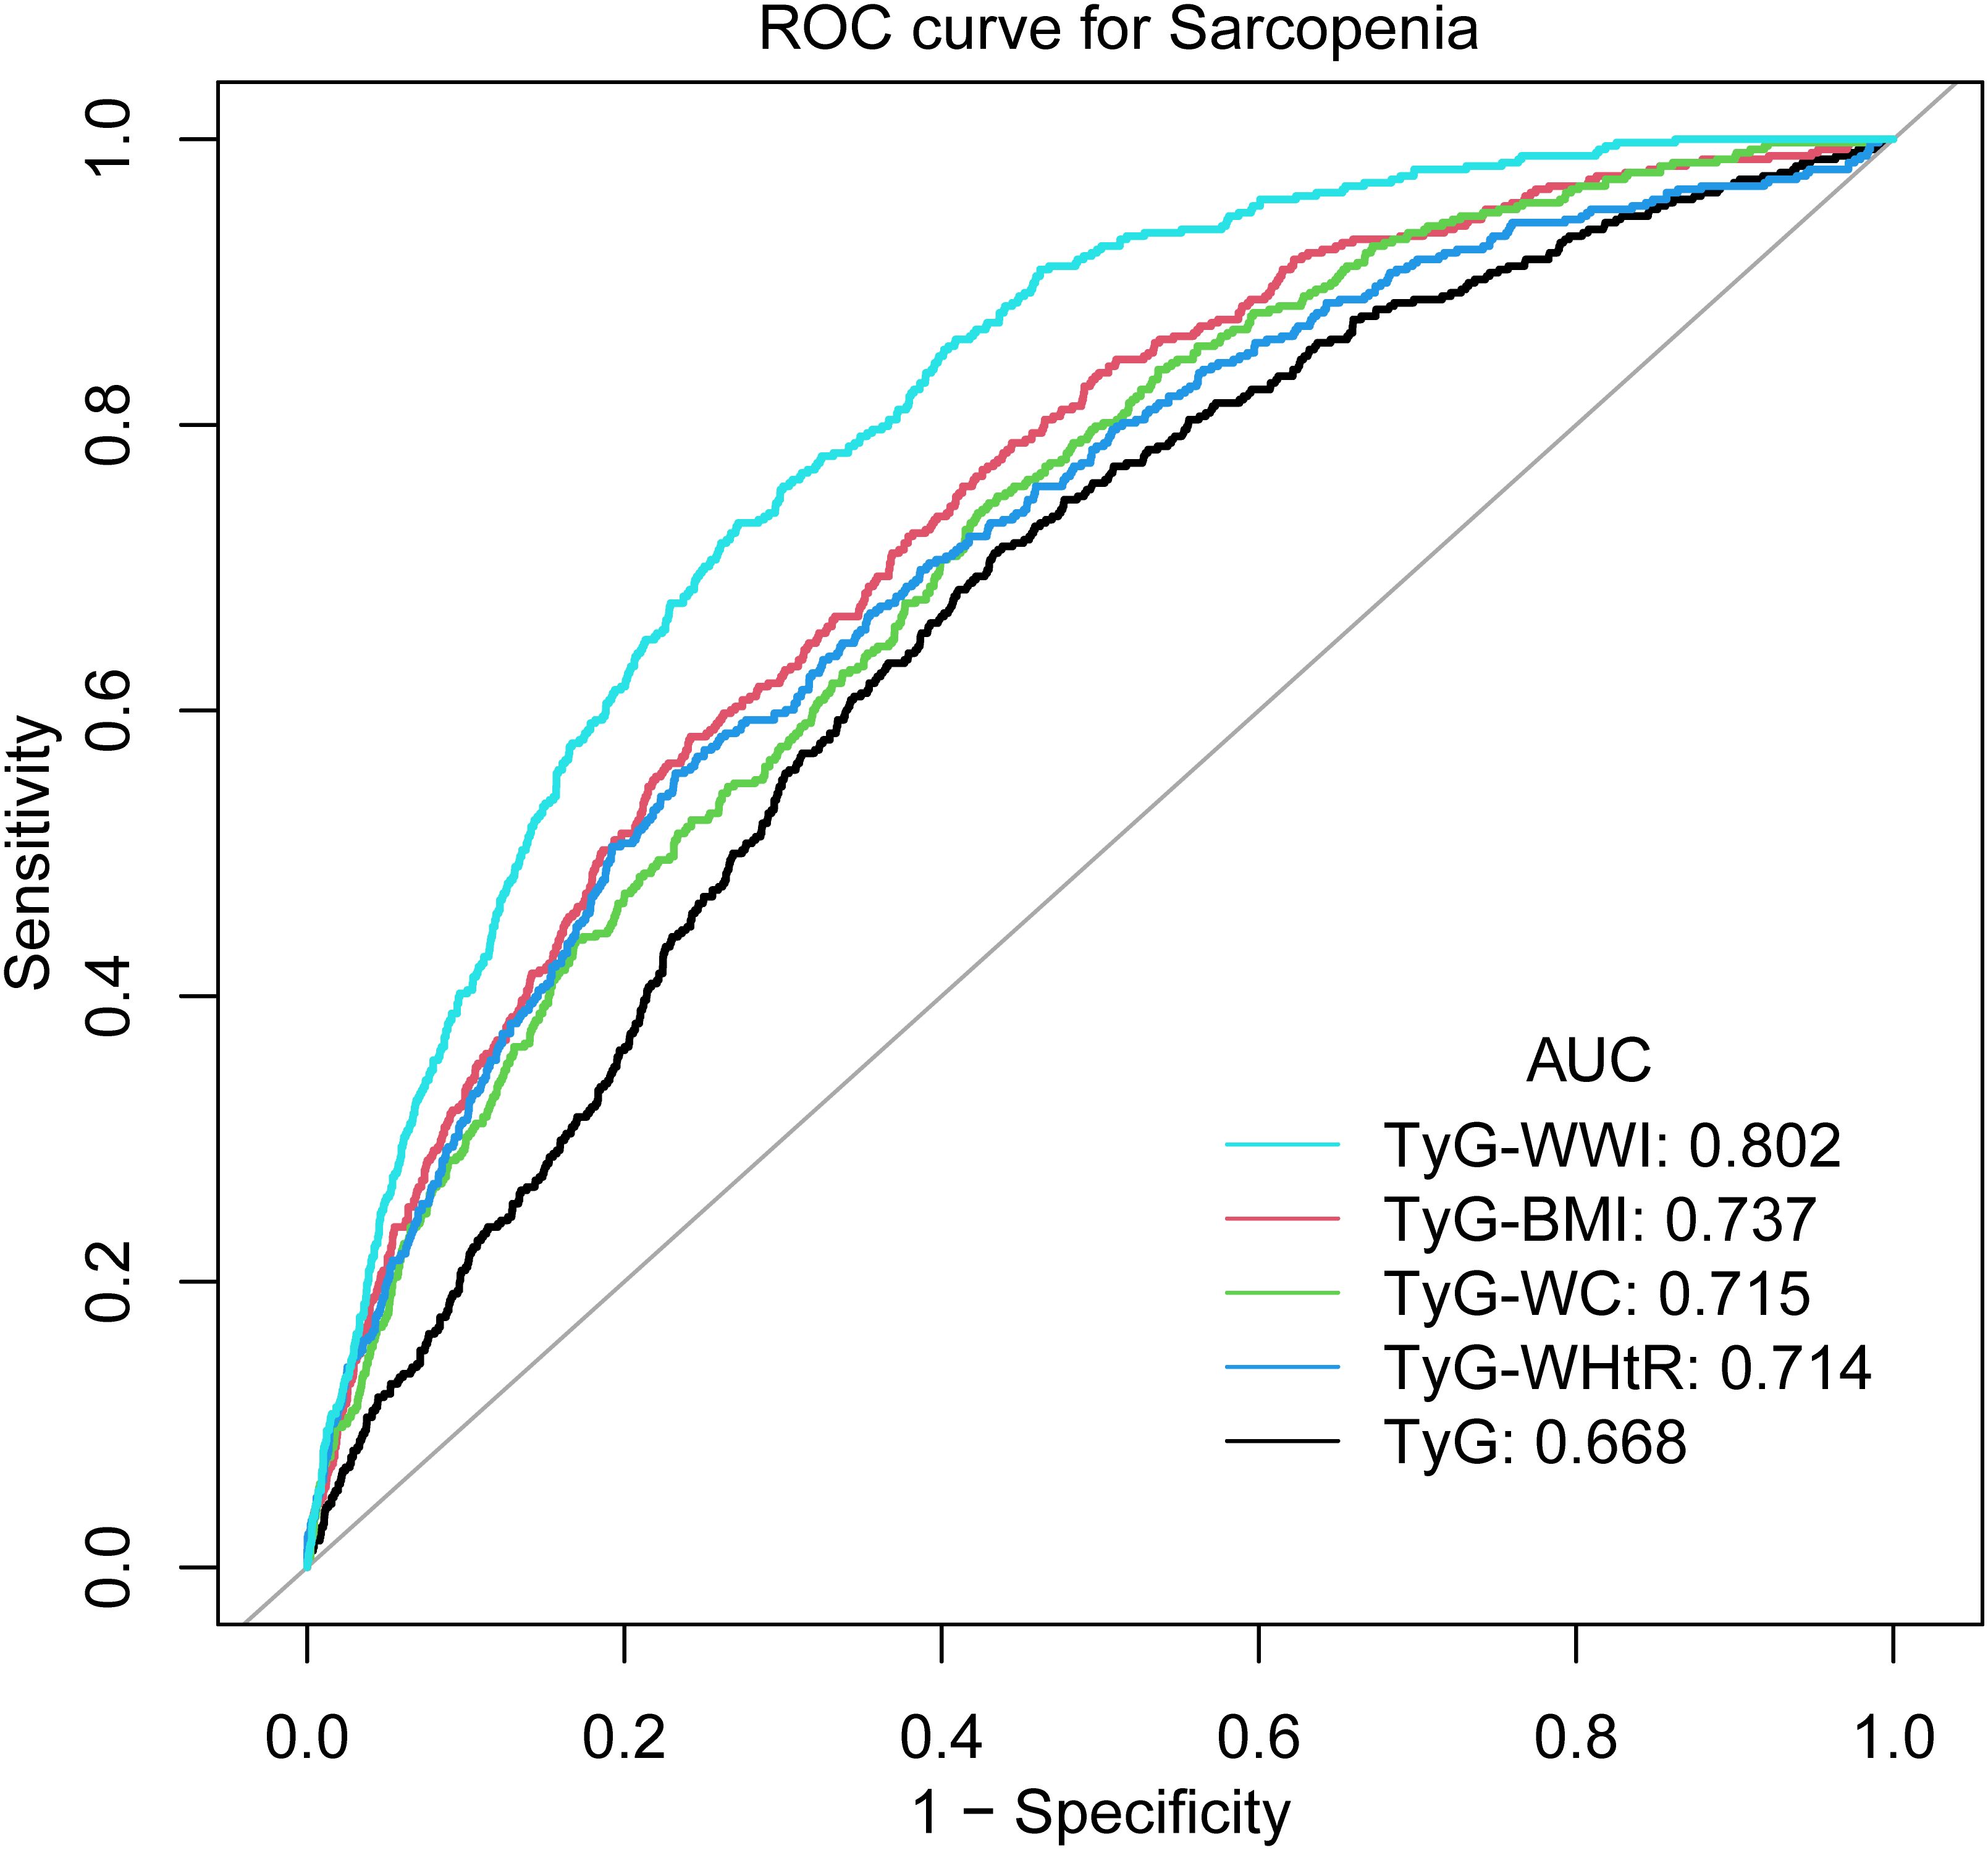
Figure 3. ROC curves of TyG-related obesity indices levels in diagnosing sarcopenia.
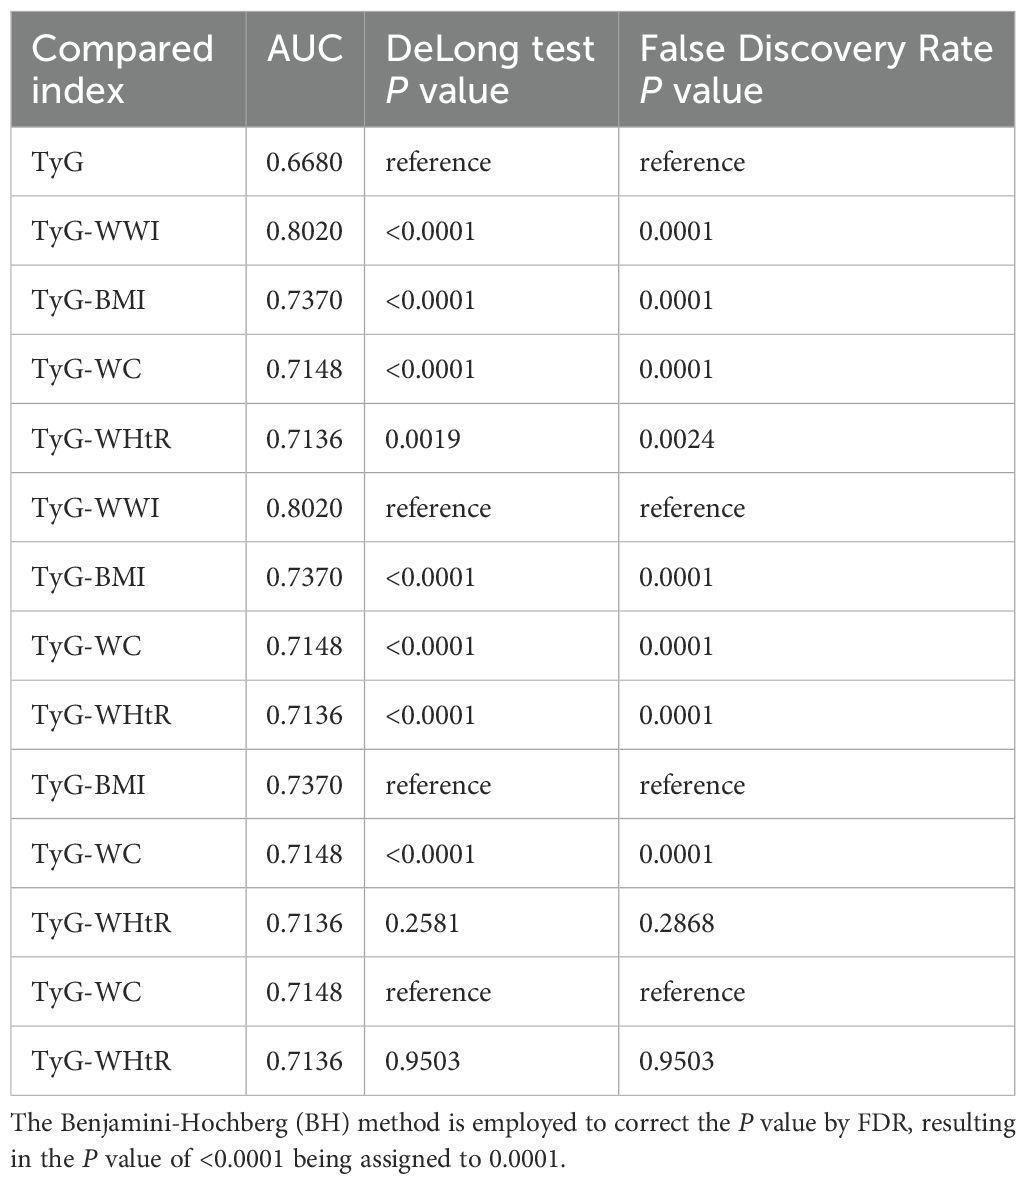
Table 4. Delong test and false discovery rate of ROC curves.
3.6 Sensitivity analysis
In Supplementary Table 6, this study examined the correlation between TyG-related obesity indices and ASM. In Model 3, TyG-BMI, TyG-WHtR, TyG-WWI, and TyG-WC displayed significant negative correlations with ASM. These findings indicate that increases in the four TyG-related obesity indices may correspond to decreases in muscle mass. Furthermore, the study explored the association between the TyG index and sarcopenia, as presented in Supplementary Table 7, revealing a significant positive correlation between the TyG index and sarcopenia.
4 Discussion
This cross-sectional study included 4,804 participants, with 428 diagnosed with sarcopenia. Our findings revealed a notable and positive correlation among TyG-WWI, TyG-BMI, TyG-WHtR and TyG-WC with a prevalence of sarcopenia. The aforementioned relationship remained consistent when the indices were divided into quartiles. Subgroup analysis revealed a more pronounced correlation between four indices and sarcopenia in the gender-stratified subgroup with a BMI of 30 or above. Additional ROC analysis demonstrated that the diagnostic effectiveness of four TyG-related obesity indicators was more pronounced than that of TyG. Notably, TyG-WWI demonstrated the best diagnostic efficacy in identifying individuals with sarcopenia.
Sarcopenia risk begins to escalate as early as young adulthood, with a global prevalence approximating 10% in individuals (21). Longitudinal analysis of the NHANES 1999-2006 cohort further corroborates this trend, demonstrating a significant rise in sarcopenia prevalence among adults aged 18-39 years over the study period (22). As the physical activity of young people gradually declines, there is a concomitant decrease in muscle mass and strength (23, 24). The loss of muscle mass in young people has been demonstrated to have a detrimental effect on the prevalence of sarcopenia (25). Despite the relatively low prevalence of sarcopenia in young adults, the prolonged duration of muscle loss in youth has the potential to result in elevated morbidity over time (26). Consequently, the identification and prevention of sarcopenia in young people has the potential to reduce its prevalence. Early identification and treatment of sarcopenia in young people are necessary to limit the progression of the disease and related complications (27). The present study demonstrated that TyG-WWI and TyG-BMI exhibited considerable predictive and early recognition value for sarcopenia in young and middle-aged individuals. These indicators may also contribute to delaying the progression of sarcopenia in the elderly population. Our findings demonstrate that the TyG-WWI and TyG-BMI exhibit robust predictive and discriminative capacities for identifying sarcopenia in young and middle-aged populations. These indices may further contribute to delaying the progression of geriatric sarcopenia. Notably, TyG-related obesity indicators are characterized by both low cost and ease of clinical access. This renders them particularly suitable for early screening of sarcopenia risk in middle-aged and elderly populations. The subsequent effect of this is to guide early treatment and intervention, such as resistance training (28, 29). In light of the escalating prevalence of obesity and the growing incidence of metabolic disorders among the younger population (30, 31), the prevention and monitoring of sarcopenia and its associated complications in middle-aged and young adults has become a pressing concern. At present, there has been a paucity of research conducted on this population. The findings of this study provide a basis for further research in this area, suggesting that individuals of both the young and middle-aged should observe and monitor the dynamic changes in the TyG-WWI and TyG-BMI indexes.
A number of the most recent studies corroborate our assertion. Although TyG-related obesity indices have been less well studied in relation to sarcopenia, TyG indices have been observed to be associated with low muscle mass as well as sarcopenia in various populations. Two population-based studies in Korea have established a connection between this indicator and the likelihood of low muscle mass (16, 32). The findings of Yang et al. indicated a favorable relationship between the TyG index and sarcopenia in US adults (17). Pan et al. have shown a nonlinear positive connection between TyG-BMI and sarcopenia (21). This finding is aligned with the results of our study. However, the previous research was limited in that it examined the TyG-BMI as a standalone index and did not compare it with other indications, which include the TyG indicator and those related to obesity. Our study proceeded to investigate whether the four distinct TyG-related indices of obesity exhibited a greater predictive capacity for sarcopenia compared to a single TyG index. It is noteworthy that the TyG-WWI index exhibited optimal diagnostic validity for sarcopenia, which may potentially serve as a predictor of sarcopenia.
Our subgroup analysis revealed a significant influence of gender on the relationship between TyG-WWI, TyG-WHtR, TyG-BMI, and sarcopenia. Previous studies have come to similar conclusions as ours (21). The results of some population-based surveys suggest that gender and risk with regard to sarcopenia are not entirely consistent (33, 34). Estrogen may be a factor influencing the gender differences observed in this association between males and females (35). A deficiency of estrogen has been linked to the atrophy of skeletal muscle and the accumulation of fat tissue, as well as the suppression of fatty acid beta-oxidation in both skeletal muscle and fat tissue. The development of sarcopenia is believed to be influenced by this factor (36–38). Chen et al. show that changes in estrogen levels may attenuate the correlation between the TyG index and sarcopenia in women (39). Subjects with a BMI of 30 or greater showed significant positive associations with sarcopenia concerning four indices. The relationship between sarcopenia and IR is affected by obesity, particularly in the context of sarcopenic obesity, where IR status is negatively correlated with skeletal muscle mass (40). An investigation conducted on elderly Chinese patients with diabetes revealed a heightened sarcopenia risk connected to elevated body fat levels., which supports the aforementioned findings (41). Therefore, obesity may influence the development of sarcopenia and the correlation between sarcopenia and TyG-related indices of obesity.
IR is a significant contributor to the initiation and advancement of sarcopenia. Furthermore, the extent of IR is influenced by the magnitude of sarcopenia severity, whereby the presence of obesity plays a pivotal role in this interconnection (8, 42). IR stimulates the release of sarcopenia, which in turn reduces protein synthesis in skeletal muscle and accelerates skeletal muscle protein catabolism (8). Simultaneously, sarcopenia can facilitate IR through lipotoxicity and inflammation resulting from lipid infiltration and aberrant accumulation, as well as by reducing the percentage of type I fibers in skeletal muscle (43). The results of an NHANES III-based study demonstrated that sarcopenia intensified obesity-related insulin resistance (44). This indicates the potential for a complex interrelationship between IR, obesity, and sarcopenia. At present, there is a greater understanding of the intricate relationships between IR, obesity, and sarcopenia. Prior research has indicated that individuals with sarcopenia may be predisposed to an increased risk of obesity as a consequence of their diminished activity levels (45). Obesity is often associated with a degree of inflammation. Fat accumulation often triggers an inflammatory response that leads to fat infiltration of skeletal muscle and the gradual formation of intermuscular adipose tissue (IMAT) and intracellular myocyte lipid droplets (IMCL), which are key contributors to the muscle resistance to IR (46, 47). Abnormal lipid accumulation also induces mitochondrial dysfunction, exacerbates local oxidative stress and inflammation, and contributes to the inhibition of the insulin-PI3K-mTOR pathway by protein kinase C (PKC) and p38-MAPK (48). Inflammatory cytokines have been shown to induce muscle atrophy (49), and their elevated levels impede the synthesis of insulin and insulin growth factor 1(IGF-1), further exacerbating the development of IR (50).
The present study has the following advantages: This is the inaugural study to investigate the connection among distinct TyG-related obesity indicators with sarcopenia in a US population using data from the NHANES database. Secondly, the study adjusted for potential confounding variables wherever possible and performed subgroup analysis and interacting tests to examine the impact of various elements on the relationship among the TyG-related obesity indicators with sarcopenia. Ultimately, we used ROC curves to judge the diagnostic effectiveness of individual TyG-related obesity indices and identify superior indicators compared to the TyG index, thereby establishing a novel reference for evaluating and predicting sarcopenia. It should be noted that the current study has limitations. First, the cross-sectional study design hinders the identification of causality connection among the indices with sarcopenia. Second, although this study adjusted for a considerable number of confounding variables, it was nevertheless not possible to rule out the potential impact of undetected confounders on the findings. Finally, due to an absence of data about muscle function (e.g. gait speed) in the NHANES data, the assessment of sarcopenia relied exclusively on DXA-derived body composition measures and more professional and comprehensive diagnostic criteria for sarcopenia could not be applied. Furthermore, due to the limitations of DXA, the study’s participants ranged in age from 20 to 59 years, precluding in-depth investigation of the older population. It is therefore recommended that future research employ more longitudinal studies to explore this issue in greater depth.
5 Conclusions
The TyG-WWI, TyG-WHtR, TyG-BMI, and TyG-WC demonstrated a nonlinear and significant positive correlation with a prevalence of sarcopenia. Furthermore, these four indices exhibited superior diagnostic accuracy in detecting sarcopenia compared to the TyG index. Notably, we found optimal diagnostic validity of TyG-WWI for sarcopenia. This indicates that the TyG-related obesity indices, specifically the TyG-WWI index, have potential as reliable indicators for assessing and predicting sarcopenia.
Data availability statement
The original contributions presented in the study are included in the article/Supplementary Material. Further inquiries can be directed to the corresponding author/s.
Author contributions
WX: Writing – original draft, Writing – review & editing, Formal Analysis, Methodology, Software. TX: Writing – review & editing, Conceptualization, Data curation, Investigation. YL: Visualization, Writing – original draft. YX: Writing – review & editing, Supervision. ZF: Writing – review & editing, Data curation, Validation, Visualization. CL: Writing – review & editing, Data curation, Visualization. XZ: Writing – review & editing, Conceptualization, Funding acquisition, Investigation, Resources, Supervision.
Funding
The author(s) declare that financial support was received for the research, authorship, and/or publication of this article. This research was supported by the Natural Science Foundation of Jiangsu Province (BK20231147).
Conflict of interest
The authors declare that the research was conducted in the absence of any commercial or financial relationships that could be construed as a potential conflict of interest.
Generative AI statement
The author(s) declare that no Generative AI was used in the creation of this manuscript.
Publisher’s note
All claims expressed in this article are solely those of the authors and do not necessarily represent those of their affiliated organizations, or those of the publisher, the editors and the reviewers. Any product that may be evaluated in this article, or claim that may be made by its manufacturer, is not guaranteed or endorsed by the publisher.
Supplementary material
The Supplementary Material for this article can be found online at: https://www.frontiersin.org/articles/10.3389/fendo.2025.1511232/full#supplementary-material
Abbreviations
IR, insulin resistance; TyG, triglyceride glucose; TyG-WHtR, TyG-waist-to-height ratio; NHANES, National Health and Nutrition Examination Survey; TyG-BMI, TyG-body mass index; ASM, appendicular skeletal muscle mass; DXA, dual-energy X-ray absorptiometry; TyG-WWI, TyG-weight-adjusted waist index; TyG-WC, TyG-waist circumference; ROC, receiver operating characteristic; PIR, poverty income ratio; AUC, the area under the curve; BH, Benjamini-Hochberg; FDR, false discovery rate; IMAT, intermuscular adipose tissue; IMCL, intracellular myocyte lipid droplets; PKC, protein kinase C.
References
1. Cruz-Jentoft AJ and Sayer AA. Sarcopenia. Lancet (London England). (2019) 393:2636–46. doi: 10.1016/s0140-6736(19)31138-9
2. Hou Y, Xiang J, Wang B, Duan S, Song R, Zhou W, et al. Pathogenesis and comprehensive treatment strategies of sarcopenia in elderly patients with type 2 diabetes mellitus. Front Endocrinol. (2023) 14:1263650. doi: 10.3389/fendo.2023.1263650
3. Nair KS. Age-related changes in muscle. Mayo Clinic Proc. (2000) 75 Suppl:S14–8. doi: 10.1016/S0025-6196(19)30636-6
4. Matthews CE, Chen KY, Freedson PS, Buchowski MS, Beech BM, Pate RR, et al. Amount of time spent in sedentary behaviors in the United States, 2003-2004. Am J Epidemiol. (2008) 167:875–81. doi: 10.1093/aje/kwm390
5. Ogden CL, Fryar CD, Hales CM, Carroll MD, Aoki Y, and Freedman DS. Differences in obesity prevalence by demographics and urbanization in us children and adolescents, 2013-2016. Jama. (2018) 319:2410–8. doi: 10.1001/jama.2018.5158
6. Kalinkovich A and Livshits G. Sarcopenic obesity or obese sarcopenia: A cross talk between age-associated adipose tissue and skeletal muscle inflammation as a main mechanism of the pathogenesis. Ageing Res Rev. (2017) 35:200–21. doi: 10.1016/j.arr.2016.09.008
7. Waters DL and Baumgartner RN. Sarcopenia and obesity. Clinics geriatric Med. (2011) 27:401–21. doi: 10.1016/j.cger.2011.03.007
8. Cleasby ME, Jamieson PM, and Atherton PJ. Insulin resistance and sarcopenia: mechanistic links between common co-morbidities. J Endocrinol. (2016) 229:R67–81. doi: 10.1530/joe-15-0533
9. Tahapary DL, Pratisthita LB, Fitri NA, Marcella C, Wafa S, Kurniawan F, et al. Challenges in the diagnosis of insulin resistance: focusing on the role of homa-ir and tryglyceride/glucose index. Diabetes Metab syndrome. (2022) 16:102581. doi: 10.1016/j.dsx.2022.102581
10. Ramdas Nayak VK, Satheesh P, Shenoy MT, and Kalra S. Triglyceride glucose (Tyg) index: A surrogate biomarker of insulin resistance. JPMA J Pakistan Med Assoc. (2022) 72:986–8. doi: 10.47391/jpma.22-63
11. Lee J, Kim B, Kim W, Ahn C, Choi HY, Kim JG, et al. Lipid indices as simple and clinically useful surrogate markers for insulin resistance in the U.S. Population. Sci Rep. (2021) 11:2366. doi: 10.1038/s41598-021-82053-2
12. Er LK, Wu S, Chou HH, Hsu LA, Teng MS, Sun YC, et al. Triglyceride glucose-body mass index is a simple and clinically useful surrogate marker for insulin resistance in nondiabetic individuals. PloS One. (2016) 11:e0149731. doi: 10.1371/journal.pone.0149731
13. Li X, Sun M, Yang Y, Yao N, Yan S, Wang L, et al. Predictive effect of triglyceride glucose-related parameters, obesity indices, and lipid ratios for diabetes in a chinese population: A prospective cohort study. Front Endocrinol. (2022) 13:862919. doi: 10.3389/fendo.2022.862919
14. Yang L, Fang S, Zhang R, and Xia R. Associations between different triglyceride glucose index-related obesity indices and periodontitis: results from nhanes 2009-2014. Lipids Health Dis. (2024) 23:213. doi: 10.1186/s12944-024-02192-z
15. Dang K, Wang X, Hu J, Zhang Y, Cheng L, Qi X, et al. The association between triglyceride-glucose index and its combination with obesity indicators and cardiovascular disease: nhanes 2003-2018. Cardiovasc Diabetol. (2024) 23:8. doi: 10.1186/s12933-023-02115-9
16. Kim JA, Hwang SY, Yu JH, Roh E, Hong SH, Lee YB, et al. Association of the triglyceride and glucose index with low muscle mass: knhanes 2008-2011. Sci Rep. (2021) 11:450. doi: 10.1038/s41598-020-80305-1
17. Yang J, Liu C, Zhao S, Wang L, Wu G, Zhao Z, et al. The association between the triglyceride-glucose index and sarcopenia: data from the nhanes 2011-2018. Lipids Health Dis. (2024) 23:219. doi: 10.1186/s12944-024-02201-1
18. Zhao Y, Gu Y, and Zhang B. Associations of triglyceride-glucose (Tyg) index with chest pain incidence and mortality among the U.S. Population. Cardiovasc Diabetol. (2024) 23:111. doi: 10.1186/s12933-024-02209-y
19. Studenski SA, Peters KW, Alley DE, Cawthon PM, McLean RR, Harris TB, et al. The fnih sarcopenia project: rationale, study description, conference recommendations, and final estimates. journals gerontology Ser A Biol Sci Med Sci. (2014) 69:547–58. doi: 10.1093/gerona/glu010
20. DeLong ER, DeLong DM, and Clarke-Pearson DL. Comparing the areas under two or more correlated receiver operating characteristic curves: A nonparametric approach. Biometrics. (1988) 44:837–45. doi: 10.2307/2531595
21. Pan R, Wang T, Tang R, and Qian Z. Association of atherogenic index of plasma and triglyceride glucose-body mass index and sarcopenia in adults from 20 to 59: A cross-sectional study. Front Endocrinol. (2024) 15:1437379. doi: 10.3389/fendo.2024.1437379
22. Li JB, Wu Y, Gu D, Li H, and Zhang X. Prevalence and temporal trends of presarcopenia metrics and related body composition measurements from the 1999 to 2006 nhanes. BMJ Open. (2020) 10:e034495. doi: 10.1136/bmjopen-2019-034495
23. Yang L, Cao C, Kantor ED, Nguyen LH, Zheng X, Park Y, et al. Trends in sedentary behavior among the us population, 2001-2016. Jama. (2019) 321:1587–97. doi: 10.1001/jama.2019.3636
24. Bowden Davies KA, Pickles S, Sprung VS, Kemp GJ, Alam U, Moore DR, et al. Reduced physical activity in young and older adults: metabolic and musculoskeletal implications. Ther Adv Endocrinol Metab. (2019) 10:2042018819888824. doi: 10.1177/2042018819888824
25. Silva TLD and Mulder AP. Sarcopenia and poor muscle quality associated with severe obesity in young adults and middle-aged adults. Clin Nutr ESPEN. (2021) 45:299–305. doi: 10.1016/j.clnesp.2021.07.031
26. Pang BWJ, Wee SL, Lau LK, Jabbar KA, Seah WT, Ng DHM, et al. Prevalence and associated factors of sarcopenia in Singaporean adults-the yishun study. J Am Med Directors Assoc. (2021) 22:885. doi: 10.1016/j.jamda.2020.05.029
27. Sayer AA, Syddall H, Martin H, Patel H, Baylis D, and Cooper C. The developmental origins of sarcopenia. J nutrition Health Aging. (2008) 12:427–32. doi: 10.1007/bf02982703
28. Colleluori G, Aguirre L, Phadnis U, Fowler K, Armamento-Villareal R, Sun Z, et al. Aerobic plus resistance exercise in obese older adults improves muscle protein synthesis and preserves myocellular quality despite weight loss. Cell Metab. (2019) 30:261–73.e6. doi: 10.1016/j.cmet.2019.06.008
29. Vikberg S, Sörlén N, Brandén L, Johansson J, Nordström A, Hult A, et al. Effects of resistance training on functional strength and muscle mass in 70-year-old individuals with pre-sarcopenia: A randomized controlled trial. J Am Med Directors Assoc. (2019) 20:28–34. doi: 10.1016/j.jamda.2018.09.011
30. Ogden CL, Carroll MD, Lawman HG, Fryar CD, Kruszon-Moran D, Kit BK, et al. Trends in Obesity Prevalence among Children and Adolescents in the United States, 1988-1994 through 2013-2014. Jama. (2016) 315:2292–9. doi: 10.1001/jama.2016.6361
31. Geiss LS, Wang J, Cheng YJ, Thompson TJ, Barker L, Li Y, et al. Prevalence and incidence trends for diagnosed diabetes among adults aged 20 to 79 years, United States, 1980-2012. Jama. (2014) 312:1218–26. doi: 10.1001/jama.2014.11494
32. Ahn SH, Lee JH, and Lee JW. Inverse association between triglyceride glucose index and muscle mass in korean adults: 2008-2011 knhanes. Lipids Health Dis. (2020) 19:243. doi: 10.1186/s12944-020-01414-4
33. Shafiee G, Keshtkar A, Soltani A, Ahadi Z, Larijani B, and Heshmat R. Prevalence of sarcopenia in the world: A systematic review and meta- analysis of general population studies. J Diabetes Metab Disord. (2017) 16:21. doi: 10.1186/s40200-017-0302-x
34. Yang L, Smith L, and Hamer M. Gender-specific risk factors for incident sarcopenia: 8-year follow-up of the english longitudinal study of ageing. J Epidemiol Community Health. (2019) 73:86–8. doi: 10.1136/jech-2018-211258
35. Plotkin LI, Bruzzaniti A, and Pianeta R. Sexual dimorphism in the musculoskeletal system: sex hormones and beyond. J Endocrine Soc. (2024) 8:bvae153. doi: 10.1210/jendso/bvae153
36. Kim DY and Ko SH. Common regulators of lipid metabolism and bone marrow adiposity in postmenopausal women. Pharmaceuticals (Basel Switzerland). (2023) 16:322. doi: 10.3390/ph16020322
37. Lu L and Tian L. Postmenopausal osteoporosis coexisting with sarcopenia: the role and mechanisms of estrogen. J Endocrinol. (2023) 259:e230116. doi: 10.1530/joe-23-0116
38. Buckinx F and Aubertin-Leheudre M. Sarcopenia in menopausal women: current perspectives. Int J women’s Health. (2022) 14:805–19. doi: 10.2147/ijwh.S340537
39. Chen Y, Liu C, and Hu M. Association between triglyceride-glucose index and sarcopenia in China: A nationally representative cohort study. Exp gerontology. (2024) 190:112419. doi: 10.1016/j.exger.2024.112419
40. Hong SH and Choi KM. Sarcopenic obesity, insulin resistance, and their implications in cardiovascular and metabolic consequences. Int J Mol Sci. (2020) 21:494. doi: 10.3390/ijms21020494
41. Luo C, Liu RY, Zhang GW, Hu F, Jin YH, and Liu BY. Possible sarcopenia and risk of new-onset type 2 diabetes mellitus in older adults in China: A 7-year longitudinal cohort study. BMC geriatrics. (2023) 23:404. doi: 10.1186/s12877-023-04104-9
42. Li CW, Yu K, Shyh-Chang N, Jiang Z, Liu T, Ma S, et al. Pathogenesis of sarcopenia and the relationship with fat mass: descriptive review. J cachexia sarcopenia Muscle. (2022) 13:781–94. doi: 10.1002/jcsm.12901
43. Liu ZJ and Zhu CF. Causal relationship between insulin resistance and sarcopenia. Diabetol Metab syndrome. (2023) 15:46. doi: 10.1186/s13098-023-01022-z
44. Srikanthan P, Hevener AL, and Karlamangla AS. Sarcopenia exacerbates obesity-associated insulin resistance and dysglycemia: findings from the national health and nutrition examination survey III. PloS One. (2010) 5:e10805. doi: 10.1371/journal.pone.0010805
45. Zamboni M, Mazzali G, Fantin F, Rossi A, and Di Francesco V. Sarcopenic obesity: A new category of obesity in the elderly. Nutrition metabolism Cardiovasc diseases: NMCD. (2008) 18:388–95. doi: 10.1016/j.numecd.2007.10.002
46. Gregor MF and Hotamisligil GS. Inflammatory mechanisms in obesity. Annu Rev Immunol. (2011) 29:415–45. doi: 10.1146/annurev-immunol-031210-101322
47. Ahmed B, Sultana R, and Greene MW. Adipose tissue and insulin resistance in obese. Biomedicine pharmacotherapy = Biomedecine pharmacotherapie. (2021) 137:111315. doi: 10.1016/j.biopha.2021.111315
48. Aon MA, Bhatt N, and Cortassa SC. Mitochondrial and cellular mechanisms for managing lipid excess. Front Physiol. (2014) 5:282. doi: 10.3389/fphys.2014.00282
49. DeFuria J, Belkina AC, Jagannathan-Bogdan M, Snyder-Cappione J, Carr JD, Nersesova YR, et al. B cells promote inflammation in obesity and type 2 diabetes through regulation of T-cell function and an inflammatory cytokine profile. Proc Natl Acad Sci United States America. (2013) 110:5133–8. doi: 10.1073/pnas.1215840110
Keywords: NHANES, cross-sectional study, sarcopenia, TyG index, TyG-related obesity index
Citation: Xiao W, Xu T, Liao Y, Xu Y, Fan Z, Li C and Zhang X (2025) Associations between different triglyceride glucose index-related obesity indices and sarcopenia: a cross-sectional study. Front. Endocrinol. 16:1511232. doi: 10.3389/fendo.2025.1511232
Received: 14 October 2024; Accepted: 24 February 2025;
Published: 29 May 2025.
Edited by:
Parul Mehrotra, Indian Institute of Technology Delhi, IndiaReviewed by:
Michal Kasher Meron, Tel Aviv University, IsraelLubia Velázquez López, Instituto Mexicano del Seguro Social, Mexico
Copyright © 2025 Xiao, Xu, Liao, Xu, Fan, Li and Zhang. This is an open-access article distributed under the terms of the Creative Commons Attribution License (CC BY). The use, distribution or reproduction in other forums is permitted, provided the original author(s) and the copyright owner(s) are credited and that the original publication in this journal is cited, in accordance with accepted academic practice. No use, distribution or reproduction is permitted which does not comply with these terms.
*Correspondence: Xian Zhang, d3h6eTAwOEBuanVjbS5lZHUuY24=