 Jin-Mao He1,2
 Yi Yang1*
- 1Department of the Central Laboratory, Affiliated Hospital of Yangzhou University, Yangzhou, Jiangsu, China
- 2Department of the Cardiac Ultrasound Department, Affiliated Hospital of Nantong University, Nantong, Jiangsu, China
Objective: The neutrophil-lymphocyte ratio (NLR) is a hematological marker to assess systemic inflammation and immune status. The relationship between NLR and the risk of mortality in individuals with diabetes mellitus or pre-diabetes mellitus who have comorbid symptoms of obstructive sleep apnea is unknown. Our study aims to evaluate the association between NLR and all-cause and cardiovascular mortality in this population.
Methods: Our research enrolled 5432 patients from the National Health and Nutrition Examination Surveys (2005-2008 and 2015-2018) diagnosed with diabetes or prediabetes combined with symptoms of OSA. Mortality outcomes were ascertained by linkage to the National Death Index (NDI) records for December 31, 2019. The association between NLR and mortality was tested using multivariate Cox regression models. The non-linear relationship was analyzed based on restricted cubic spline curves (RCS). Kaplan-Meier (K-M) survival analysis and time-dependent subject operating characteristic curve (ROC) analysis were performed to assess the predictive value of NLR on patient survival.
Results: In a median follow-up period of 52 months, study participants experienced 632 deaths from all causes and 143 deaths due to cardiovascular disease. According to Cox regression analysis, the fourth quartile was associated with higher all-cause mortality (HR=1.76, 95% CI 1.25-2.49) and cardiovascular mortality (HR=3.08, 95% CI 1.54-6.18) compared with the first quartile under the fully adjusted model. Meanwhile, K-M survival curves showed that all-cause and cardiovascular mortality increased with increasing NLR levels, with the highest mortality in the fourth quartile group. In addition, the areas under the curve (AUC) of the 3, 5and 10year survival were 0.67, 0.63, and 0.74 for all-cause mortality, respectively. Meanwhile, the AUC values for cardiovascular mortality were 0.73, 0.56, and 0.69.
Conclusion: For individuals with diabetes and OSA symptoms, elevated NLR can serve as a prognostic indicator for all-cause and cardiovascular mortality.
1 Introduction
Obstructive sleep apnea(OSA)is a treatable chronic sleep disorder marked by partial or complete collapse of the upper airway for at least 10s during sleep, resulting in reduced airflow (hypoventilation) or complete cessation (apnea). Sleepiness during the daytime is a common symptom of OSA (1, 2). Between 1990 and 2010, the prevalence of OSA increased by about 30%. The absolute rate of increase for men was 7.5%, while the rate for women was 4.2% (3). In case of untreated OSA, serious health issues can occur, including high blood pressure (4), cardiovascular disease (5), and diabetes (6).
As with OSA, diabetes is becoming more prevalent every year. Diabetes affects about 10.5% of adults worldwide and causes about 6.7 million deaths each year, of which type 2 diabetes mellitus (T2DM) accounts for 90% of all cases (7). In addition to those who already have diabetes, a subset of the population suffers from prediabetes, a precursor that has a greater risk of developing T2DM and cardiovascular disease (CVD). In fact, in the Diabetes Prevention Program study, after four years, 36% of pre-diabetic participants randomly assigned to the placebo group acquired T2DM (8). There are several chronic complications of diabetes, including CVD, peripheral vascular disease, cerebrovascular disease, diabetic kidney disease, and diabetic retinopathy (9–11). Additionally, the results of recent studies confirm that patients with diabetes have a greater risk of death from cardiovascular and all-cause causes compared to patients without diabetes (12). As a result, early detection of patients and relevant intervention treatment are crucial.
It is increasingly recognized that OSA is ubiquitous in patients with T2DM. Cross-sectional studies of clinical and population samples have shown that up to 50% of people with OSA have T2DM, and about 50% of people with T2DM have moderate to severe OSA (13, 14). Intermittent hypoxemia and recurrent awakenings in OSA trigger a series of pathophysiologic events, which involve the activation of the sympathetic nervous system, oxidative stress, altered pro-adrenocorticotropic hormone function, and release of inflammatory adipocytokines. These pathophysiologic changes can alter normal glucose metabolism and may increase the risk of T2DM (15). Conversely, there is also evidence that T2DM may alter the progression of OSA and promote the expression of central sleep apnea (15). Although the mechanism of the bi-directional association of these two diseases needs further study, the frequent coexistence of these two diseases prompts us to seek suitable indicators to reflect the prognosis of this population.
Using routine blood count results, neutrophil-lymphocyte ratio (NLR) can be used as a marker of inflammation. A wide range of attention has been given to it for its possible predictive role in a variety of diseases, such as cancer, inflammation, metabolic syndrome, and affective and neurodegenerative diseases (16–20). According to recent studies, higher NLR is linked to higher blood glucose (21) and HbA1c levels (22) in diabetic patients and increases the risk of death in such patients (23). Although NLR has been linked to mortality in diabetes or OSA cohorts separately, its role in patients with both conditions remains unclear. The coexistence of diabetes and OSA creates a pro-inflammatory milieu through synergistic pathways (e.g., hypoxia-induced oxidative stress and hyperglycemia-driven endothelial dysfunction), which may amplify NLR’s prognostic significance. However, no prior study has systematically evaluated NLR in this high-risk population, leaving a critical gap in risk stratification strategies.
2 Methods
2.1 Study population
The National Health and Nutrition Examination Survey (NHANES) is a nationally representative, cross-sectional health study using stratified, multi-stage probabilistic sampling of non-institutionalized residents to obtain basic information and a population’s overall health. The National Center for Health Statistics (NCHS) is responsible for implementation. NCHS Ethics Review Board approved the agreement, and those subjects signed informed consent forms.
To maximize sample size, we extracted data from the NHANES survey cycles of 2005–2008 and 2015–2018 into this analysis. By the diabetes diagnostic criteria of the ADA (24), diabetes is characterized by self-reported diagnosis, use of insulin or oral hypoglycemic medication, fasting blood glucose(FBG)≥ 126 mg/dL or HbA1c level ≥ 6.5%. Prediabetes refers to self-reported prediabetes status, having FBG between 100 mg/dL and 125 mg/dL, or HbA1c between 5.7% and 6.4% (25).OSA is diagnosed when a person answers “yes” to at least one of the following three NHANES questions (26) (1): being excessively sleepy in the day even though they get at least seven h of sleep per night, as reported 16–30 times (2); experiencing episodes of gasping, snorting, or stopping their breath on three or more occasions per week (3); snoring on three or more occasions every week. A total of 39,722 participants were initially recruited during this period. Excluding patients without complete survival and laboratory testing information, we recruited patients >20 years of age with diabetes or prediabetes combined with obstructive sleep apnea symptoms. In the end, 5432 individuals were included in the research (Figure 1).
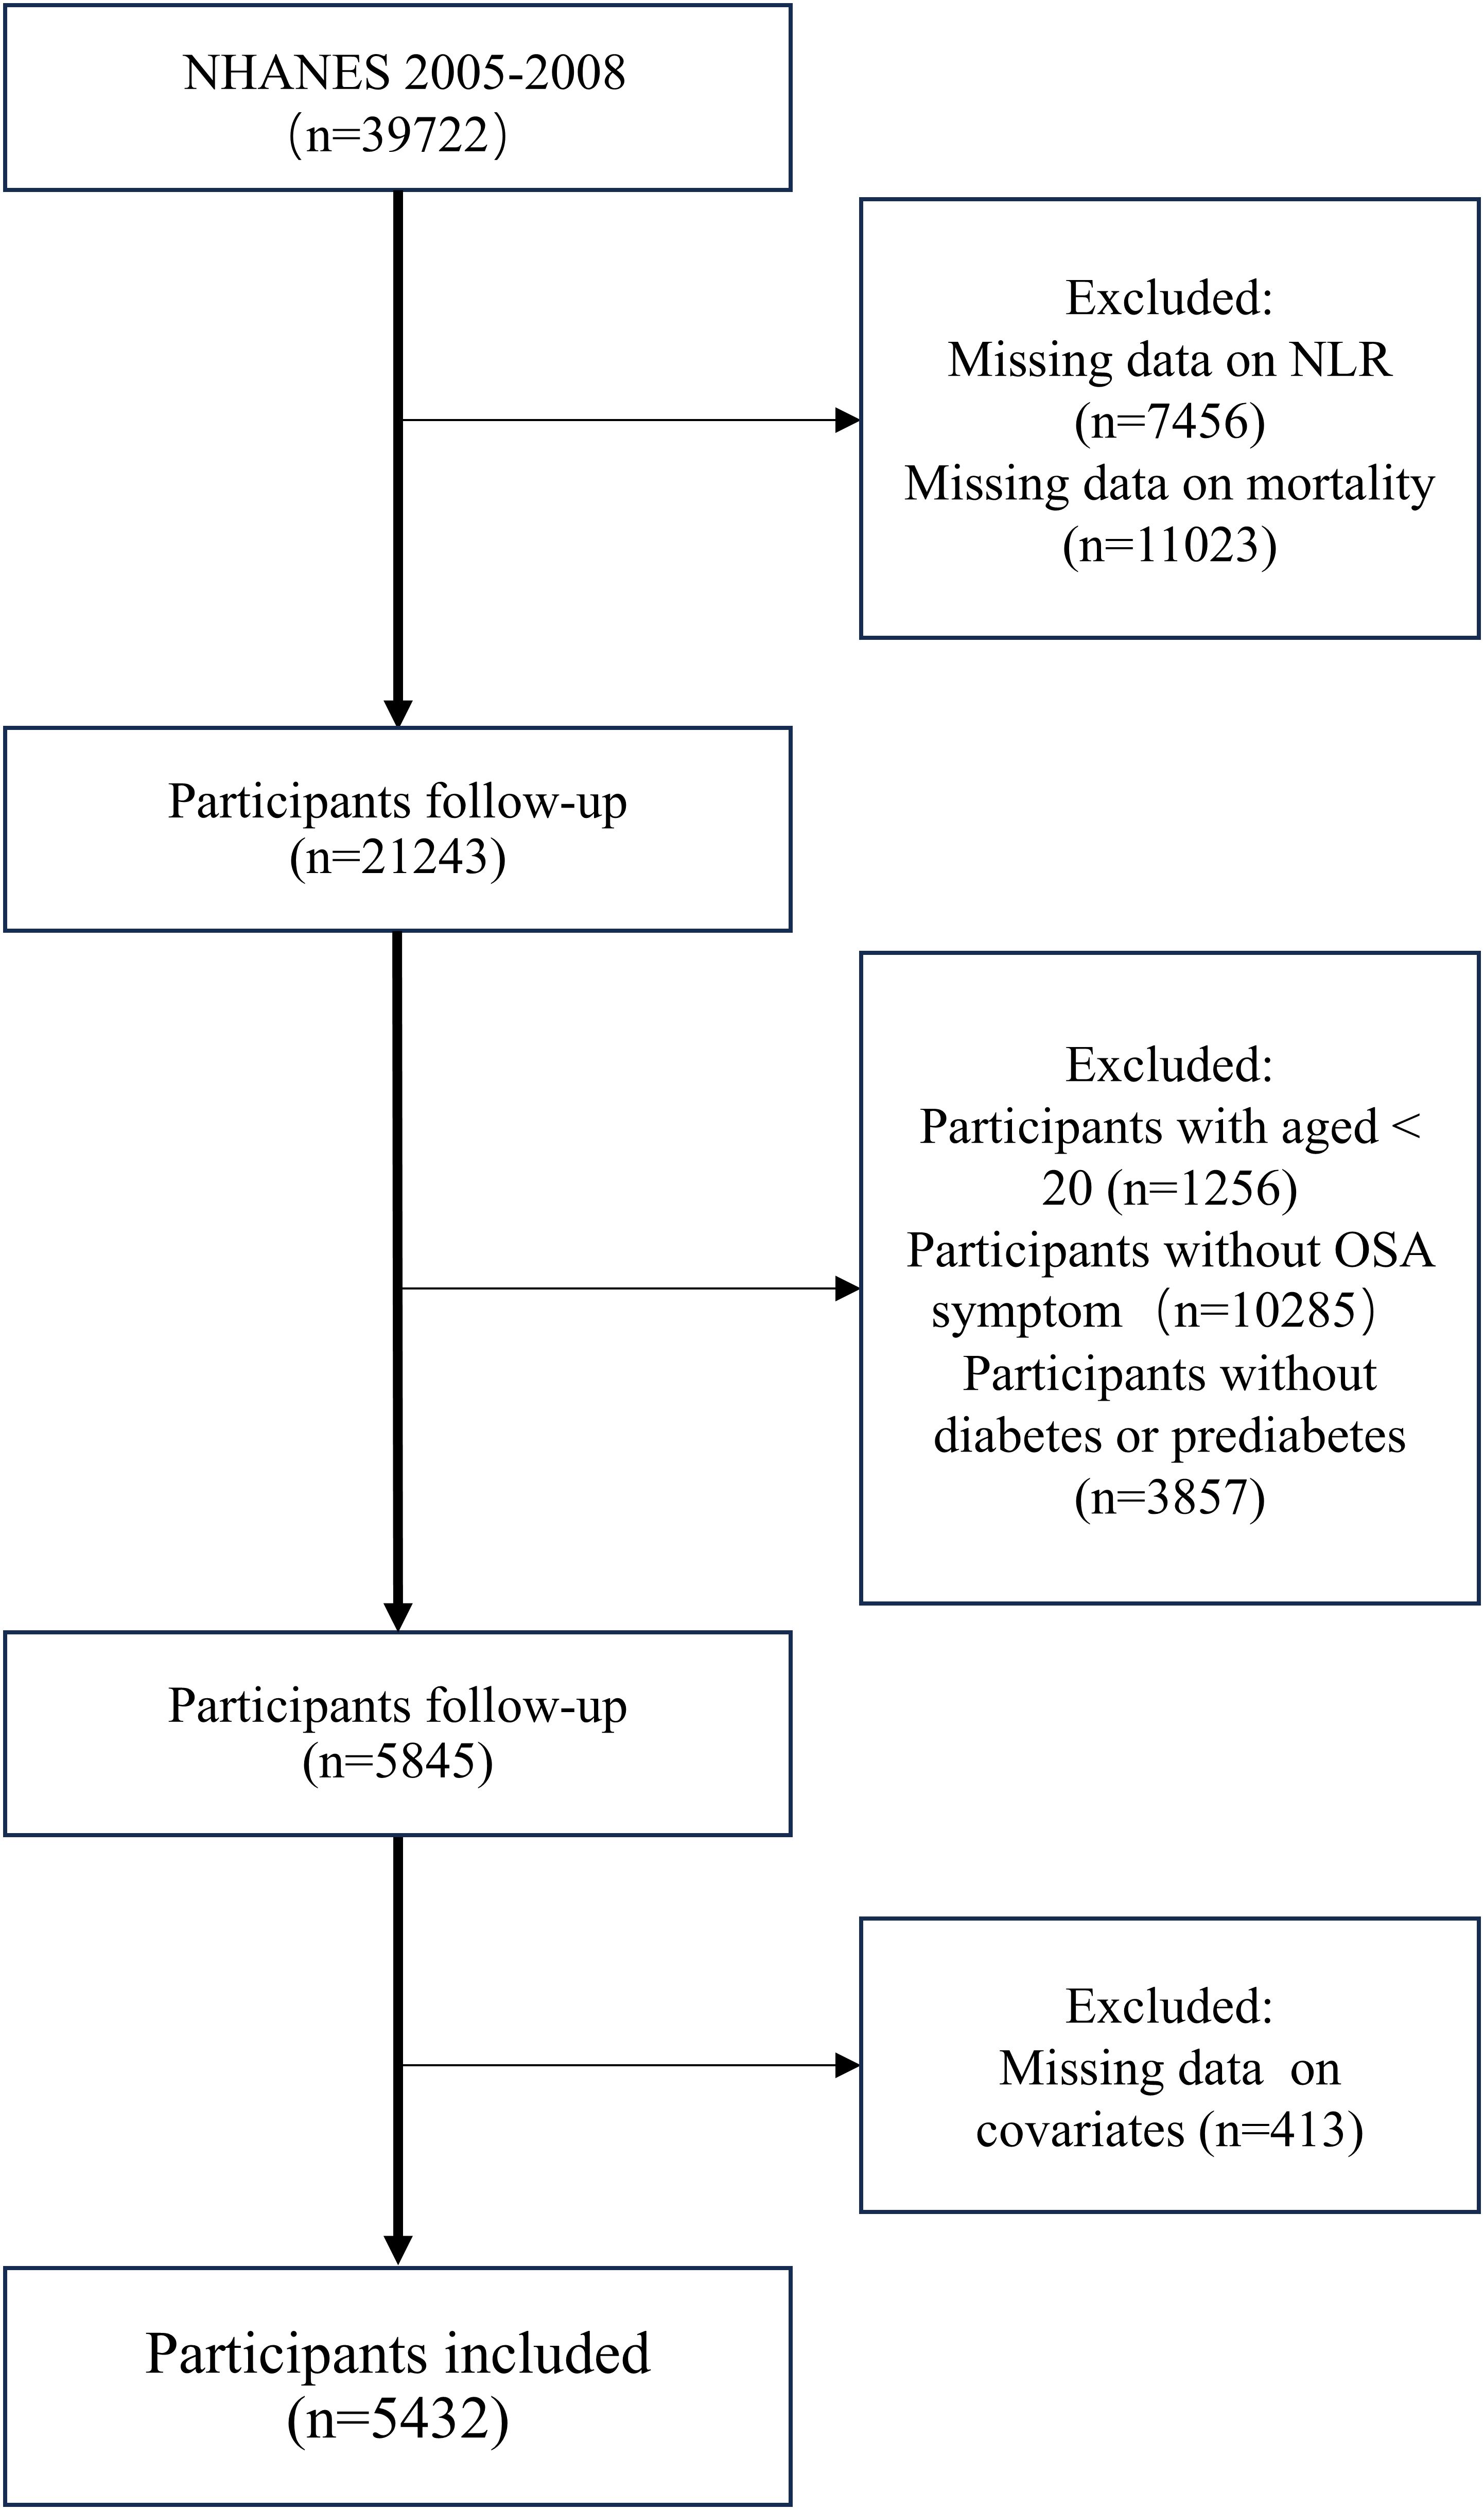
Figure 1. Flowchart for participant selection from NHANES 2005-2008 and 2015-2018.
2.2 Calculation of NLR
Lymphocyte and neutrophil counts were obtained using automated hematology analysis equipment and expressed in ×103 cells/mm3 units. NLR is the ratio of the absolute neutrophil count to the absolute lymphocyte count.
2.3 All-cause and cardiovascular mortality
Mortality information was obtained from the National Death Index (NDI) database [https://www.cdc.gov/nchs/data-linkage/mortality-public.htm], maintained by the Centers for Disease Control and Prevention (CDC) in the United States. The follow-up period was calculated from the baseline interview date to the date of death or December 31, 2019. Moreover, we determined the number of deaths from specific diseases based on the International Statistical Classification of Diseases, 10th Edition (ICD-10). Deaths from any cause are defined as all-cause mortality. Deaths due to CVD and cerebrovascular disease (codes: I00-I09, I11, I13, I20-I51 and I60-I69) were defined as cardiovascular mortality.
2.4 Covariates
According to previous studies, several possible confounders were considered as covariates. We selected the following co-variates for inclusion:age (measured in years, categorized into groups of <60 and ≥60), gender (male or female), race/ethnicity (classified as Mexican American, other Hispanic, non-Hispanic white, non-Hispanic black or other race), marital status (unmarried or married), education level (classified into grade or less, high school, or college or more), family poverty income (assessed by the family in-come-to-poverty ratio, classified into <1.3, 1.3–1.8, and >1.8) (27), smoking level (evaluated based on the serum cotinine levels as low (<0.015 ng/ml), moderate (0.015–3 ng/ml) and high levels(>3 ng/ml)) (28), alcohol use (classified into none, moderate(>0 to ≤2 drinks/d for men or >0 to ≤1 drink/d for women), or heavy(≥3 drinks/d for men or ≥2 drinks/d for women)) (27), body mass index (BMI) (classified into underweight (<18.5kg/m²), normal (18.5-24.9 kg/m²) overweight (25.0–29.9 kg/m²)and obesity (≥30.0 kg/m²), waist, glomerular filtration rate(GFR) and self-reported chronic diseases involving emphysema, asthma, high blood pressure(HBP), heart failure (HF), coronary heart disease (CHD), heart attack, angina and stroker. Laboratory data assessed in this study, including creatinine (Cr), blood urea nitrogen (BUN), uric acid (UA), total cholesterol (TC), triglycerides (TG), HbA1c, high-density lipoprotein cholesterol (HDL), were obtained from the website of the NHANES.
2.5 Statistical analysis
To account for the complex sampling survey design, the NHANES recommended weighted analyses. Based on standardized protocols described in the NHANES survey, since data from four survey cycles were combined, we calculated WTSAF8YR (1/4 * WTMEC2YR). Four groups (Q1, Q2, Q3, and Q4) were grouped according to the quantiles of NLR. The subjects were characterized by their essential characteristics as mean ± standard deviation (SD) for continuous variables and percentage for categorical variables. Statistical analyses were performed using weighted one-way analysis of variance (ANOVA) for continuous variables and a chi-square test for categorical variables to compare baseline characteristics at different NLR levels. We used multivariate Cox proportional risk models to evaluate the NLR and mortality risk association. For the accuracy of the results, three models were developed to control for possible confounding factors. Model 1 was unadjusted. Model 2 was adjusted for age, gender, and race/ethnicity. Model 3 was adjusted for age, gender, race/ethnicity, education, family poverty income ratio, smoking level, alcohol use, BMI, emphysema, HBP, HF, CHD, angina, heart attack, stroke, waist, GFR, Cr, BUN, TC, TG, HDL. In addition, the restricted cubic spline (RCS) was used to assess potential nonlinear associations between NLR and mortality risk in this population. In the model, confounding factors: age, gender, race/ethnicity, education, family poverty income ratio, smoking level, alcohol use, BMI, emphysema, HBP, HF, CHD, angina, heart attack, stroke, waist, GFR, Cr, BUN, TC, TG, HDL were adjusted. In addition, Kaplan-Meier (K-M) survival analyses and multivariate ROC analyses based on the area under the ROC curve (AUC) assessed the predictive effect of NLR on mortality. Further stratified analyses were conducted to investigate any differences between subgroups by age, gender, race/ethnicity, smoking level, alcohol use, hypertension, and diabetes status (diabetes, pre-diabetes). Statistical analyses were performed using R software, EmpowerStats Software, and Stata 17.0 software. A p-value less than 0.05 was considered statistically significant.
3 Results
3.1 Participant characteristics at baseline
In total, 5432 individuals with diabetes or prediabetes combined with obstructive sleep apnea symptoms were enrolled. Our study population’s baseline characteristics, stratified based on NLR quartiles, are presented in Table 1. The mean age of the enrolled participants was 53.49 ± 14.65 years, of which 43.6% were female. In comparison with patients in the lowest quartile, those with high NLR were more likely to be older, male, non-Hispanic white, less educated, heavy smokers, moderate drinkers, and those with higher BMI. In addition, those with a high NLR had a larger waist circumference and were more at risk for cardiovascular disease. In terms of laboratory data, there were significant differences between quartiles, with individuals in higher quartiles having lower GFR, TC, and TG.
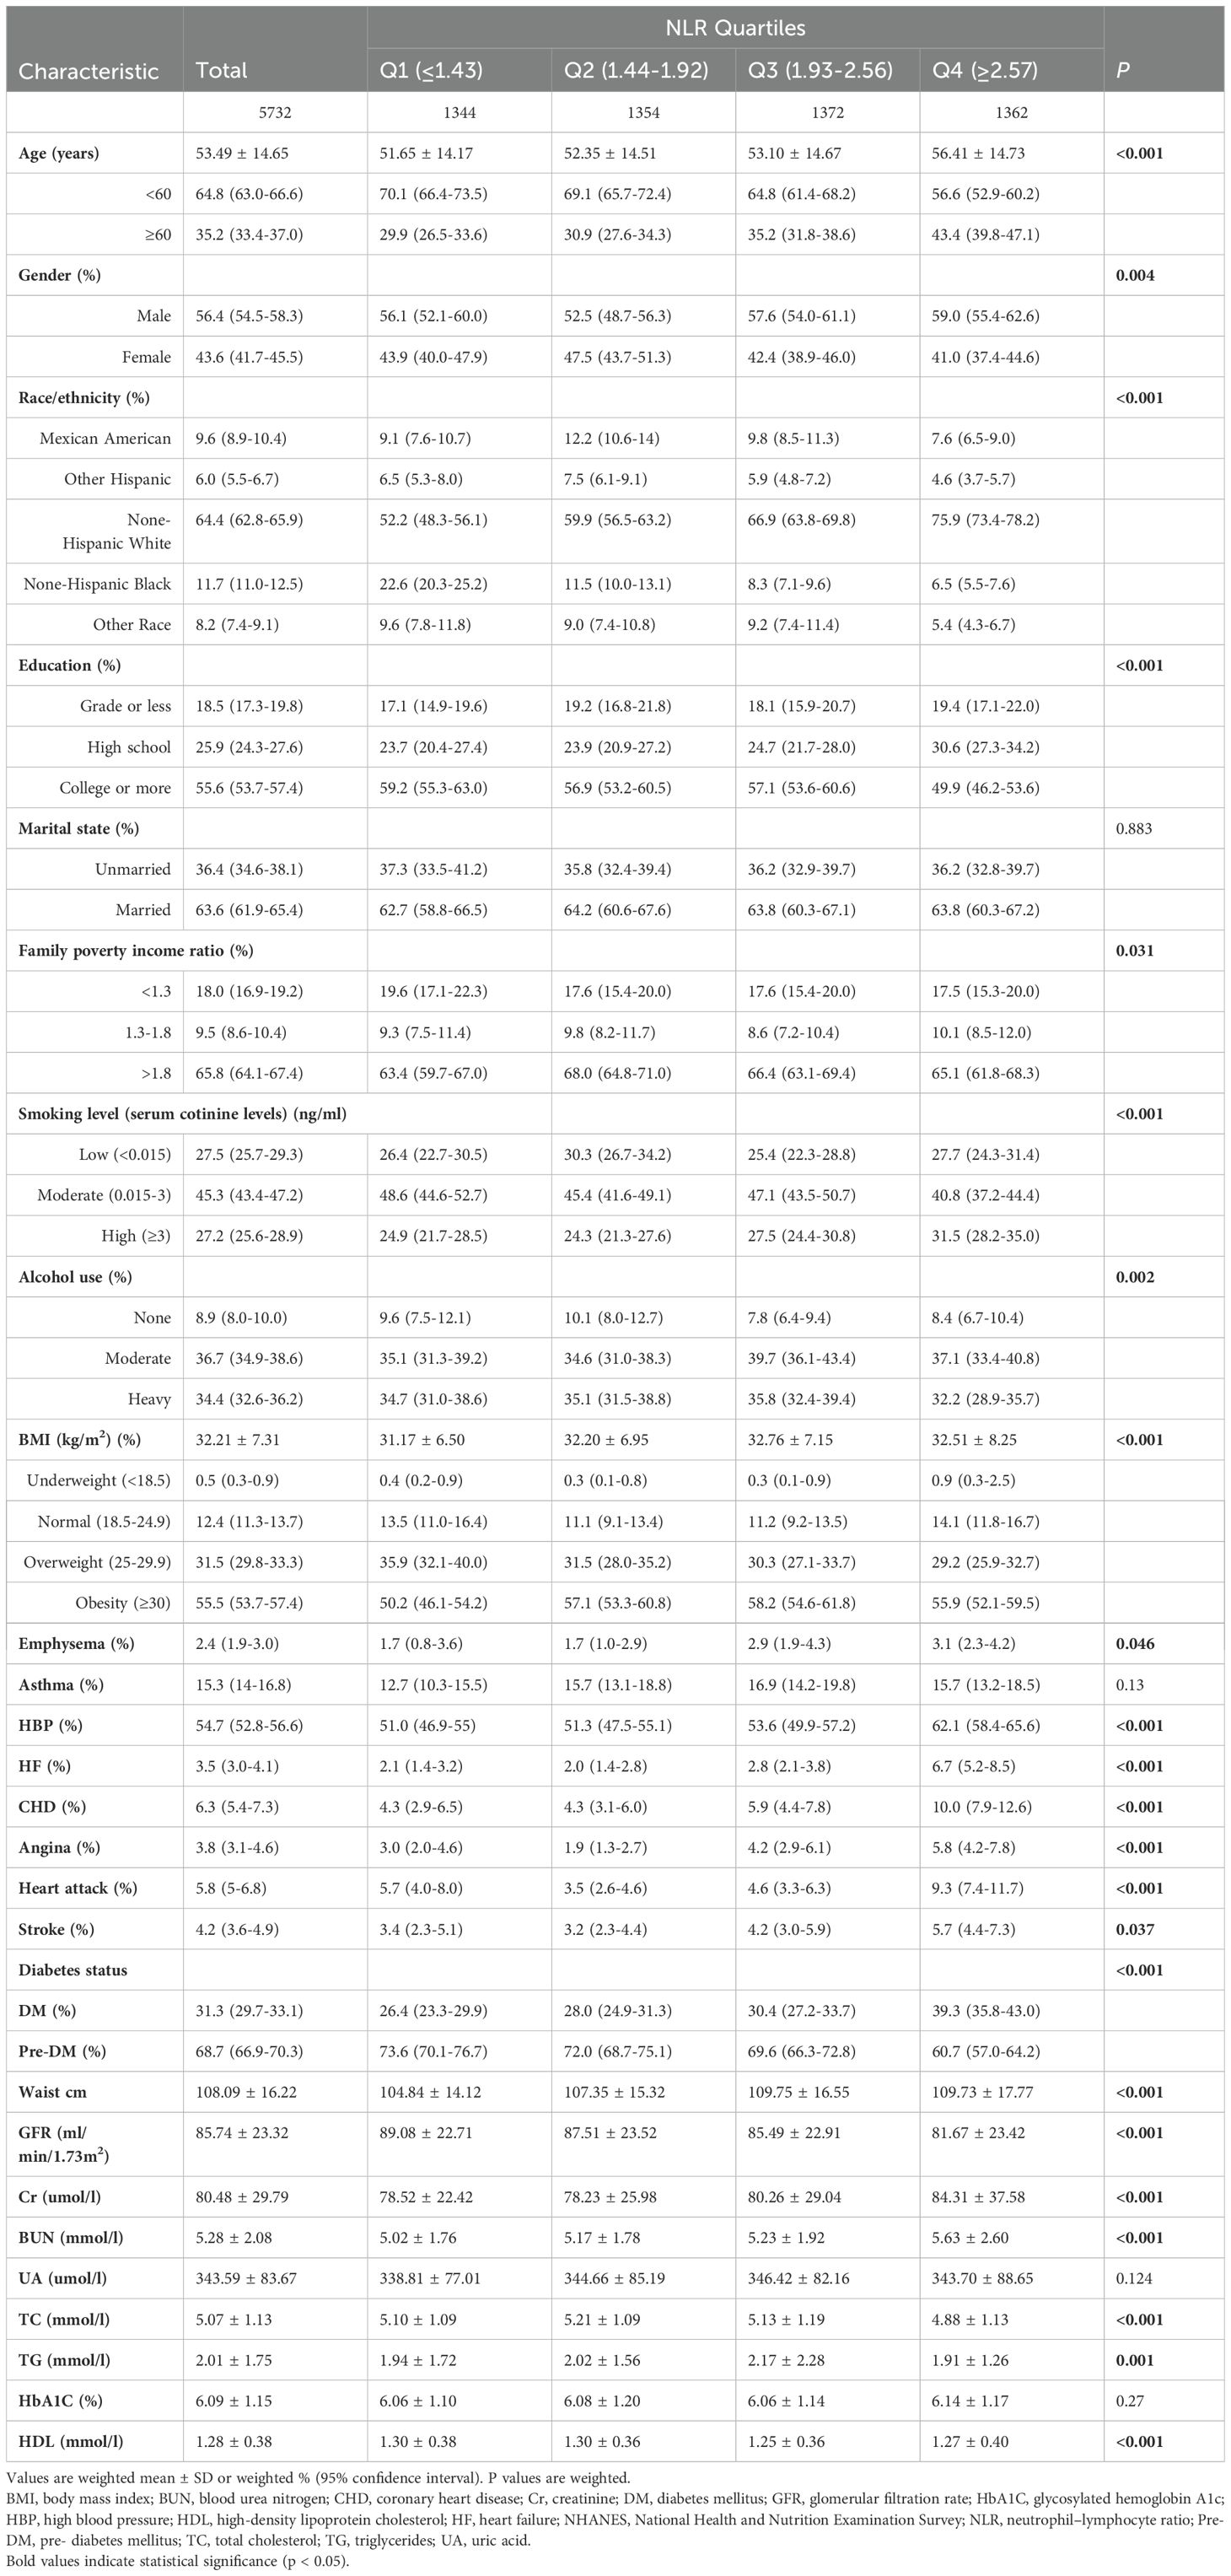
Table 1. Characteristics of included population in the NHANES 2005-2008 and 2015-2018 based on neutrophil–lymphocyte ratio quartiles (N = 5732).
3.2 Association of NLR with mortality
After a median of 52 months of follow-up, 632 deaths from all causes and 143 cardiovascular-related deaths were recorded. Three Cox regression models were established to explore the independent association between NLR and the two mortality risks outlined in Table 2. In the unadjusted model, NLR was significantly and positively associated with the risk of all-cause mortality (HR 1.26, 95% CI 1.20-1.32). Furthermore, the risk of death from all causes increased by 17% and 11% for each unit increase in NLR in the minimally and fully adjusted models, respectively. When participants were categorized into quartiles by NLR, in Models 1 and 2, the risk of all-cause mortality was higher in those in the highest NLR quartile compared with those in the lowest NLR quartile (Model 1: 2.49, 95% CI 1.80-3.44; Model 2: 2.00, 95% CI 1.43-2.79). In the fully adjusted model, the HRs (95% CI) for the risk of death from all causes were 1.15 (0.79-1.67), 1.21 (0.86-1.71), and 1.76 (1.25-2.49) for NLR Q2, Q3, and Q4, respectively.
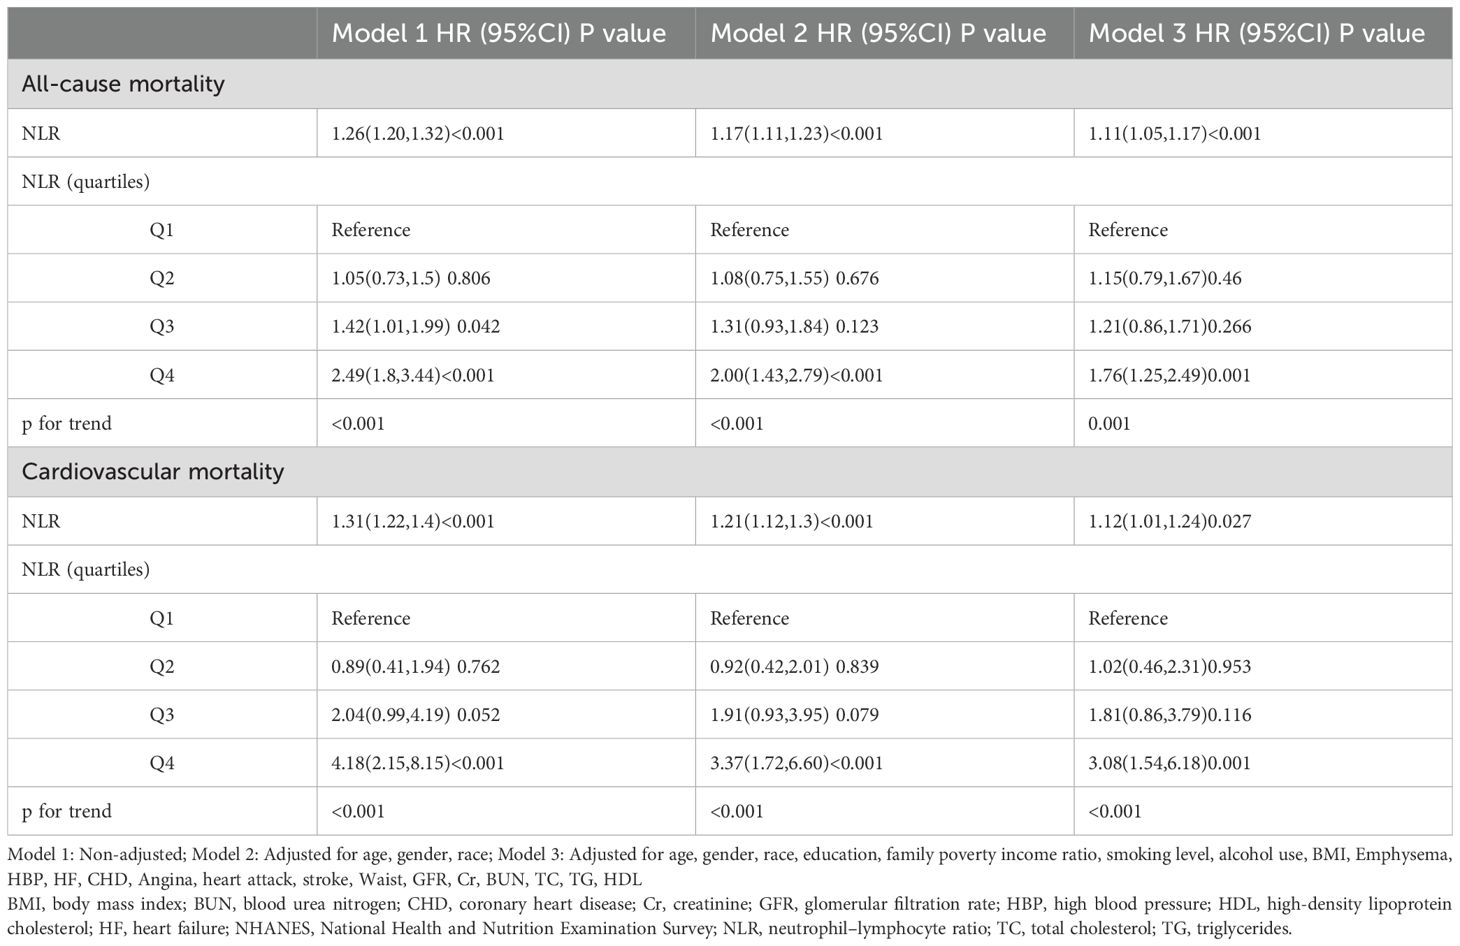
Table 2. Cox regression analysis of association between NLR and mortality in the NHANES 2005-2008 and 2015-2018 (n=5732).
Moreover, as NLR increases, the risk of cardiovascular death also increases. The unadjusted model (HR 1.31, 95% CI 1.22-1.40) and the slightly adjusted model (HR 1.21, 95% CI 1.12-1.30) were statistically significant. In addition, in the fully adjusted model, each unit increase in NLR was associated with a 12% increase in the risk of cardiovascular mortality. When NLR was analyzed as a categorical variable, the multivariate corrected HR (95% CI) for cardiovascular mortality from the lowest to the highest quartile of NLR was 1.00 (reference), 1.02 (0.46-2.31), 1.81 (0.86-3.79), and 3.08 (1.54-6.18), respectively.
3.3 RCS analysis
The Cox proportional risk regression model of the RCS was used to evaluate the nonlinear correlation between NLR and risk of mortality in patients with diabetes or prediabetes with OSA symptoms. According to the RCS analysis, there was a positive and linear correlation between NLR and the risk of death from all causes (nonlinear p=0.216) (Figure 2A). At the same time, cardiovascular mortality had a positive and nonlinear association (nonlinear p=0.011) (Figure 2B). Next, we examined diabetic and prediabetic populations separately. In diabetic patients, as shown in Figure 3A, B NLR is positively linearly related to the risk of all-cause and cardiovascular mortality (nonlinear p=0.898, p=0.667). However, in patients with prediabetes, no statistically significant correlation between NLR and all-cause and cardiovascular mortality was observed (p for overall 0.628, p for overall 0.150) (Figures 3C, D).

Figure 2. Association between NLR and all-cause (A) and cardiovascular mortality (B) in patients with diabetes or prediabetes with comorbid OSA symptoms.
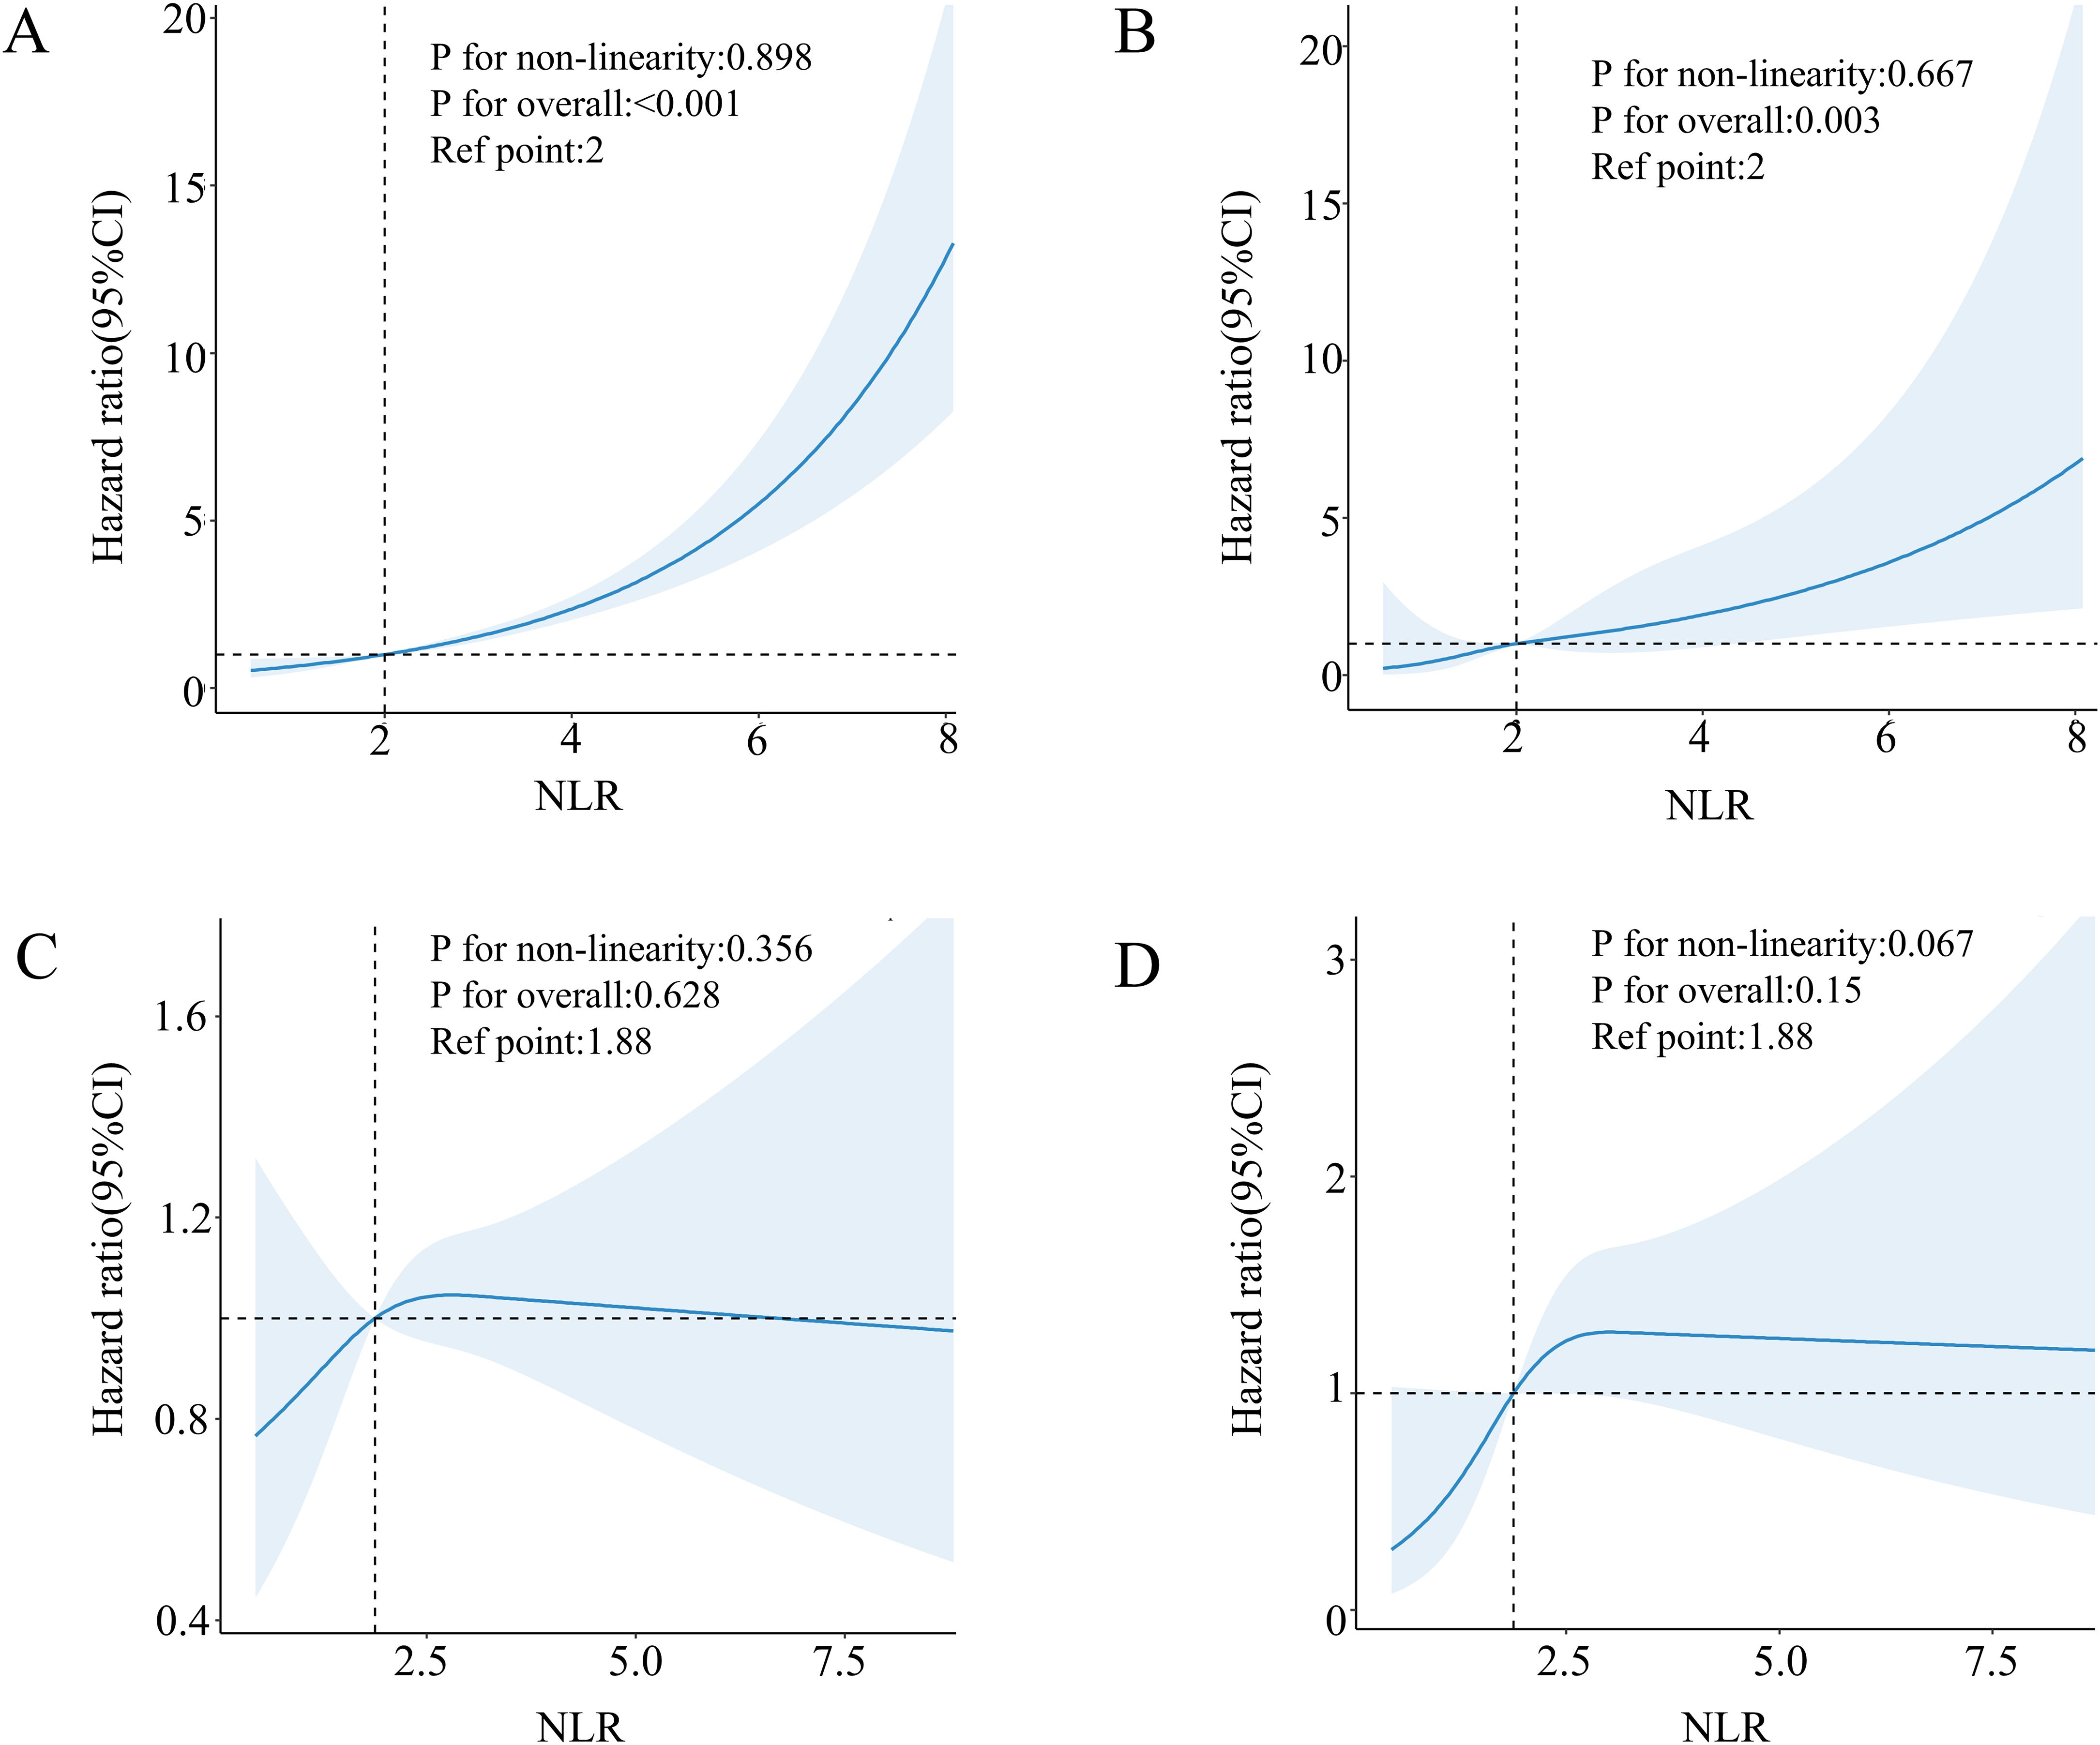
Figure 3. Association between NLR and all-cause (A) and cardiovascular mortality (B) in patients with diabetes with comorbid OSA symptoms. Association between NLR and all-cause (C) and cardiovascular mortality (D) in patients with pre-diabetes with comorbid OSA symptoms.
3.4 Kaplan-Meier method, Log-rank test, and ROC analysis
The Kaplan-Meier survival analysis demonstrated significant differences in all-cause mortality and cardiovascular mortality among the four groups during the follow-up period, with the highest rates observed in the fourth group (log-rank P < 0.001). Detailed results of the Kaplan-Meier survival analysis are presented in Figure 4. The area under the NLR curve (AUC) for all-cause mortality at 36, 60, and 120 months was 0.67, 0.63, and 0.74, respectively, as indicated by time-dependent subject work characteristic curve (ROC) analyses (Figure 5A). In addition, the NLR AUC for cardiovascular mortality at 36, 60, and 120 months was 0.73, 0.56, and 0.69, respectively (Figure 5B). This suggests that NLR has a good predictive ability for long-term risk of all-cause death and short-term risk of cardiovascular death.
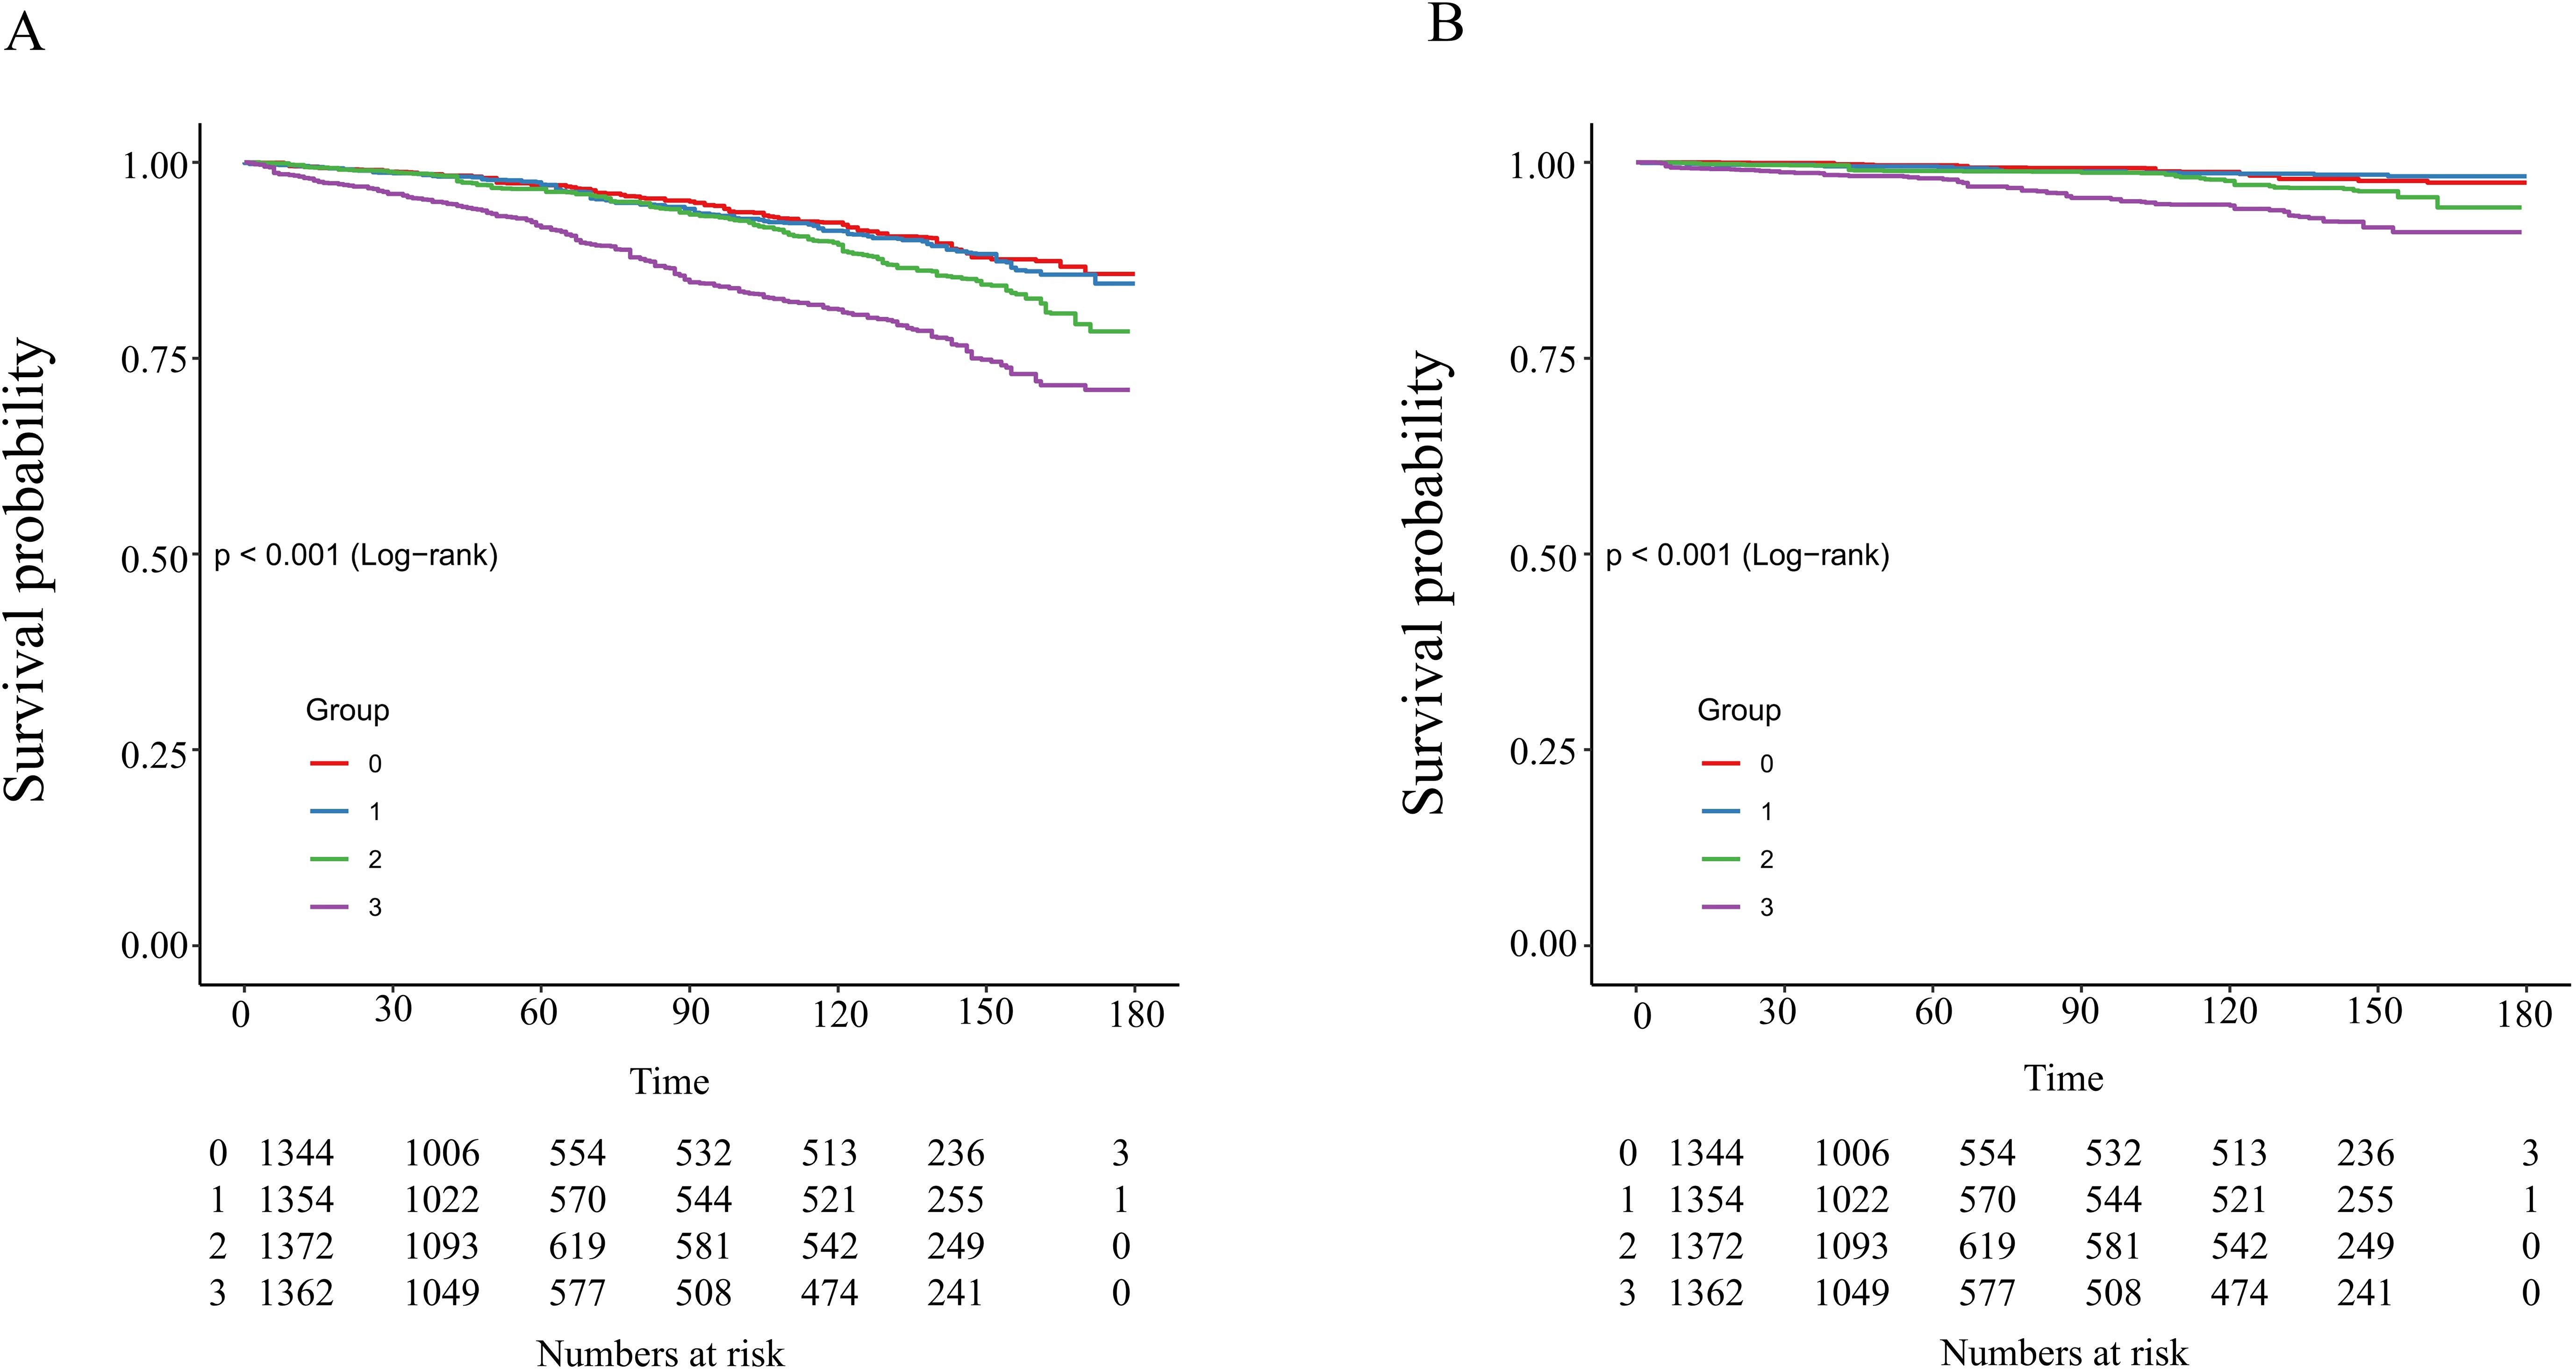
Figure 4. Kaplan–Meier analysis of all-cause (A) and cardiovascular (B) mortality based on NLR groups in patients with diabetes or prediabetes with comorbid OSA symptoms.
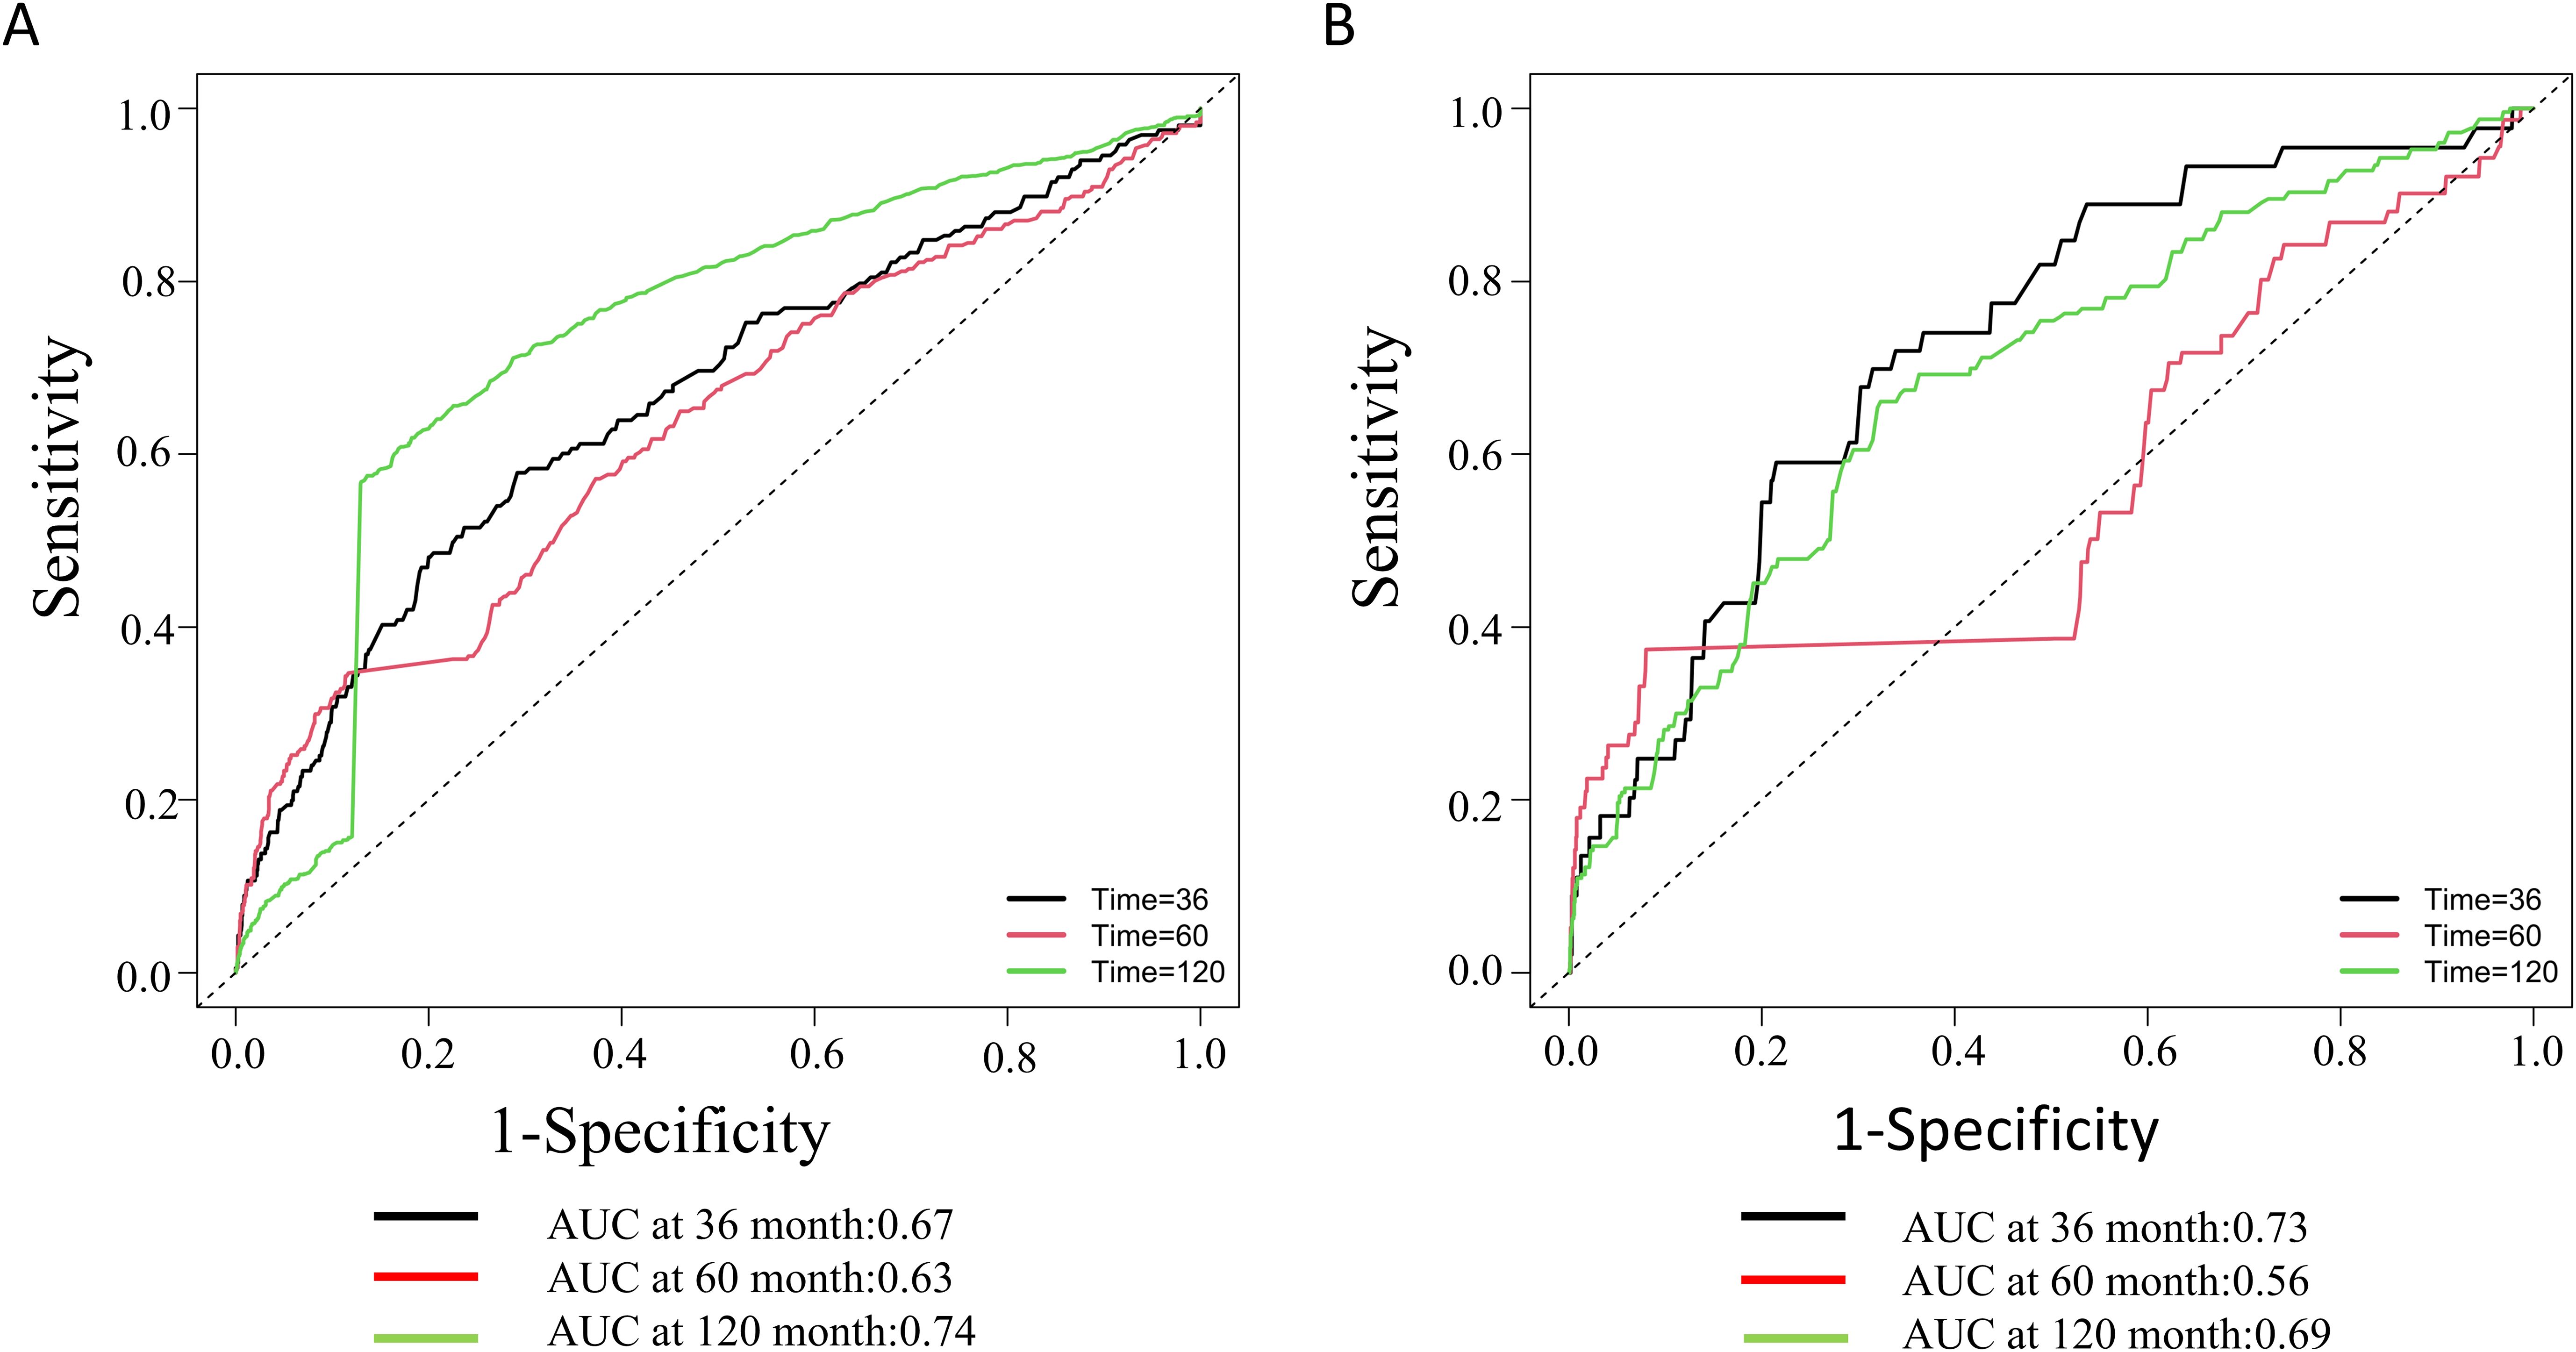
Figure 5. Time-dependent ROC curves and time-dependent AUC values of the NLR for predicting all-cause mortality (A) and cardiovascular mortality (B).
3.5 Subgroup analysis
Stratified analysis was conducted based on age (<60 years, ≥60 years), gender (male, female), race/ethnicity (Mexican American, other Hispanic, non-Hispanic white, non-Hispanic black, other race), smoking level (low, moderate, high), alcohol use (none, moderate and heavy), hypertension (no and yes), and diabetes status (diabetes, prediabetes) to assess the correlation between NLR and risk of death in various populations. According to Table 3, NLR is positively correlated with the risk of all-cause mortality, except in participants aged <60 years, other races, low smokers or heavy smokers, nondrinkers, prediabetics, and non-hypertensive patients. Interestingly, no statistically significant relationship between NLR and cardiovascular mortality was observed in female individuals with diabetes or prediabetes with comorbid OSA symptoms. Notably, however, there were significant interactions between NLR and most of the stratification variables.
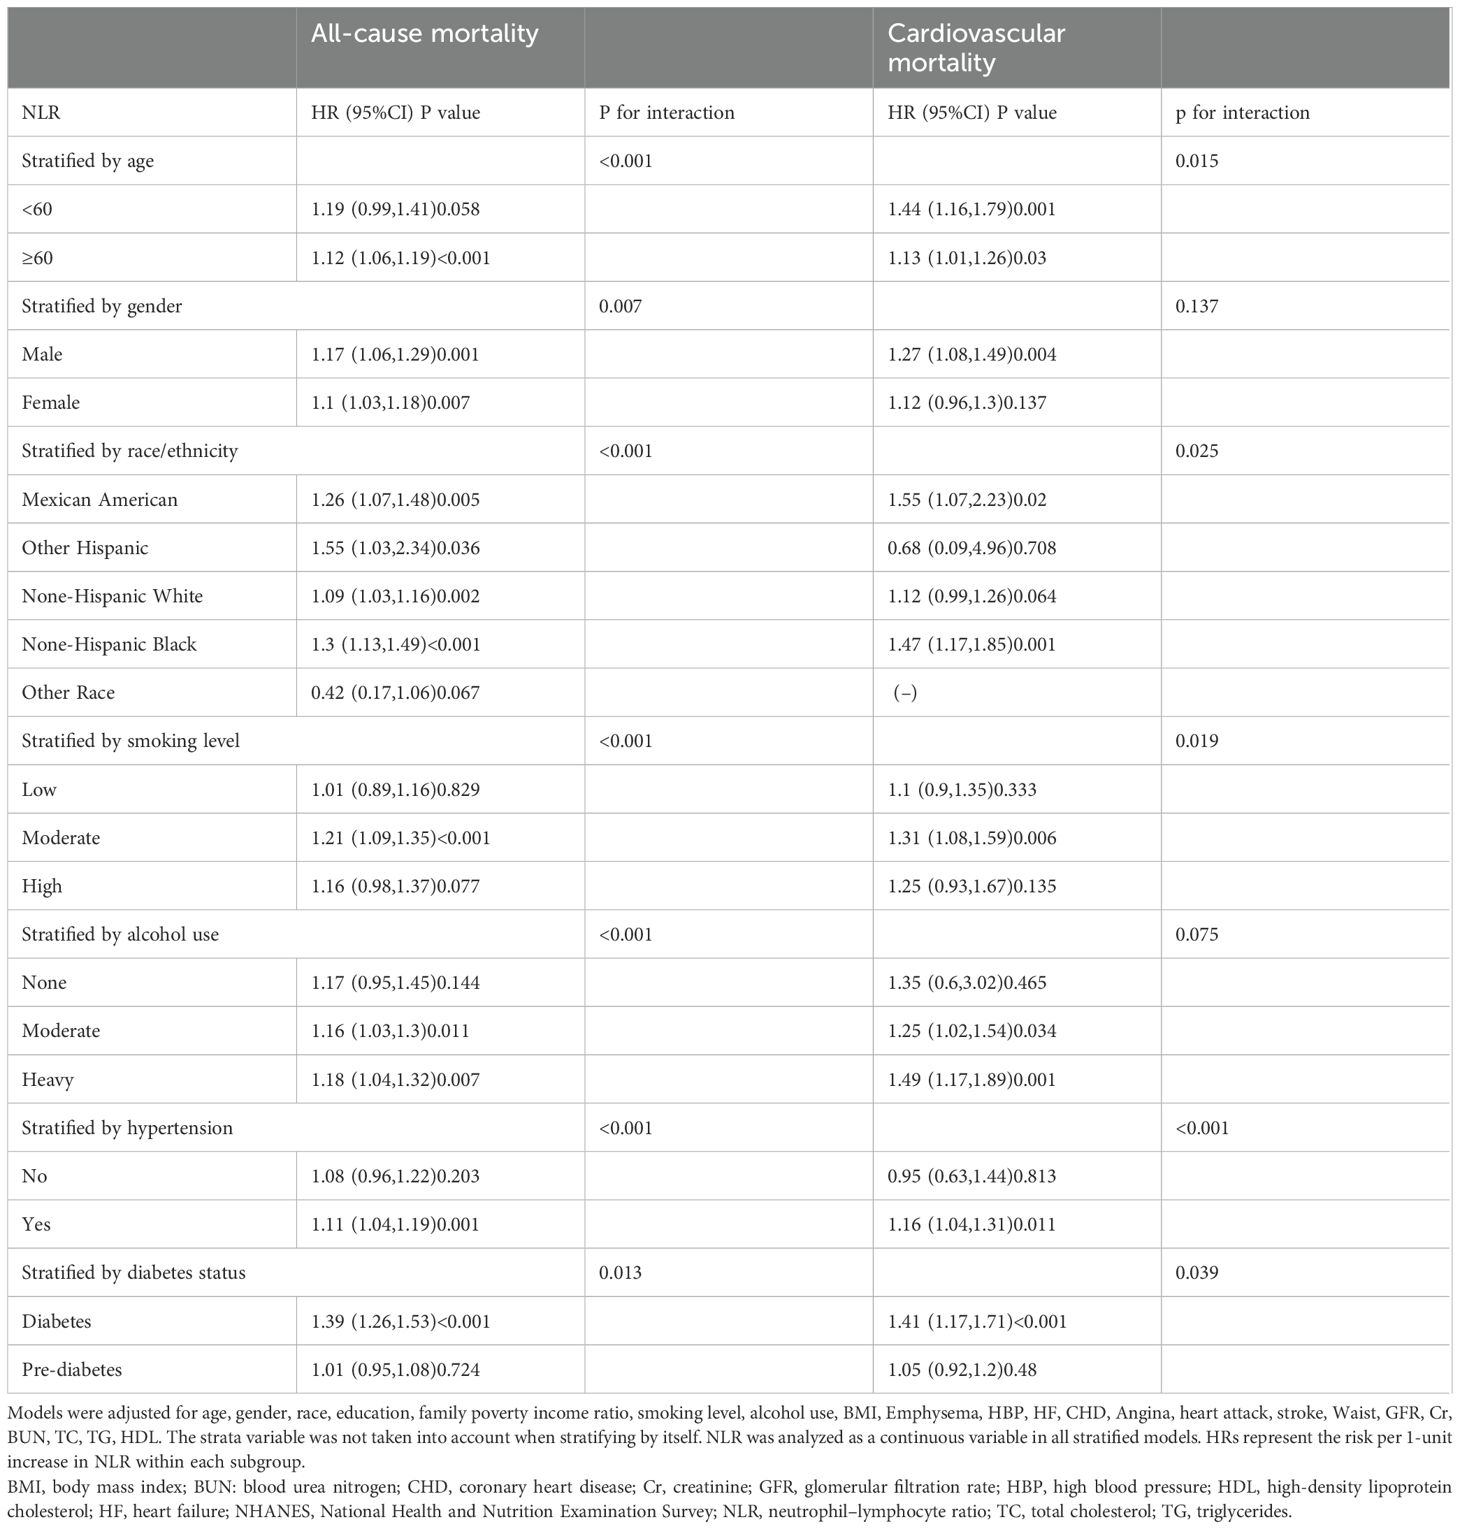
Table 3. Stratified analyses of association between NLR and mortality in the NHANES 2005-2008 and 2015-2018 (n=5732).
4 Discussion
Our study yields three pivotal findings in individuals with diabetes or prediabetes with comorbid OSA symptoms: A dose-response relationship between NLR levels and mortality risk, with the highest quartile associated with 76% and 208% increased risks of all-cause and cardiovascular mortality, respectively. Significant interactions between NLR and variables such as gender, race, and hypertension, suggesting tailored risk stratification strategies. NLR’s predictive accuracy for all-cause mortality improved over time (AUC=0.74 at 120 months), supporting its utility in long-term prognosis. These results underscore NLR’s clinical relevance in diabetic patients with OSA symptoms.
The underlying mechanisms may involve chronic inflammation and immune dysregulation (29). In OSA, intermittent hypoxia activates the sympathetic nervous system and promotes oxidative stress, increasing pro-inflammatory cytokines (e.g., IL-6, TNF-α) and adhesion molecules (30–32). Concurrently, diabetes exacerbates systemic inflammation through hyperglycemia-induced endothelial dysfunction and leukocyte activation (33). Neutrophils, as key mediators of innate immunity, are recruited to inflamed tissues, while lymphopenia reflects impaired adaptive immunity (29). Elevated NLR thus represents a dual imbalance: excessive neutrophil-driven inflammation and insufficient lymphocyte-mediated immunoregulation. This imbalance may accelerate atherosclerosis and cardiovascular damage in comorbid diabetes and OSA (34, 35). Additionally, bidirectional interactions between OSA and diabetes—such as insulin resistance from hypoxia-induced inflammation and β-cell dysfunction from autonomic dysregulation (6, 36, 37)—may amplify NLR’s prognostic value. Experimental studies suggest potential mechanistic pathways. For instance, intermittent hypoxia in OSA upregulates hypoxia-inducible factor-1α (HIF-1α), which stimulates neutrophil survival and pro-inflammatory cytokine production (38). In diabetic conditions, advanced glycation end products (AGEs) activate the receptor for AGEs (RAGE), further promoting neutrophil infiltration and endothelial dysfunction (39). Lymphocyte apoptosis, driven by hyperglycemia and oxidative stress, may also reduce lymphocyte counts (40). These pathways collectively establish NLR as a surrogate marker of systemic inflammation and tissue damage in patients with diabetes and OSA. Future studies should directly measure inflammatory markers (e.g., CRP, IL-6) and autonomic activity (e.g., heart rate variability) to validate these hypotheses.
Previous studies have demonstrated that NLR is associated with hyperglycemia (21, 22)and cardiovascular complications (34, 35) in diabetic patients, as well as with OSA severity (41), underscoring its potential as a prognostic tool in populations with comorbidities. However, while research by Dong et al. validated the predictive value of NLR in patients with diabetes alone, its applicability in diabetes-OSA comorbidity remains insufficiently explored (23). Notably, Chen et al. (42)demonstrated the predictive value of NLR for mortality in prediabetic patients; however, we failed to replicate this association in prediabetic individuals with OSA symptoms, suggesting that comorbid OSA may obscure NLR’s prognostic utility through complex inflammatory crosstalk. The mechanisms involved need to be further studied.
Subgroup analyses revealed significant heterogeneity in NLR’s prognostic value. Males exhibited stronger associations (HR=1.17 vs. 1.10 in females), potentially linked to testosterone-driven inflammatory responses (43). Non-Hispanic black patients had the highest risk (HR=1.47), which may be due to genetic and environmental differences between racial groups that influence the expression of the chronic inflammatory response (44).NLR’s predictive power was amplified in hypertensive patients (HR=1.16), likely reflecting compounded inflammatory burden (45). Moderate smokers (HR=1.31) but not heavy smokers had elevated risks, suggesting a threshold effect of tobacco-induced inflammation (46). The closer association of NLR with cardiovascular mortality in younger patients may be related to age-related physiologic differences, including changes in immune response and inflammatory mechanisms, the exact reasons for which need to be further explored. These findings advocate for NLR-guided risk stratification tailored to demographic and clinical profiles. Furthermore, the complex interactions between NLR and stratification variables indicate that NLR functions as a dynamic biomarker shaped by biological factors (e.g., sex hormones, genetics) and environmental modifiers (e.g., smoking). The lack of association in the prediabetes-OSA subgroup further suggests that comorbid OSA may impair NLR’s predictive capacity through hypoxia-immune crosstalk, necessitating dedicated mechanistic investigations.
In a word, our findings extend current knowledge by demonstrating that NLR’s predictive value is particularly pronounced in diabetic patients with comorbid OSA symptoms. This subgroup faces compounded risks from chronic inflammation and intermittent hypoxia, which may accelerate cardiovascular damage. Importantly, our stratified analyses revealed significant interactions between NLR and variables such as age, smoking, and hypertension, suggesting that NLR could guide personalized monitoring in high-risk subgroups. However, certain limitations must be acknowledged in this study. Firstly, due to its cross-sectional nature, the NHANES study was unable to determine causality. Because baseline NLR measurements may not reflect subsequent changes in inflammatory status as a result of treatment or disease progression, future longitudinal studies are necessary to confirm the relationship between dynamic changes in NLR and mortality. Secondly, residual confounding from unmeasured variables (e.g., genetic factors, detailed medication use) may persist despite adjusting for numerous confounders. Future studies should adopt more refined adjustment strategies or randomized controlled trials to further validate these associations. Thirdly, the findings may not generalize to non-U.S. populations, particularly Asian subgroups, as NHANES primarily reflects the U.S. demographic composition with limited representation of Asian individuals (e.g., <5% in our cohort). Racial differences in genetic susceptibility, lifestyle factors, and disease manifestations may influence NLR’s prognostic utility, necessitating validation in diverse ethnic cohorts. Additionally, self-reported lifestyle variables (e.g., smoking, and alcohol use) might introduce recall bias, though NHANES employs rigorous protocols to minimize such errors. Finally, the biological mechanisms underlying the interaction between NLR, diabetes, and OSA remain speculative; experimental studies are needed to explore inflammatory pathways (e.g., IL-6, TNF-α) and autonomic dysfunction.
5 Conclusion
In conclusion, our study demonstrates that elevated NLR levels are significantly associated with increased risks of all-cause mortality and cardiovascular mortality in diabetic patients with OSA symptoms. This association may stem from chronic inflammation, oxidative stress, and autonomic dysfunction. Although the cross-sectional design precludes causal inference, these findings underscore NLR’s potential as an accessible biomarker for identifying high-risk individuals. Future studies should explore mechanistic pathways, such as hypoxia-induced cytokine release, AGE-RAGE signaling, and lymphocyte apoptosis, to elucidate NLR’s role in disease progression and its potential therapeutic applications.
Data availability statement
The raw data supporting the conclusions of this article will be made available by the authors, without undue reservation.
Ethics statement
The studies involving humans were approved by National Health and Nutrition Examination Survey. The studies were conducted in accordance with the local legislation and institutional requirements. The participants provided their written informed consent to participate in this study.
Author contributions
J-MH: Writing – original draft. YY: Writing – review & editing, Supervision, Project administration.
Funding
The author(s) declare that no financial support was received for the research and/or publication of this article.
Conflict of interest
The authors declare that the research was conducted in the absence of any commercial or financial relationships that could be construed as a potential conflict of interest.
Generative AI statement
The author(s) declare that no Generative AI was used in the creation of this manuscript.
Publisher’s note
All claims expressed in this article are solely those of the authors and do not necessarily represent those of their affiliated organizations, or those of the publisher, the editors and the reviewers. Any product that may be evaluated in this article, or claim that may be made by its manufacturer, is not guaranteed or endorsed by the publisher.
References
1. Javaheri S, Javaheri S. Update on persistent excessive daytime sleepiness in OSA. Chest. (2020) 158:776–86. doi: 10.1016/j.chest.2020.02.036
2. Gottlieb DJ, Punjabi NM. Diagnosis and management of obstructive sleep apnea: A review. JAMA. (2020) 323:1389–400. doi: 10.1001/jama.2020.3514
3. Peppard PE, Young T, Barnet JH, Palta M, Hagen EW, Hla KM. Increased prevalence of sleep-disordered breathing in adults. Am J Epidemiol. (2013) 177:1006–14. doi: 10.1093/aje/kws342
4. Brown J, Yazdi F, Jodari-Karimi M, Owen JG, Reisin E. Obstructive sleep apnea and hypertension: updates to a critical relationship. Curr Hypertens Rep. (2022) 24:173–84. doi: 10.1007/s11906-022-01181-w
5. Mitra AK, Bhuiyan AR, Jones EA. Association and risk factors for obstructive sleep apnea and cardiovascular diseases: A systematic review. Diseases. (2021) 9:88. doi: 10.3390/diseases9040088
6. Reutrakul S, Mokhlesi B. Obstructive sleep apnea and diabetes: A state of the art review. Chest. (2017) 152:1070–86. doi: 10.1016/j.chest.2017.05.009
7. Saeedi P, Petersohn I, Salpea P, Malanda B, Karuranga S, Unwin N, et al. Global and regional diabetes prevalence estimates for 2019 and projections for 2030 and 2045: Results from the International Diabetes Federation Diabetes Atlas, 9th edition. Diabetes Res Clin Pract. (2019) 157:107843. doi: 10.1016/j.diabres.2019.107843
8. Knowler WC, Barrett-Connor E, Fowler SE, Hamman RF, Lachin JM, Walker EA, et al. Reduction in the incidence of type 2 diabetes with lifestyle intervention or metformin. N Engl J Med. (2002) 346:393–403. doi: 10.1056/NEJMoa012512
9. Chi ZS, Lee ET, Lu M, Keen H, Bennett PH. Vascular disease prevalence in diabetic patients in China: standardised comparison with the 14 centres in the WHO Multinational Study of Vascular Disease in Diabetes. Diabetologia. (2001) 44 [Suppl 2]:S82–86. doi: 10.1007/pl00002944
10. Forouhi NG, Sattar N, Tillin T, McKeigue PM, Chaturvedi N. Do known risk factors explain the higher coronary heart disease mortality in South Asian compared with European men? Prospective follow-up of the Southall and Brent studies, UK. Diabetologia. (2006) 49:2580–8. doi: 10.1007/s00125-006-0393-2
11. van Dieren S, Beulens JWJ, van der Schouw YT, Grobbee DE, Neal B. The global burden of diabetes and its complications: an emerging pandemic. Eur J Cardiovasc Prev Rehabil. (2010) 17 Suppl 1:S3–8. doi: 10.1097/01.hjr.0000368191.86614.5a
12. Raghavan S, Vassy JL, Ho Y-L, Song RJ, Gagnon DR, Cho K, et al. Diabetes mellitus-related all-cause and cardiovascular mortality in a national cohort of adults. J Am Heart Assoc. (2019) 8:e011295. doi: 10.1161/JAHA.118.011295
13. Resnick HE, Redline S, Shahar E, Gilpin A, Newman A, Walter R, et al. Diabetes and sleep disturbances: findings from the Sleep Heart Health Study. Diabetes Care. (2003) 26:702–9. doi: 10.2337/diacare.26.3.702
14. Foster GD, Sanders MH, Millman R, Zammit G, Borradaile KE, Newman AB, et al. Obstructive sleep apnea among obese patients with type 2 diabetes. Diabetes Care. (2009) 32:1017–9. doi: 10.2337/dc08-1776
15. Moon K, Punjabi NM, Aurora RN. Obstructive sleep apnea and type 2 diabetes in older adults. Clinics Geriatric Med. (2015) 31:139–47. doi: 10.1016/j.cger.2014.08.023
16. Cupp MA, Cariolou M, Tzoulaki I, Aune D, Evangelou E, Berlanga-Taylor AJ. Neutrophil to lymphocyte ratio and cancer prognosis: an umbrella review of systematic reviews and meta-analyses of observational studies. BMC Med. (2020) 18:360. doi: 10.1186/s12916-020-01817-1
17. Huang Z, Fu Z, Huang W, Huang K. Prognostic value of neutrophil-to-lymphocyte ratio in sepsis: A meta-analysis. Am J Emerg Med. (2020) 38:641–7. doi: 10.1016/j.ajem.2019.10.023
18. Hashemi Moghanjoughi P, Neshat S, Rezaei A, Heshmat-Ghahdarijani K. Is the neutrophil-to-lymphocyte ratio an exceptional indicator for metabolic syndrome disease and outcomes? Endocr Pract. (2022) 28:342–8. doi: 10.1016/j.eprac.2021.11.083
19. Wei Y, Feng J, Ma J, Chen D, Chen J. Neutrophil/lymphocyte, platelet/lymphocyte and monocyte/lymphocyte ratios in patients with affective disorders. J Affect Disord. (2022) 309:221–8. doi: 10.1016/j.jad.2022.04.092
20. Sayed A, Bahbah EI, Kamel S, Barreto GE, Ashraf GM, Elfil M. The neutrophil-to-lymphocyte ratio in Alzheimer’s disease: Current understanding and potential applications. J Neuroimmunol. (2020) 349:577398. doi: 10.1016/j.jneuroim.2020.577398
21. Cortellini A, D’Alessio A, Cleary S, Buti S, Bersanelli M, Bordi P, et al. Type 2 diabetes mellitus and efficacy outcomes from immune checkpoint blockade in patients with cancer. Clin Cancer Res. (2023) 29:2714–24. doi: 10.1158/1078-0432.CCR-22-3116
22. Adane T, Melku M, Worku YB, Fasil A, Aynalem M, Kelem A, et al. The association between neutrophil-to-lymphocyte ratio and glycemic control in type 2 diabetes mellitus: A systematic review and meta-analysis. J Diabetes Res. (2023) 2023:3117396. doi: 10.1155/2023/3117396
23. Dong G, Gan M, Xu S, Zhou M, Wu L. The neutrophil–lymphocyte ratio as a risk factor for all-cause and cardiovascular mortality among individuals with diabetes: evidence from the NHANES 2003–2016. Cardiovasc Diabetol. (2023) 22:1–11. doi: 10.1186/s12933-023-01998-y
24. Zou X, Zhou X, Zhu Z, Ji L. Novel subgroups of patients with adult-onset diabetes in Chinese and US populations. Lancet Diabetes Endocrinol. (2019) 7:9–11. doi: 10.1016/S2213-8587(18)30316-4
25. Ding L, Zhang H, Dai C, Zhang A, Yu F, Mi L, et al. The prognostic value of the stress hyperglycemia ratio for all-cause and cardiovascular mortality in patients with diabetes or prediabetes: insights from NHANES 2005-2018. Cardiovasc Diabetol. (2024) 23:84. doi: 10.1186/s12933-024-02172-8
26. Cavallino V, Rankin E, Popescu A, Gopang M, Hale L, Meliker JR. Antimony and sleep health outcomes: NHANES 2009-2016. Sleep Health. (2022) 8:373–9. doi: 10.1016/j.sleh.2022.05.005
27. Zq X, Hx L, Wl T, L Y, Xw M, Wx L, et al. Association of serum vitamin C with NAFLD and MAFLD among adults in the United States. Front Nutr. (2022) 8:795391. doi: 10.3389/fnut.2021.795391
28. Reja D, Makar M, Visaria A, Karanfilian B, Rustgi V. Blood lead level is associated with advanced liver fibrosis in patients with non-alcoholic fatty liver disease: A nationwide survey (NHANES 2011–2016). Ann Hepatol. (2020) 19:404–10. doi: 10.1016/j.aohep.2020.03.006
29. Azab B, Daoud J, Naeem FB, Nasr R, Ross J, Ghimire P, et al. Neutrophil-to-lymphocyte ratio as a predictor of worsening renal function in diabetic patients (3-year follow-up study). Ren Fail. (2012) 34:571–6. doi: 10.3109/0886022X.2012.668741
30. Kheirandish-Gozal L, Gozal D. Obstructive sleep apnea and inflammation: proof of concept based on two illustrative cytokines. Int J Mol Sci. (2019) 20:459. doi: 10.3390/ijms20030459
31. Golbidi S, Badran M, Ayas N, Laher I. Cardiovascular consequences of sleep apnea. Lung. (2012) 190:113–32. doi: 10.1007/s00408-011-9340-1
32. Unnikrishnan D, Jun J, Polotsky V. Inflammation in sleep apnea: an update. Rev Endocr Metab Disord. (2015) 16:25–34. doi: 10.1007/s11154-014-9304-x
33. Luo L, Dong B, Zhang J, Qiu Y, Liu X, Zhou Z, et al. Dapagliflozin restores diabetes-associated decline in vasculogenic capacity of endothelial progenitor cells via activating AMPK-mediated inhibition of inflammation and oxidative stress. Biochem Biophys Res Commun. (2023) 671:205–14. doi: 10.1016/j.bbrc.2023.05.094
34. Buonacera A, Stancanelli B, Colaci M, Malatino L. Neutrophil to lymphocyte ratio: an emerging marker of the relationships between the immune system and diseases. Int J Mol Sci. (2022) 23:3636. doi: 10.3390/ijms23073636
35. Wu C-C, Wu C-H, Lee C-H, Cheng C-I. Association between neutrophil percentage-to-albumin ratio (NPAR), neutrophil-to-lymphocyte ratio (NLR), platelet-to-lymphocyte ratio (PLR) and long-term mortality in community-dwelling adults with heart failure: evidence from US NHANES 2005-2016. BMC Cardiovasc Disord. (2023) 23:312. doi: 10.1186/s12872-023-03316-6
36. Aurora RN, Punjabi NM. Obstructive sleep apnoea and type 2 diabetes mellitus: a bidirectional association. Lancet Respir Med. (2013) 1:329–38. doi: 10.1016/S2213-2600(13)70039-0
37. Rajan P, Greenberg H. Obstructive sleep apnea as a risk factor for type 2 diabetes mellitus. Nat Sci Sleep. (2015) 7:113–25. doi: 10.2147/NSS.S90835
38. Ryan S, Taylor CT, McNicholas WT. Selective activation of inflammatory pathways by intermittent hypoxia in obstructive sleep apnea syndrome. Circulation. (2005) 112:2660–7. doi: 10.1161/CIRCULATIONAHA.105.556746
39. Yan SF, Ramasamy R, Schmidt AM. The RAGE axis: a fundamental mechanism signaling danger to the vulnerable vasculature. Circ Res. (2010) 106:842–53. doi: 10.1161/CIRCRESAHA.109.212217
40. Jagannathan-Bogdan M, McDonnell ME, Shin H, Rehman Q, Hasturk H, Apovian CM, et al. Elevated proinflammatory cytokine production by a skewed T cell compartment requires monocytes and promotes inflammation in type 2 diabetes. J Immunol. (2011) 186:1162–72. doi: 10.4049/jimmunol.1002615
41. Kadier K, Dilixiati D, Ainiwaer A, Liu X, Lu J, Liu P, et al. Analysis of the relationship between sleep-related disorder and systemic immune-inflammation index in the US population. BMC Psychiatry. (2023) 23:773. doi: 10.1186/s12888-023-05286-7
42. Chen G, Che L, Lai M, Wei T, Chen C, Zhu P, et al. Association of neutrophil-lymphocyte ratio with all-cause and cardiovascular mortality in US adults with diabetes and prediabetes: a prospective cohort study. BMC Endocr Disord. (2024) 24:64. doi: 10.1186/s12902-024-01592-7
43. Jaillon S, Berthenet K, Garlanda C. Sexual dimorphism in innate immunity. Clin Rev Allergy Immunol. (2019) 56:308–21. doi: 10.1007/s12016-017-8648-x
44. Thames AD, Irwin MR, Breen EC, Cole SW. Experienced discrimination and racial differences in leukocyte gene expression. Psychoneuroendocrinology. (2019) 106:277–83. doi: 10.1016/j.psyneuen.2019.04.016
45. Perticone M, Maio R, Gigliotti S, Arturi F, Succurro E, Sciacqua A, et al. Immuno-mediated inflammation in hypertensive patients with 1-h post-load hyperglycemia. IJMS. (2022) 23:10891. doi: 10.3390/ijms231810891
Keywords: neutrophil-lymphocyte ratio, obstructive sleep apnea, diabetes or prediabetes, all-cause and cardiovascular mortality, NHANES
Citation: He J-M and Yang Y (2025) Association between neutrophil-lymphocyte ratio and all-cause and cardiovascular mortality in patients with diabetes or prediabetes with comorbid obstructive sleep apnea symptoms: evidence from NHANES 2005-2008 and 2015-2018. Front. Endocrinol. 16:1512621. doi: 10.3389/fendo.2025.1512621
Received: 20 November 2024; Accepted: 25 March 2025;
Published: 22 April 2025.
Edited by:
Vikrant Rai, Western University of Health Sciences, United StatesReviewed by:
Rizaldy Taslim Pinzon, Duta Wacana Christian University, IndonesiaSylwia Dziegielewska-Gesiak, Medical University of Silesia, Poland
Copyright © 2025 He and Yang. This is an open-access article distributed under the terms of the Creative Commons Attribution License (CC BY). The use, distribution or reproduction in other forums is permitted, provided the original author(s) and the copyright owner(s) are credited and that the original publication in this journal is cited, in accordance with accepted academic practice. No use, distribution or reproduction is permitted which does not comply with these terms.
*Correspondence: Yi Yang, MDA3Mzg0QHl6dS5lZHUuY24=