 William J. Waldock
 Nicholas Tekkis1
 Hutan Ashrafian
- 1Imperial Healthcare UK National Health Service (NHS) Trust, London, United Kingdom
- 2Institute of Global Health Innovation, Imperial College London, London, United Kingdom
Objective: Health forecasting predicts population trends through risk prediction algorithms which can estimate the risk of future disease developing. Screening algorithms can systematically identify patients with a high probability of undiagnosed diseases for diagnostic testing. We describe a dual domain systematic review and meta-analysis of the accuracy of available risk tools to (1) predict prehypertensive deterioration to cardiovascular morbidity, & (2) predict prediabetes deterioration to diabetic morbidity.
Materials and Methods: The primary outcome was the accuracy of the risk scores, and the secondary outcomes were the reporting quality and risk of bias. The dual domain systematic review included studies involving risk tools for (1) prehypertensive adults to predict cardiovascular morbidity (including hypertension, stroke and coronary heart disease) and (2) prediabetic adults to predict diabetic morbidity (including Type 2 Diabetes and end organ damage, such as diabetic nephropathy). Following PROSPERO registration (IDs 425686 & 425683), searches were conducted in PubMed, MEDLINE and Google Scholar.
Results: Accuracy of risk prediction in prehypertension and prediabetes was high: the pooled C statistic for All Cause Cardiovascular Disease was 0.77 (CI 0.71, 0.84) and the pooled Sensitivity for All Cause Diabetic Disease Spectrum risk was 0.68 (CI 0.65, 0.7). However, we found high risk of bias, with inconsistent reporting in both prehypertension and prediabetes papers.
Discussion: We propose nine recommendations for policymakers and commissioners, organised under an “A to I” framework.
Conclusion: We found that predictive performance was generally accurate. However, there remain limitations due to methodological inconsistency, such as timeframe, which undermines comparison.
1 Introduction
The chronic disease burden on health systems is a global challenge. Half of the US population has a chronic disease, and 86% of health costs are attributable to chronic disease (1). Health systems are struggling to plan resource distribution to respond. There are two components of the necessary solution, health forecasting and predisease screening. Health forecasting predicts trends in future health events at a population level. This is achieved through risk prediction algorithms which can estimate the risk of future disease developing. Screening algorithms can systematically identify patients with a high probability of undiagnosed diseases for diagnostic testing. Predisease is of particular interest as a precursor of chronic morbidity.
Accurate health forecasts enable improvements in preventive health services, generate patient flow alerts and reduce staff costs. Prehypertension is defined as a systolic blood pressure of 120-139mmHg, and a diastolic blood pressure 80-89mmHg (2), and is a precursor to cardiovascular disease, such as stroke and myocardial infarction. Moreover, in the UK, one in four adults suffer from high blood pressure, it is the third most common reason for premature death, at least half of heart attacks and strokes are associated with hypertension, and it can lead to chronic organ failure and premature death (3). Prediabetes is a non-diabetic hyperglycaemic state (4) which enables warning of the development of diabetic disease; in the UK, around 7 million people are estimated to have prediabetes and therefore have a high risk for developing type 2 diabetes (5). Understanding potential trajectories in health directs long-term investments and policy implementation. This warning of chronic disease makes prediabetes and prehypertension amongst the most impactful targets of risk model products.
Past work on forecasting has provided an incomplete landscape of future health scenarios, highlighting the need for a more robust modelling platform to inform policy (6). In-home care which delivers intervention preemptively may reduce costs associated with non-urgent hospital care (7), and thus allow health forecasting to inform the allocation of resources. Through embedding risk scores into digital health tools, prediction capabilities can help patient self-care and doctor management plans. An electronic personal health record is one type of technology commonly used to support diabetes self-management (8). Preemptive analysis of electronic health records (EHRs) is vital for patient safety. The use of digital health tools could save approximately $7 billion a year in U.S. healthcare spending, equivalent to 1.4% of total expenditures (9). If artificial intelligence can assist in the accurate identification of groups in a population most at risk of developing chronic disease, resource allocation will be more effective. In the UK, ‘Core20Plus5’ (10) is an initiative to reduce healthcare inequalities, in which a target outpatient population of the most deprived 20% of society and five key diagnostic priorities (including hypertension and lipid management) are prioritised, simultaneously saving resources and improving health engagement.
The deterioration of model performance due to drift and bias present two major governance challenges to global health policy leaders. Whilst artificial intelligence may assist in addressing the priorities of ‘Core20Plus5’, there are risks that alternative inequalities may be exacerbated by model bias. For example, hypertension disproportionately affects Afro-Caribbean ethnicities (11); in 2019, an algorithm built using historical data reportedly produced healthcare predictions that favoured white people above black people in the US (12). Nevertheless, this project is directly in line with the official objectives of the Commonwealth Fund, the WHO and UK National Health Policy, and will support the UK’s digital transformation (13); it will act on the ES(H)G investment principles set out in the Business for Health initiative (14) and supports the ambitions of Our Future Health (15). Herein, we describe a dual domain systematic review and meta-analysis of the accuracy of available risk tools to predict prehypertensive deterioration to cardiovascular morbidity & prediabetes deterioration to diabetic morbidity.
2 Methods
This dual domain systematic review and meta-analysis was conducted according to a registered protocol and is reported according to the Preferred Reporting Items for Systematic Reviews and Meta-Analyses (PRISMA) statement (16).
2.1 Information sources and search strategy
Following the PROSPERO registration (IDs 425686 & 425683), a systematic literature search was performed across multiple databases to identify relevant studies for reviews on Prediabetes and Prehypertension. Initial searches were conducted in PubMed, MEDLINE, and Google Scholar. Secondary searches in EMBASE, The Cochrane Library, Health Technology Assessment Database, and Web of Science yielded only duplicate records, which were removed during the deduplication process in Covidence. Covidence was also used for abstract screening and to manage references throughout the review process. The search strategy was structured with both keyword and MeSH terms to ensure comprehensive coverage of relevant literature. The full systematic search included all publications available up to 10/05/2023. For each review, we specified MeSH terms alongside keywords to target specific populations, conditions, and risk assessments:
Prediabetes Review
Keywords: “diabetes AND risk tool AND prediabetes” OR “diabetes AND risk score AND prediabetes.”
MeSH Terms:
“Diabetes Mellitus, Type 2”
“Prediabetic State”
“Risk Assessment”
“Risk Factors”
Prehypertension Review
Keywords: “risk tool AND prehypertension AND cardiovascular disease” OR “risk score AND prehypertension AND cardiovascular disease.”
MeSH Terms:
“Hypertension”
“Prehypertension”
“Cardiovascular Diseases”
“Risk Assessment”
“Risk Factors”
Search Parameters and Filters
Boolean operators (AND, OR) were employed to refine and combine search terms effectively. Searches were limited to studies published in English and involving human participants, with no restrictions on publication date. In the final stage, advice was sought from the library services at Imperial College London to further refine the search protocol.
Data Management
Search results from all databases were uploaded into Covidence, which was used to remove duplicates, manage citations, and streamline the abstract screening process.
2.2 Eligibility criteria
The exclusion criteria were if the article was not in English, and not about the (1) prehypertension to hypertension, or (2) prediabetes to diabetes disease spectrum respectively, not reporting accuracy data, not a prediction tool, the subjects included children aged (0-17), or a meta-analysis, Editorial/Opinion Article.
2.3 Selection process
The selection process was performed in three stages: first, titles were screened for relevance. Second, abstracts of the selected titles were reviewed. Finally, full-text articles were assessed for eligibility. Duplicates were removed using Covidence software, and all stages were performed independently by two reviewers (WW & NT). Any discrepancies were resolved by consulting a third reviewer (HA).
2.4 Risk of bias
Two review authors (WW & NT) independently screen assessed the risk of bias with the prediction model risk of bias assessment tool PROBAST, which is organised into the following 4 domains: participants, predictors, outcome, and analysis (17). This explores how weaknesses in study design, conduct, or analysis can lead to systematically distorted estimates of model predictive performance (17). Any discrepancy involved a third senior supervisor colleague (HA) being consulted.
2.5 Data extraction
Two independent review authors assisted in the stat extraction and subsequent meta-analysis. It was recorded in a mutually shared Excel file with two researchers checking the results. Any discrepancy involved a third colleague being consulted. Individual studies which met the inclusion criteria were included in the statistical analysis, with checks included to ensure no duplication of results under analysis. In the event of an apparent duplication, analysis only included new data from additional studies not already represented.
2.6 Data synthesis
These search strategies were kept separate. The dual domain systematic review to concomitantly appraise two risk tools included studies involving risk tools for (1) prehypertensive adults to predict cardiovascular morbidity (including hypertension, stroke and coronary heart disease) and (2) prediabetic adults to predict diabetic morbidity (including Type 2 Diabetes and end organ damage, such as diabetic nephropathy). The dual domain systematic review was conducted in Covidence with data extracted for analysis according to the following categories: study, author, year, population, risk score, disease, time period and accuracy. It was recorded in a mutually shared Excel file with two researchers (WW & NT) checking the results.
Risk ratios for individual studies were combined using a random-effects meta-analysis, which presents the extent of between-study variation and enables Chi2, I2 & Tau2 heterogeneity analysis. Only studies predicting cardiovascular disease or diabetic disease, respectively, over a fixed time period were considered. The different risk tools and their respective performance in predicting cardiovascular & diabetic morbidity were analysed as subgroups. The software used to conduct the meta-analysis was StataCorp. ((2017). Stata Statistical Software: Release 15. College Station, TX: StataCorp LLC). We provided a narrative synthesis of the study findings and meta-analysis of the accuracy of the two domains of predisease risk tools.
3 Results
3.1 Study selection
3.1.1 Prehypertension
The prehypertension search identified 1793 relevant citations. After removing duplicate results, 1555 articles were screened for titles and abstracts, and 44 studies were included for full-text review. 27 articles were excluded after full-length review due to lack of predictive clarity as per the PROBAST criteria. Thus,17 studies were eligible for inclusion in the study (Figure 1a), with a total of 3,077,131 patients represented in the final meta-analysis, after accounting for the risk of double counting patients in different studies. The number of patients involved in each study ranged from 302 to 1,129,098, and the descriptive variables are displayed in Table 1a. Table 2a provides a Summary of Results. Figure 2a describes the PROBAST (17) Risk of Bias assessment. Figures 3 and 4 describe the subgroups of results.
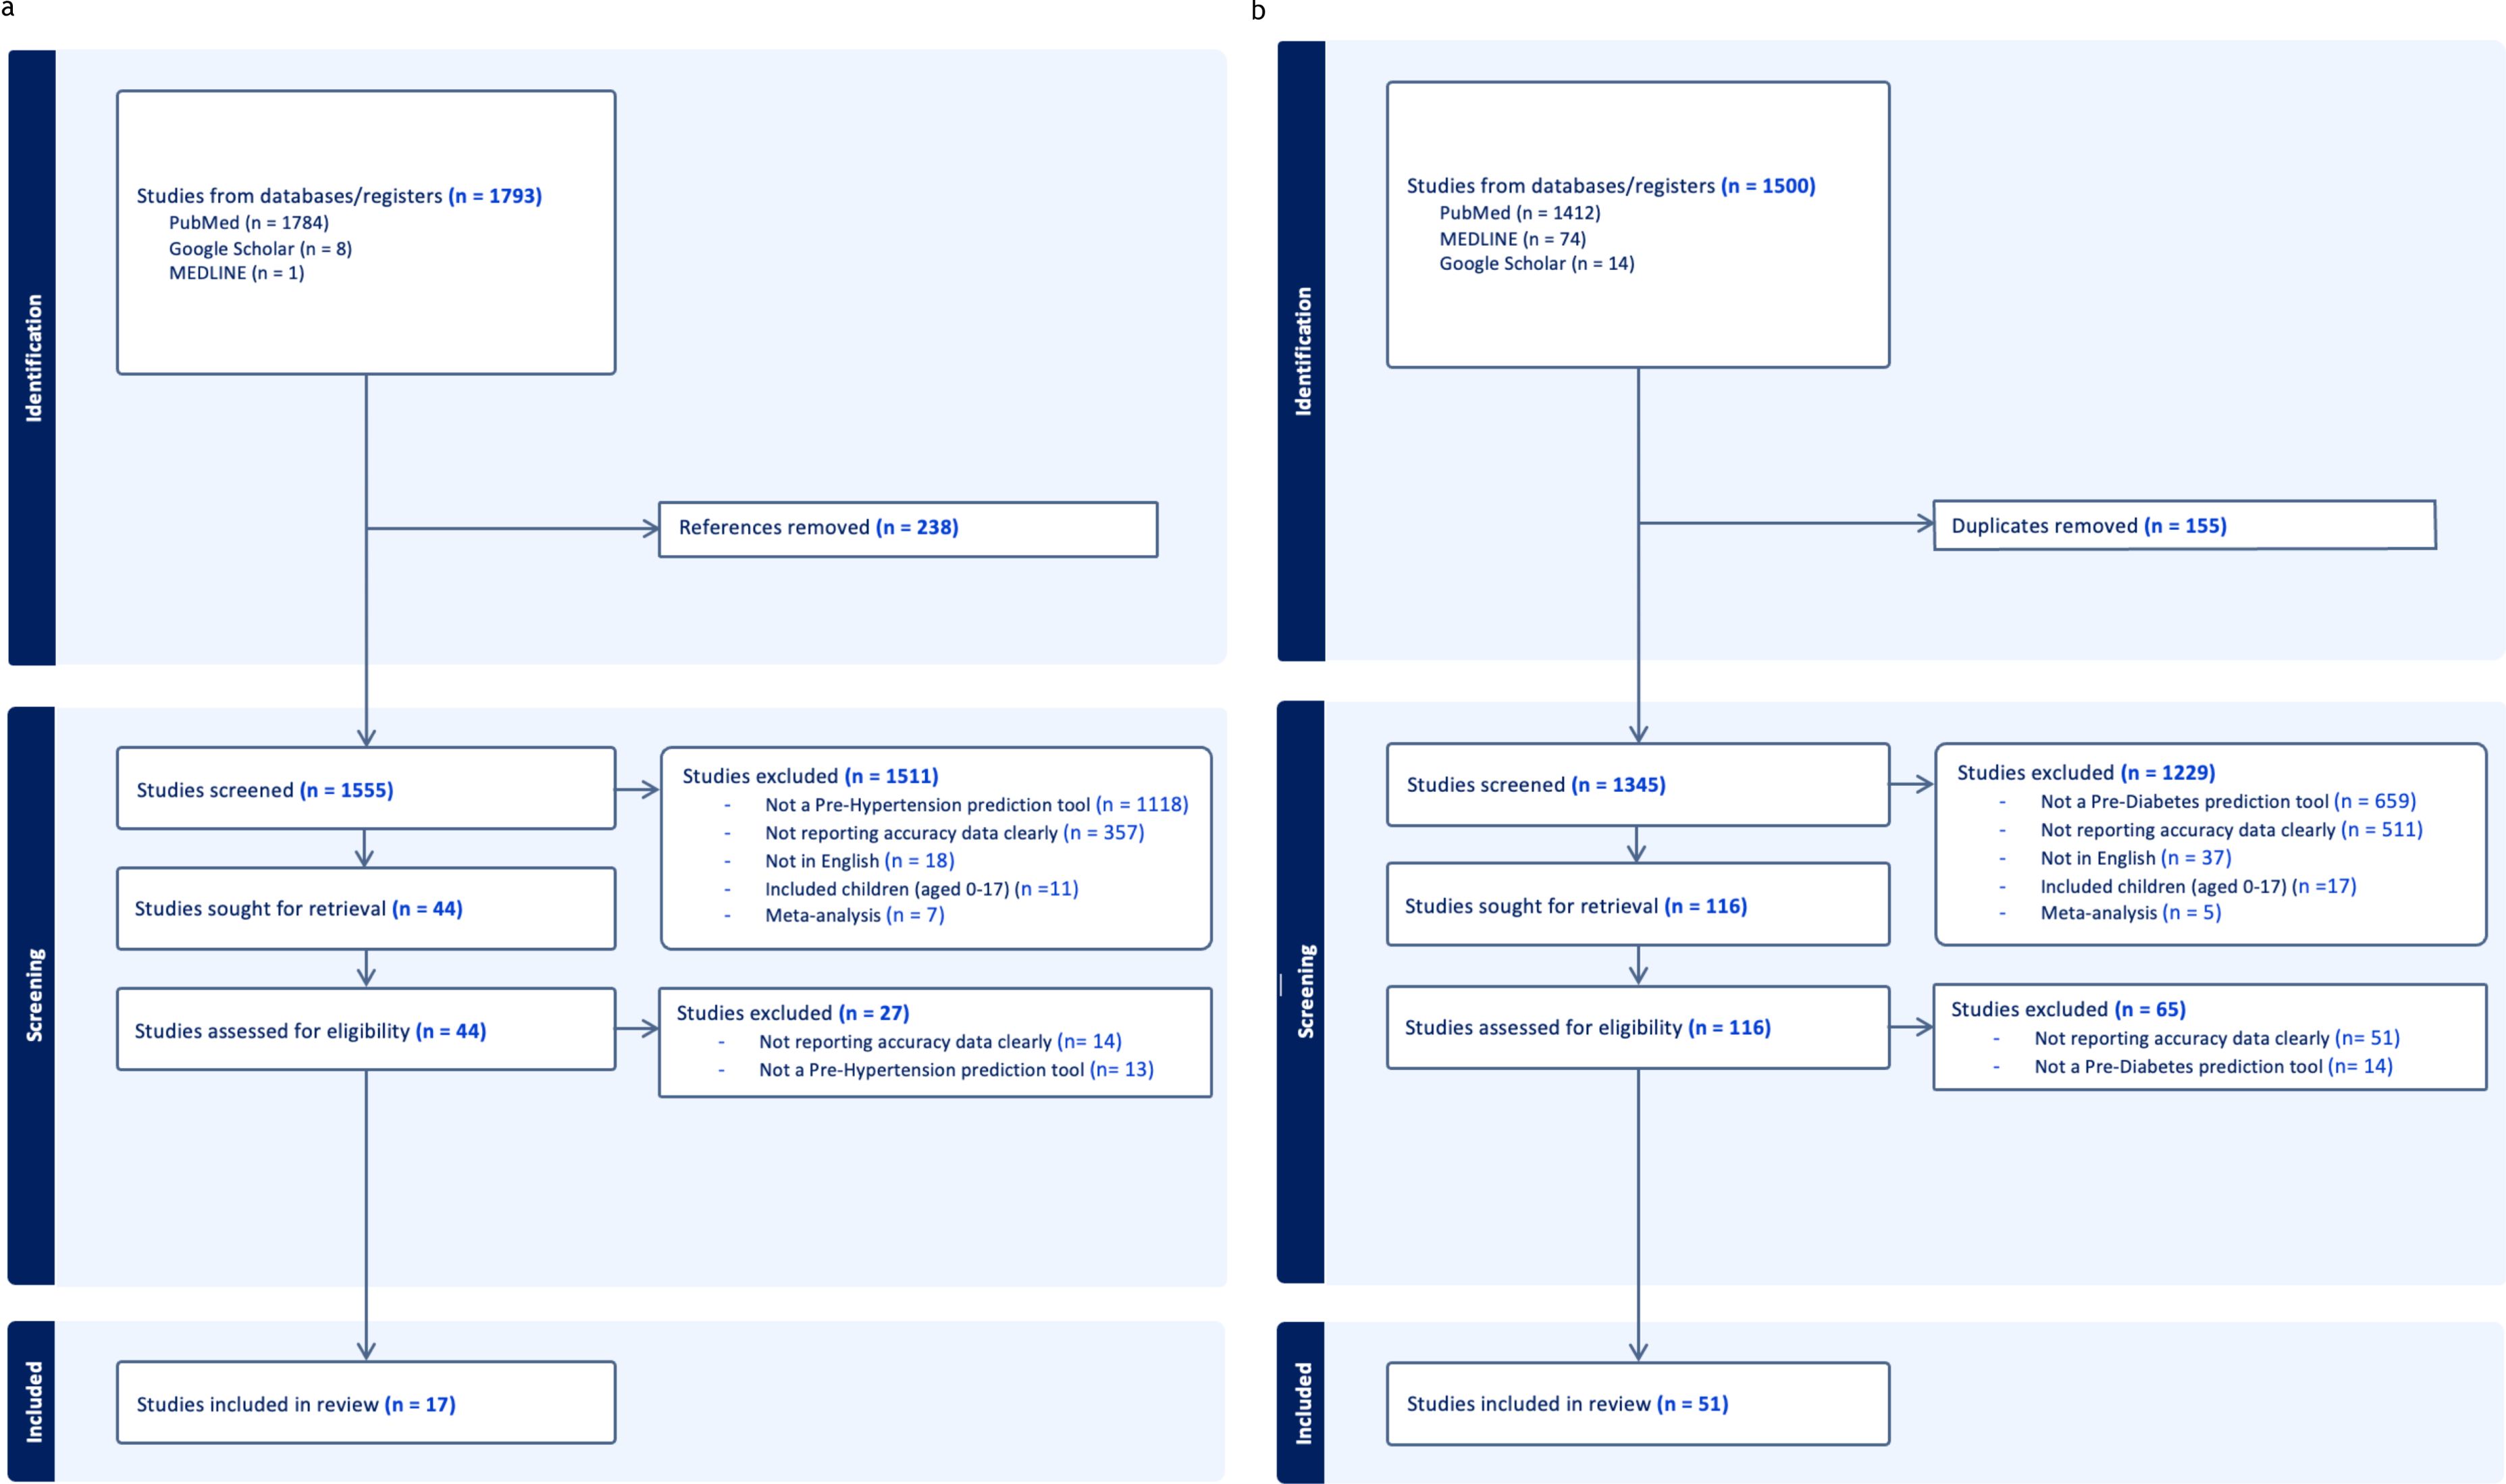
Figure 1. (a) Prehypertension PRISMA Diagram. (b) Prediabetes PRISMA diagram.
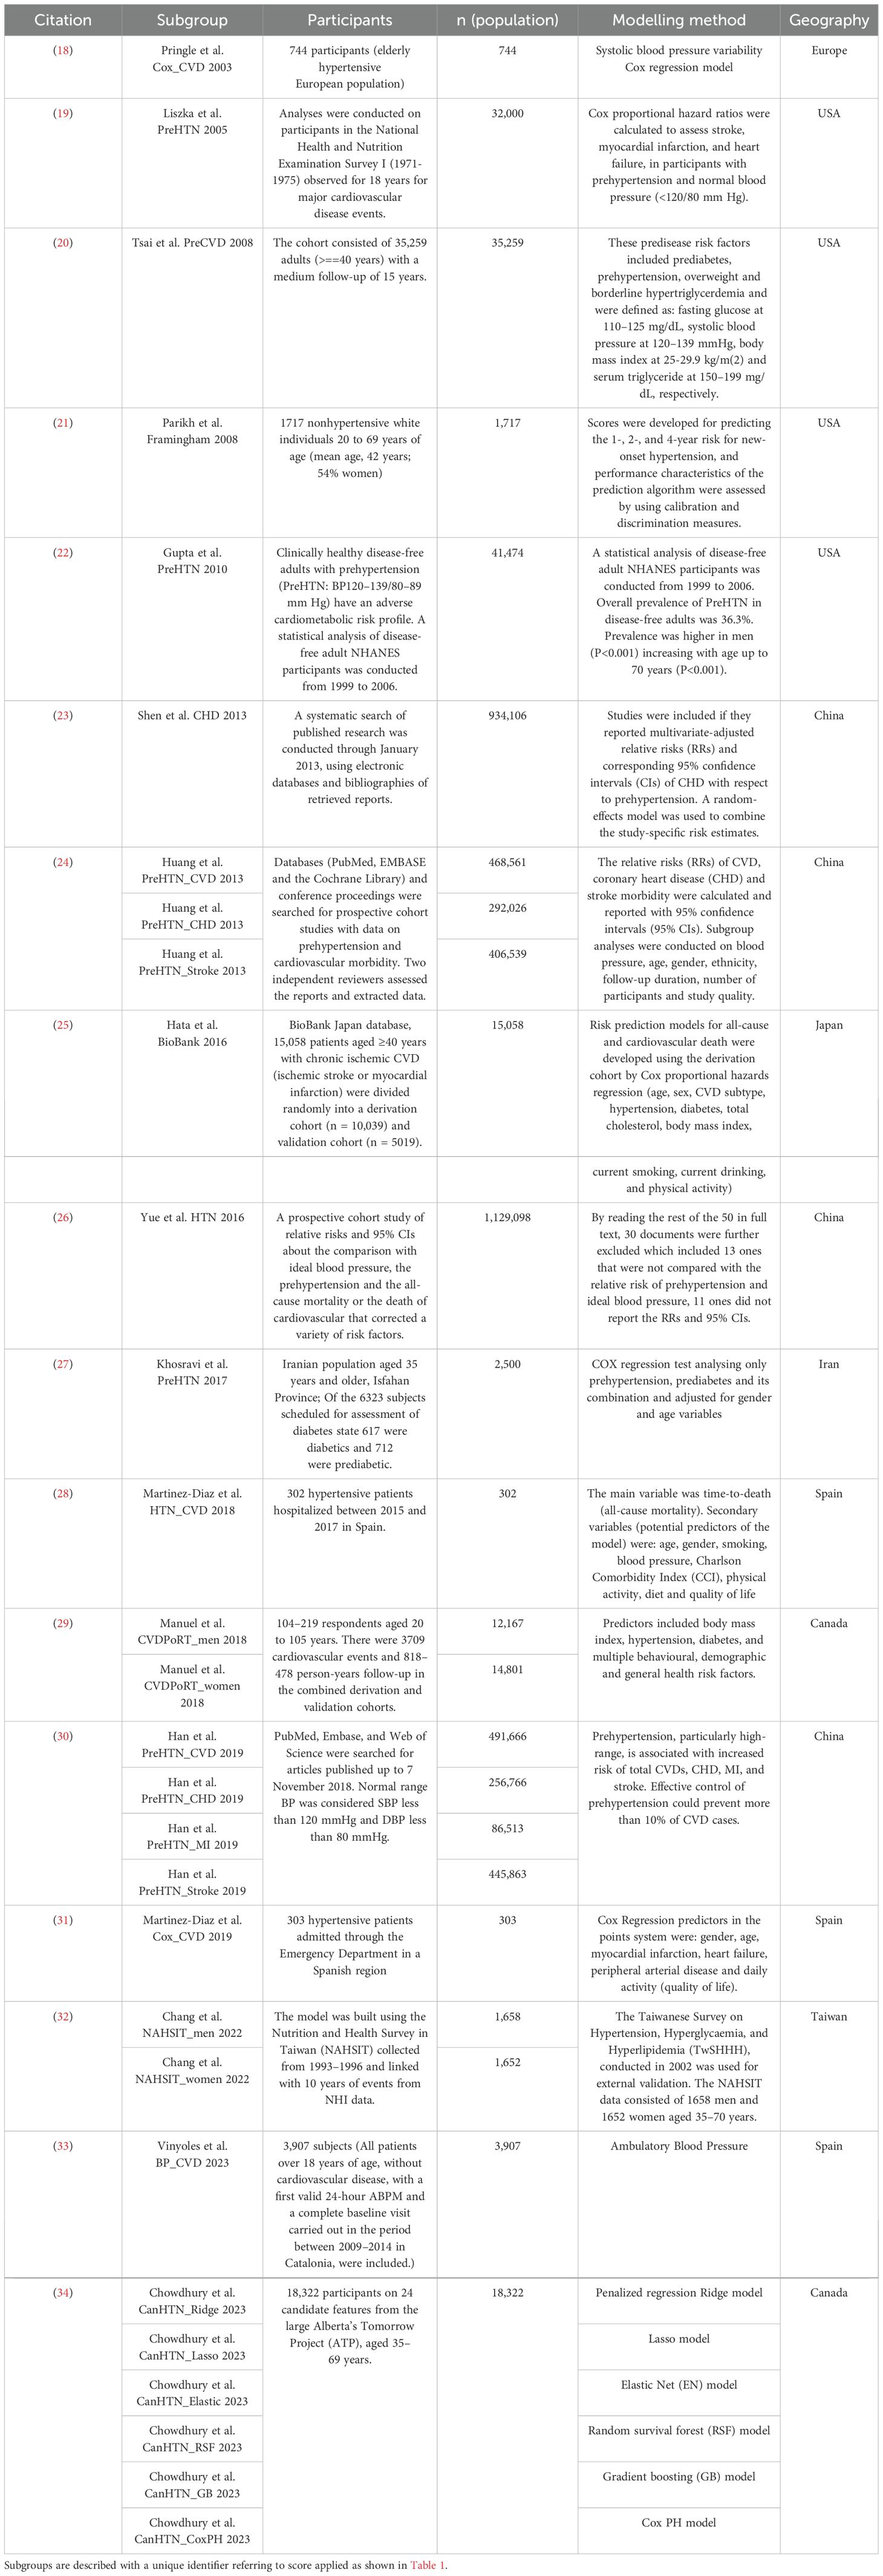
Table 1a. Prehypertension descriptive variables table.
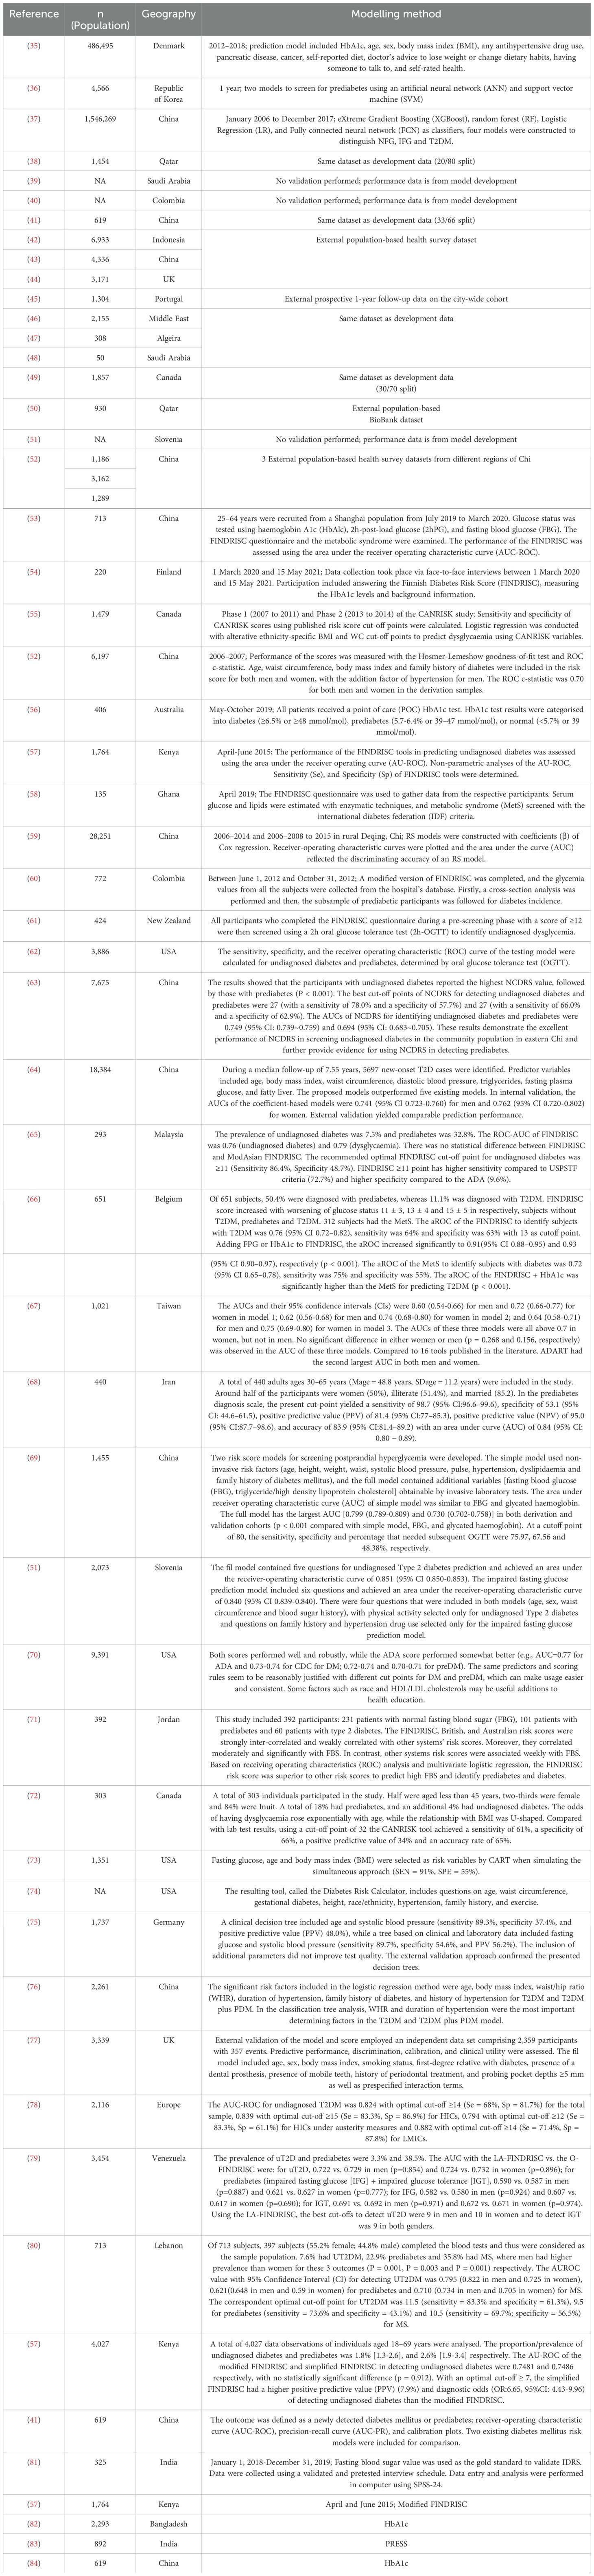
Table 1b. Prediabetes descriptive variables table.
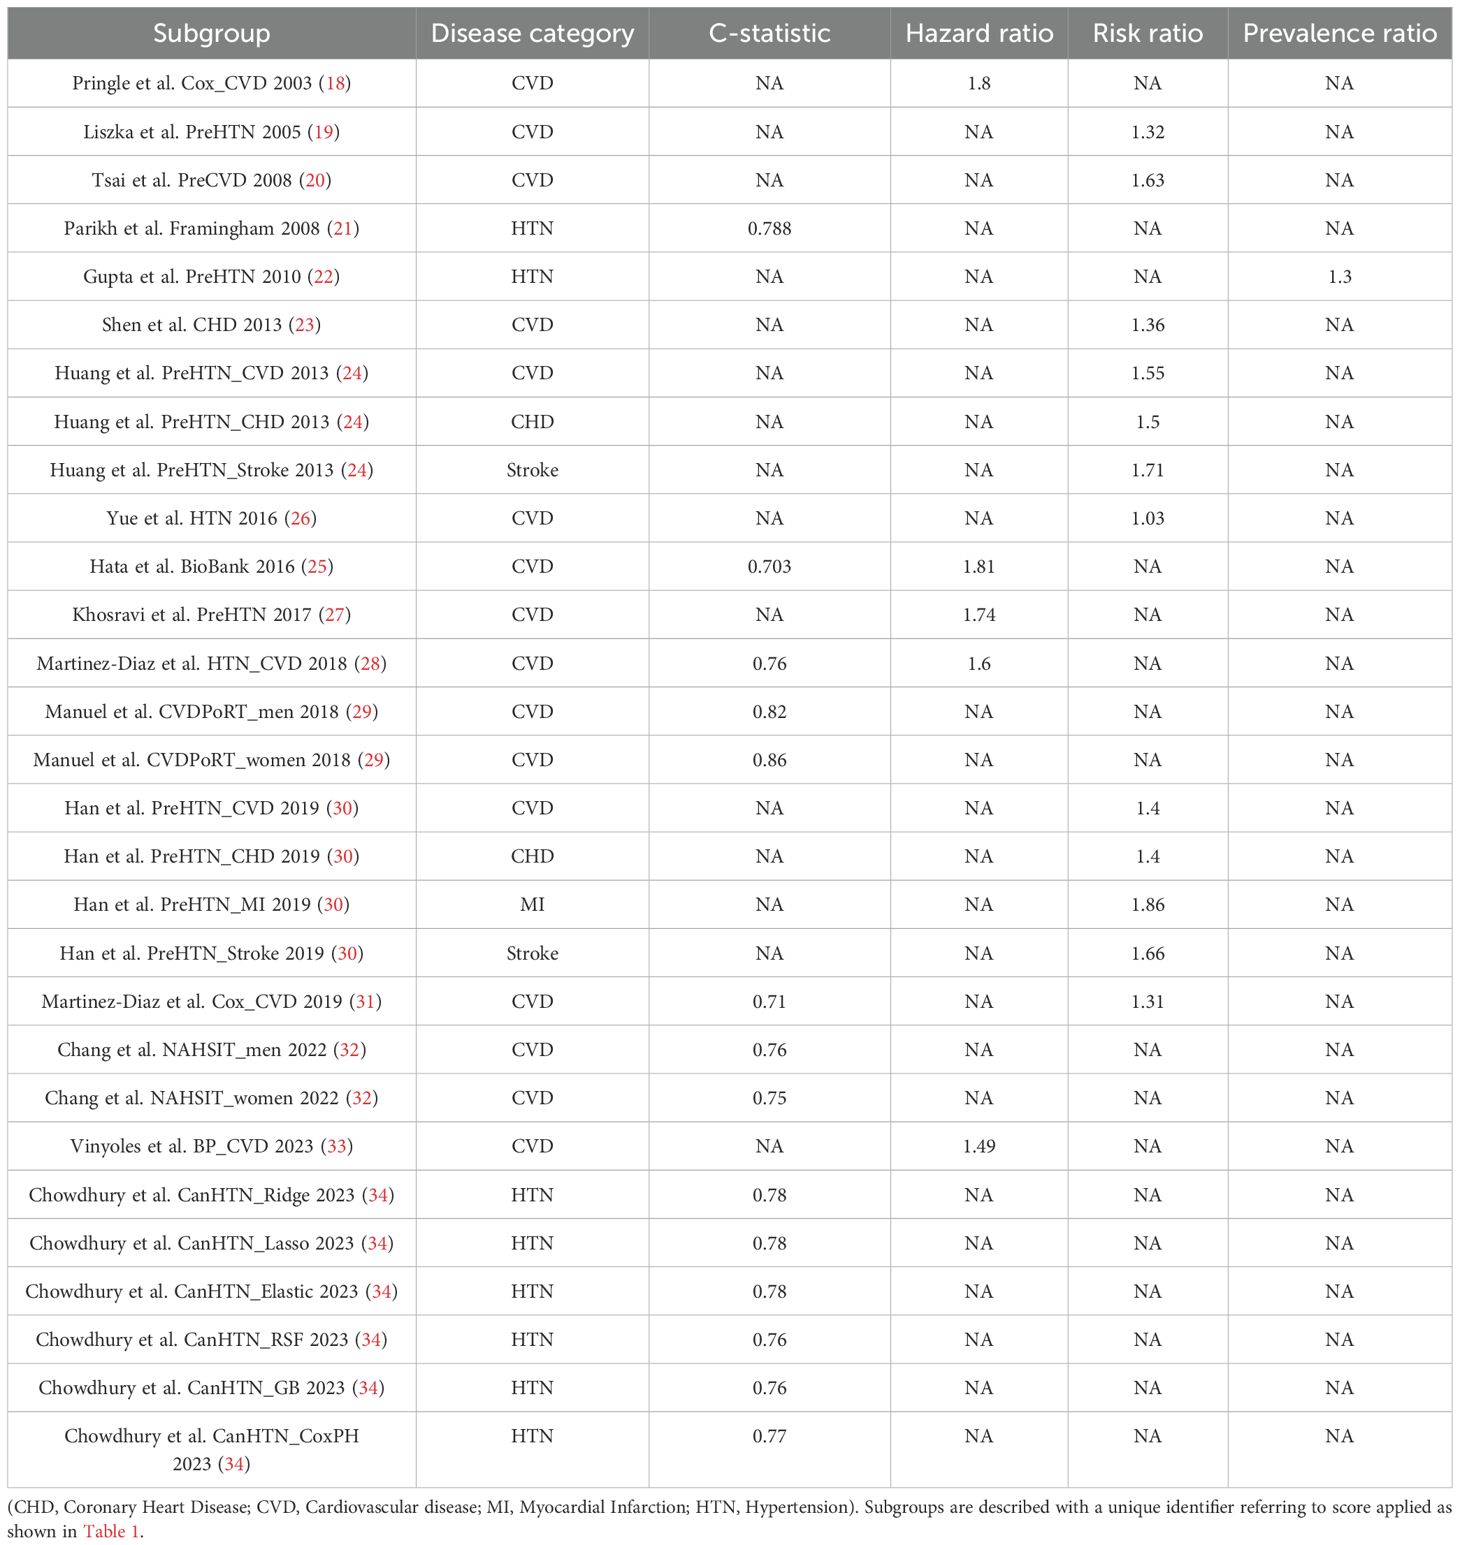
Table 2a. Summary results table.
Table 2b. Sensitivity, Specificity, PPV, NPV, accuracy and area under the curve of all cause diabetes scores.
Figure 2. (a) Prehypertension risk of bias PROBAST (17) diagrams. (b) Prediabetes risk of bias PROBAST (17) diagrams.
Figure 3. All cause cardiovascular disease risk ratio forest plot.
Figure 4. Stroke risk ratio forest plot.
3.1.2 All cause cardiovascular disease
The pooled C statistic for All Cause Cardiovascular Disease was 0.77 (CI 0.71, 0.84) across a population of 42,631. When assessing the C-statistic for prediction scores of the development of all cause cardiovascular disease, the Chi2 heterogeneity was 8.9e+07, the I2 variation attributable to heterogeneity was 100% and the Tau2 between-study variance was 0.0055.
The pooled Hazard Ratio for All Cause Cardiovascular Disease was 1.55 CI 1.38, 1.71) across a population of 22,512. When assessing the Hazard Ratio for all cause cardiovascular disease, the Chi2 heterogeneity was 1.73, and the I2 variation attributable to heterogeneity was 0.
The pooled Risk Ratio for All Cause Cardiovascular Disease was 1.29 (CI 1.26, 1.32) across a population of 2,824,371 (Figure 3) and was found to have a Chi2 heterogeneity 98.45 and I2 variation attributable to heterogeneity was 93.9%.
3.1.3 Hypertension
The pooled C Statistic for Hypertension was 0.77 (CI 0.77, 0.78) across a population of 20,039. When assessing the C-Statistics of prediction scores of the development of hypertension, the Chi2 heterogeneity was 5.2e+06, the I2 variation attributable to heterogeneity was 100% and the Tau2 estimate of between-study variance was 0.0001.
3.1.4 Stroke
The pooled Risk Ratio for Stroke was 1.67 (CI 1.59, 1.76) across a population of 852,402 (Figure 4). When the Stroke Risk Ratio was assessed, the Chi2 heterogeneity was found to be 0.25 and the I2 variation attributable to heterogeneity was 0%.
3.2 Prehypertension risk of bias
Amongst the 29 study subgroups which underwent PROBAST (17) ‘risk of bias’ evaluation (Figure 2a), 86% (25/29) study subgroups were found to have some concerns of bias and 14% (4/29) studies were found to have low bias. In the subdomain analysis, concerns of bias were found to be 41% (12/29) in the Participants section, 10% (3/29) in the Predictors section, 28% (8/29) in the Outcome section and 17% (5/29) in the Analysis section. Any discrepancy involved a senior third colleague being consulted. Individual studies which met the inclusion criteria were included in the statistical analysis, with checks included to ensure no duplication of results under analysis.
3.2.1 Prediabetes
The prediabetes search identified 1500 relevant citations. After removing duplicate results, 1345 articles were screened for titles and abstracts, and 116 studies were included for full-text review. 65 articles were excluded after full-length review due to lack of predictive clarity as per the PROBAST criteria. Thus, 51 studies were eligible for inclusion in the study (Figure 1b), with a total of 2,193,555 patients represented in the final meta-analysis, after accounting for the risk of double counting patients in different studies. The descriptive variables are displayed in Table 1b. Table 2b provides a Summary of Results. Figure 2b describes the PROBAST (17) Risk of Bias assessment. Figures 5 and 6 describe the subgroups of results.
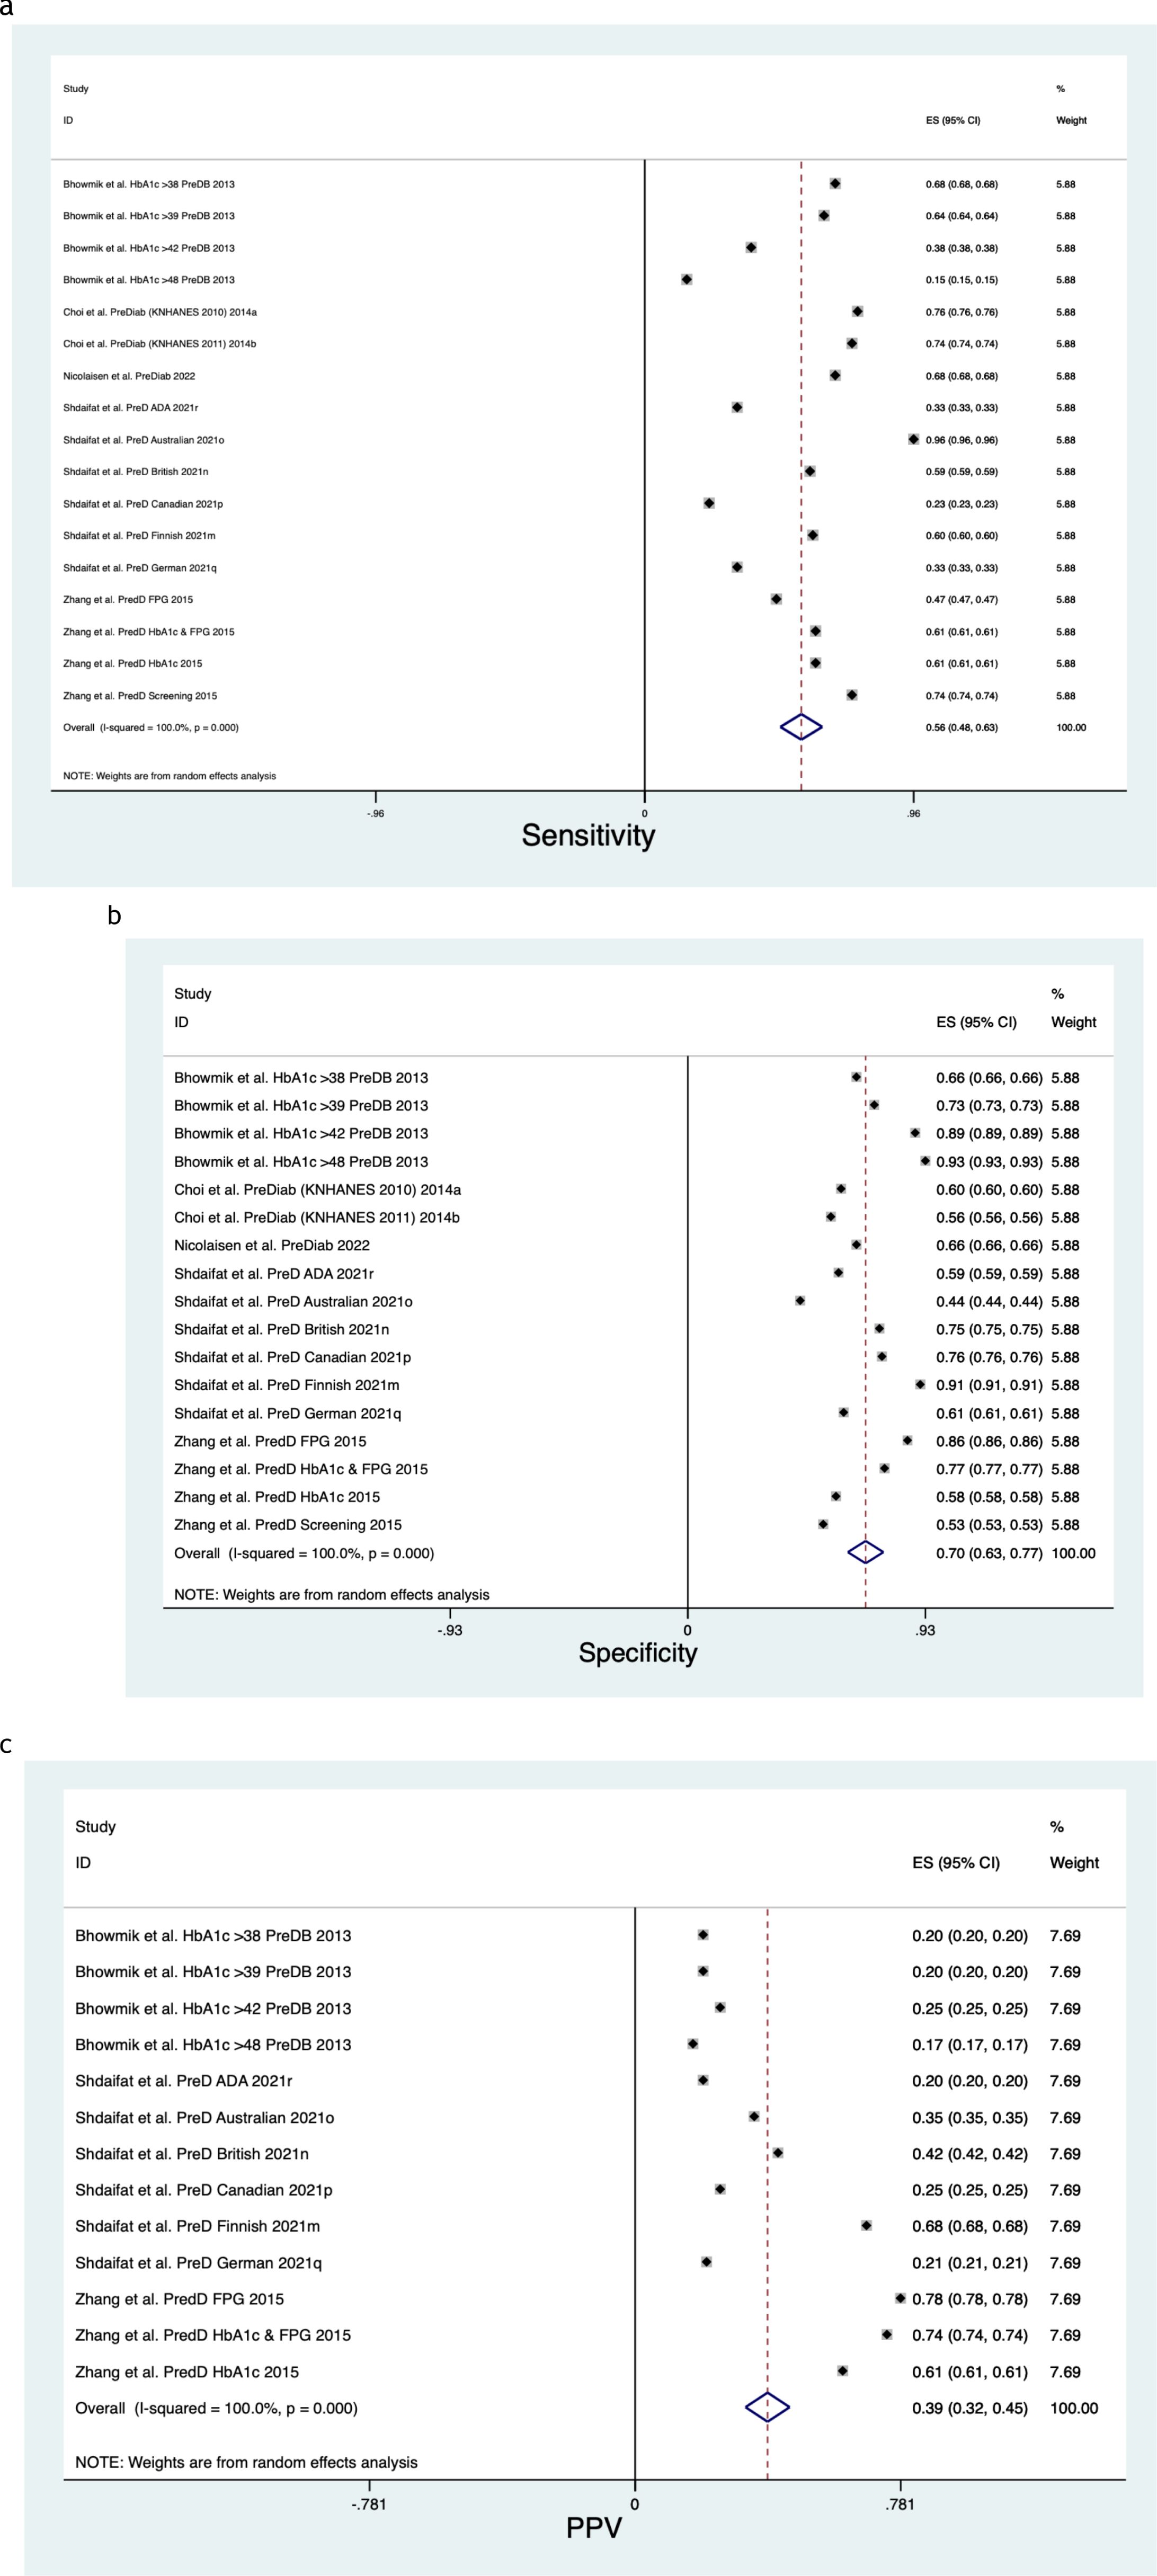
Figure 5. (a) Prediabetes sensitivity forest plot. (b) Prediabetes specificity forest plot. (c) Prediabetes positive predictive value forest plot.
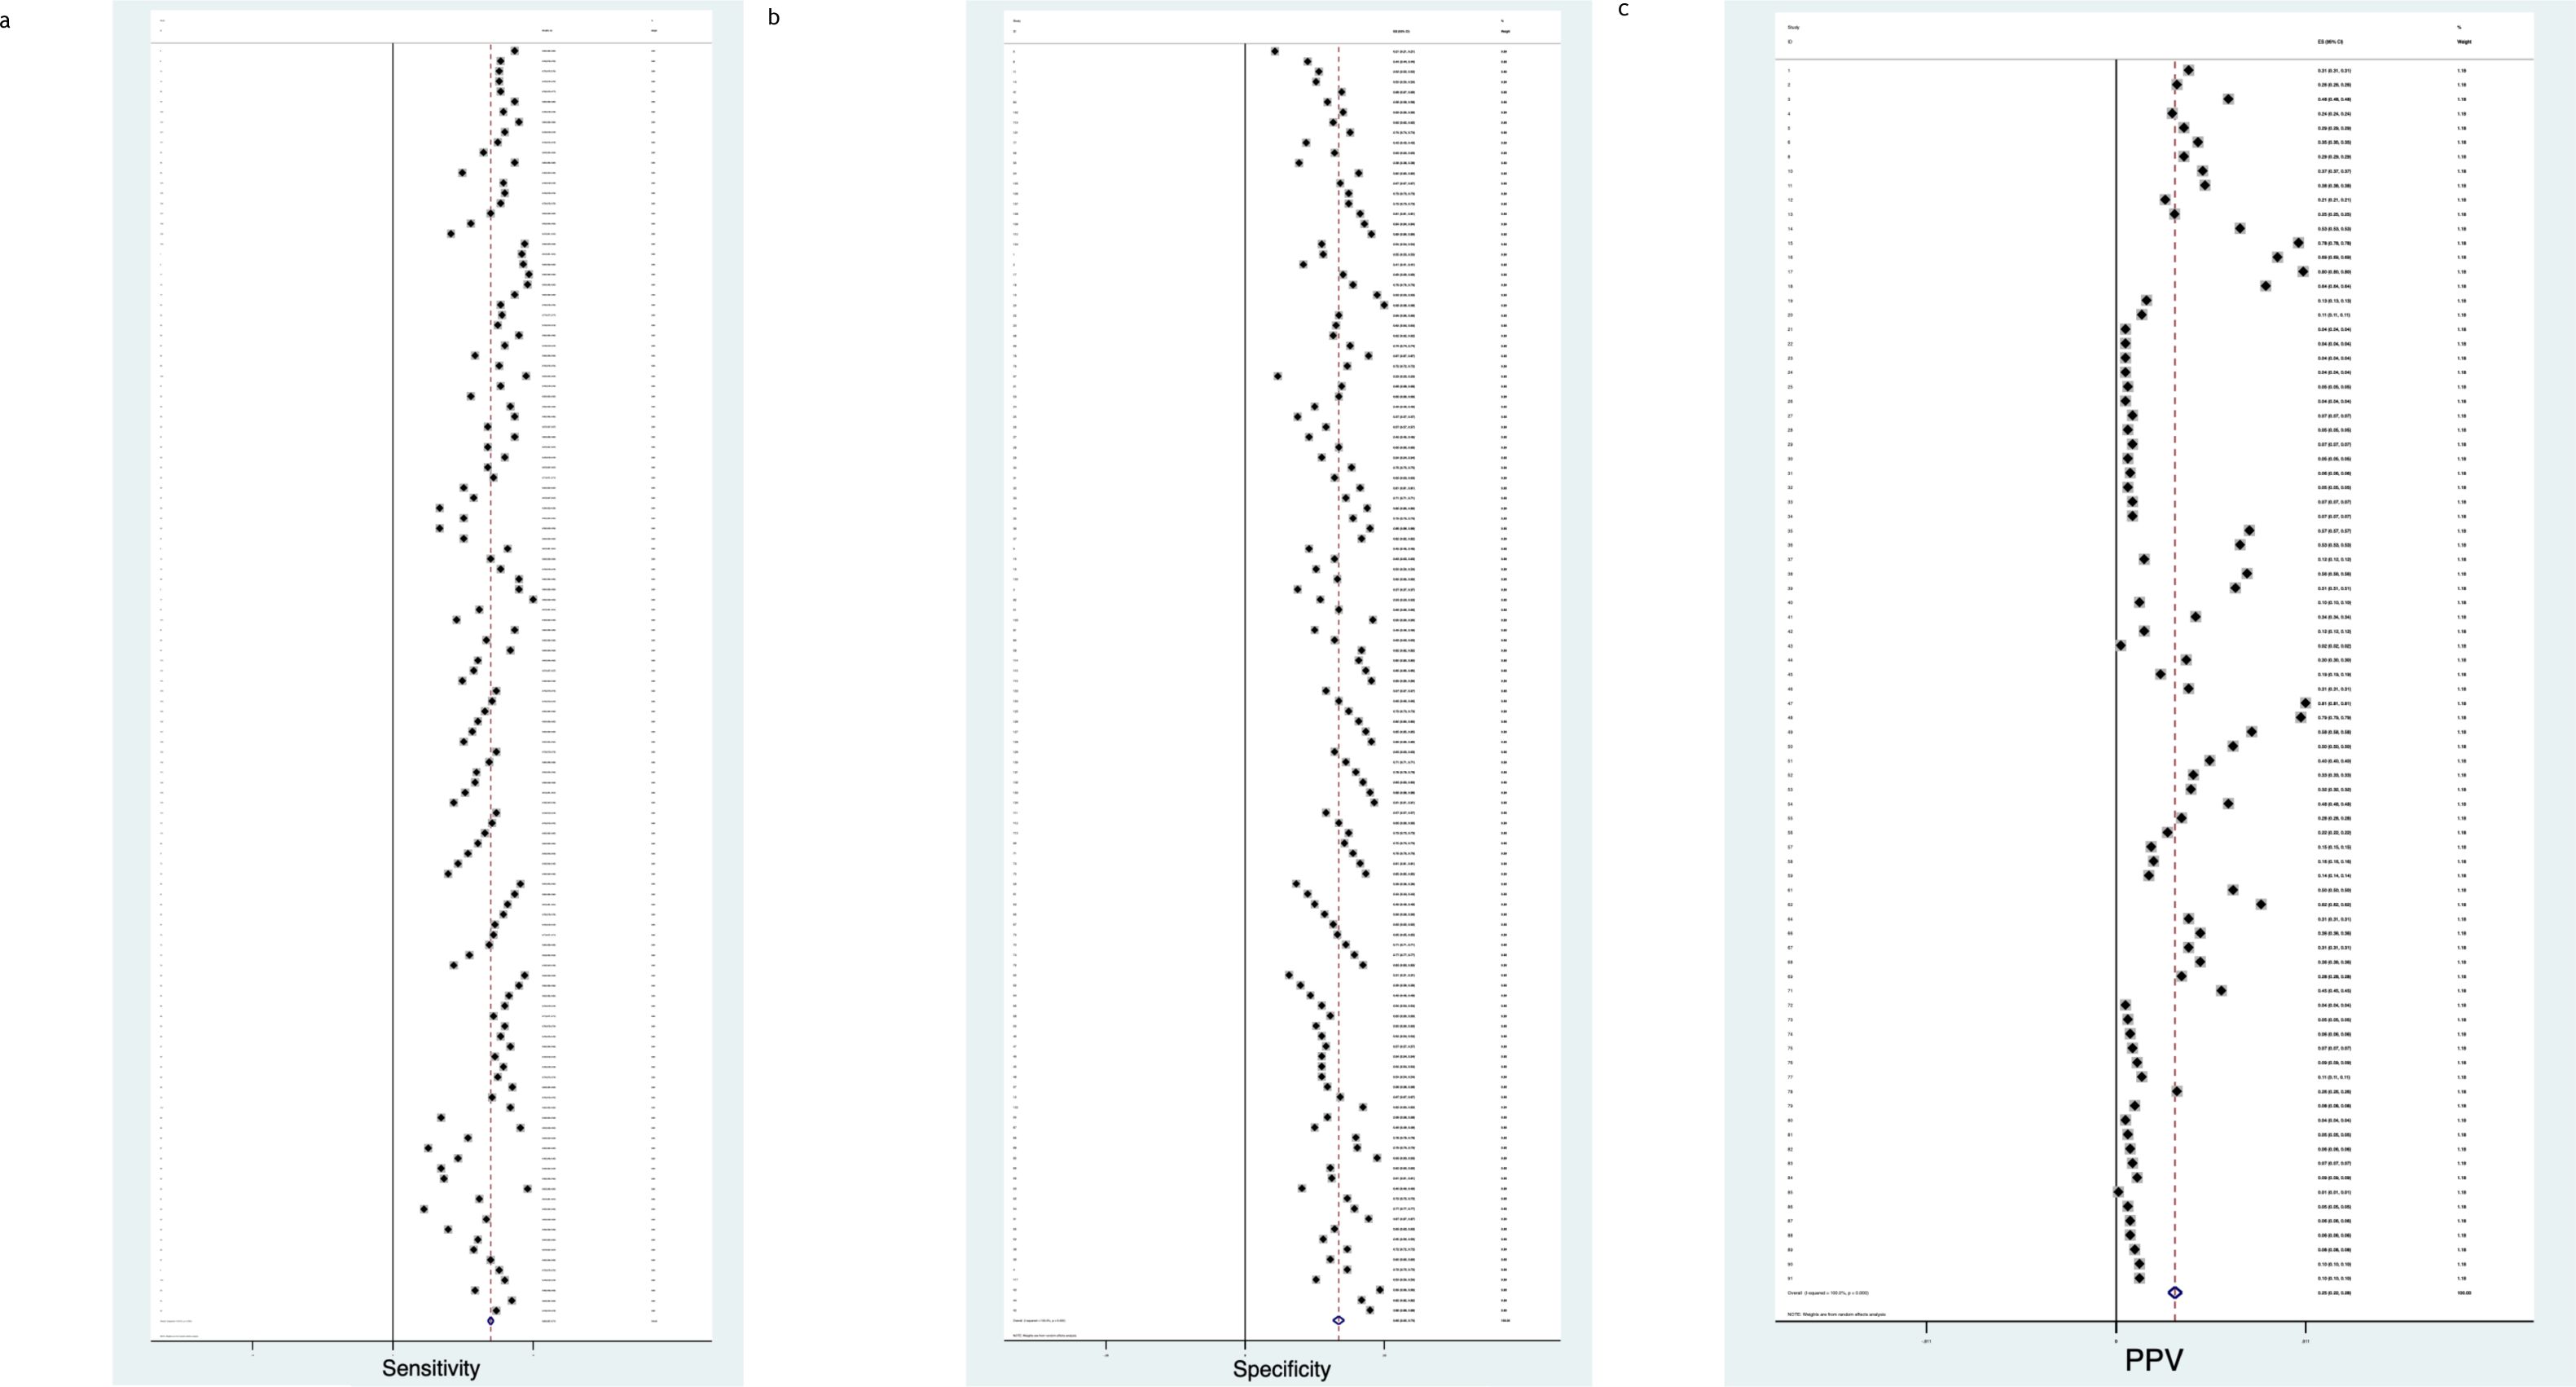
Figure 6. (a) Diabetes sensitivity forest plot. (b) Diabetes specificity forest plot. (c) Diabetes positive predictive value forest plot.
3.3 All cause diabetic disease spectrum
- Sensitivity
When assessing All Cause Diabetic Disease Spectrum risk, the pooled Sensitivity was 0.68 (CI 0.65, 0.7), with a Chi2 heterogeneity 1.6e+09, an I2 variation attributable to heterogeneity 100% and a Tau2 estimate of between-study variance of 0.0156.
- Specificity
When assessing All Cause Diabetic Disease Spectrum risk, the pooled Specificity was 0.66 (CI 0.64, 0.67), with a Chi2 heterogeneity 2.2e+09, an I2 variation attributable to heterogeneity 100% and a Tau2 estimate of between-study variance of 0.0267.
- Positive Predictive Value
When assessing All Cause Diabetic Disease Spectrum risk, the pooled Positive Predictive Value was 0.27 (CI 0.24, 0.30), with a Chi2 heterogeneity 2.2e+09, an I2 variation attributable to heterogeneity 100% and a Tau2 estimate of between-study variance of 0.0193.
Pre Diabetes
Figure 5 describe the meta-analysis for Prediabetes risk, representing 497,240 patients in total.
- Sensitivity
When assessing Prediabetes risk, the pooled Sensitivity was 0.56 (CI 0.48, 0.63) (Figure 5a), with a Chi2 heterogeneity 1.2e+08, an I2 variation attributable to heterogeneity 100% and a Tau2 estimate of between-study variance of 0.0248.
- Specificity
When assessing Prediabetes risk, the pooled Specificity was 0.70 (CI 0.63, 0.77) (Figure 5b), with a Chi2 heterogeneity 1.3e+08, an I2 variation attributable to heterogeneity 100% and a Tau2 estimate of between-study variance of 0.0215.
- Positive Predictive Value
When assessing Prediabetes risk, the pooled Positive Predictive Value was 0.39 (CI 0.32, 0.45) (Figure 5c), with a Chi2 heterogeneity 9.7e+06, an I2 variation attributable to heterogeneity 100% and a Tau2 estimate of between-study variance of 0.0143.
3.3.1 Diabetes
Figure 6 describe the meta-analysis for Diabetes risk, representing 1,696,315 patients in total.
- Sensitivity
When assessing Diabetes risk, the pooled Sensitivity was 0.69 (CI 0.67, 0.71) (Figure 6a), with a Chi2 heterogeneity 6.2e+08, an I2 variation attributable to heterogeneity 100% and a Tau2 estimate of between-study variance of 0.0136.
- Specificity
When assessing Diabetes risk, the pooled Specificity was 0.66 (CI 0.62, 0.70) (Figure 6b), with a Chi2 heterogeneity 1.7e+09, an I2 variation attributable to heterogeneity 100% and a Tau2 estimate of between-study variance of 0.0540.
- Positive Predictive Value
When assessing Diabetes risk, the pooled Positive Predictive Value was 0.25 (CI 0.22, 0.28) (Figure 6c), with a Chi2 heterogeneity 2.1e+09, an I I2 variation attributable to heterogeneity 100% and a Tau2 estimate of between-study variance of 0.0192.
3.4 Prediabetes risk of bias
Amongst the 50 study subgroups which underwent PROBAST (17) ‘risk of bias’ evaluation (Figure 2b), 80% (40/50) studies were found to have some concerns of bias and 20% (10/50) studies were found to have low bias. In the subdomain analysis, concerns of bias were found to be 52% (26/50) in the Participants section, 4% (2/50) in the Predictors section, 58% (29/50) in the Outcome section and 4% (2/50) in the Analysis section. Any discrepancy involved a senior third colleague being consulted. Individual studies which met the inclusion criteria were included in the statistical analysis, with checks included to ensure no duplication of results under analysis.
4 Discussion
We performed a dual domain systematic review to evaluate the accuracy of risk tools to predict cardiovascular morbidity in prehypertension & diabetic morbidity in prediabetes. We found that predictive performance was generally accurate. However, there remain limitations due to confounders and methodological inconsistency, such as timeframe, which undermines comparison. We found that the pooled C statistic for All Cause Cardiovascular Disease was 0.77 (CI 0.71, 0.84) and the Hazard Ratio for All Cause Cardiovascular Disease was 1.55 (CI 1.38, 1.71). When assessing All Cause Diabetic Disease Spectrum risk, the pooled Sensitivity was 0.68 (CI 0.65, 0.7) and the pooled Specificity was 0.66 (CI 0.64, 0.67).
Translation of risk modelling into health systems is challenged by population heterogeneity (85), and the reliability of reporting to enable valid comparison across specific time periods and specific endpoints. Without more consistent standards of data disclosure, academic and commercial communities may begin to polarise to serve private sector interests. However, this could be mitigated by the availability of multivariate, granular data which offers the possibility of a new ‘social contract’ (86) in which artificial intelligence serves digitally literate citizens who retain autonomy of their data. To mitigate against model drift, we need to be able to benchmark model performance using last measurement prediction (87) to facilitate comparisons of the performance from different pools of data. A ‘model-agnostic data-driven deep learning model’ (87) needs to be grounded in a physiological model to provide meaningful, explainable clinical insights. Of note is the success of the AUSDRISK tool for prediabetes screening in primary care, with a >17 score identifying 75% at risk (56). Risk scores provide valuable analysis to direct deployment of limited resources, but there are ongoing debates among health economists to define costs and deployment of preventative treatments (88). In a review of German Primary Care Diabetes and Cardiovascular Risk Scores, automated risk scores were most impactful alongside advanced information retrieval technologies (89), although patient engagement should be quantified as part of health risk in view of the role of self-management in multimorbid chronic disease (90). The optimal integration of machine learning would be the curation of the optimal variables in different populations’ risk score. This would pave the way for bespoke forecasting in ever more precise patient cohorts, with incorporation into established genetic forecasting services.
However, algorithmic fairness is an essential consideration to ensure population risk prediction tools do not exacerbate inequalities. Demographic bias is an important consideration when evaluating risks to the fairness of an algorithm. High heterogeneity and variance between studies undermines the certainty around estimates of diagnostic accuracy. The extensiveness of the heterogeneity precludes directive interpretation from the results of this analysis. Predictive models may improve over time with increased exposure to data, although the literature currently has a trend towards high-income nations, undermining the translation of applications to ‘global south’ nations who may exhibit different disease burdens and health behaviours. There are ongoing ethical concerns in the predictive modelling community regarding diversity and economics (7). It is ethically unacceptable for risk models to only serve the interests of a privileged minority of the global population.
The studies in this dual domain systematic review show substantial variation in accuracy metrics across both cardiovascular & diabetic morbidity, alongside inconsistent reporting preventing sensitivity and specificity comparisons across all studies. Most studies were challenged by inconsistent definitions of the spectrum of diabetic disease and reporting deficiencies. Confidence intervals were intermittently declared. Datasets with homogeneous groupings in specific populations, particular regions and blood glucose ranges, were especially accurate in forecasting prediabetes development. There was significant variation in the number of patients each score was assessed with, distorting the available valid comparison methods. The search strategy led us to scrutinise papers which ultimately, do not all offer what they presented. The inconsistency in predictive score performance, even the same score in different geographies, may be attributable to the context, comorbidities, diet, and recording of local patient characteristics. Predictive scores show promise in supporting clinical decision making but there is inconsistent evidence to inform regulation, best practice, and integration into ‘front line’ healthcare products.
The systematic and safe deployment of risk algorithms into clinical use requires attention paid to policy and governance, as well as technical aspects of data and deployment infrastructure. We propose nine recommendations for policymakers and commissioners, organised under an “A to I” framework.
A) Algorithmic (generalisability)
Predictive performance in these reviews was found to vary across key demographic population subgroups. The inherent differences in patient subpopulations and disease spectrum definitions threatens generalisability and subsequent plans for Personalised Electronic Health Record forecasting. Datasets with homogeneous groupings in specific populations will be especially accurate in forecasting predisease development. Ongoing challenges with heterogenous populations make local context deployment challenging. There are potential benefits to generalisability through the combination of foundation models and electronic health records: better predictive performance & sample efficiency, simple model deployment and effective engagement with multimodal data (91). However, foundation models are complex to deploy, and have unexplored safety challenges.
B) Bias
The impact of risk scores is inconsistent (92) due to bias in training data. Those patients at highest risk of developing diabetes in a time frame of five to ten years are identifiable by predictive scores (93), but the most effective method to improve disability free life expectancy and reduce complications related to metabolic disease will be through earlier intervention at the predisease end of the spectrum. This will not be realised without commercial and academic collaboration in adherence to consistent reporting standards and representative data.
C) Change and quality
A serious challenge to risk scores is performance degradation: once a risk model is deployed, there are a diminishing number of ground truths in the present day for valid comparison, and outcome data that does get collected may be contaminated by the intervention, which presents challenges to retrain the model once drift ensues (94). The new UK federated data platform may enable secure, regional data analytics with greater flexibility for local services (95), however, the new Secure Data Environments may not widen information or population diversity (95).
D) Data source
Relative to fragmented data architecture, ‘data lakes’ (96) enable more reliable training of predictive scores and more consistent reporting patterns in global collaboration on preemptive medicine. Biomarkers are important in the risk stratification for early detection (97), with a notable success of risks scores including the Polygenic Risk Score to predict susceptibility to coronary heart disease and atrial fibrillation, enabling appropriate impact through intervention and lifestyle change (98).
E) Ethics
Evidence from real-world cases (99) needs to be compiled to ensure quality training optimises diagnostic and triage accuracy (100). Further development of transparency and diversity reporting standards, such as the ‘Health sheet’ initiative (101, 102), can help reduce established ethnic inequalities in AI datasets, as per STANDING Together (103). Economic concerns remain in conversations about the potential for insurance systems to discriminate against individuals and families based on their perceived risk profiles.
F) Functionality & ‘explainability’
The expression of disease risk across predisease spectra will be helpful to stratify patients based on their Personal Health Record data. For example, an artificial intelligence for prediction could perform using a scale for hypo- and hyper-glycemia risk, as opposed to arbitrary categories, reflecting the reality of the spectrum of disease (87). The risk profile must be grounded in physiological reality relative to potential deterioration to be useful; we need to be able to explain the disease spectrum to inform intervention.
G) Governance
Leaders with training in computer and medical science are needed to direct EHR predictive modelling technologies. This emphasis on risk scores is economically justified since cardiovascular disease (CVD) risk modelling has been projected to save £68 billion, gain 4.9 million QALYs and prevent 3.4 million CVD cases over 25 years in England (104). This leadership role will require the oversight of new guidelines like STARD-AI and CONSORT-AI (105, 106), to encompass EHR risk scores which use primary care demographics and prescription history, as already applied in Victoria, Australia (107).
H) Humans in the loop
‘Humans In The Loop’ (HITL) are a safety mechanism where experts will review and modify the decision-informing outputs of an algorithmic system. The NHS needs set apart Clinical Informaticians to supervise risk scores in EHRs against multimorbidity, one of the greatest challenges facing modern health services (108). This is especially urgent whilst the burden of CVD in the young is growing (109), and the polygenic risk score only marginally improves coronary heart disease forecasting in young adults (110). HITL clinical specialty pathways will help optimise the deployment of risk scores.
I) Interoperability
Any new risk score capability will need to integrate into legacy technology in health systems. This review found that the importance of subcomponents of a risk score differed according to the population. Set apart Clinical Informaticians are especially important to supervise the application of risk scores which otherwise systematically underestimate risk in particular ethnic, socioeconomic and chronic disease groups (111). False negatives are best mitigated with disease catalogues for underprivileged groups to improve the integration of risk score software into clinical practice (89).
5 Limitations
5.1 Prehypertension
Bias resulted from retrospective studies in which documentation, symptoms and follow up outcomes will vary across geographies. Variance in performance is hard to account for in a cross-sectional study, although there may be improvement in predictive reliability as input data grows in fidelity and volume to characterise forecasted prognosis more accurately. Analysis was undertaken on hypertension diagnosis, stroke, and all cause cardiovascular disease, however, the definitions of these events differed in reporting. The review itself was limited by the short search strategy, despite many duplications showing comprehensive coverage of the relevant material.
5.2 Prediabetes
Studies rarely engaged in external validation and often struggled to demonstrate that the target population was representative. Those scores focusing on prediabetes had a lack of transparency about the cut-off points for defining prediabetes and there was significant variation in the metrics of performance. The studies lacked a reliable method of demonstrating predictive accuracy and did not conduct reports transparently. The review itself was limited by the short search strategy, despite many duplications showing comprehensive coverage of the relevant material.
5 Conclusion
In this systematic review, cardiovascular & diabetic risk tool accuracy prediction varied due to reporting standards but was most valuable in all cause cardiovascular mortality as a useful warning system which could be deployed to an EHR national screening programme. The risk tools are consistent and valuable in predicting hypertensive risk, but there are ongoing concerns about unrepresentative training data. Artificial intelligence may have a role in the curation of variables to build the optimal algorithm for different populations, deployed as an Application Programming Interface in EHRs. However, governance decisions are challenging due to model drift and bias. Further work is needed to characterise the specific time points along the spectrum of cardiovascular & diabetic disease which signify acceleration in clinical deterioration, enabling accurate forecasting.
Data availability statement
The original contributions presented in the study are included in the article/supplementary material. Further inquiries can be directed to the corresponding author.
Author contributions
WW: Data curation, Formal analysis, Investigation, Methodology, Writing – original draft, Writing – review & editing. NT: Formal analysis, Investigation, Methodology, Writing – original draft, Writing – review & editing. JZ: Methodology, Supervision, Writing – original draft, Writing – review & editing. HA: Project administration, Supervision, Validation, Writing – original draft, Writing – review & editing.
Funding
The author(s) declare that financial support was received for the research and/or publication of this article. Covidence Software was used https://www.covidence.org with funding from Imperial Healthcare NHS Trust and Imperial College London. JZ is a Wellcome Trust PhD Fellow grant number 203928/Z/16/Z.
Conflict of interest
HA is Chief Scientific Officer, Preemptive Health and Medicine at Flagship Pioneering.
The remaining authors declare that the research was conducted in the absence of any commercial or financial relationships that could be construed as a potential conflict of interest.
Generative AI statement
The author(s) declare that no Generative AI was used in the creation of this manuscript.
Publisher’s note
All claims expressed in this article are solely those of the authors and do not necessarily represent those of their affiliated organizations, or those of the publisher, the editors and the reviewers. Any product that may be evaluated in this article, or claim that may be made by its manufacturer, is not guaranteed or endorsed by the publisher.
References
1. Holman HR. The relation of the chronic disease epidemic to the health care crisis. ACR Open Rheumatol. (2020) 2:167–73. doi: 10.1002/acr2.11114
2. Available online at: https://www.kidney.org/news/kidneyCare/fall10/Prehypertension (Accessed July 1, 2024).
3. Available online at: https://www.gov.uk/government/publications/health-matters-combating-high-blood-pressure/health-matters-combating-high-blood-pressure (Accessed July 1, 2024).
4. Available online at: https://publichealth.jhu.edu/2022/what-is-prediabetes (Accessed July 1, 2024).
5. Diabetes UK. Preventing the Type 2 diabetes epidemic. Diabetes UK(2014). Available online at: https://www.diabetes.co.uk/prediabetes.html (Accessed July 1, 2024).
6. Foreman KJ, Marquez N, Dolgert A, Fukutaki K, Fullman N, McGaughey M, et al. Forecasting life expectancy, years of life lost, and all-cause and cause-specific mortality for 250 causes of death: reference and alternative scenarios for 2016–40 for 195 countries and territories using data from the Global Burden of Disease Study 2016. Lancet. (2018) 392(10159):2052–90. doi: 10.1016/S0140-6736(18)31694-5
7. Schlesinger N, Fielding B, Wilhelm E, and Pringle N. Where next for healthcare. In: PWC: Health Matters(2021). Available online at: https://www.pwc.com.au/health/health-matters/where-next-for-healthcare.html .
8. Fisher-Grace K, Turk MT, Anthony MK, and Chia LR. Use of personal health records to support diabetes self-management: an integrative review. Comput Inform Nurs. (2021) 39:298–305. doi: 10.1097/CIN.0000000000000682
9. Available online at: https://www.biopharmadive.com/news/digital-health-impact-apps-iqvia-quintiles-report/510250/ (Accessed July 1, 2024).
10. Available online at: https://www.england.nhs.uk/about/equality/equality-hub/national-healthcare-inequalities-improvement-programme/core20plus5/ (Accessed July 1, 2024).
11. Lackland DT. Racial differences in hypertension: implications for high blood pressure management. Am J Med Sci. (2014) 348:135–8. doi: 10.1097/MAJ.0000000000000308
12. Jee C. A biased medical algorithm favored white people for health-care programs. In: MIT Technology Review(2019). Available online at: https://www.technologyreview.com/2019/10/25/132184/a-biased-medical-algorithm-favored-white-people-for-healthcare-programs/ (Accessed July 1, 2024).
13. Available online at: https://www.gov.uk/government/publications/inclusion-health-applying-all-our-health/inclusion-health-applying-all-our-health (Accessed July 1, 2024).
14. Available online at: https://appg-longevity.org/business-for-health (Accessed July 1, 2024).
15. Available online at: https://ourfuturehealth.org.uk/ (Accessed July 1, 2024).
16. Moher D, Liberati A, Tetzlaff J, Altman DG, and PRISMA Group. Preferred reporting terms for systematic reviews and meta-analyses: the PRISMA statement. PLoS Medicine. (2009) 6:e1000097. doi: 10.1371/journal.pmed.1000097
17. Wolff RF, Moons KGM, Riley RD, Whiting PF, Westwood M, Collins GS, et al. PROBAST: A tool to assess the risk of bias and applicability of prediction model studies. Ann Internal Med. (2019) 170:51–8. doi: 10.7326/M18-1376
18. Pringle E, Phillips C, Thijs L, Davidson C, Staessen JA, de Leeuw PW, et al. Systolic blood pressure variability as a risk factor for stroke and cardiovascular mortality in the elderly hypertensive population. J Hypertens. (2003) 21:2251–7. doi: 10.1097/00004872-200312000-00012
19. Liszka HA, Mainous AG 3rd, King DE, Everett CJ, and Egan BM. Prehypertension and cardiovascular morbidity. Ann Fam Med. (2005) 3:294–9. doi: 10.1370/afm.312
20. Tsai SP, Wen CP, Chan HT, Chiang PH, Tsai MK, and Cheng TY. The effects of predisease risk factors within metabolic syndrome on all-cause and cardiovascular disease mortality. Diabetes Res Clin Pract. (2008) 82:148–56. doi: 10.1016/j.diabres.2008.07.016
21. Parikh NI, Pencina MJ, Wang TJ, Benjamin EJ, Lanier KJ, Levy D, et al. A risk score for predicting near-term incidence of hypertension: the Framingham Heart Study. Ann Intern Med. (2008) 148:102–10. doi: 10.7326/0003-4819-148-2-200801150-00005
22. Gupta A, McGlone M, Greenway F, Johnson WD, and Harris M. Prehypertension in disease-free adults: a marker for an adverse cardiometabolic risk profile. Hypertens Res. (2010) 33:905–10. doi: 10.1038/hr.2010.91
23. Shen L, Ma H, Xiang MX, and Wang JA. Meta-analysis of cohort studies of baseline prehypertension and risk of coronary heart disease. Am J Cardiol. (2013) 112:266–71. doi: 10.1016/j.amjcard.2013.03.023
24. Huang Y, Wang S, Cai X, Mai W, Hu Y, Tang H, et al. Prehypertension and incidence of cardiovascular disease: a meta-analysis. BMC Med. (2013) 11:177. doi: 10.1186/1741-7015-11-177
25. Hata J, Nagai A, Hirata M, Kamatani Y, Tamakoshi A, Yamagata Z, et al. Risk prediction models for mortality in patients with cardiovascular disease: The BioBank Japan project. J Epidemiol. (2017) 27:S71–6. doi: 10.1016/j.je.2016.10.007
26. Yue M, Zhang H, and Li R. Meta-analysis on the risk of all-cause mortality and cardiovascular death in the early stage of hypertension. Pak J Pharm Sci. (2016) 29:1343–51. doi: 10.27592484
27. Khosravi A, Gharipour M, Nezafati P, Khosravi Z, Sadeghi M, Khaledifar A, et al. Prehypertension, prediabetes or both: which is best at predicting cardiovascular events in the long term? J Hum Hypertens. (2017) 31:382–7. doi: 10.1038/jhh.2016.42
28. Martínez-Díaz AM, Palazón-Bru A, Folgado-de la Rosa DM, Ramírez-Prado D, Navarro-Juan M, Pérez-Ramírez N, et al. A one-year risk score to predict all-cause mortality in hypertensive inpatients. Eur J Intern Med. (2019) 59:77–83. doi: 10.1016/j.ejim.2018.07.010
29. Manuel DG, Tuna M, Bennett C, Hennessy D, Rosella L, Sanmartin C, et al. Development and validation of a cardiovascular disease risk-prediction model using population health surveys: the Cardiovascular Disease Population Risk Tool (CVDPoRT). CMAJ. (2018) 190:E871–82. doi: 10.1503/cmaj.170914
30. Han M, Li Q, Liu L, et al. Prehypertension and risk of cardiovascular diseases: a meta-analysis of 47 cohort studies. J Hypertens. (2019) 37:2325–32. doi: 10.1097/HJH.0000000000002191
31. Martínez-Díaz AM, Palazón-Bru A, Folgado-de la Rosa DM, Ramírez-Prado D, Llópez-Espinós P, Beneyto-Ripoll C, Zhang D, Ren Y, and Zhao Y. A cardiovascular risk score for hypertensive patients previously admitted to hospital. Eur J Cardiovasc Nurs. (2019) 18:492–500. doi: 10.1177/1474515119845791
32. Chang HY, Fang HL, Huang CY, Chiang CY, Chuang SY, Hsu CC, et al. Developing and validating risk scores for predicting major cardiovascular events using population surveys linked with electronic health insurance records. Int J Environ Res Public Health. (2022) 19:1319. doi: 10.3390/ijerph19031319
33. Vinyoles E, Puig C, Roso-Llorach A, Soldevila N, de la Sierra A, Gorostidi M, et al. Role of ambulatory blood pressure on prediction of cardiovascular disease. A cohort study J Hum Hypertens. (2023) 37:279–85. doi: 10.1038/s41371-022-00679-9
34. Chowdhury MZI, Leung AA, Walker RL, Sikdar KC, O'Beirne M, Quan H, et al. A comparison of machine learning algorithms and traditional regression-based statistical modeling for predicting hypertension incidence in a Canadian population. Sci Rep. (2023) 13:13. doi: 10.1038/s41598-022-27264-x
35. Nicolaisen SK, Thomsen RW, Lau CJ, Sørensen HT, and Pedersen L. Development of a 5-year risk prediction model for type 2 diabetes in individuals with incident HbA1cdefined prediabetes in Denmark. BMJ Open Diabetes Res Care. (2022) 10:e002946. doi: 10.1136/bmjdrc-2022-002946
36. Choi SB, Kim WJ, Yoo TK, Park JS, Chung JW, Lee YH, et al. Screening for prediabetes using machine learning models. Comput Math Methods Med. (2014) 2014:618976. doi: 10.1155/2014/618976
37. Han YM, Yang H, Huang QL, Sun ZJ, Li ML, Zhang JB, et al. Risk prediction of diabetes and prediabetes based on physical examition data. Math Biosci Eng. (2022) 19:3597–608. doi: 10.3934/mbe.2022166
38. Abbas M, Mall R, Errafii K, Lattab A, Ullah E, Bensmail H, et al. Simple risk score to screen for prediabetes: A cross-sectiol study from the Qatar Biobank cohort. J Diabetes Investig. (2021) 12:988–97. doi: 10.1111/jdi.13445
39. Bahijri S, Al-Raddadi R, Ajabnoor G, Jambi H, Al Ahmadi J, Borai A, et al. Dysglycemia risk score in Saudi Arabia: A tool to identify people at high future risk of developing type 2 diabetes. J Diabetes Investig. (2020) 11:844–55. doi: 10.1111/jdi.13213
40. Barengo NC, Tamayo DC, Tono T, and Tuomilehto J. A Colombian diabetes risk score for detecting undiagnosed diabetes and impaired glucose regulation. Prim Care Diabetes. (2017) 11:86–93. doi: 10.1016/j.pcd.2016.09.004
41. Dong W, Tse TYE, Mak LI, Wong CKH, Wan YFE, Tang HME, et al. Non-laboratory-based risk assessment model for case detection of diabetes mellitus and prediabetes in primary care. J Diabetes Investig. (2022) 13:1374–86. doi: 10.1111/jdi.13790
42. Fujiati II, Damanik HA, Bachtiar A, Nurdin AA, and Ward P. Development and validation of prediabetes risk score for predicting prediabetes among Indonesian adults in primary care: Cross-sectiol diagnostic study. Interv Med Appl Sci. (2017) 9:76–85. doi: 10.1556/1646.9.2017.18
43. Gao WG, Dong YH, Pang ZC, n HR, Wang SJ, Ren J, et al. A simple Chinese risk score for undiagnosed diabetes. Diabet Med. (2010) 27:274–81. doi: 10.1111/j.1464-5491.2010.02943.x
44. Gray LJ, Taub NA, Khunti K, Gardiner E, Hiles S, Webb DR, et al. The Leicester Risk Assessment score for detecting undiagnosed Type 2 diabetes and impaired glucose regulation for use in a multiethnic UK setting. Diabet Med. (2010) 27:887–95. doi: 10.1111/j.1464-5491.2010.03037.x
45. Gray LJ, Barros H, Raposo L, Khunti K, Davies MJ, and Santos AC. The development and validation of the Portuguese risk score for detecting type 2 diabetes and impaired fasting glucose. Prim Care Diabetes. (2013) 7:11–8. doi: 10.1016/j.pcd.2013.01.003
46. Handlos LN, Witte DR, Almdal TP, Nielsen LB, Badawi SE, Sheikh ARA, et al. Risk scores for diabetes and impaired glycaemia in the Middle East and North Africa. Diabet Med. (2013) 30:443–51. doi: 10.1111/dme.2013.30.issue-4
47. Henjum S, Hjellset VT, Andersen E, Flaaten M, and Morseth MS. Developing a risk score for undiagnosed prediabetes or type 2 diabetes among Saharawi refugees in Algeria. BMC Public Health. (2022) 22:720. doi: 10.1186/s12889-022-13007-0
48. Memish ZA, Chang JL, Saeedi MY, Al Hamid MA, Abid O, and Ali MK. Screening for type 2 diabetes and dysglycemia in Saudi Arabia: development and validation of risk scores. Diabetes Technol Ther. (2015) 17:693–700. doi: 10.1089/dia.2014.0267
49. Robinson CA, Agarwal G, and Nerenberg K. Validating the CANRISK prognostic model for assessing diabetes risk in Cada’s multi-ethnic population. Chronic Dis Inj Can. (2011) 32:19–31. doi: 10.24095/hpcdp.32.1.04
50. Sadek K, Abdelhafez I, Al-Hashimi I, Al-Shafi W, Tarmizi F, Al-Marri H, et al. Screening for diabetes and impaired glucose metabolism in Qatar: Models’ development and validation. Prim Care Diabetes. (2022) 16:69–77. doi: 10.1016/j.pcd.2021.10.002
51. Stiglic G, Kocbek P, Cilar L, Fijacko N, Stozer A, Zaletel J, et al. Development of a screening tool using electronic health records for undiagnosed Type 2 diabetes mellitus and impaired fasting glucose detection in the Slovenian population. Diabet Med. (2018) 35:640–9. doi: 10.1111/dme.2018.35.issue-5
52. Wang H, Liu T, Qiu Q, Ding P, He YH, and Chen WQ. A simple risk score for identifying individuals with impaired fasting glucose in the Southern Chinese population. Int J Environ Res Public Health. (2015) 12:1237–52. doi: 10.3390/ijerph120201237
53. Jin S, Chen Q, Han X, Liu Y, Cai M, Yao Z, et al. Comparison of the finnish diabetes risk score model with the metabolic syndrome in a shanghai population. Front Endocrinol (Lausanne). (2022) 13:725314. doi: 10.3389/fendo.2022.725314
54. Arrdóttir E, Sigurðardóttir ÁK, Graue M, Kolltveit BH, and Skinner T. Using HbA1c measurements and the Finnish Diabetes Risk Score to identify undiagnosed individuals and those at risk of diabetes in primary care. BMC Public Health. (2023) 23:211. doi: 10.1186/s12889-023-15122-y
55. Agarwal G, Jiang Y, Rogers Van Katwyk S, Lemieux C, Orpa H, Mao Y, et al. Effectiveness of the CANRISK tool in the identification of dysglycemia in First tions and Métis in Cada. Health Promot Chronic Dis Prev Can. (2018) 38:55–63. doi: 10.24095/hpcdp.38.2.02
56. Fleming K, Weaver N, Peel R, Hure A, McEvoy M, Holliday E, et al. Using the AUSDRISK score to screen for prediabetes and diabetes in GP practices: a case-finding approach. Aust N Z J Public Health. (2022) 46:203–7. doi: 10.1111/1753-6405.13181
57. Mugume IB, Wafula ST, Kadengye DT, and Van Olmen J. Performance of a Finnish Diabetes Risk Score in detecting undiagnosed diabetes among Kenyans aged 18–69 years. PloS One. (2023) 18:e0276858. doi: 10.1371/jourl.pone.0276858
58. Ephraim RKD, Owusu VB, Asiamah J, Mills A, Abaka-Yawson A, Kpene GE, et al. Predicting type 2 diabetes mellitus among fishermen in Cape Coast: a comparison between the FINDRISC score and the metabolic syndrome. J Diabetes Metab Disord. (2020) 19:1317–24. doi: 10.1007/s40200-020-00650-w
59. Chen X, Wu Z, Chen Y, Wang X, Zhu J, Wang N, et al. Risk score model of type 2 diabetes prediction for rural Chinese adults: the Rural Deqing Cohort Study. J Endocrinol Invest. (2017) 40:1115–23. doi: 10.1007/s40618-017-0680-4
60. Gomez-Arbelaez D, Alvarado-Jurado L, Ayala-Castillo M, Forero-ranjo L, Camacho PA, and Lopez-Jaramillo P. Evaluation of the Finnish Diabetes Risk Score to predict type 2 diabetes mellitus in a Colombian population: A longitudil observatiol study. World J Diabetes. (2015) 6:1337–44. doi: 10.4239/wjd.v6.i17.1337
61. Silvestre MP, Jiang Y, Volkova K, Chisholm H, Lee W, and Poppitt SD. Evaluating FINDRISC as a screening tool for type 2 diabetes among overweight adults in the PREVIEW : NZ cohort. Prim Care Diabetes. (2017) 11:561–9. doi: 10.1016/j.pcd.2017.07.003
62. Zhang Y, Hu G, Zhang L, Mayo R, and Chen L. A novel testing model for opportunistic screening of prediabetes and diabetes among U.S. adults. PloS One. (2015) 10:e0120382. doi: 10.1371/jourl.pone.0120382
63. Mao T, Chen J, Guo H, Qu C, He C, Xu X, et al. The efficacy of new chinese diabetes risk score in screening undiagnosed type 2 diabetes and prediabetes: A community-based cross-sectiol study in Eastern Chi. J Diabetes Res. (2020) 2020:7463082. doi: 10.1155/2020/7463082
64. Zheng M, Wu S, Chen S, Zhang X, Zuo Y, Tong C, et al. Development and validation of risk prediction models for new-onset type 2 diabetes in adults with impaired fasting glucose. Diabetes Res Clin Pract. (2023) 197:110571. doi: 10.1016/j.diabres.2023.110571
65. Lim HM, Chia YC, and Koay ZL. Performance of the Finnish Diabetes Risk Score (FINDRISC) and Modified Asian FINDRISC (ModAsian FINDRISC) for screening of undiagnosed type 2 diabetes mellitus and dysglycaemia in primary care. Prim Care Diabetes. (2020) 14:494–500. doi: 10.1016/j.pcd.2020.02.008
66. Meijnikman AS, De Block CEM, Verrijken A, Mertens I, and Van Gaal LF. Predicting type 2 diabetes mellitus: a comparison between the FINDRISC score and the metabolic syndrome. Diabetol Metab Syndr. (2018) 10:12. doi: 10.1186/s13098-018-0310-0
67. Li CI, Chien L, Liu CS, Lin W-Y, Lai M-M, Lee C-C, et al. Prospective validation of American Diabetes Association risk tool for predicting prediabetes and diabetes in Taiwan-Taichung community health study. PloS One. (2011) 6:e25906. doi: 10.1371/jourl.pone.0025906
68. Jahangiry L, Shamizadeh T, Sarbakhsh P, Abbasalizad Farhangi M, and Ponnet K. Diagnostic validity of the prediabetes scale among at-risk rural Iranian adults for screening for prediabetes. J Diabetes Metab Disord. (2020) 19:823–8. doi: 10.1007/s40200-020-00568-3
69. Fu Q, Sun M, Tang W, Liao Z, Zhao X, and Wang L. A Chinese risk score model for identifying postprandial hyperglycemia without oral glucose tolerance test. Diabetes Metab Res Rev. (2014) 30:284–90. doi: 10.1002/dmrr.2490
70. Poltavskiy E, Kim DJ, and Bang H. Comparison of screening scores for diabetes and prediabetes. Diabetes Res Clin Pract. (2016) 118:146–53. doi: 10.1016/j.diabres.2016.06.022
71. Shdaifat AA, Khader Y, Al Hyari M, Shatwi O, and Bat M. Adapting diabetes risk scores for Jordan. Int J Gen Med. (2021) 14:4011–6. doi: 10.2147/IJGM.S321063
72. Jiang Y, Rogers Van Katwyk S, Mao Y, Orpana H, Agarwal G, de Groh M, et al. Assessment of dysglycemia risk in the Kitikmeot region of Nuvut: using the CANRISK tool. Évaluation du risque de dysglycémie dans la région de Kitikmeot (Nuvut) au moyen de l’outil CANRISK. Health Promot Chronic Dis Prev Can. (2017) 37:114–22. doi: 10.24095/hpcdp.37.4.02
73. Barriga KJ, Hamman RF, Hoag S, Marshall JA, and Shetterly SM. Population screening for glucose intolerant subjects using decision tree alyses. Diabetes Res Clin Pract. (1996) 34 Suppl:S17–29. doi: 10.1016/S0168-8227(96)01300-9
74. Heikes KE, Eddy DM, Arondekar B, and Schlessinger L. Diabetes Risk Calculator: a simple tool for detecting undiagnosed diabetes and prediabetes. Diabetes Care. (2008) 31:1040–5. doi: 10.2337/dc07-1150
75. Hische M, Luis-Dominguez O, Pfeiffer AF, Schwarz PE, Selbig J, and Spranger J. Decision trees as a simple-to-use and reliable tool to identify individuals with impaired glucose metabolism or type 2 diabetes mellitus. Eur J Endocrinol. (2010) 163:565–71. doi: 10.1530/EJE-10-0649
76. Xin Z, Yuan J, Hua L, Ma Y-H, Zhao L, Lu Y, et al. A simple tool detected diabetes and prediabetes in rural Chinese. J Clin Epidemiol. (2010) 63:1030–5. doi: 10.1016/j.jclinepi.2009.11.012
77. Yonel Z, Kocher T, Chapple ILC, Dietrich T, Völzke H, Nauck M, et al. Development and external validation of a multivariable prediction model to identify nondiabetic hyperglycemia and undiagnosed type 2 diabetes: diabetes risk assessment in dentistry score (DDS). J Dent Res. (2023) 102:170–7. doi: 10.1177/00220345221129807
78. Mavrogianni C, Lambrinou CP, Androutsos O, Lindström J, Kivelä J, Cardon G, et al. Evaluation of the Finnish Diabetes Risk Score as a screening tool for undiagnosed type 2 diabetes and dysglycaemia among early middle-aged adults in a large-scale European cohort. The Feel4Diabetes-study. Diabetes Res Clin Pract. (2019) 150:99–110. doi: 10.1016/j.diabres.2019.02.017
79. Nieto-Martínez R, González-Rivas JP, Ugel E, Marulanda MI, Durán M, Mechanick JI, et al. External validation of the Finnish diabetes risk score in Venezuela using a tiol sample: The EVESCAM. Prim Care Diabetes. (2019) 13:574–82. doi: 10.1016/j.pcd.2019.04.006
80. Abdallah M, Sharbaji S, Sharbaji M, Daher Z, Faour T, Mansour Z, et al. Diagnostic accuracy of the Finnish Diabetes Risk Score for the prediction of undiagnosed type 2 diabetes, prediabetes, and metabolic syndrome in the Lebanese University. Diabetol Metab Syndr. (2020) 12:84. doi: 10.1186/s13098-020-00590-8
81. Sengupta B and Bhattacharjya H. Validation of Indian diabetes risk score for screening prediabetes in west tripura district of India. Indian J Community Med. (2021) 46:30–4. doi: 10.4103/ijcm.IJCM_136_20
82. Bhowmik B, Diep LM, Munir SB, Rahman M, Wright E, Mahmood S, et al. HbA(1c) as a diagnostic tool for diabetes and prediabetes: the Bangladesh experience. Diabetes Med. (2013) 30:e70–7. doi: 10.1111/dme.12088
83. Rajput R, Garg K, and Rajput M. Prediabetes Risk Evaluation Scoring System [PRESS]: A simplified scoring system for detecting undiagnosed Prediabetes. Prim Care Diabetes. (2019) 13:11–5. doi: 10.1016/j.pcd.2018.11.011
84. Zhang R, Wang J, Luo J, Yang X, Yang R, Cai D, et al. Cutoff value of HbA1c for predicting diabetes and prediabetes in a Chinese high risk population aged over 45. Asia Pac J Clin Nutr. (2015) 24:360–6. doi: 10.6133/apjcn.2015.24.3.14
85. Ng R, Sutradhar R, Kornas K, Wodchis WP, Sarkar J, Fransoo R, et al. Development and validation of the chronic disease population risk tool (CDPoRT) to predict incidence of adult chronic disease. JAMA Netw Open. (2020) 3:e204669. doi: 10.1001/jamanetworkopen.2020.4669
86. Ashrafian H. Engineering a social contract: Rawlsian distributive justice through algorithmic game theory and artificial intelligence. AI Ethics. (2023) 3:1447–54. doi: 10.1007/s43681-022-00253-6
87. Toledo-Marín JQ, Ali T, van Rooij T, Görges M, and Wasserman WW. Prediction of blood risk score in diabetes using deep neural networks. J Clin Med. (2023) 12:1695. doi: 10.3390/jcm12041695
88. Bartels K, Lobato RL, and Bradley CJ. Risk scores to improve quality and realize health economic gains in perioperative care. Anesth Analg. (2021) 133:606–9. doi: 10.1213/ANE.0000000000005563
89. Heider AK and Mang H. Integration of risk scores and integration capability in electronic patient records. Appl Clin Inform. (2022) 13:828–35. doi: 10.1055/s-0042-1756367
90. Simmons LA, Wolever RQ, Bechard EM, and Snyderman R. Patient engagement as a risk factor in personalized health care: a systematic review of the literature on chronic disease. Genome Med. (2014) 6:16. doi: 10.1186/gm533
91. Wornow M, Xu Y, Thapa R, Patel B, Steinberg E, Fleming S, et al. The shaky foundations of large language models and foundation models for electronic health records. NPJ Digit Med. (2023) 6:135. doi: 10.1038/s41746-023-00879-8
92. Studziński K, Tomasik T, Krzysztoń J, Jóźwiak J, and Windak A. Effect of using cardiovascular risk scoring in routine risk assessment in primary prevention of cardiovascular disease: an overview of systematic reviews. BMC Cardiovasc Disord. (2019) 19:11. doi: 10.1186/s12872-018-0990-2
93. Abbasi A, Peelen LM, Corpeleijn E, van der Schouw YT, Stolk RP, Spijkerman AM, et al. Prediction models for risk of developing type 2 diabetes: systematic literature search and independent external validation study. BMJ (Clinical Res ed.). (2012) 345:e5900. doi: 10.1136/bmj.e5900
94. Available online at: https://www.statnews.com/2023/10/10/the-model-eat-model-world-of-clinical-ai-how-predictive-power-becomes-a-pitfall/ (Accessed July 1, 2024).
95. Zhang J, Morley J, Galligant J, Oddy C, Teo JT, Ashrafian H, et al. Mapping and evaluating national data flows: transparency, privacy, and guiding infrastructural transformation. Lancet Digital Health. (2023) 392(10159):2052–90. doi: 10.1016/S2589-7500(23)00157-7
96. Goldacre B and Morley J. Better, Broader, Safer: Using health data for research and analysis. A review commissioned by the Secretary of State for Health and Social Care. London: Department of Health and Social Care, UK Government. Available at: https://www.gov.uk/government/publications/better-broader-safer-using-health-data-for-research-and-analysis (Accessed July 1, 2024).
97. Mohd Faizal AS, Thevarajah TM, Khor SM, and Chang SW. A review of risk prediction models in cardiovascular disease: conventional approach vs. artificial intelligent approach. Comput Methods Programs Biomed. (2021) 207:106190. doi: 10.1016/j.cmpb.2021.106190
98. Mars N, Koskela JT, Ripatti P, Kiiskinen TTJ, Havulinna AS, Lindbohm JV, et al. Polygenic and clinical risk scores and their impact on age at onset and prediction of cardiometabolic diseases and common cancers. Nat Med. (2020) 26:549–57. doi: 10.1038/s41591-020-0800-0
99. El-Osta A, Webber I, Alaa A, Bagkeris E, Mian S, and Sharabiani M. What is the suitability of clinical vignettes in benchmarking the performance of online symptom checkers? An audit study. BMJ Open. (2022) 12:e053566. doi: 10.1136/bmjopen-2021-053566
100. Larrazabal AJ, Nieto N, Peterson V, Milone DH, and Ferrante E. Gender imbalance in medical imaging datasets produces biased classifiers for computer-aided diagnosis. Proc Natl Acad Sci USA. (2020) 117:12592–4. doi: 10.1073/pnas.1919012117
101. Gebru T, Morgenstern J, Vecchione B, Vaughan JW, Wallach H, Iii HD, et al. Datasheets for datasets. Commun ACM. (2021) 64:86–92. doi: 10.1145/3458723
102. Rostamzadeh N, Mincu D, Roy S, Smart A, Wilcox L, Pushkarna M, et al. Healthsheet: development of a transparency artifact for health datasets. J ACM. (2022) 37:29. doi: 10.1145/3531146
103. STANDING Together Working Group. STANDING together(2022). Available online at: https://www.datadiversity.org/ (Accessed July 1, 2024).
104. Thomas C, Brennan A, Goka E, Squires HY, Brenner G, Bagguley D, et al. What are the cost-savings and health benefits of improving detection and management for six high cardiovascular risk conditions in England? An economic evaluation. BMJ Open. (2020) 10:e037486. doi: 10.1136/bmjopen-2020-037486
105. Sounderajah V, Ashrafian H, Aggarwal R, De Fauw J, Denniston AK, Greaves F, et al. Developing specific reporting guidelines for diagnostic accuracy studies assessing AI interventions: The STARD-AI Steering Group. Nat Med. (2020) 26:807–8. doi: 10.1038/s41591-020-0941-1
106. Liu X, Cruz Rivera S, Moher D, Calvert MJ, Denniston AK, on behalf of the SPIRIT-AI and CONSORT-AI Working Group, et al. Reporting guidelines for clinical trial reports for interventions involving artificial intelligence: the CONSORT-AI extension. Nat Med. (2020) 26:1364–74. doi: 10.1038/s41591-020-1034-x
107. Khanna S, Rolls DA, Boyle J, Xie Y, Jayasena R, Hibbert M, et al. A risk stratification tool for hospitalisation in Australia using primary care data. Sci Rep. (2019) 9:5011. doi: 10.1038/s41598-019-41383-y
108. Pearson-Stuttard J, Ezzati M, and Gregg EW. Multimorbidity-a defining challenge for health systems. Lancet Public Health. (2019) 4:e599–600. doi: 10.1016/S2468-2667(19)30222-1
109. Clark CJ, Alonso A, Spencer RA, Pencina M, Williams K, and Everson-Rose SA. Predicted long-term cardiovascular risk among young adults in the national longitudinal study of adolescent health. Am J Public Health. (2014) 104:e108–15. doi: 10.2105/AJPH.2014.302148
110. Khan SS, Page C, Wojdyla DM, Schwartz YY, Greenland P, and Pencina MJ. Predictive utility of a validated polygenic risk score for long-term risk of coronary heart disease in young and middle-aged adults. Circulation. (2022) 146:587–96. doi: 10.1161/CIRCULATIONAHA.121.058426
111. Lloyd-Jones DM, Braun LT, Ndumele CE, Smith SC Jr., Sperling LS, Virani SS, et al. Use of risk assessment tools to guide decision-making in the primary prevention of atherosclerotic cardiovascular disease: A special report from the american heart association and american college of cardiology. J Am Coll Cardiol. (2019) 73:3153–67. doi: 10.1016/j.jacc.2018.11.005
Keywords: prehypertension, prediabetes, diabetic morbidity, cardiovascular disease, screening
Citation: Waldock WJ, Tekkis N, Zhang J and Ashrafian H (2025) A dual domain systematic review and meta-analysis of risk tool accuracy to predict cardiovascular morbidity in prehypertension and diabetic morbidity in prediabetes. Front. Endocrinol. 16:1527092. doi: 10.3389/fendo.2025.1527092
Received: 12 November 2024; Accepted: 23 June 2025;
Published: 22 July 2025.
Edited by:
Gaetano Santulli, Albert Einstein College of Medicine, United StatesReviewed by:
Bidita Khandelwal, Sikkim Manipal University, IndiaDafeng Liu, Public Health and Clinical Center of Chengdu, China
Copyright © 2025 Waldock, Tekkis, Zhang and Ashrafian. This is an open-access article distributed under the terms of the Creative Commons Attribution License (CC BY). The use, distribution or reproduction in other forums is permitted, provided the original author(s) and the copyright owner(s) are credited and that the original publication in this journal is cited, in accordance with accepted academic practice. No use, distribution or reproduction is permitted which does not comply with these terms.
*Correspondence: Hutan Ashrafian, aHV0YW5AaWMuYWMudWs=
†ORCID: William J. Waldock, orcid.org/0000-0003-3283-4096
Hutan Ashrafian, orcid.org/0000-0003-1668-0672