 Nur K. Abdul Jafar1
 Afra Al Balushi2
 Anuradhaa Subramanian3
 Siang Ing Lee3
 Christie J. Bennett4
 Lisa J. Moran1
 Aya Mousa1
 Chau Thien Tay1
 Helena J. Teede1
 Darren R. Mansfield2*†
- 1Monash Centre for Health Research and Implementation, Monash University, Clayton, VIC, Australia
- 2Monash Lung and Sleep, Monash Health, Clayton, VIC, Australia
- 3Department of Applied Health Sciences, University of Birmingham, Birmingham, United Kingdom
- 4Be Active Sleep and Eat (BASE) Facility, Department of Nutrition, Dietetics and Food, Monash University, Notting Hill, VIC, Australia
Background: Polycystic ovary syndrome (PCOS) has been associated with a high prevalence of obstructive sleep apnea syndrome (OSAS). However, the impact of OSAS on the PCOS symptom profile remains unclear. This systematic review and meta-analysis, which informed the 2023 International Evidence-based PCOS Guideline, aims to assess the prevalence and related symptoms of OSAS among females with and without PCOS.
Methods: A systematic search using databases (MEDLINE, Embase, EBM Reviews, PsycInfo and CINAHL) was performed until 16th May 2024. Random-effects restricted maximum likelihood meta-analyses compared OSAS and related symptoms between PCOS and non-PCOS groups. OSAS outcomes were categorized as apnea-hypopnea index (AHI)≥5 only, AHI≥5 with symptoms, AHI≥10 with symptoms and composite OSA (i.e., all AHI cut-offs with and/or without symptoms). Subgroup analyses by body mass index (BMI), age, PCOS diagnostic criteria and ethnicity were performed. Risk of bias and certainty of evidence by the Grading of Recommendations, Assessment, Development and Evaluation (GRADE) framework were conducted.
Results: From 4438 records, 3205 titles/abstracts were screened and 40 were eligible for full-text screening. Eight cross-sectional studies met inclusion criteria and meta-analysis. The pooled prevalence of OSA was 37.0% in PCOS (29.0% adolescents; 40.0% adults) and 6.0% in non-PCOS. Compared with non-PCOS, those with PCOS showed higher risk for composite OSA (odds ratio (OR): 9.52; 95% CI: 3.90 to 23.26; I2 = 54.5%; 8 studies, n=942; P<0.001) and more pronounced OSAS risk with increasing symptom severity in PCOS (AHI≥5 OR: 3.90; 95% CI: 1.63 to 9.34; AHI≥5 with symptoms OR: 17.95; 95% CI: 6.17 to 52.22; AHI≥10 with symptoms OR: 30.61; 95% CI: 7.99 to 117.25, all P ≤ 0.0023). Subgroup results showed significantly higher risk of OSAS overall in overweight/obesity, adults and white ethnicity compared with normal weight, adolescent and Asian subgroups, respectively (all P<0.001), but independent of PCOS diagnostic criteria.
Conclusion: The prevalence of OSA was higher in PCOS compared with non-PCOS groups, with the risk of OSAS increasing with worse symptom severity. Adults and those of higher BMI and of white ethnicity were at increased risk of OSAS. Hence, identifying and treating OSAS symptoms in PCOS may be beneficial, but further validation of findings is warranted.
1 Introduction
Polycystic ovary syndrome (PCOS) is the most common endocrine disorder, affecting up to 13% of reproductive-aged women (1). It is associated with a range of reproductive, metabolic and psychological sequelae (2, 3). Diagnosis of PCOS in adults is based on the presence of two of three features: (i) oligo/amenorrhea; (ii) clinical/biochemical hyperandrogenism and/or (iii) polycystic ovary morphology (4) or elevated serum anti-Müllerian hormone levels, according to the latest 2023 International Evidence-based PCOS Guideline (1). The key pathophysiological drivers of PCOS include hyperandrogenism and intrinsic insulin resistance that is mechanistically distinct from obesity-associated insulin resistance (5, 6).
Several of these pathophysiological risk factors in women with PCOS have been theoretically linked to obstructive sleep apnea (OSA) (7, 8). OSA is characterized by the repetitive collapse of the upper airway during sleep for at least 10 seconds, and associated with oxygen desaturation and/or arousal from sleep (9). Additionally, obstructive sleep apnea syndrome (OSAS) is defined as OSA (apnea-hypopnea index (AHI) ≥5 events per hour) together with features of sleep disturbances, such as excessive daytime sleepiness and/or cardiometabolic comorbidities (e.g., arterial hypertension) (10–12). OSAS and associated snoring is the most common sleep-disordered breathing abnormality (12). In the general population and in PCOS, OSAS has been associated with multiple comorbidities such as obesity, insulin resistance, gestational diabetes, type 2 diabetes, hypertension, and impaired quality of life (12–14). Furthermore, cardiometabolic risk factors such as chronic inflammation, oxidative stress, and impaired fibrinolysis are elevated in PCOS (1) that can lead to higher risk of OSAS.
Past cross-sectional studies have shown that OSAS is highly prevalent in women with PCOS (15–19) compared with the general population of reproductive-aged women (17-75% vs. 9-28%) (9, 10), with lower rates in adolescents with PCOS (0-57%) (20, 21). Previous systematic reviews have also reported higher risk of OSA in PCOS relative to those without PCOS, but this varies between the odds ratios (ORs) of 2.86 and 8.30 (22–26). The highly variable OSA prevalence rates in past reviews relate to the heterogenous measurements, including polysomnography (PSG), cardiorespiratory polygraph and screening questionnaires (e.g., Berlin Questionnaire) (22–26). One recent review also included studies that did not report OSA measurements (26). Indeed, formal sleep studies using PSG assessments are essential for accurate OSA prevalence estimates (11). The wide risk estimates reported in prior reviews are also attributed to the inconsistent study inclusion and exclusion criteria employed, with some including conference abstracts and grey literature (23, 26) and others limiting searches to only peer-reviewed and database-indexed articles (22, 24–26).
To date, there has been no quantitative synthesis of the available evidence linking OSAS and related symptoms with PCOS status. Further, important confounders which may influence this relationship, including body mass index (BMI), age, PCOS diagnostic criteria, and ethnicity, have not been thoroughly interrogated. Higher BMI in adults can lead to physiological changes that contribute to OSA development through accumulation of fat deposits in the upper respiratory tract, thereby narrowing the airway and decreasing muscle activity in this region (7). Some studies however, reported higher prevalence of OSA irrespective of BMI in PCOS, raising the possibility that body fat distribution rather than total body mass may be more useful in determining OSAS risk in PCOS or that other factors may contribute to this association (8, 27, 28). Racial and ethnic disparities in PCOS phenotypes and in OSA diagnosis have also been reported, and may be related to genetic inheritance or health inequities or both (29).
To address these important gaps, we conducted the first systematic review and meta-analysis to comprehensively synthesize the prevalence and related symptoms of OSAS severity in PCOS compared with non-PCOS populations, with inclusion of peer-reviewed published studies that utilized the PSG tool. The methodology applied for this evidence synthesis was aligned with the 2023 International Evidence-based PCOS Guideline (1), which directly informed current recommendations for assessing OSAS in PCOS.
2 Methods
2.1 Protocol and registration
The protocol was registered a priori on the international prospective register of systematic reviews, PROSPERO (CRD42024508308), and reported in accordance with the Preferred Reporting Items for Systematic Reviews and Meta-Analyses (PRISMA) guidelines (30).
2.2 Eligibility criteria and search strategy
Eligibility criteria using the Population-Exposure-Comparator-Outcome-Study design (PECOS) framework (Supplementary Table 1) were developed in collaboration with the 2023 International PCOS Guideline expert group (1). Studies included were: 1) females of any age, ethnicity, weight and comorbidities (e.g., infertility); 2) had clinically-confirmed diagnosis of PCOS (Rotterdam criteria, National Institutes of Health (NIH) definition or Androgen Excess and PCOS Society (AES) definition); 3) inclusion of a control group without PCOS and 4) used formal sleep studies (i.e., Level 1 (in-laboratory PSG); Level 2 (ambulatory or home-based PSG); or Level 3 (ambulatory limited channel PSG or polygraph)) (11). Eligible study designs included cohort studies (e.g., case-control, controlled cross-sectional) and randomized controlled trial (RCT) studies. Included studies were not restricted by language and year of publication. Other systematic reviews were included initially for screening references to identify additional eligible studies. Studies with self-reported PCOS diagnosis, with other population groups, without a control (non-PCOS) group or without formal sleep study assessments were excluded. Electronic databases MEDLINE, Embase, Evidence-Based Medicine (EBM) Reviews, PsycInfo (all via Ovid) and CINAHL (via EBSCO) were initially searched up to 2nd August 2022 to inform the 2023 PCOS Guideline recommendations (1), with a search update on 16th May 2024 for publication. The search strategy was developed by PCOS guideline development group experts in conjunction with the guideline evidence team (AM, CTT) and co-authors (AS, SL) (Supplementary Table 2).
2.3 OSAS related symptoms
The presence of symptoms related to OSAS often referred to daytime sleepiness, measured using the validated Epworth Sleepiness Scale (ESS) questionnaire. Using ESS, participants were asked to rate their probability of falling asleep in eight different situations on a scale of 0 (not likely at all) to 3 (extremely likely) (31). Other symptoms related to OSAS include, but not limited to sleep-related complaints (21), choking, witnessed apneic spell, nocturia and hypertension or other cardiovascular complication (16, 18).
2.4 Study selection
Screening was undertaken using Covidence (http://www.covidence.org). Duplicates were automatically removed by Covidence, otherwise manually removed by two reviewers (AS, SL, NAJ or AA). Title, abstract and full text screening were conducted in duplicate by two independent reviewers (AS, SL, NAJ or AA) and any disagreement was resolved by a third reviewer (DM), with discussion to reach consensus, where necessary.
2.5 Data extraction
Data extraction from each full-text article was completed by one reviewer (NAJ, AS or SL) with independent cross-checking by two reviewers for each article (AA, AS or SL) to ensure accuracy. Using a standardized data extraction template, the following information was extracted from studies: author, year of publication, country of origin, study design, sample size, population characteristics, setting, age, BMI, method of PCOS diagnosis, prevalence and effect estimates, measurements of OSAS severity, outcomes and confounders (e.g., ethnicity).
2.6 Quality assessment and GRADE assessment
The quality of the included studies was independently assessed by two reviewers (AS, SL). As no RCTs were identified, quality appraisal was conducted using templates adapted from the Risk Of Bias In Non-randomized Studies of Interventions (ROBINS-I) tool (32). This included assessment of internal validity based on selection bias, performance bias, attrition bias, confounding and other bias (e.g., statistical analysis). Using these criteria, each included study was allocated an overall risk of bias rating of low, moderate or high. The certainty of evidence was independently assessed by two reviewers (AS, SL) using the Grading of Recommendations, Assessment, Development, and Evaluation (GRADE) framework. This was conducted in accordance with the Cochrane GRADE guidelines and recommendations for outcome-level assessment of risk of bias, inconsistency, indirectness, imprecision and other bias such as publication bias (33).
2.7 Statistical analysis
The prevalence estimates of OSA (i.e., all AHI cut-offs with and/or without symptoms) were pooled from the included studies for meta-analysis and presented as forest plots of proportions and 95% confidence intervals (CIs) for PCOS and non-PCOS using random effect models. Meta-analyses were conducted separately for each symptom category of OSAS outcome (Composite OSA, AHI ≥5 only, AHI ≥5 with symptoms and AHI ≥10 with symptoms) and presented as pooled ORs and 95% CIs. Where only a single study reported an outcome, this was included as a single-paper analysis (34). Subgroup analyses were conducted to assess the impact of BMI (normal weight: BMI <25 kg/m2 vs. overweight: BMI ≥25 to <30 kg/m2 or obesity: BMI ≥30 kg/m2) (35), age (adults: 20 to 45 years old vs. adolescents: 13 to 19 years old), PCOS diagnostic criteria (NIH vs. Rotterdam) or ethnicity (White vs. Asian or Mixed) on the relationship between PCOS and OSAS, where applicable. All subgroup differences were determined using Chi-square tests. To further investigate the independent association between PCOS and OSAS in relation to BMI, a sensitive analysis was conducted by pooling together studies that have either adjusted or matched their control (non-PCOS) group for BMI. All meta-analyses and funnel plots were performed in STATA version 18 software (Texas, USA) using random-effects restricted maximum likelihood (REML) models (36). Heterogeneity between studies was assessed by I2 statistics where a value >50% was considered substantial heterogeneity (37). Publication bias was assessed by visual inspection of asymmetry of funnel plots to assess small study effects, where applicable (38). If substantial heterogeneity was present, the leave-one-out sensitivity analysis was performed, where each study was sequentially excluded to assess its individual influence on the overall pooled effect estimate (39). Additionally, sensitivity analysis was performed to determine the influence of high risk of bias studies on the overall pooled effect estimate, where applicable. P-value <0.05 was considered to be statistically significant.
3 Results
3.1 Search results and study characteristics
The initial search yielded 4007 records, of which 2487 titles and abstracts were screened and 50 were eligible for full-text screening. From these, eight cross-sectional studies met inclusion criteria and were eligible for meta-analysis. There were no additional studies identified after updating the searches. As shown in Figure 1, after updating the searches, the electronic literature search yielded 4438 records. After screening 3205 titles and abstracts and 40 full-texts, eight articles were included in the systematic review. Thirty-two full-text studies were excluded with reasons outlined in Figure 1 and detailed in Supplementary Table 3. Characteristics of included studies are presented in Table 1. The included studies were all controlled cross-sectional in design and reported data on the number of cases of OSA in PCOS compared with non-PCOS; thus, all were included in meta-analysis (15–21, 40). A total of 280 females with PCOS (sample sizes range: 18 to 53) and 662 females without PCOS (sample sizes range: 10 to 452) were included. All PCOS diagnoses were confirmed by clinicians, with four studies using the Rotterdam criteria (18, 19, 21, 40) and the other four studies using the NIH criteria (15–17, 20). Six studies were in adult populations (mean age range: 27.9 to 32.3 years) (15–19, 40), while two studies examined adolescent girls (mean age range: 15.0 to 17.1 years) (20, 21). Overall, five studies included populations with overweight and/or obesity (mean BMI range: 26.4 to 44.8 kg/m2) (15–17, 20, 21), while one study included normal weight individuals only (40) and two included all weight ranges (18, 19). All eight studies employed PSG to measure OSAS (as this was an inclusion criterion) (15–21, 40), five of which also assessed the presence of other OSAS-related symptoms such as excessive daytime sleepiness (15, 16, 18, 19, 21). The included study populations were mostly of white ethnicity (15–17, 19, 20), with only three studies from Asian (18, 40) or mixed ethnicity (21) populations.
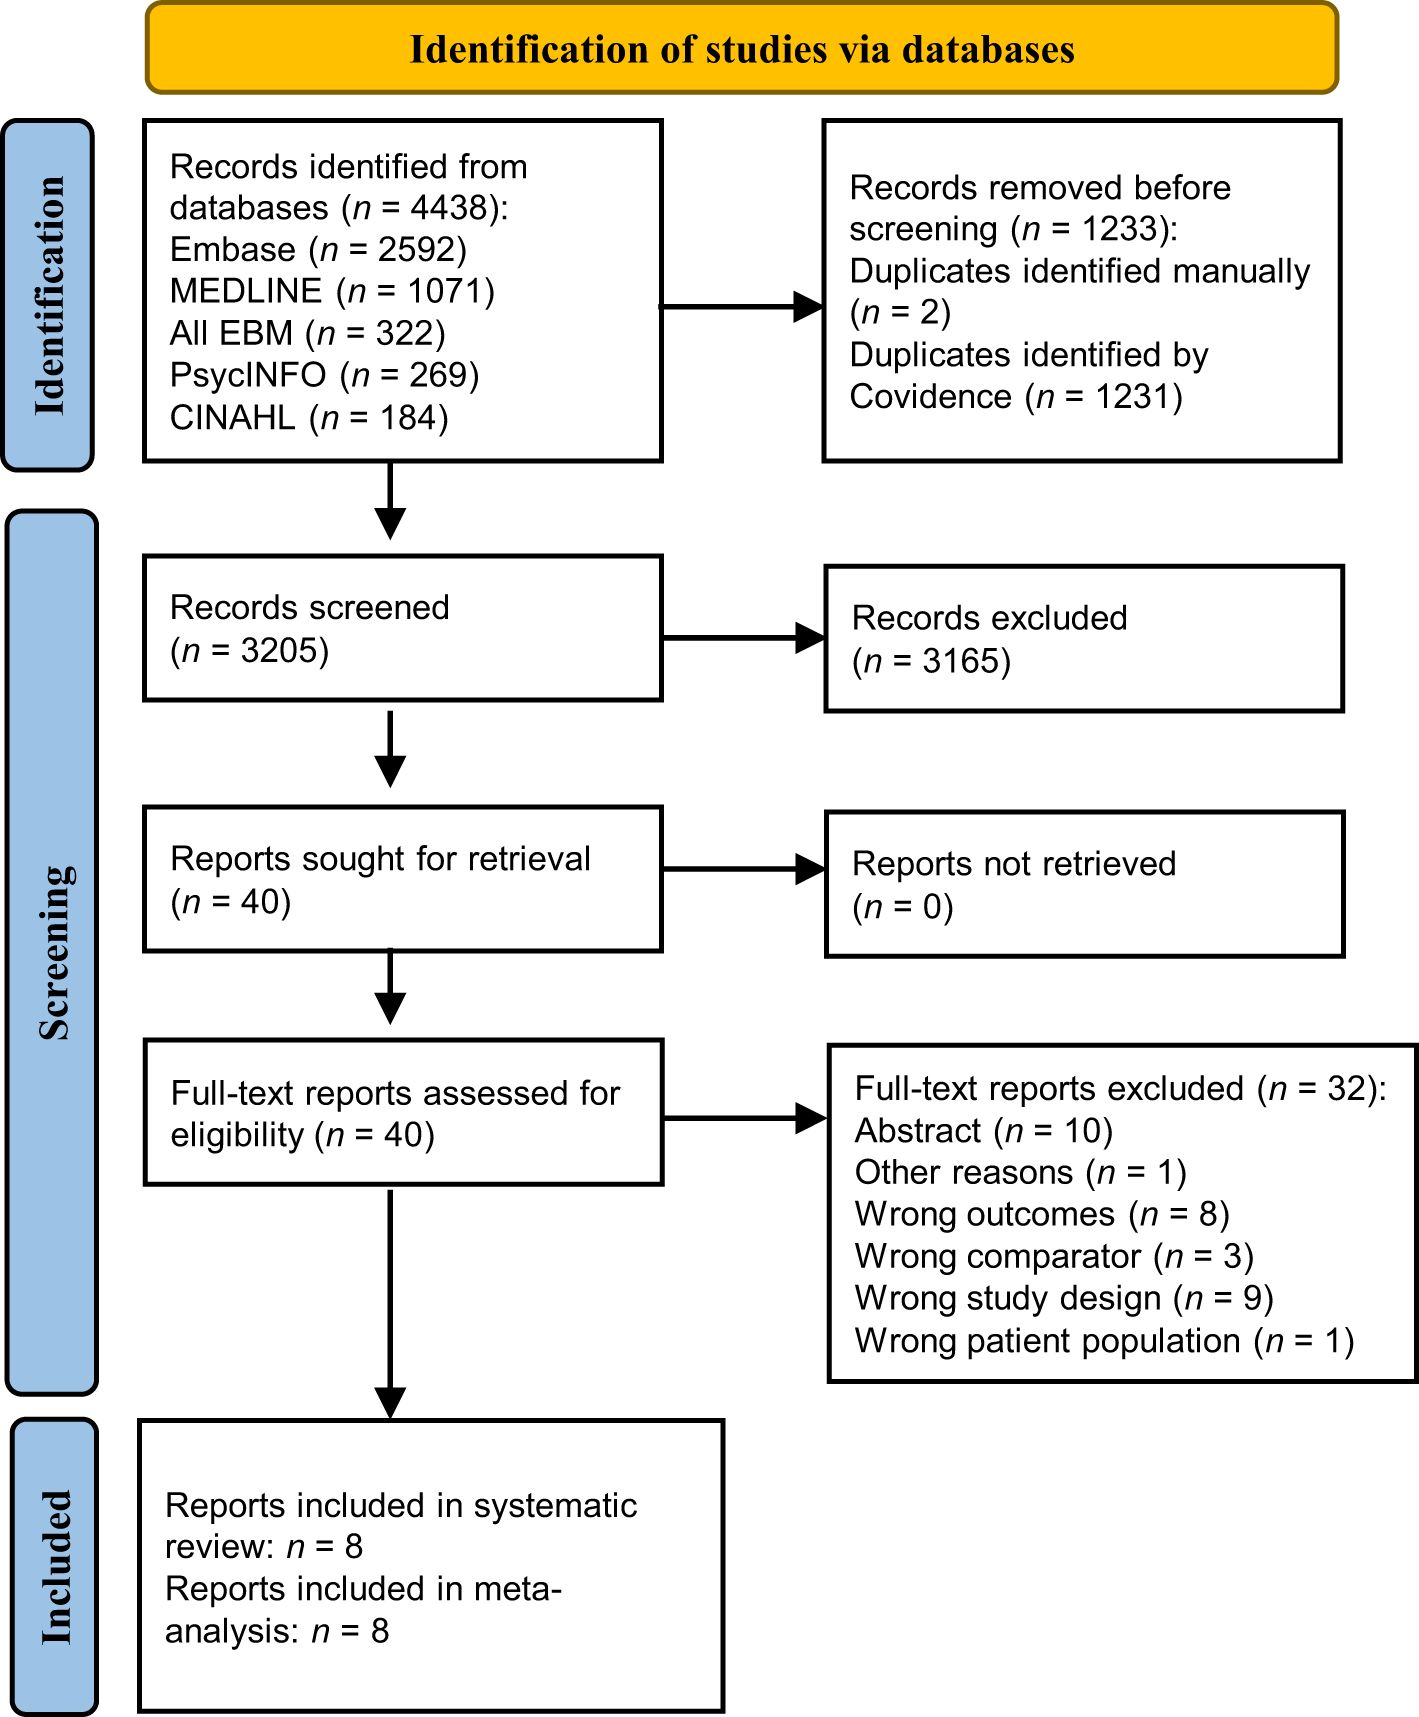
Figure 1. PRISMA flowchart of studies included in the review.

Table 1. Study characteristics of included studies (n = 8).1.
3.2 Outcome measures
As shown in Table 1, symptom categories of OSAS outcomes included studies with the following predetermined inclusion criteria: 1) AHI ≥5 only (studies not reporting presence of symptoms related to OSAS) (15, 17, 20, 40), 2) AHI ≥5 with symptoms (15, 18, 19, 21), 3) AHI ≥10 with symptoms (16) and 4) Composite OSA (i.e., all AHI cut-offs with and/or without symptoms) (15–21, 40). Varying degrees of daytime sleepiness definitions were used across four out of eight studies that include: ESS scores ranging from 0–24, with higher scores indicating greater sleepiness (15); ESS score ≥10 considered as excessive daytime sleepiness (18, 19); and a 4-point ESS scale (none, mild, moderate, or severe) (16). Three out of eight studies instead used information on any sleep-related complaints (21) or included other OSAS related symptoms such as choking, witnessed apneic spell, nocturia and hypertension or other cardiovascular complication (16, 18).
3.3 Quality assessment and grading
The quality assessment of the included studies revealed that studies were of moderate to high risk of bias (Table 1). This was commonly attributed to selection bias, detection bias and overall small sample sizes (as detailed in Supplementary Table 4). As shown in Table 2, GRADE assessments indicated that evidence certainty for composite OSA was low due to being twice downgraded for the moderate or high risk of bias of all included studies (serious risk of bias) and having no outcome events in two studies (serious imprecision) (20, 40). Moreover, there was moderate evidence certainty for OSAS outcomes; AHI ≥5 only, AHI ≥5 with symptoms and AHI ≥10 with symptoms, again downgraded either once for serious imprecision (20, 40) or for serious risk of bias.
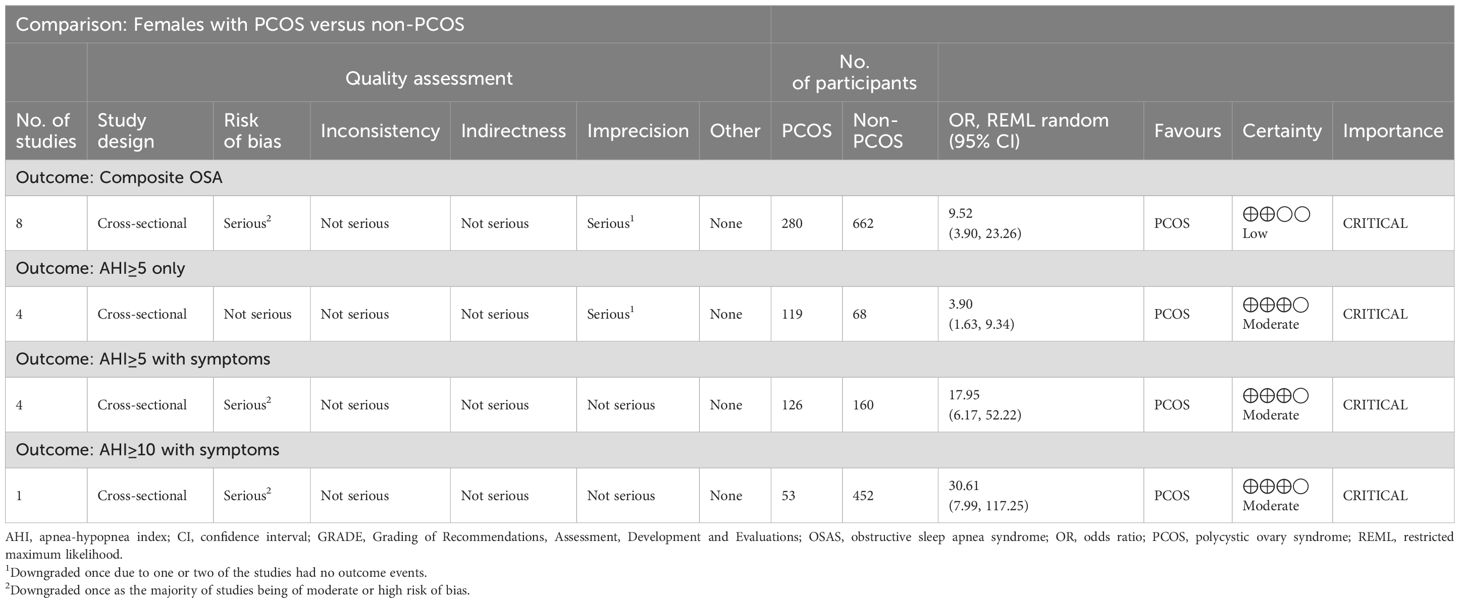
Table 2. GRADE assessment and evidence profile.
3.4 Meta-analysis
3.4.1 Prevalence and symptom categories of OSAS in PCOS and non-PCOS
Figure 2A demonstrates that the overall pooled prevalence of OSA in PCOS was 37.0% (95% CI: 17.0% to 57.0%; I2 = 96.8%; 8 studies, n = 280; P < 0.001), compared with a lower pooled prevalence in those without PCOS (6.0%; 95% CI: 1.0% to 10.0%; I2 = 73.6%; P = 0.01; 8 studies, n = 662; Figure 2B). The I2 values of 96.8% and 73.6% for PCOS and non-PCOS populations respectively, were both statistically significant for heterogeneity among the studies (both P < 0.001). Evidence of publication bias were observed for overall prevalence of OSA in PCOS and non-PCOS populations respectively, based on visual asymmetries of funnel plots (Supplementary Figure 1). Sensitivity analysis results showed no difference in significance of the overall findings after exclusion of any individual study from the analysis (Supplementary Figure 2).
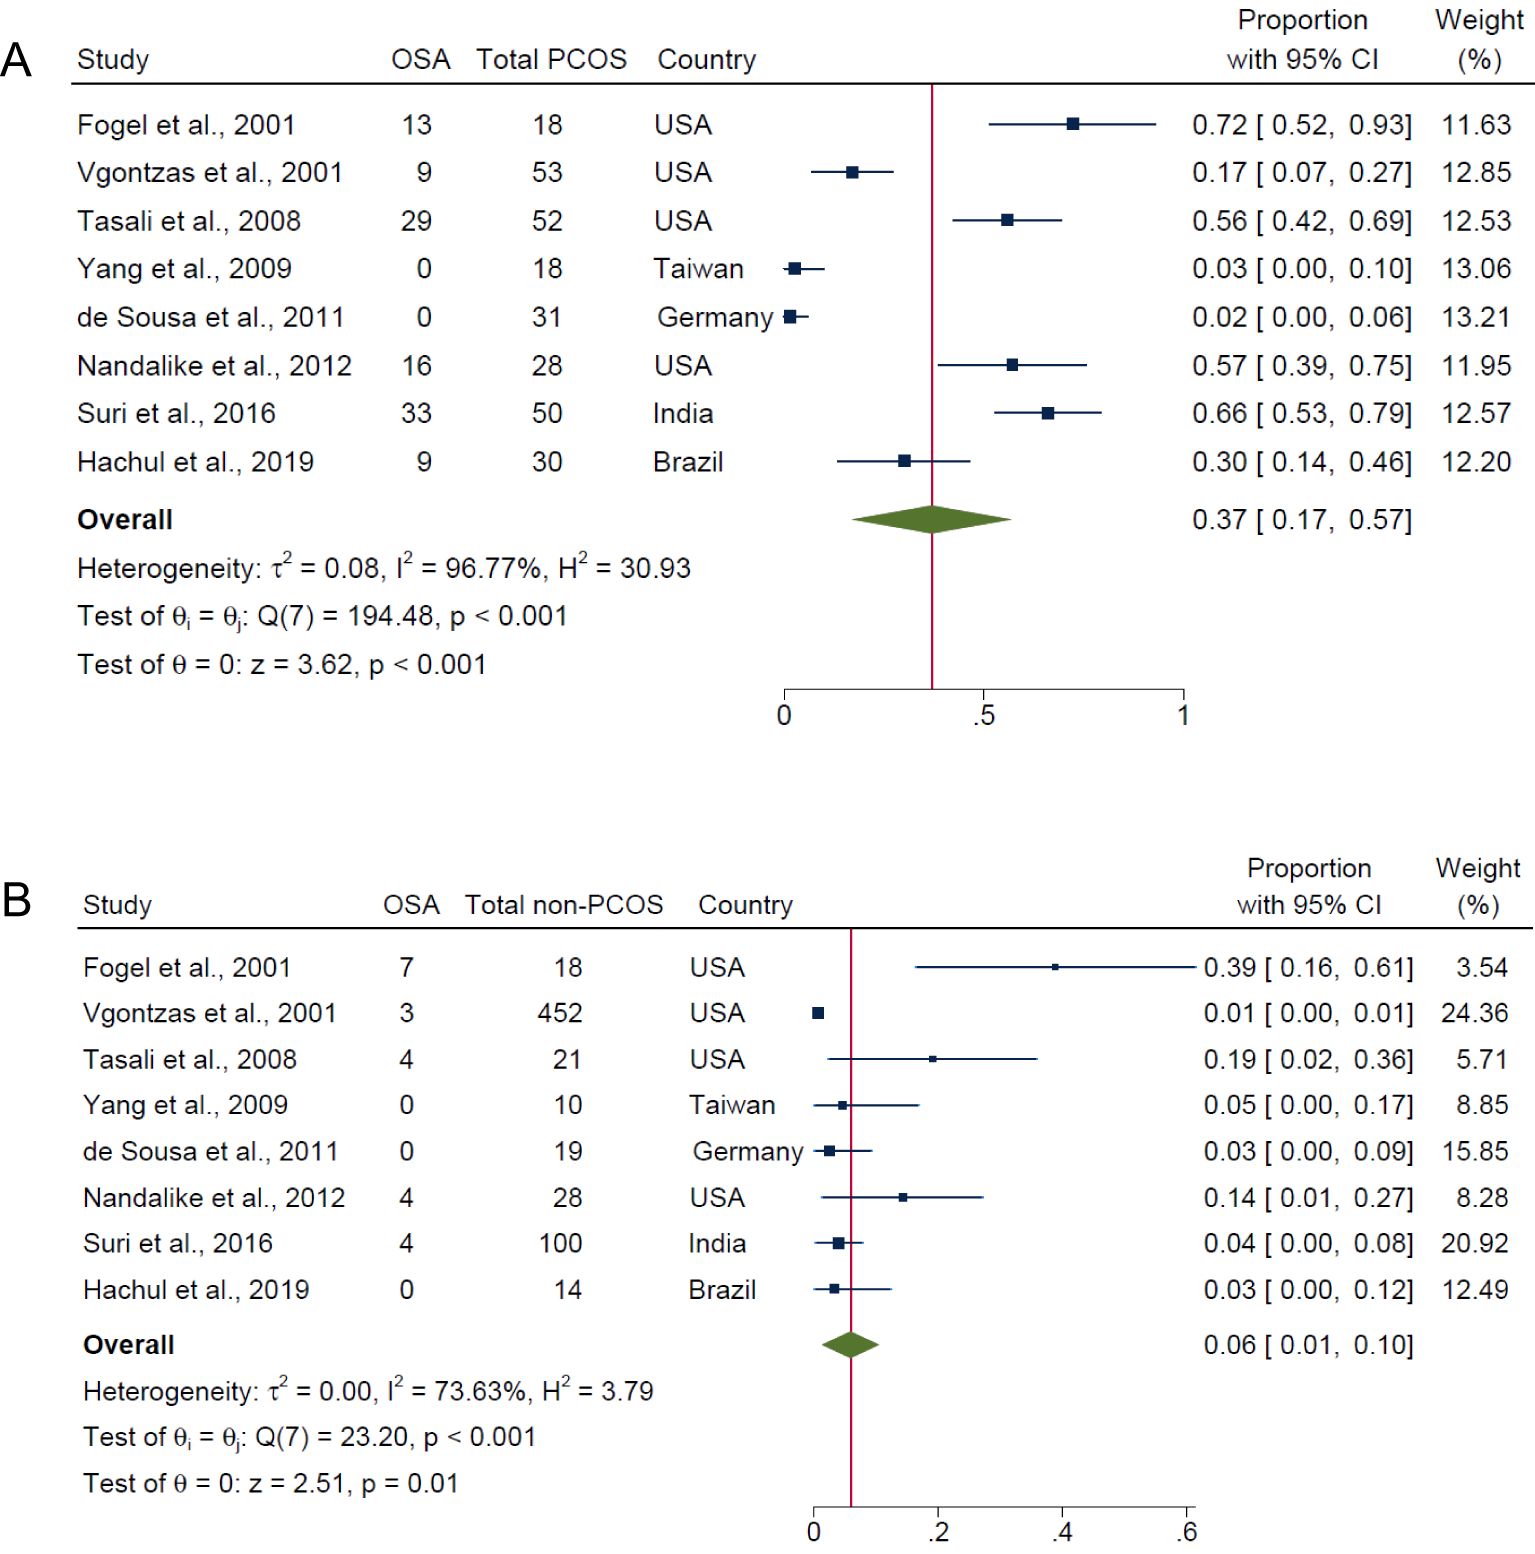
Figure 2. Pooled prevalence of OSA (i.e., all AHI cut-offs with and/or without symptoms) in PCOS and non-PCOS populations. (A) PCOS and (B) Non-PCOS.
Overall, for composite OSA outcome, individuals with PCOS were approximately 10 times more likely to have OSAS compared with those without PCOS (OR: 9.52; 95% CI: 3.90 to 23.26; I2 = 54.5%; P < 0.001; 8 studies, n = 942; Figure 3A), with only five of the eight studies having adjusted or matched their control group by age, BMI and/or ethnicity (15, 17, 18, 21, 40). Specifically, the risk of OSAS in PCOS compared with non-PCOS groups were more pronounced with presence of symptoms and increasing severity categories of OSAS: AHI ≥5 only (OR: 3.90; 95% CI: 1.63 to 9.34; I2 = 0%; P = 0.0023; 4 studies, n = 187; Figure 3B), AHI ≥5 with symptoms (OR: 17.95; 95% CI: 6.17 to 52.22; I2 = 37.7%; P < 0.001; 4 studies, n = 286; Figure 3C) and AHI ≥10 with symptoms (OR: 30.61; 95% CI: 7.99 to 117.25; P < 0.001; 1 study, n = 505; Figure 3D). There was no evidence of any publication bias specific for each symptom category of OSAS, as observed from visual symmetries of funnel plots (Supplementary Figure 3). Sensitivity analyses results for composite OSA overall showed no difference in significance of the findings after exclusion of any individual study (Supplementary Figure 4). Additionally, sensitivity analysis did not change the significance of the results for composite OSA and AHI ≥5 with symptoms after excluding for high risk of bias studies (16, 18, 21) (OR: 4.30; 95% CI: 1.86 to 9.93; I2 = 0%; P < 0.001; 5 studies, n = 231 and OR: 13.31; 95% CI: 2.27 to 77.95; I2 = 0%; P < 0.001; 2 studies, n = 80, respectively).
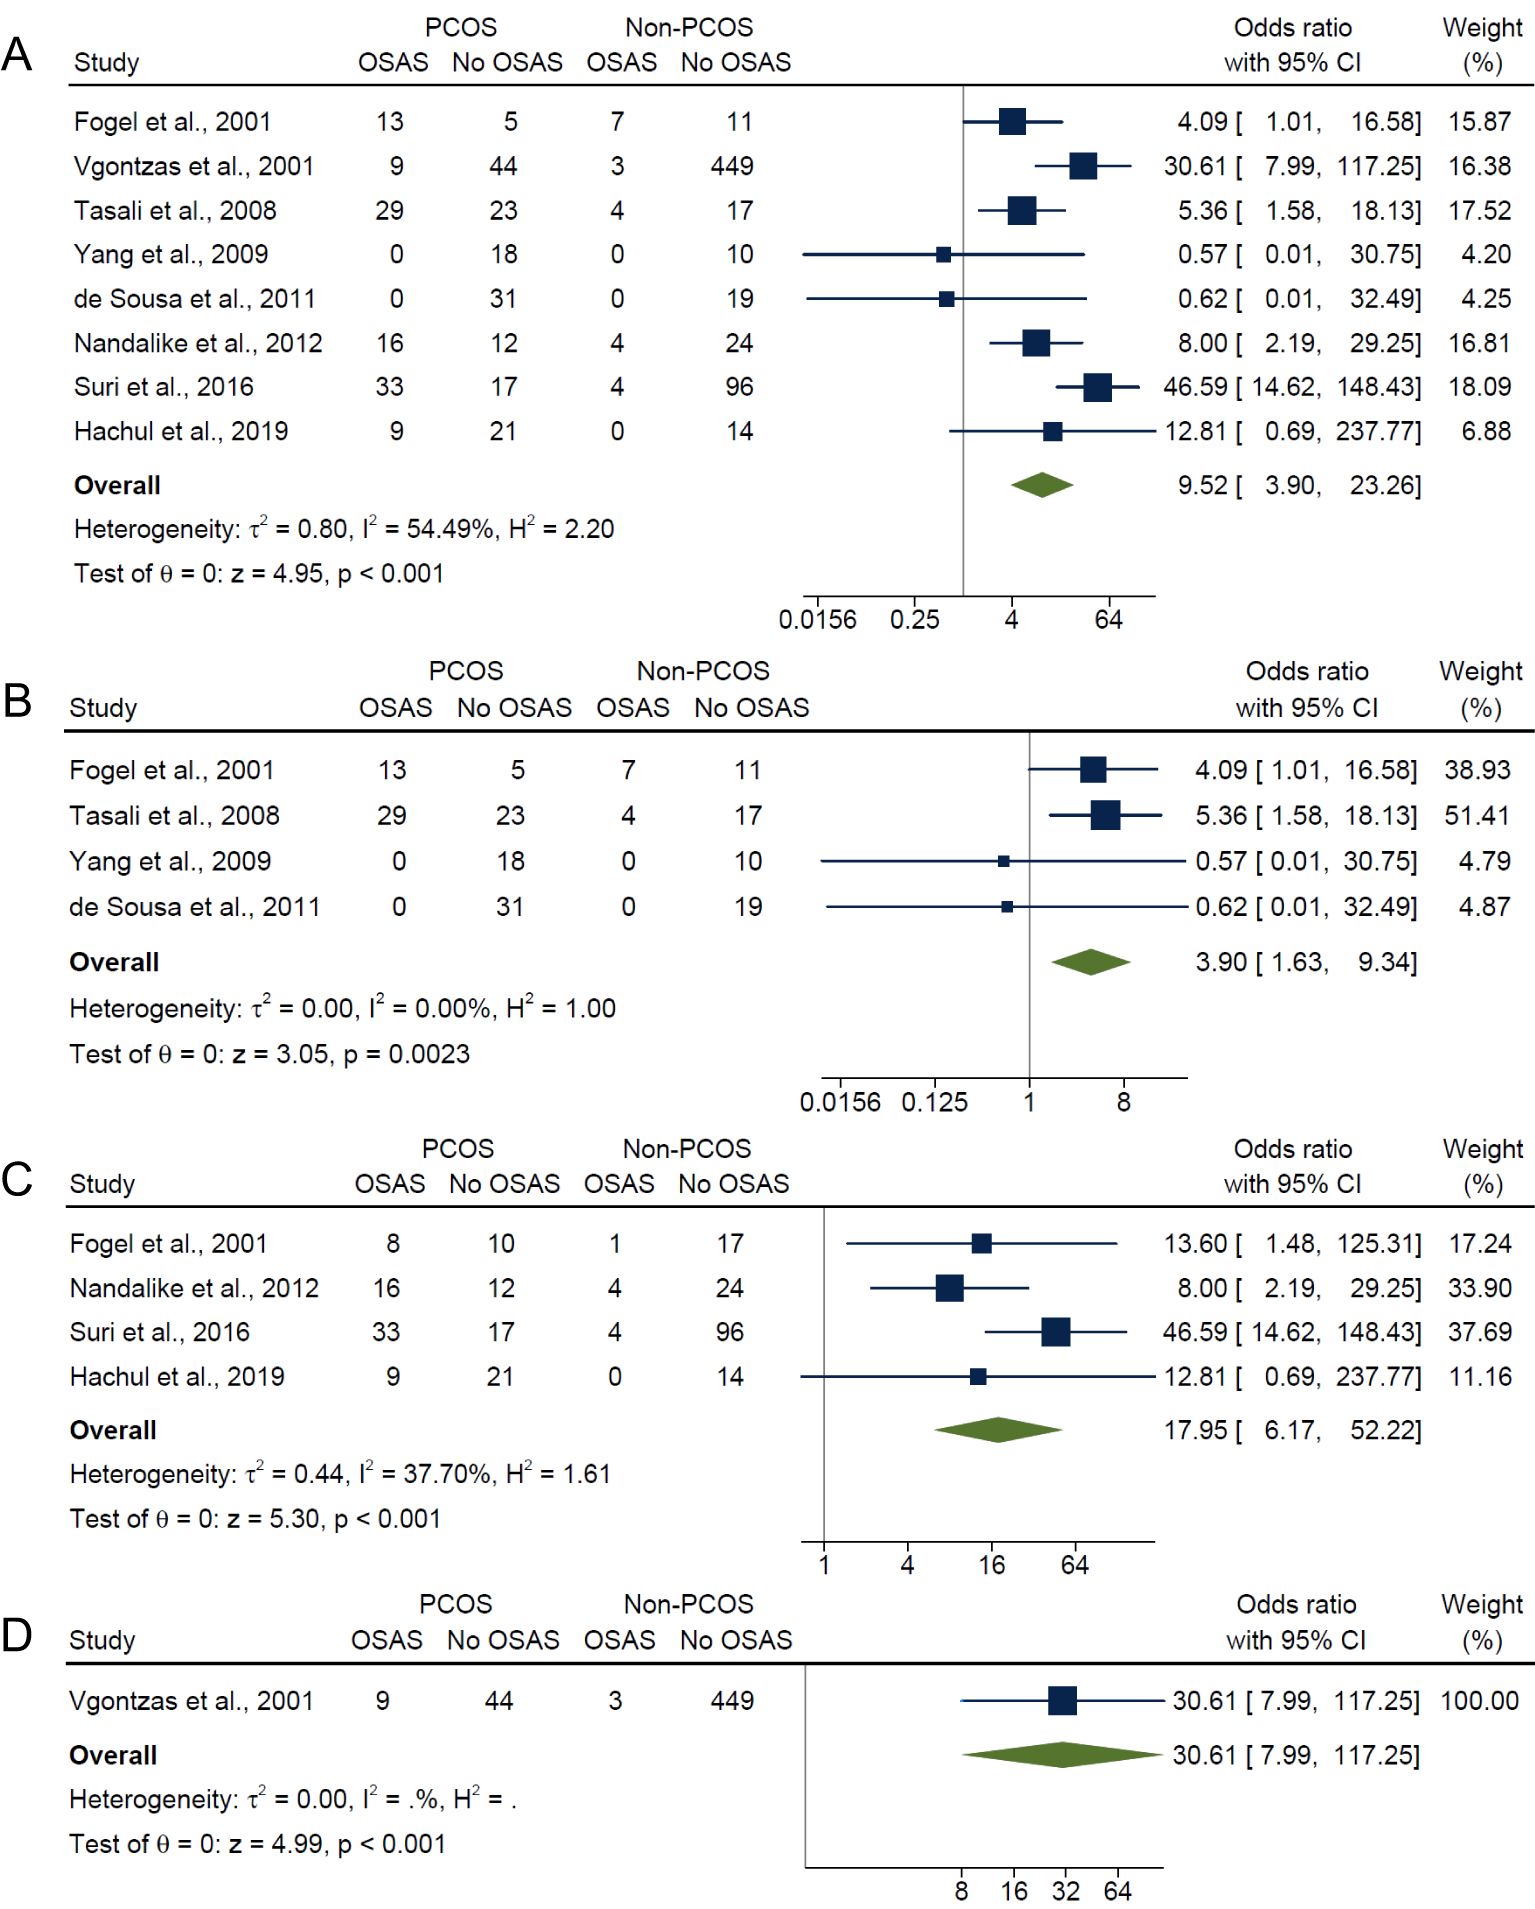
Figure 3. Meta-analyses of symptom categories of OSAS in PCOS compared with non-PCOS. (A) Composite OSA, (B) AHI≥5 only, (C) AHI≥5 with symptoms and (D) AHI≥10 with symptoms.
3.5 Subgroup analysis
Subgroup analysis were conducted for BMI, age, PCOS diagnostic criteria and ethnicity for composite OSA, AHI ≥5 only and AHI ≥5 with symptoms outcomes respectively. Due to the limited available studies, AHI ≥10 with symptoms outcome was not examined.
3.5.1 Subgroup analysis by BMI
In the subgroup analysis by BMI, the overweight/obese category, which included studies having adjusted (17) or matched their control group (15, 21) by age, BMI and/or ethnicity and studies that did not adjust for confounders (16, 20), had significantly higher risk in PCOS compared with non-PCOS groups for composite OSA (OR: 7.62; 95% CI: 3.26 to 17.80; P < 0.001; 5 studies, n = 720; Figure 4A), AHI ≥5 only (OR: 4.29; 95% CI: 1.75 to 10.52; P = 0.0014; 3 studies, n = 159; Figure 4B) and AHI ≥5 with symptoms (OR: 9.16; 95% CI: 2.99 to 28.05; P < 0.001; 2 studies, n = 92; Figure 4C). Sensitivity analysis limited to pooled studies having either adjusted (17) or matched their control group (15, 21) by age, BMI and/or ethnicity also showed significantly higher risk in PCOS compared with non-PCOS groups for composite OSA (OR: 5.67; 95% CI: 2.68 to 12.00; P < 0.001; 3 studies, n = 165; Figure 4A). In the normal weight subgroup with only one study (40), results were not significant for both composite OSA and AHI ≥5 only (ORs: 0.57; 95% CI: 0.01 to 30.75; P = 0.78; n = 28; Figures 4A, B respectively). In the mixed weight group (i.e., studies with mixed samples of normal, overweight and obese), there were significantly higher risk of OSAS in PCOS compared with non-PCOS populations for both composite OSA and AHI ≥5 with symptoms (ORs: 39.09; 95% CI: 13.31 to 114.77; P < 0.001; 2 studies, n = 194; Figures 4A, C).
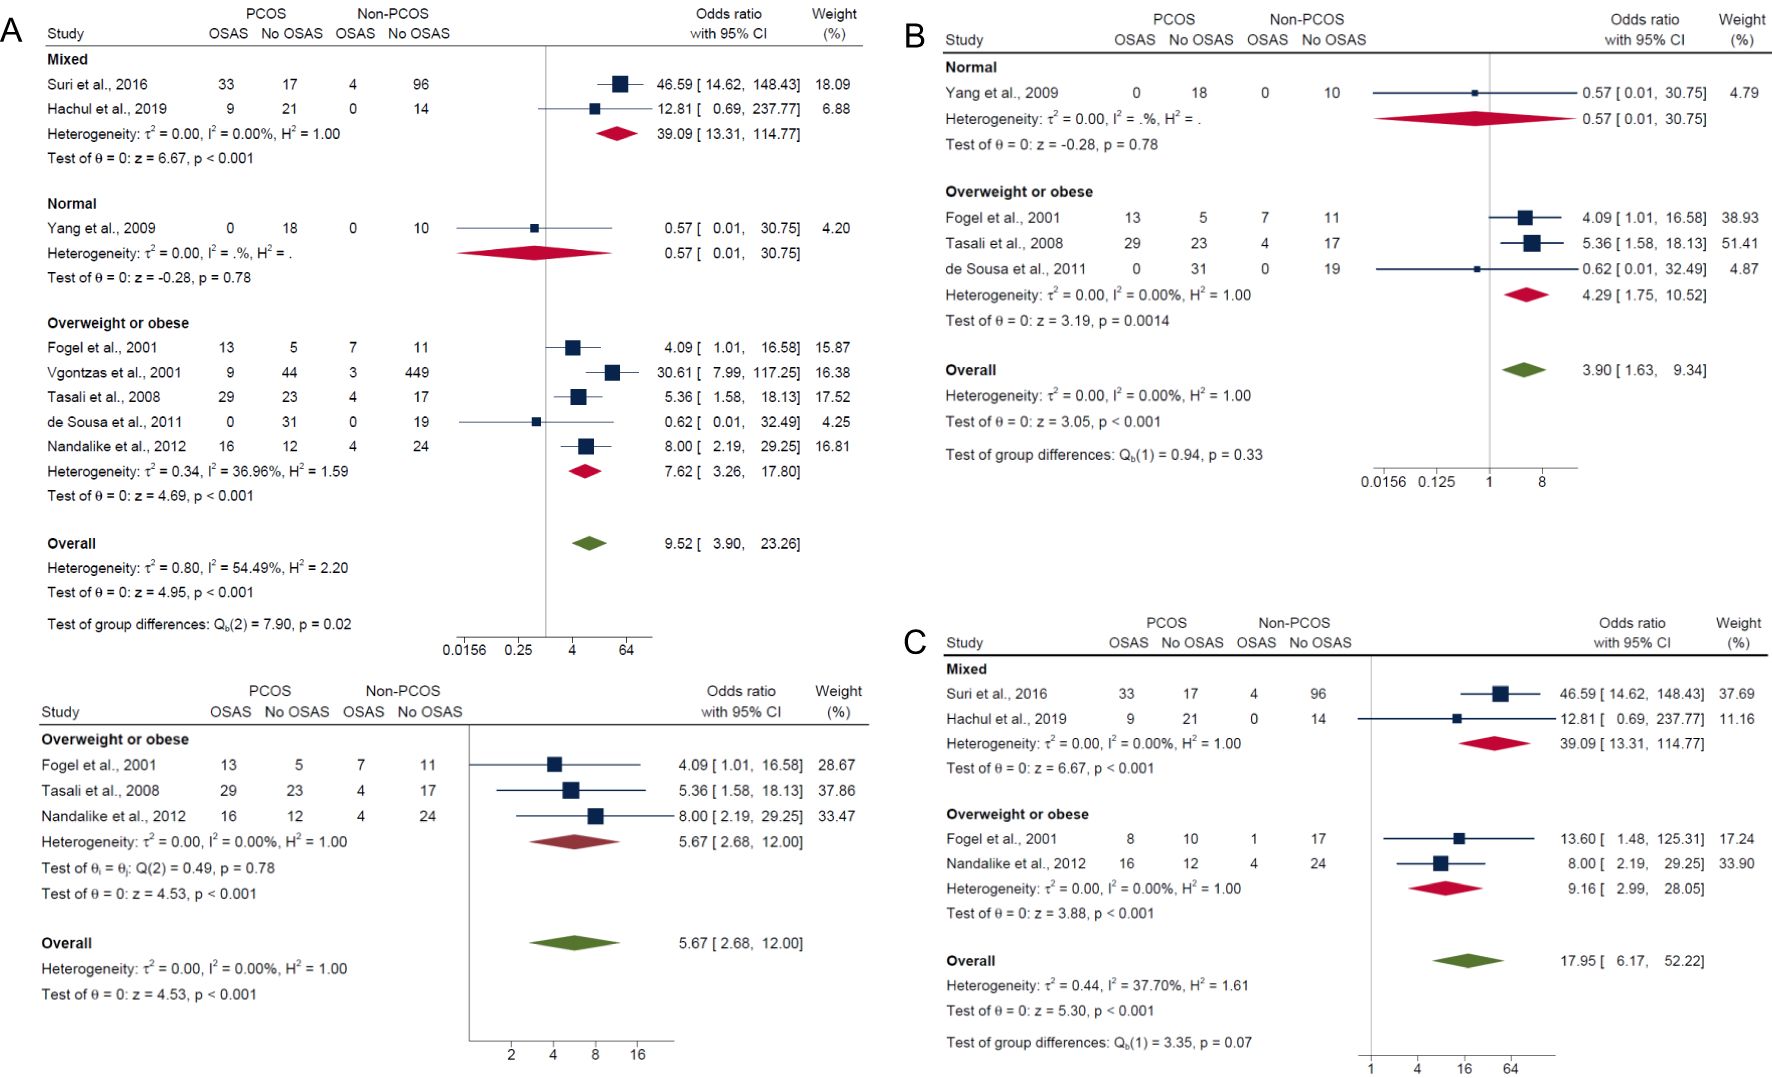
Figure 4. Subgroup analyses of symptom categories of OSAS in PCOS compared with non-PCOS by BMI. (A) Composite OSA, (B) AHI≥5 only and (C) AHI≥5 with symptoms.
3.5.2 Subgroup analysis by age
Adolescent PCOS populations had an overall lower pooled prevalence of OSA (29.0%; 95% CI: 0% to 83.0%) compared with adult PCOS populations (40.0%; 95% CI: 17.0% to 63.0%), but differences between groups were not significant (P = 0.71) (Supplementary Figure 5). For non-PCOS populations, adolescent and adults showed similar pooled prevalence of OSA (both 7.0%) with no significant group differences (P = 0.96) (Supplementary Figure 5). In adolescents, results showed no significant differences in risk of OSAS between those with PCOS and without PCOS for composite OSA (OR: 4.54; 95% CI: 0.56 to 36.43; P = 0.15; 2 studies, n = 106; Figure 5A) and AHI ≥5 only (OR: 0.62; 95% CI: 0.01 to 32.49; P = 0.81; 1 study, n = 50; Figure 5B), but were significant for AHI ≥5 with symptoms where the risk was higher in PCOS (OR: 8.0; 95% CI: 2.19 to 29.25; P < 0.001; 1 study, n = 56; Figure 5C). In adults, there were significantly higher risk of OSAS in PCOS compared with non-PCOS groups for composite OSA (OR: 11.23; 95% CI: 3.84 to 32.82; P < 0.001; 6 studies, n = 836; Figure 5A), AHI ≥5 only (OR: 4.28; 95% CI: 1.75 to 10.49; P < 0.001; 3 studies, n = 137; Figure 5B) and AHI ≥5 with symptoms (OR: 31.97; 95% CI: 12.13 to 84.26; P < 0.001; 3 studies, n = 230; Figure 5C).
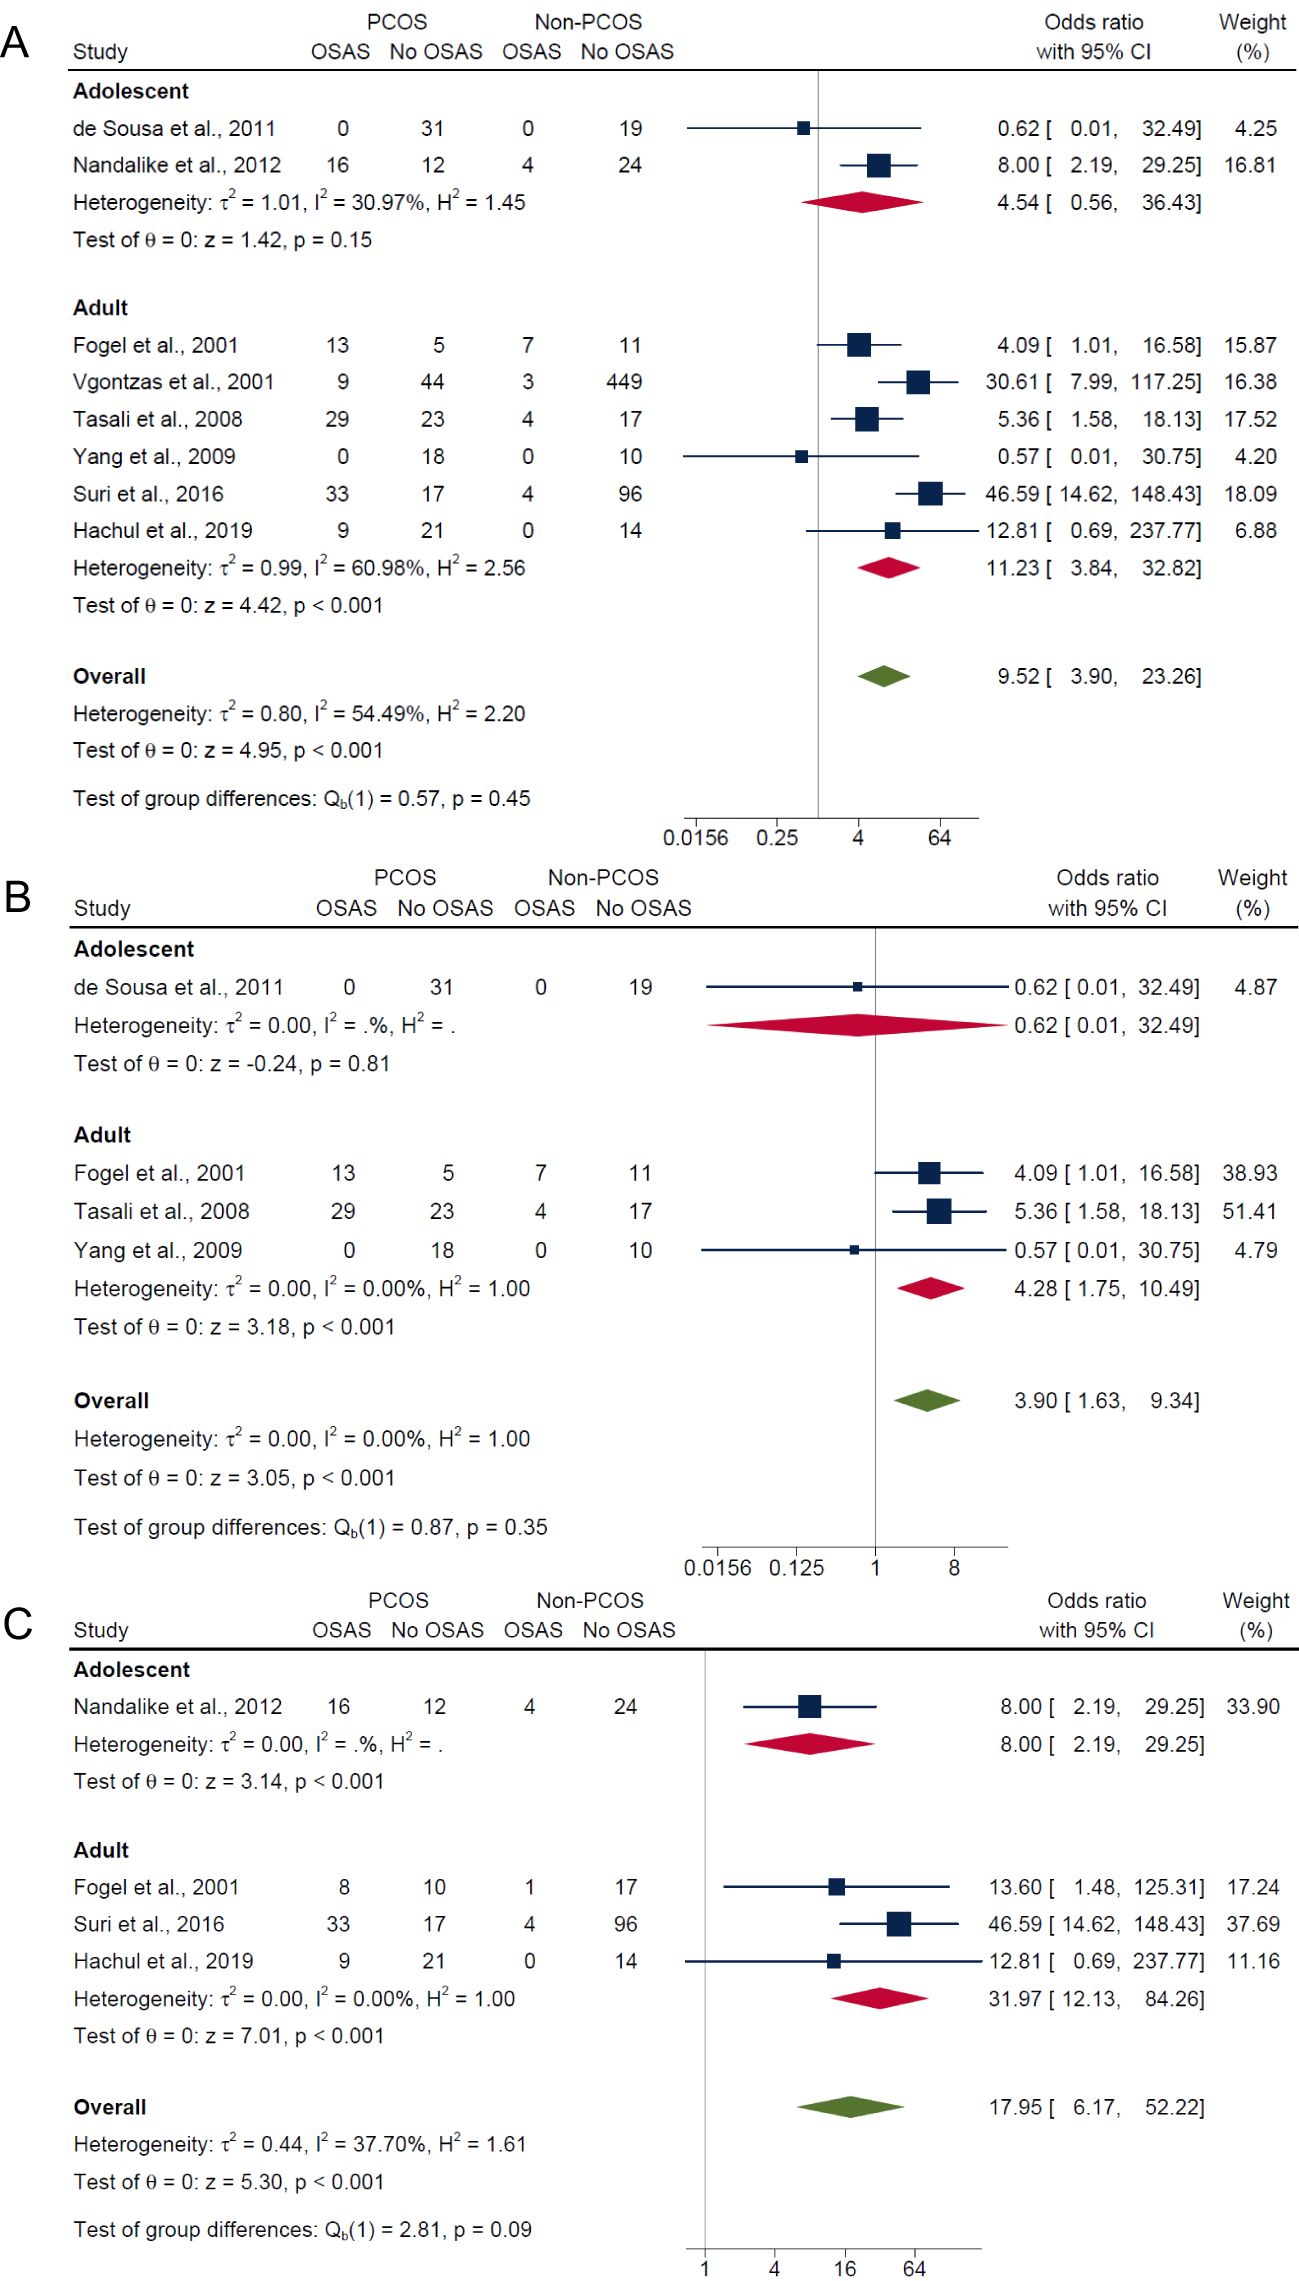
Figure 5. Subgroup analyses of symptom categories of OSAS in PCOS compared with non-PCOS by age. (A) Composite OSA, (B) AHI≥5 only and (C) AHI≥5 with symptoms.
3.5.3 Subgroup analysis by PCOS diagnostic criteria
Independent of PCOS diagnostic criteria, results showed significantly higher risk of OSAS in PCOS compared with non-PCOS groups for composite OSA (Rotterdam criteria: OR: 12.85; 95% CI: 3.08 to 53.65; P < 0.001; 4 studies, n = 278 vs. NIH criteria: OR: 7.10; 95% CI: 2.13 to 23.65; P < 0.001; 4 studies, n = 664; Figure 6A) and AHI ≥5 with symptoms (Rotterdam criteria: OR: 18.66; 95% CI: 4.97 to 70.06; P < 0.001; 3 studies, n = 250 vs. NIH criteria: OR: 13.60; 95% CI: 1.48 to 125.31; P = 0.02; 1 study, n = 36; Figure 6C), but not for the AHI ≥5 only outcome where the risk was only higher in PCOS using the NIH criteria (Rotterdam criteria: OR: 0.57; 95% CI: 0.01 to 30.75; P = 0.78; 1 study, n = 28 vs. NIH criteria: OR: 4.29; 95% CI: 1.75 to 10.52; P = 0.0014; 3 studies, n = 159; Figure 6B).
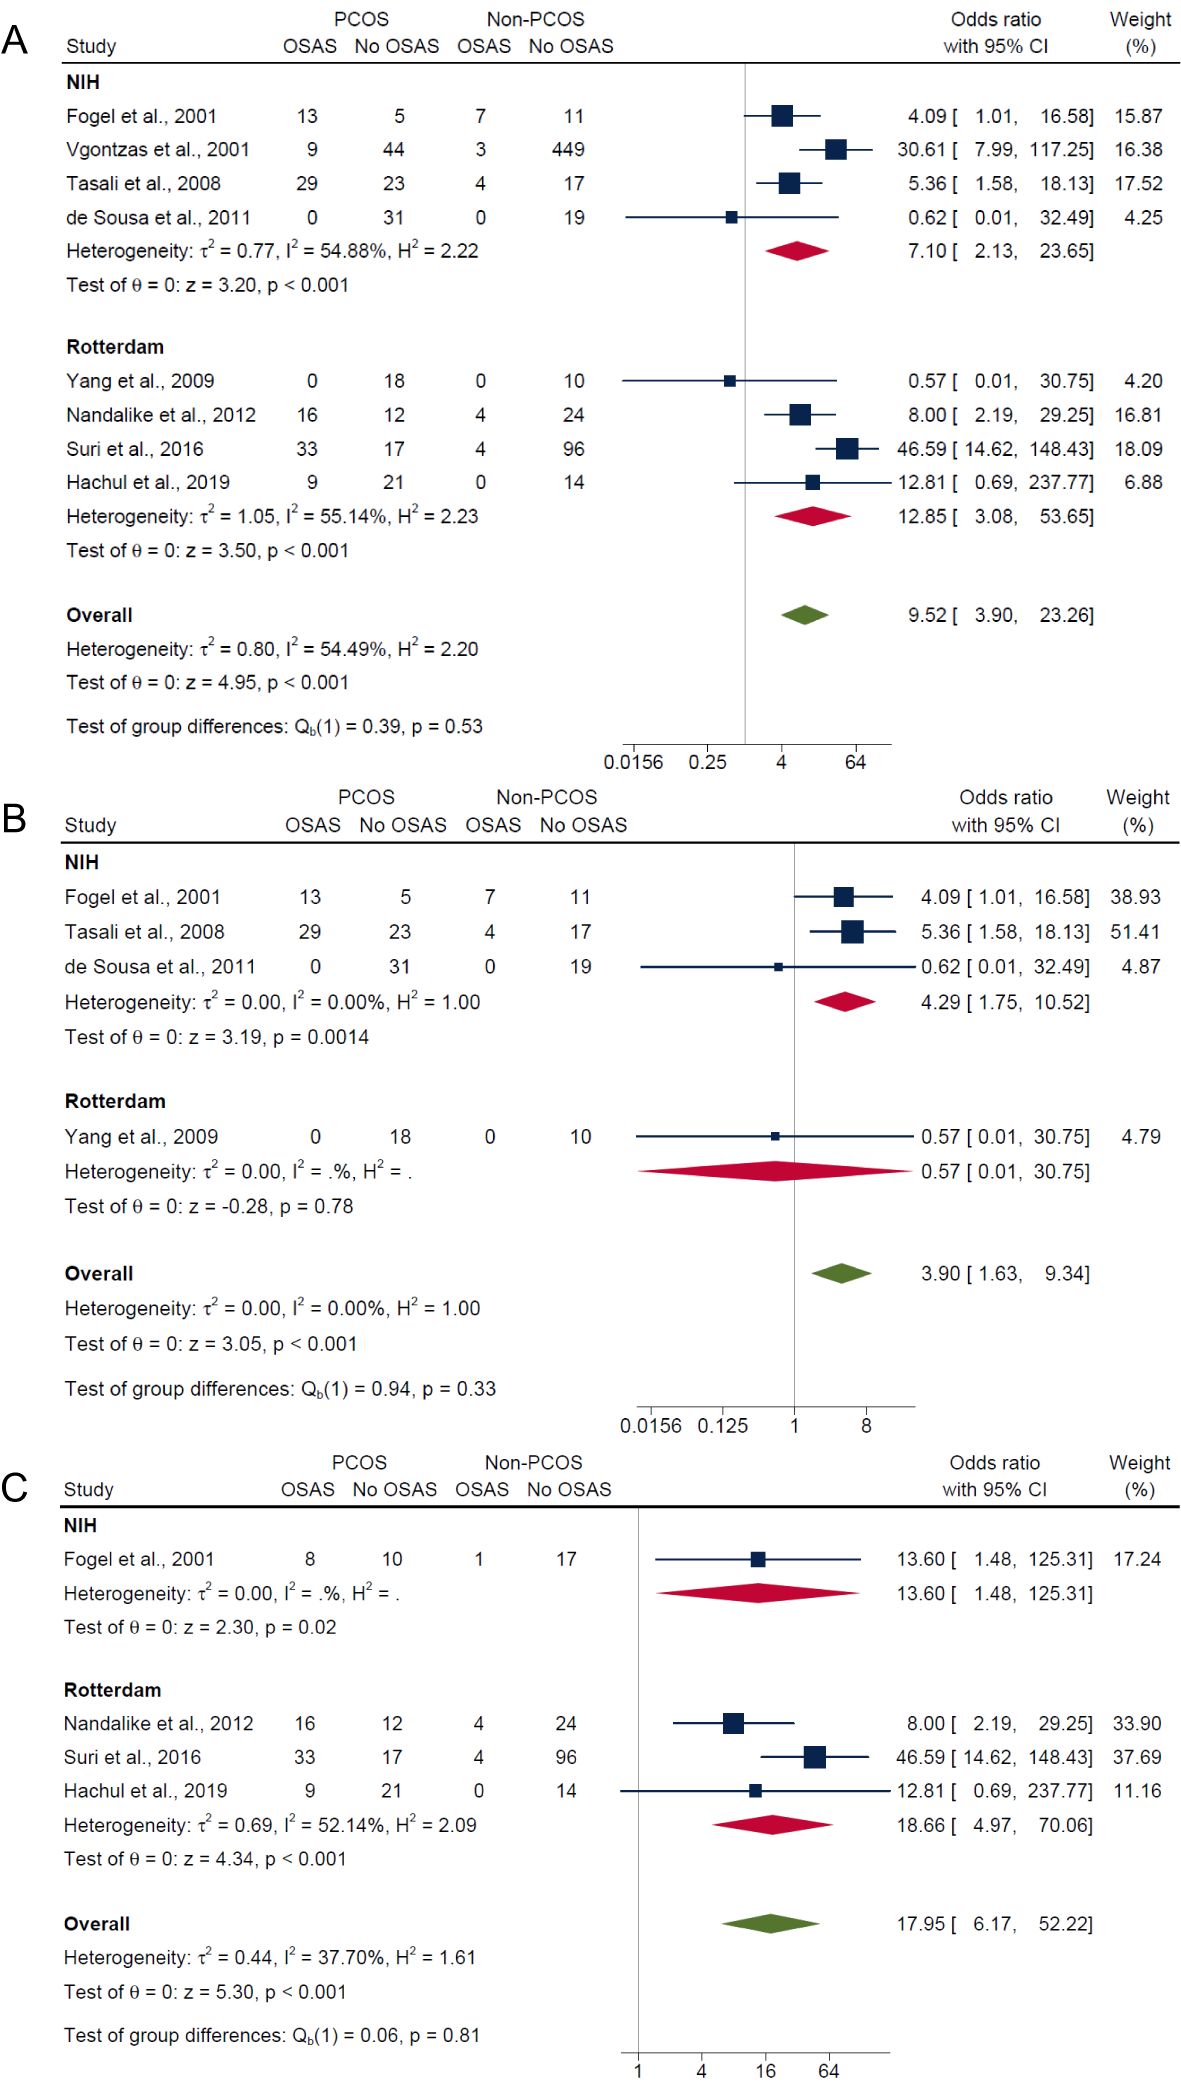
Figure 6. Subgroup analyses of symptom categories of OSAS in PCOS compared with non-PCOS by PCOS diagnostic criteria. (A) Composite OSA, (B) AHI≥5 only and (C) AHI≥5 with symptoms.
3.5.4 Subgroup analysis by ethnicity
Lastly, in the subgroup analysis by ethnicity, those of white ethnicity had significantly higher risk in PCOS compared with non-PCOS groups for composite OSA (OR: 4.72; 95% CI: 2.00 to 11.11; P < 0.001; 4 studies, n = 203; Figure 7A), AHI ≥5 only (OR: 4.29; 95% CI: 1.75 to 10.52; P = 0.0014; 3 studies, n = 159; Figure 7B) and AHI ≥5 with symptoms (OR: 13.31; 95% CI: 2.27 to 77.95; P < 0.001; 2 studies, n = 80; Figure 7C). In the Asian ethnicity subgroup with only one study, results were not significant for both composite OSA and AHI ≥5 only (ORs: 0.57; 95% CI: 0.01 to 30.75; P = 0.78; n = 28; Figures 7A, B), but significant for AHI ≥5 with symptoms (OR: 46.59; 95% CI: 14.62 to 148.43; P < 0.001; n = 150; Figures 7C). In the mixed ethnicity subgroup, there was significantly higher risk of OSAS in PCOS compared with non-PCOS groups for AHI ≥5 with symptoms (OR: 8.0; 95% CI: 2.19 to 29.25; P < 0.001; 1 study, n = 56; Figure 7C).
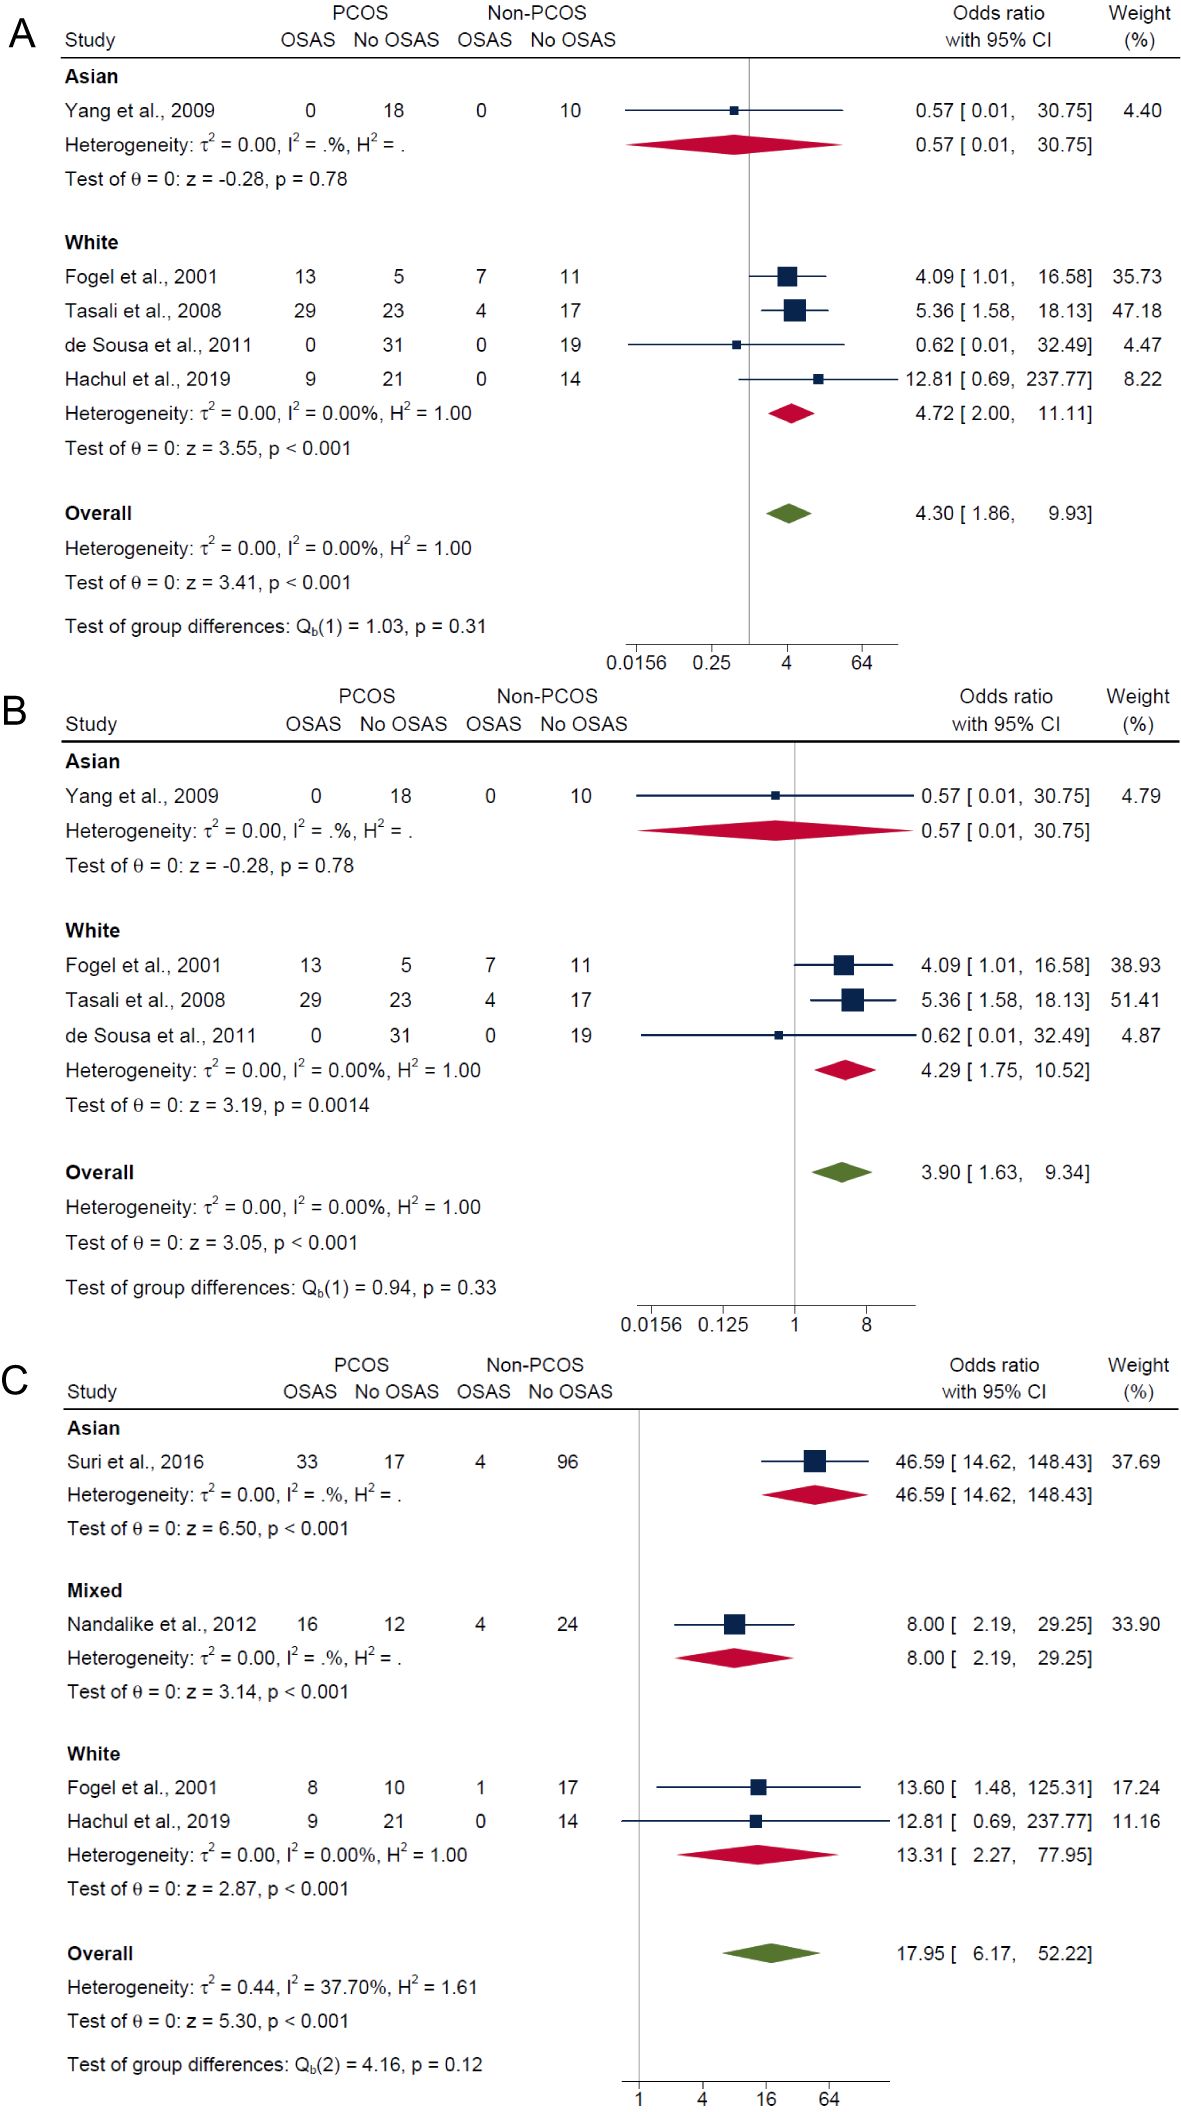
Figure 7. Subgroup analyses of symptom categories of OSAS in PCOS compared with non-PCOS by ethnicity. (A) Composite OSA, (B) AHI≥5 only and (C) AHI≥5 with symptoms.
4 Discussion
This is the first comprehensive systematic review and meta-analysis to analyze the presence of OSAS and related symptoms in PCOS compared with non-PCOS populations using PSG/polygraph with or without validated sleep screening questionnaires. Our pooled analyses of eight studies totaling 942 participants showed that, overall, 37.0% of individuals with PCOS had OSA (29.0% adolescents; 40.0% adults), while only 6.0% without PCOS had OSA (7.0% adolescents; 7.0% adults). Moreover, those with PCOS were approximately 10 times more likely to have OSAS than those without PCOS. The risk of OSAS tended to be higher in those who had overweight or obesity, adult women and of white ethnicity compared with normal weight, adolescent and Asian populations respectively, but was largely independent of PCOS diagnostic criteria.
Compared to previous meta-analyses, the present study showed relatively higher pooled OSA prevalence (37.0% vs. 20.8-35.0%) and higher risk of OSAS (OR: 9.52 vs. ORs: 2.86-8.30) in women with PCOS relative to without PCOS (14, 22, 26). Differences in study methodology likely explain the varied estimates of OSAS risk compared with previous meta-analyses. For example, He et al. (26) included studies that screened for OSA using the Berlin questionnaire, studies that utilized PSG to diagnosed OSAS as well as studies that did not specify OSAS measurement. Inclusion of studies with objective, subjective and unknown measurements of OSAS could have underestimated the overall OSAS risk (OR: 2.86), as demonstrated in the present meta-analysis, where we report a markedly higher risk of OSAS (OR: 9.52) when including only those articles that employed formal sleep studies to assess OSAS.
The present meta-analysis reported, for the first time, a ~5-fold higher effect estimate for AHI≥5 with symptoms compared to AHI≥5 only outcomes among individuals with PCOS (OR: 17.95 vs. OR: 3.90) (15, 17–21, 40). This indicates that sleep disturbances and associated symptoms may drive the inflammation, oxidative stress and increased sympathetic excitability, plausibly alter the regulation of gonadotropins and gonadotropin-releasing hormones, thus contributing to the expression of pathophysiological features of PCOS such as hyperandrogenism and insulin resistance in a bidirectional association (41). Although treatment with continuous positive airway pressure (CPAP) therapy has shown to improve nocturnal apnea, daytime sleepiness, as well as metabolic outcomes for those with OSA, evidence regarding the impact of CPAP use in PCOS populations is lacking. The long-term cardiometabolic health benefits for treating OSA with CPAP are also not clearly established from RCTs, but research from observational studies seems to suggest a benefit on health outcomes from treatment in general populations, which may extend to those with PCOS (42). With a high proportion of the general population being minimally symptomatic, it is considered optimal to target and treat those with symptoms of OSAS such as non-restorative sleep, sleep-related complaints, daytime fatigue and sleepiness or hypertension. In light of this, targeted screening approaches for symptoms of OSAS, using questionnaires for example, have been recommended for high prevalence populations that include PCOS (43).
Similar to previous meta-analyses (22, 23, 26), our subgroup analysis demonstrated that the overall prevalence of OSA was higher in adults with PCOS, but not in adolescents with PCOS. This is expected, as PCOS is likely to precede the onset of OSA given that OSA may develop over time as features of PCOS like hyperandrogenism worsen, predisposing to OSA via effects on neural control of breathing and upper airway mechanics (44). Regarding differences by diagnostic criteria, we found significantly higher risks of OSAS in PCOS overall compared with those without PCOS, regardless of diagnostic criteria (45). Previous research has shown mixed results, with one meta-analysis reporting a greater proportion of OSAS in PCOS based on NIH criteria (26), while another reported no such variations across PCOS definitions (23). Consistent with He et al. (26), our subgroup analysis also demonstrated that the overall prevalence of OSAS was higher in those of white ethnicity with PCOS, but not in those of Asian ethnicity with PCOS. Finally, BMI variations were also evident in our pooled analyses, whereby overall risk of having OSAS in PCOS compared with non-PCOS was greater in those populations who were overweight/obese (OR: 7.62) and mixed weight (i.e., studies with sample populations that range across normal, overweight and obese) (OR: 39.09) compared with the normal weight (OR: 0.57) population. This finding is consistent with prior meta-analyses which have reported a higher risk of OSAS in individuals with both PCOS and obesity compared with those without obesity (23, 26). It should be noted that the very wide 95% confidence interval in the mixed weight group (95% CI: 13.31 to 114.77) imply imprecision in the overall certainty of the effect estimate. The normal weight group in our analysis also consisted of only Yang et al. (40), with a very small sample size (n = 28) and absence of AHI ≥5 in all participants. Of note, the BMI classification as per the World Health Organization (WHO) guideline (35) may not apply to Asian populations given that these were generated mostly from the White populations (46). Further, only two studies in our meta-analyses were from Asian populations (18, 40), thus this result should be interpreted accordingly.
PCOS may also be an independent contributor to the risk of OSAS. Our sensitivity analysis that was limited to studies that matched or controlled for confounders including BMI demonstrated a higher risk of OSAS in those with PCOS compared to non-PCOS (OR: 5.67). This finding suggests that other mechanistic factors besides weight such as hyperinsulinemia, hyperandrogenism and inflammation may also influence the OSAS-PCOS relationship (26). Insulin resistance and hyperinsulinemia, either directly or indirectly, through factors such as adiposity can lead to increase circulating androgen levels (6). The inflammatory and oxidative stress responses from recurrent episodes of apnea, coupled with cycles of hypoxia and reoxygenation in those with OSAS can also exacerbate the above pathophysiological features underpinning PCOS (41). It should be noted that despite prior meta-analysis reporting worse metabolic parameters (e.g., insulin resistance) in those with PCOS and OSAS compared to without OSAS (26), other common mechanistic factors like hyperandrogenism and insulin resistance linking PCOS and OSAS were not invariably measured independently of confounders like BMI. Many of their included studies were not included in our meta-analysis due to varying exclusion criteria (e.g., lack of PSG data) (16, 21). Further research is needed to understand the associations between pathophysiological risk factors of PCOS and the onset and progression of OSAS, including potential interactions with obesity.
To our knowledge, this meta-analysis is the first to comprehensively examine the prevalence and severity of OSAS and its related symptoms in PCOS. We included peer-reviewed published studies that utilized the PSG/polygraph tool along with related symptom assessments to ensure OSAS severity was well-defined and to minimize outcome detection bias. We followed rigorous, internationally endorsed methodology, guided by experts in the field as part of the 2023 PCOS Guideline update. We also assessed the certainty of the evidence at the outcome-level using the validated GRADE framework (33). Except for the composite OSA outcome where certainty of evidence was low, other symptom categories of OSAS outcomes (i.e., AHI≥5 only, AHI≥5 with symptoms, and AHI≥10 with symptoms) were deemed to have moderate certainty evidence. Similarly, publication bias assessments and rigorous quality and sensitivity analyses were conducted to enhance accuracy and minimize potential over- or under-estimation of results.
The main limitation of this review is that studies had a moderate to high risk of bias due to detection and selection biases. For example, some participants with PCOS were recruited from specialized clinics while healthy controls were drawn separately from the general population. The relatively small pooled sample sizes in this review (n = 280 PCOS and n = 662 non-PCOS) could have reduced the statistical power and generalizability of the results. Other limitations include, variable adjustment for important confounders such as age, BMI and ethnicity (16, 19, 20), the heterogenous BMI distribution of the study population, the varied definitions and assessment methods for OSA across studies that can lead to inconsistencies in reported outcomes. In addition, under-representation of ethnic and geographic groups (e.g., Asian or mixed-ethnicity) can restrict the generalizability of the findings. Finally, the heterogeneity in OSAS prevalence estimates (e.g., I² = 96.8% for OSAS in PCOS) signify variability population characteristics. Hence, the findings should be interpreted in view of these points. Nevertheless, the impact of the included studies is likely to be minimal, since the exclusion of these studies in sensitivity analysis did not influence the overall meta-analysis results. Due to the limited studies, single-paper analyses as well as subgroup analyses where only one study belonged to the comparison group should be interpreted with caution as this may lead to chance findings. Studies exploring PCOS population subgroups with varying symptomatic OSAS profiles are warranted, as are studies exploring ethnically diverse and adolescent populations, to enhance generalization to the global PCOS population. These are crucial evidence gaps as morbidity of OSAS is related to age and racial differences in both clinical and metabolic profiles of PCOS.
5 Conclusion
The present systematic review and meta-analysis found that, independent of PCOS diagnostic criteria, the overall risk of OSAS is markedly higher in PCOS compared with non-PCOS populations, especially in adult women, those with overweight/obesity and of white ethnicity, and was more pronounced with increasing symptomatic OSAS severity. Using the methodology from the 2023 International Evidence-based PCOS Guideline, our findings recommend that women with PCOS be screened for symptoms of OSAS using validated questionnaires combined with a thorough sleep apnea history to target OSA treatment to those more likely to benefit (1). Recognizing the heightened risk of OSAS in PCOS will aid in identifying those most susceptible, to enable the development of more effective and targeted strategies for OSAS treatment.
Author contributions
NJ: Data curation, Formal analysis, Visualization, Writing – original draft. AA: Data curation, Writing – review & editing. AS: Data curation, Formal analysis, Methodology, Writing – review & editing. SL: Data curation, Formal analysis, Methodology, Writing – review & editing. CB: Supervision, Writing – review & editing. LM: Supervision, Writing – review & editing. AM: Conceptualization, Supervision, Validation, Writing – review & editing. CT: Conceptualization, Supervision, Validation, Writing – review & editing. HT: Conceptualization, Supervision, Validation, Writing – review & editing. DM: Conceptualization, Supervision, Validation, Writing – review & editing.
Funding
The author(s) declare that financial support was received for the research and/or publication of this article. This work was supported by a Veski Fellowship (LM), National Health and Medical Research Council (NHMRC) fellowships (AM and HT), an NHMRC Centre for Research Excellence (CRE) in Women’s Health in Reproductive Life (CRE-WHiRL) (grant number 1171592) and an Australian Government Research Training Program (RTP) Scholarship (NAJ). The funders had no role in the design, analysis, or writing of this article.
Conflict of interest
The authors declare that the research was conducted in the absence of any commercial or financial relationships that could be construed as a potential conflict of interest.
The author(s) declared that they were an editorial board member of Frontiers, at the time of submission. This had no impact on the peer review process and the final decision.
Generative AI statement
The author(s) declare that no Generative AI was used in the creation of this manuscript.
Publisher’s note
All claims expressed in this article are solely those of the authors and do not necessarily represent those of their affiliated organizations, or those of the publisher, the editors and the reviewers. Any product that may be evaluated in this article, or claim that may be made by its manufacturer, is not guaranteed or endorsed by the publisher.
Supplementary material
The Supplementary Material for this article can be found online at: https://www.frontiersin.org/articles/10.3389/fendo.2025.1532519/full#supplementary-material
References
1. Teede HJ, Tay CT, Laven JJE, Dokras A, Moran LJ, Piltonen TT, et al. Recommendations from the 2023 international evidence-based guideline for the assessment and management of polycystic ovary syndrome. Eur J Endocrinol. (2023) 189:G43–64. doi: 10.1093/ejendo/lvad096
2. Bozdag G, Mumusoglu S, Zengin D, Karabulut E, Yildiz BO. The prevalence and phenotypic features of polycystic ovary syndrome: a systematic review and meta-analysis. Hum Reprod. (2016) 31:2841–55. doi: 10.1093/humrep/dew218
3. Naz MSG, Tehrani FR, Majd HA, Ahmadi F, Ozgoli G, Fakari FR, et al. The prevalence of polycystic ovary syndrome in adolescents: A systematic review and meta-analysis. Int J Reprod Biomed. (2019) 17:533–42. doi: 10.18502/ijrm.v17i8.4818
4. Eshre R, Group A-SPCW. Revised 2003 consensus on diagnostic criteria and long-term health risks related to polycystic ovary syndrome. Hum Reprod (Oxford England). (2004) 19:41–7. doi: 10.1093/humrep/deh098
5. Teede H, Deeks A, Moran L. Polycystic ovary syndrome: a complex condition with psychological, reproductive and metabolic manifestations that impacts on health across the lifespan. BMC Med. (2010) 8:1–10. doi: 10.1186/1741-7015-8-41
6. Diamanti-Kandarakis E, Dunaif A. Insulin resistance and the polycystic ovary syndrome revisited: an update on mechanisms and implications. Endocr Rev. (2012) 33:981–1030. doi: 10.1210/er.2011-1034
7. Sam S, Ehrmann DA. Pathogenesis and consequences of disordered sleep in PCOS. Clin Med Insights Reprod Health. (2019) 13:1179558119871269. doi: 10.1177/11795581198712
8. Kumarendran B, O’Reilly MW, Manolopoulos KN, Toulis KA, Gokhale KM, Sitch AJ, et al. Polycystic ovary syndrome, androgen excess, and the risk of nonalcoholic fatty liver disease in women: a longitudinal study based on a United Kingdom primary care database. PloS Med. (2018) 15:e1002542. doi: 10.1371/journal.pmed.1002542
9. Young T, Peppard PE, Gottlieb DJ. Epidemiology of obstructive sleep apnea: a population health perspective. Am J Respir Crit Care Med. (2002) 165:1217–39. doi: 10.1164/rccm.2109080
10. Jonas DE, Amick HR, Feltner C, Weber RP, Arvanitis M, Stine A, et al. Screening for obstructive sleep apnea in adults: an evidence review for the US preventive services task force. Rockville (MD: Agency for Healthcare Research and Quality (US (2017).
11. Douglas JA, Chai-Coetzer CL, McEvoy D, Naughton MT, Neill AM, Rochford P, et al. Guidelines for sleep studies in adults-a position statement of the Australasian Sleep Association. Sleep Med. (2017) 36:S2–S22. doi: 10.1016/j.sleep.2017.03.019
12. Parati G, Lombardi C, Narkiewicz K. Sleep apnea: epidemiology, pathophysiology, and relation to cardiovascular risk. Am J Physiol Regul Integr Comp Physiol. (2007) 293:R1671–R83. doi: 10.1152/ajpregu.00400.2007
13. Sam S, Tasali E. Role of obstructive sleep apnea in metabolic risk in PCOS. Curr Opin Endocr Metab Res. (2021) 17:46–51. doi: 10.1016/j.coemr.2021.01.002
14. Kahal H, Kyrou I, Uthman O, Brown A, Johnson S, Wall P, et al. The association between obstructive sleep apnea and metabolic abnormalities in women with polycystic ovary syndrome: a systematic review and meta-analysis. Sleep. (2018) 41:zsy085. doi: 10.1093/sleep/zsy085
15. Fogel RB, Malhotra A, Pillar G, Pittman SD, Dunaif A, White DP. Increased prevalence of obstructive sleep apnea syndrome in obese women with polycystic ovary syndrome. J Clin Endocrinol Metab. (2001) 86:1175–80. doi: 10.1210/jcem.86.3.7316
16. Vgontzas AN, Legro RS, Bixler EO, Grayev A, Kales A, Chrousos GP. Polycystic ovary syndrome is associated with obstructive sleep apnea and daytime sleepiness: role of insulin resistance. J Clin Endocrinol Metab. (2001) 86:517–20. doi: 10.1210/jcem.86.2.7185
17. Tasali E, Van Cauter E, Hoffman L, Ehrmann DA. Impact of obstructive sleep apnea on insulin resistance and glucose tolerance in women with polycystic ovary syndrome. J Clin Endocrinol Metab. (2008) 93:3878–84. doi: 10.1210/jc.2008-0925
18. Suri J, Suri JC, Chatterjee B, Mittal P, Adhikari T. Obesity may be the common pathway for sleep-disordered breathing in women with polycystic ovary syndrome. Sleep Med. (2016) 24:32–9. doi: 10.1016/j.sleep.2016.02.014
19. Hachul H, Polesel DN, Tock L, Carneiro G, Pereira AZ, Zanella MT, et al. Sleep disorders in polycystic ovary syndrome: influence of obesity and hyperandrogenism. Rev Assoc Med Bras. (2019) 65:375–83. doi: 10.1590/1806-9282.65.3.375
20. de Sousa G, Schlueter B, Menke T, Trowitzsch E, Andler W, Reinehr T. Relationships between polysomnographic variables, parameters of glucose metabolism, and serum androgens in obese adolescents with polycystic ovarian syndrome. J Sleep Res. (2011) 20:472–8. doi: 10.1111/j.1365-2869.2010.00902.x
21. Nandalike K, Agarwal C, Strauss T, Coupey SM, Isasi CR, Sin S, et al. Sleep and cardiometabolic function in obese adolescent girls with polycystic ovary syndrome. Sleep Med. (2012) 13:1307–12. doi: 10.1016/j.sleep.2012.07.002
22. Helvaci N, Karabulut E, Demir AU, Yildiz BO. Polycystic ovary syndrome and the risk of obstructive sleep apnea: a meta-analysis and review of the literature. Endocr Connect. (2017) 6:437. doi: 10.1530/EC-17-0129
23. Kahal H, Kyrou I, Uthman OA, Brown A, Johnson S, Wall PD, et al. The prevalence of obstructive sleep apnoea in women with polycystic ovary syndrome: a systematic review and meta-analysis. Sleep Breath. (2020) 24:339–50. doi: 10.1007/s11325-019-01835-1
24. Wang C, Huang T, Song W, Zhu J, Liu Y, Chen X, et al. A meta-analysis of the relationship between polycystic ovary syndrome and sleep disturbances risk. Front Physiol. (2022) 13:957112. doi: 10.3389/fphys.2022.957112
25. Zhang J, Ye J, Tao X, Lu W, Chen X, Liu C. Sleep disturbances, sleep quality, and cardiovascular risk factors in women with polycystic ovary syndrome: Systematic review and meta-analysis. Front Endocrinol. (2022) 2187:971604. doi: 10.3389/fendo.2022.971604
26. He J, Ruan X, Li J. Polycystic ovary syndrome in obstructive sleep apnea-hypopnea syndrome: an updated meta-analysis. Front Endocrinol. (2024) 15:1418933. doi: 10.3389/fendo.2024.1418933
27. Hung J-H, Hu L-Y, Tsai S-J, Yang AC, Huang M-W, Chen P-M, et al. Risk of psychiatric disorders following polycystic ovary syndrome: a nationwide population-based cohort study. PloS One. (2014) 9:e97041. doi: 10.1371/journal.pone.0097041
28. Sirmans SM, Parish RC, Blake S, Wang X. Epidemiology and comorbidities of polycystic ovary syndrome in an indigent population. J Invest Med. (2014) 62:868–74. doi: 10.1097/01.JIM.0000446834.90599.5d
29. VanHise K, Wang ET, Norris K, Azziz R, Pisarska MD, Chan JL. Racial and ethnic disparities in polycystic ovary syndrome. Fertil Steril. (2023) 119:348–54. doi: 10.1016/j.fertnstert.2023.01.031
30. Moher D, Liberati A, Tetzlaff J, Altman DG, Group P. Preferred reporting items for systematic reviews and meta-analyses: the PRISMA statement. Ann Intern Med. (2009) 151:264–9. doi: 10.7326/0003-4819-151-4-200908180-00135
31. Johns Mw. A new method for measuring daytime sleepiness: the Epworth sleepiness scale. Sleep. (1991) 14:540–5. doi: 10.1093/sleep/14.6.540
32. Sterne JA, Hernán MA, Reeves BC, Savović J, Berkman ND, Viswanathan M, et al. ROBINS-I: a tool for assessing risk of bias in non-randomised studies of interventions. BMJ. (2016) 355:i4919. doi: 10.1136/bmj.i4919
33. Guyatt GH, Oxman AD, Vist GE, Kunz R, Falck-Ytter Y, Alonso-Coello P, et al. GRADE: an emerging consensus on rating quality of evidence and strength of recommendations. BMJ. (2008) 336:924–6. doi: 10.1136/bmj.39489.470347.AD
34. McShane BB, Böckenholt U. Single-paper meta-analysis: Benefits for study summary, theory testing, and replicability. J Consum Res. (2017) 43:1048–63. doi: 10.1093/jcr/ucw085
35. Global InfoBase team WHO. The SuRF Report 2. Surveillance of chronic disease Risk Factors: Country-level data and comparable estimates. Geneva: World Health Organization (2005).
37. Higgins JP, Thompson SG. Quantifying heterogeneity in a meta-analysis. Stat Med. (2002) 21:1539–58. doi: 10.1002/sim.v21:11
38. Rothstein HR, Sutton AJ, Borenstein M. Publication bias in meta-analysis. Publication bias in meta-analysis: Prevention, assessment and adjustments. Chichester, England: John Wiley & Sons, Ltd (2005) p. 1–7.
39. Viswanathan M, Patnode CD, Berkman ND, Bass EB, Chang S, Hartling L, et al. Assessing the risk of bias in systematic reviews of health care interventions. In: Methods guide for effectiveness and comparative effectiveness reviews. Agency for Healthcare Research and Quality (US, Rockville (MD (2018).
40. Yang H-P, Kang J-H, Su H-Y, Tzeng C-R, Liu W-M, Huang S-Y. Apnea–hypopnea index in nonobese women with polycystic ovary syndrome. Int J Gynaecol Obstet. (2009) 105:226–9. doi: 10.1016/j.ijgo.2009.02.004
41. Jafar NK, Bennett CJ, Moran LJ, Mansfield DR. Beyond counting sheep: Exploring the link between polycystic ovary syndrome and sleep health. Semin Reprod Med. (2023) 41:045–58. doi: 10.1055/s-0043-1777724
42. Balk EM, Adam GP, Cao W, Bhuma MR, D’Ambrosio C, Trikalinos TA. Long-term effects on clinical event, mental health, and related outcomes of CPAP for obstructive sleep apnea: A systematic review. J Clin Sleep Med. (2024) 20:895–909. doi: 10.5664/jcsm.11030
43. Mangione CM, Barry MJ, Nicholson WK, Cabana M, Chelmow D, Coker TR, et al. Screening for obstructive sleep apnea in adults: US Preventive Services Task Force recommendation statement. JAMA. (2022) 328:1945–50. doi: 10.1001/jama.2022.20304
44. Cistulli PA, Grunstein RR, Sullivan CE. Effect of testosterone administration on upper airway collapsibility during sleep. Am J Respir Crit Care Med. (1994) 149:530–2. doi: 10.1164/ajrccm.149.2.8306057
45. Kang K-T, Chou C-H, Weng W-C, Lee P-L, Hsu W-C. Associations between adenotonsillar hypertrophy, age, and obesity in children with obstructive sleep apnea. PloS One. (2013) 8:e78666. doi: 10.1371/journal.pone.0078666
Keywords: polycystic ovary syndrome, obstructive sleep apnea syndrome, OSAS, systematic review, meta-analysis
Citation: Abdul Jafar NK, Al Balushi A, Subramanian A, Lee SI, Bennett CJ, Moran LJ, Mousa A, Tay CT, Teede HJ and Mansfield DR (2025) Obstructive sleep apnea syndrome in polycystic ovary syndrome: a systematic review and meta-analysis. Front. Endocrinol. 16:1532519. doi: 10.3389/fendo.2025.1532519
Received: 22 November 2024; Accepted: 14 March 2025;
Published: 04 April 2025.
Edited by:
Johannes Ott, Medical University of Vienna, AustriaReviewed by:
XueJiang Gu, First Affiliated Hospital of Wenzhou Medical University, ChinaYaqian Xu, First Affiliated Hospital of Anhui Medical University, China
Copyright © 2025 Abdul Jafar, Al Balushi, Subramanian, Lee, Bennett, Moran, Mousa, Tay, Teede and Mansfield. This is an open-access article distributed under the terms of the Creative Commons Attribution License (CC BY). The use, distribution or reproduction in other forums is permitted, provided the original author(s) and the copyright owner(s) are credited and that the original publication in this journal is cited, in accordance with accepted academic practice. No use, distribution or reproduction is permitted which does not comply with these terms.
*Correspondence: Darren R. Mansfield, RGFycmVuLk1hbnNmaWVsZEBtb25hc2hoZWFsdGgub3Jn
†ORCID: Darren R. Mansfield, orcid.org/0000-0002-0565-9846