Abstract
Background:
Thyroid hormone sensitivity indices represent a recently proposed clinical entity related to metabolic health outcomes. The link between thyroid hormone sensitivity and prediabetes is not clear. This population-based study investigated the association between thyroid hormone sensitivity indices and prediabetes.
Methods:
Among 5,783 participants over 20 years, after excluding those receiving thyroid medications or corticosteroid drugs, having thyroid surgery, having a history of cancer, pregnant women, and those with end-stage renal disease, 4,356 subjects were included in the study. The odds ratio (OR) and 95% confidence interval (95%CI) for prediabetes in the general and euthyroid population per 1-SD increase in thyroid hormone resistance indices (PFTQI, TSHI, and lnTT4RI) were reported with logistic regression models.
Results:
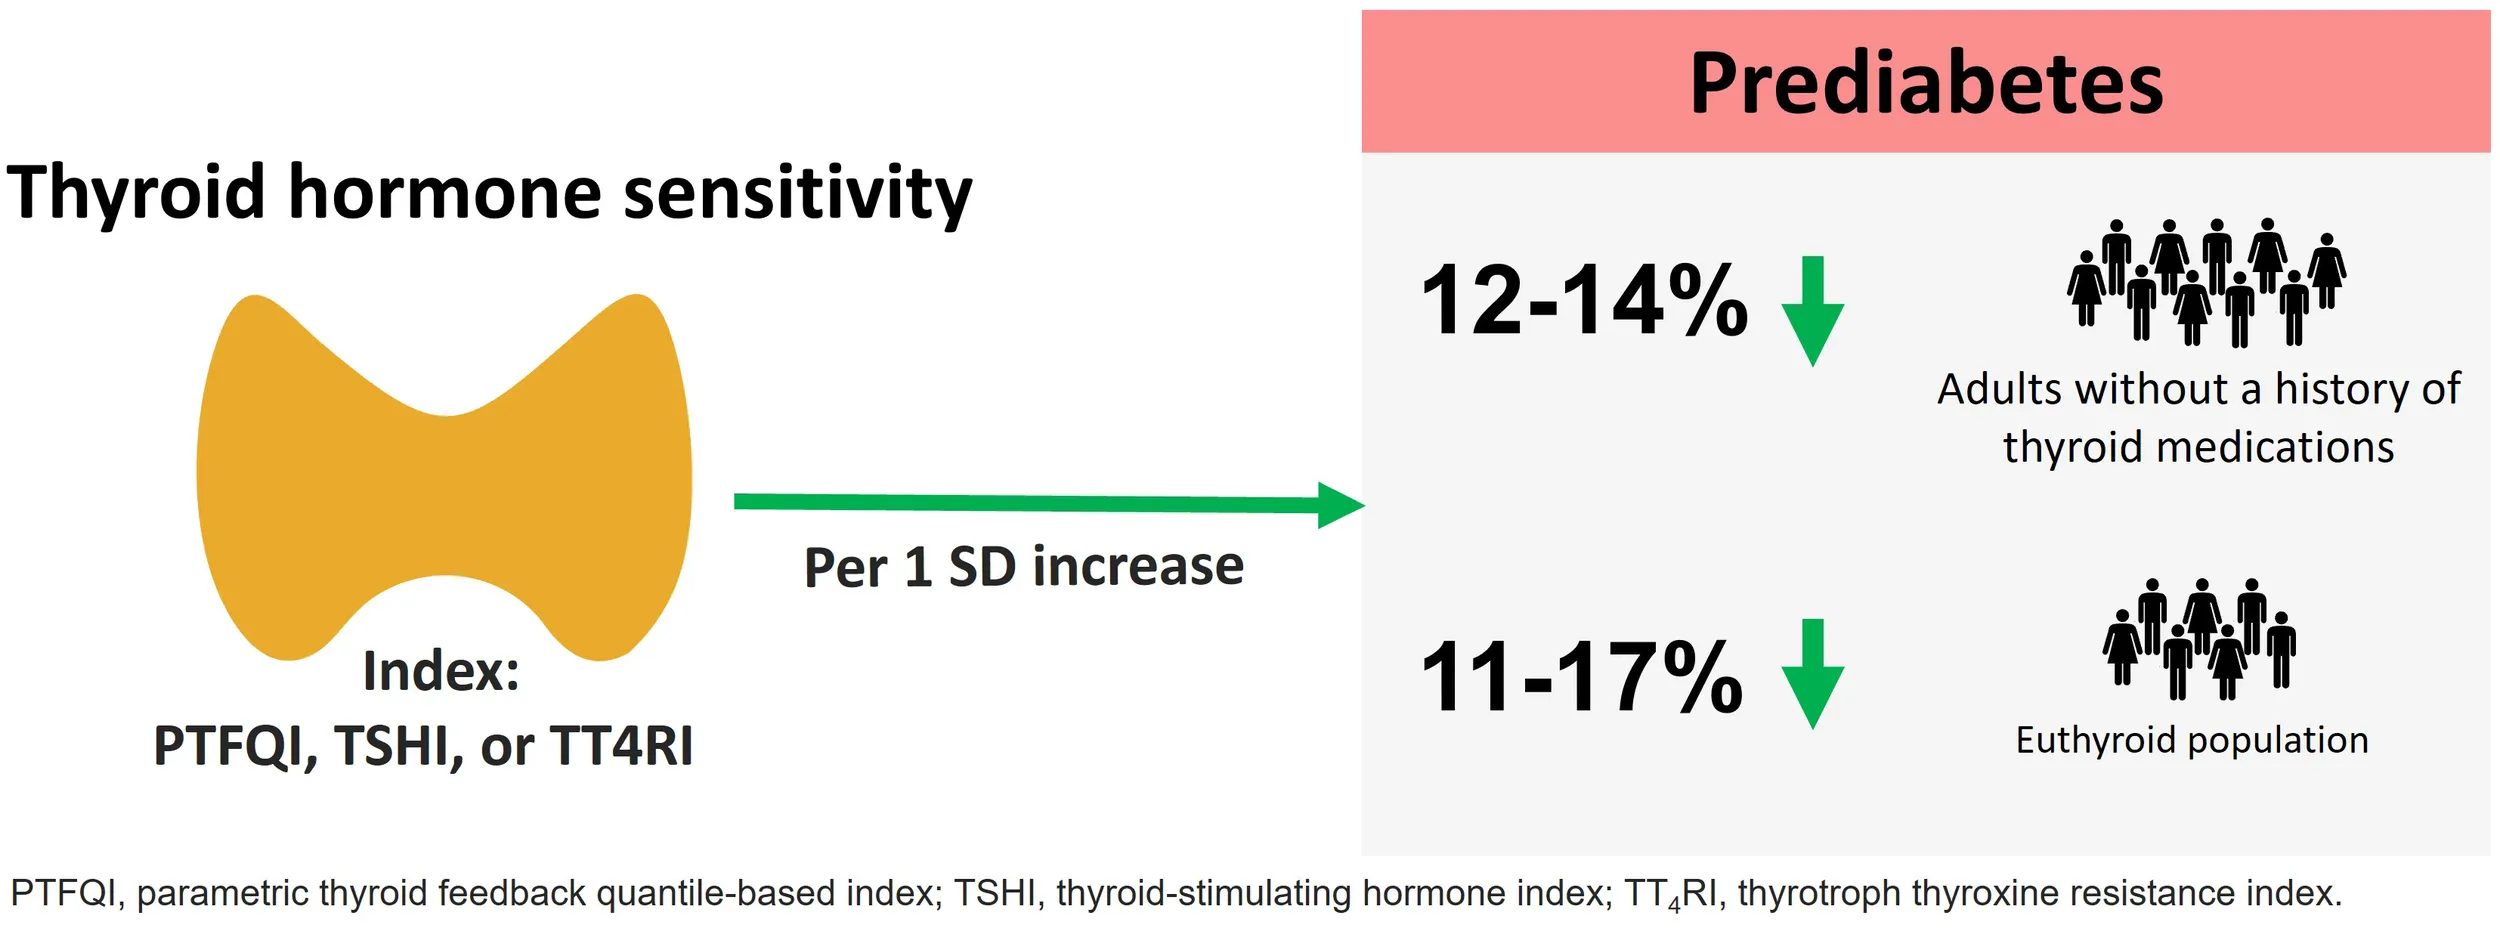
One SD increase in PTFQI was significantly associated with lower odds of prediabetes even after total adjustment (OR:0.88; 95%CI: 0.82–0.94). The association was observed in women, non-smokers, and those with negative anti-thyroid peroxidase antibodies. In the euthyroid subgroup, one SD increase in PTFQI, TSHI, and lnTT4RI showed lower odds of prediabetes and [PTFQI: 0.89 (95%CI: 0.83–0.97); TSHI: 0.83 (95%CI: 0.74–0.94); lnTT4RI: 0.83 (95%CI: 0.74–0.93)]. We also found a negative correlation between thyroid hormone sensitivity indices and fasting plasma glucose (PTFQI: r =-0.094, TSHI:-0.1, and lnTT4RI: r =-0.098) and 2-h post-challenge glucose (PTFQI: r =-0.096, TSHI:-0.054, and lnTT4RI: r =-0.031).
Conclusion:
Lower central sensitivity to thyroid hormone, as represented by increased TSHI, TT4RI, and PTFQI, is associated with a lower risk of prediabetes, even in euthyroid individuals.
Introduction
Prediabetes is a high-risk metabolic state characterized by intermediate hyperglycemia, affecting over 400 million adults worldwide (1, 2). Without intervention, nearly half of affected individuals progress to type 2 diabetes within five years, while also facing elevated risks of cardiovascular, renal, and neurological complications (3–6).
Thyroid hormones regulate glucose metabolism by modulating insulin sensitivity (via GLUT4 in muscle/fat) and hepatic glucose output (via PEPCK/G6Pase). Both hypothyroidism and hyperthyroidism have been suggested to influence insulin and glucose metabolism (7). Limited studies have explored the association between thyroid function and dysglycemia, and the results have been somewhat contradictory. A meta-analysis of 9 studies found a J-shaped relationship between thyroid-stimulating hormone (TSH, also known as thyrotropin) and free thyroxin (FT4) levels and diabetes (8). Thus, a more complex pathophysiological mechanism may drive the relationship between thyroid function and glucose homeostasis.
Elevated thyroid hormones and TSH suggest an acquired resistance to thyroid hormones in the general population, which may be present in those with normal thyroid function. Thyroid hormone sensitivity indices including parametric thyroid feedback quantile-based index (PTFQI) (9), thyrotrophic thyroxin resistance index (TT4RI) (10), and thyroid-stimulating hormone index (TSHI) (11) are valuable tools for assessing the sensitivity of peripheral tissues and the pituitary gland to thyroid hormones. They are particularly useful in conditions where standard thyroid function tests (TSH, fT4, fT3) may not fully reflect tissue-level thyroid hormone action, such as in resistance to thyroid hormone (RTH), central hypothyroidism, or non-thyroidal illness (NTI).
Despite the growing global burden of prediabetes, the role of thyroid hormone sensitivity - a potentially modifiable yet frequently overlooked metabolic factor - remains poorly understood in current clinical practice. While traditional risk factors like obesity and physical inactivity dominate prediabetes research, endocrine dysregulation (particularly thyroid function) offers a promising but underexplored avenue for early intervention. To date, most studies have focused on overt thyroid disease or isolated TSH/fT4 levels, with little attention to hypothalamic-pituitary-thyroid axis resistance—particularly in euthyroid individuals.
The investigation of thyroid hormone sensitivity in prediabetes is motivated by three critical evidence gaps in existing literature. First, while numerous studies have established associations between overt thyroid dysfunction (hypo-/hyperthyroidism) and diabetes risk (6, 12), the role of subclinical variations in thyroid hormone sensitivity—particularly within euthyroid ranges—remains poorly understood. Second, emerging research suggests that traditional thyroid markers (TSH/FT4) alone cannot fully explain metabolic dysregulation, as demonstrated by the J-shaped relationship between thyroid function and diabetes incidence (12). This paradox highlights the need to evaluate more sophisticated indices like PTFQI and TSHI that quantify central resistance to thyroid hormones (11, 13). Third, recent population studies reveal that even mild thyroid hormone resistance (reflected by elevated TSHI or TT4RI) is associated with altered glucose metabolism (9), yet no consensus exists on whether this relationship holds for prediabetes—a critical window for diabetes prevention. Our study directly addresses these gaps by examining thyroid sensitivity indices in a large, well-characterized cohort, thereby clarifying whether thyroid hormone resistance represents an independent risk factor or compensatory mechanism in early dysglycemia while stratifying for key subgroups (sex, smoking, autoimmunity).
Methods
Study design and study population
Tehran Thyroid Study (TTS) is a prospective population-based cohort study of the residents of District 13 of Tehran over 10 years, in 4 consecutive follow-ups from 1999–2009 within the Tehran Lipid and Glucose Study (TLGS) framework (14). The design and methodology of the TTS have been previously reported. A total of 5769 adults aged ≥ 20 years were selected using a random sampling method The current study is a cross-sectional analysis of baseline data (1999–2001) from the TTS cohort (15). The exclusion criteria in this study were the use of thyroid medications (n = 247), the use of antithyroid drugs (n = 12), thyroid surgery (n = 22), pregnant women (n = 22), history of cancer (n = 17), history of diabetes (n=843), use of corticosteroid drugs (n = 54), estimated glomerular filtration rate <30 mL/min/1.73m2 (n = 32), and missing data on covariates (n = 178). Finally, 4,356 subjects were included in this study (Figure 1).
Figure 1

Flow chart of the study participants. Participants from the Tehran Lipid and Glucose Study (TLGS) were randomly selected for participation in the Tehran Thyroid study to investigate Thyroid diseases and their risk factors. After excluding individuals based on predefined criteria such as missing data or pre-existing conditions, the final study population was included for analysis. Abbrev: TLGS, Tehran Lipid and Glucose Study; TTS, Tehran Thyroid Study; eGFR, estimated glomerular filtration rate.
History and clinical examination
Trained healthcare professionals used the predesigned questionnaire to collect basic demographics, drug history, family and personal history of thyroid diseases, radioactive iodine intake, education level, physical activity levels, and smoking habits. Physical activity was assessed by the Lipid Research Clinic (LRC) and the Modifiable Activity Questionnaires (MAQ) and reported in the metabolic equivalent of the task (MET) scale; participants with less than 600 MET per week of activity were categorized as individuals with low physical activity. Education level categories were defined as follows considering the degree and years of education: primary school (less than six years), high school (6–12 years), and higher education (>12 years). Current smokers were defined as the occasional or daily use of tobacco. Baseline physical examinations, including blood pressure (BP) and anthropometric measurements, were performed by trained physicians. BP was recorded as a mean of two BP measurements on the right arm and at the heart level after participants remained seated for 15 minutes. After removing shoes and being minimally clothed, anthropometric measurements were recorded. Digital scales and tape meters were used to measure weight and height. Waist circumference (WC) was measured at the narrowest waist level. Body mass index (BMI) was calculated by dividing weight (kg) by the square of the height (m).
Laboratory measurements
For all participants, after 12–14 hours of fasting overnight, blood samples were drawn between 7:00-9:00 AM. Within 30–45 minutes after collecting samples, they were centrifuged. Total cholesterol (TC), high-density lipoprotein cholesterol (HDL-C), fasting plasma glucose (FPG), and triglycerides (TG) were assayed. We performed the 75-gram oral glucose tolerance test (OGTT) for participants not taking glucose-lowering medications. The enzymatic colorimetric glucose oxidase method was used to assess fasting and 2-hour glucose concentrations. Serum TC and TG levels were recorded using the enzymatic calorimetric method with cholesterol esterase, cholesterol oxidase, and glycerol phosphate oxidase, respectively. Precipitation of the apolipoprotein B with lipoproteins and phosphotungstic acid was used to measure HDL-C.
An electrochemiluminescence immunoassay (ECLIA) with a Roche Diagnostics kit and a Roche/Hitachi Cobas e-411 analyzer (Roche GmbH, Mannheim, Germany) was used to measure TSH and FT4. An immunoenzymometric assay (IEMA) using a Sunrise ELISA reader (Tecan Co., Salzburg, Austria) was used to determine thyroid peroxidase antibodies (TPO-Ab).
Definitions
Prediabetes was diagnosed based on the American Diabetes Association (ADA) 2023 guidelines, which define prediabetes as: Fasting plasma glucose (FPG) levels of 100–125 mg/dL (5.6–6.9 mmol/L) [impaired fasting glucose (IFG)], or 2-hour post-challenge glucose (2hPCG) levels of 140–199 mg/dL (7.8–11.0 mmol/L) after a 75-g oral glucose tolerance test (OGTT) [impaired glucose tolerance (IGT) (16). Euthyroidism was defined as the absence of thyroid dysfunction, including both clinical and subclinical forms of hypothyroidism and hyperthyroidism, using the reference ranges of TSH (0.32-5.06 mU/L) and fT4 (0.91-1.55 ng/dL) derived from the current population.
TT4RI was calculated as fT4 (pmol/L) multiplied by TSH (mU/L) (10), while the TSHI was determined as ln TSH (mU/L) + 0.1345 × fT4 (pmol/L) (11). Additionally, PTFQI, a measure of thyroid hormone resistance, evaluates the pituitary’s sensitivity to thyroid hormones by assessing the relationship between TSH and free thyroxine (fT4), often derived from population-based quantile regression models. It was calculated as cdf fT4 − (1 − cdf TSH), where the cumulative distribution function (cdf) represents a probability function (17). This calculation was based on specific reference values for fT4 and TSH for the Iranian population and can be easily computed using basic spreadsheet formulas.
We also defined categories of non-obese (BMI<30kg/m2) and obese (BMI≥30kg/m2), normal and low HDL-C (< 40 mg/dl for men and < 50 mg/dL for women), normal and high TG (>150 mg/dL), normal and high TC (>200 mg/dL) and negative and positive anti-TPO (TPOAb> 35 IU/mL for females and TPOAb> 32 IU/mL for males) (18) for categorical adjustments in multivariate logistic regression analysis.
Statistical analysis
The baseline characteristics of participants were reported using mean ± standard deviation (SD) for continuous variables with normal distribution, median (interquartile range, IQR) for continuous variables with skewed distribution, and frequencies (%) for categorical variables. The normality of data was assessed using Kolmogorov-Smirnov (K-S) test and histograms with normally fitted curves. One-way analysis of variance (ANOVA), Kruskal-Wallis, and Chi-square tests were used to compare baseline characteristics of participants between the tertiles of PFTQI, TSHI, and TT4RI indices using means, medians, and frequencies, respectively.
Due to right-skewed distributions, TT4RI was natural log-transformed (lnTT4RI) for regression analyses. Results reflect ORs per 1-SD increase in lnTT4RI; back-transformed values are interpretable as multiplicative effects on the original scale.” We used multivariate logistic regression models to evaluate the association between thyroid hormone resistance indices (PFTQI, TSHI, and lnTT4RI) and prediabetes with both continuous and quartile approaches. The odds ratio (OR) and 95% confidence interval (95% CI) for prediabetes were reported for a 1-SD increase in thyroid sensitivity indices using the continuous approach and in comparison with the first tertile as the reference category in the tertile-based approach. Four models were defined: model 1 was adjusted for age and sex, model 2 was further adjusted for anti-TPO, model 3 was further adjusted for education level, smoking status, family history of diabetes, BMI, and physical activity, and model 4 was further adjusted for HDL-C, TG, and TC. In the tertile-based approach, the covariates in the models were adjusted categorically: anti-TPO (negative, positive), obesity (non-obese, obese), HDL-C (low, normal), TG (normal, high), and TC (normal, high). Moreover, the ORs for risk of prediabetes were examined in the euthyroid population. Finally, subgroup analysis of a 1-SD increase in thyroid hormone resistance indices based on sex (male or female), age (<45 or ≥45 years), anti-TPO (negative or positive), smoking (no or yes), and obesity (non-obese or obese) was performed. The correlation between thyroid hormone sensitivity indices and FPG and 2-hPCPG was also examined using the Spearman correlation. The statistical analysis was performed using STATA 17 (StataCorp, College Station, TX, USA) and R-3.0.3 (R Foundation for Statistical Computing, Vienna, Austria). Two-sided p-values less than 0.05 were considered statistically significant.
Results
Baseline characteristics of the study population
The baseline characteristics of the 4,356 study participants (43.0% male), with a mean age of 46.4 ± 13.7 years, are presented according to the PTFQI (Table 1), TSHI (Supplementary Table 1), and TT4RI tertiles (Supplementary Table 2). Participants in the highest tertile of PTFQI were younger, had lower WC, and had lower SBP, TG, and TC levels (p-value<0.001). TSH level was 2.1 (IQR: 1.4-3.4) mIU/L in the total population and 1.4 (IQR: 1.0-1.8), 2.7 (IQR: 1.7-4.4), and 2.9 (IQR: 2.1-4.1) in low, middle, and high tertiles of PTFQI index, respectively (p-value <0.001). In addition, the high TSHI and TT4RI tertile participants were younger and had lower WC and higher TSH levels.
Table 1
| Total | Low PTFQI (1st tertile)(-1, -0.05) | Medium PTFQI (2nd tertile)(-0.05,0.2) | High PTFQI (3rd tertile)(0.2-0.99) | p-value | |
|---|---|---|---|---|---|
| N=4,356 | N=1,452 | N=1,452 | N=1,452 | ||
| Categorical Variables | |||||
| Sex | 1,874 (43.0%) | 642 (44.2%) | 529 (36.5%) | 703 (48.4%) | <0.001 |
| Education level | <0.001 | ||||
| Primary school | 1,596 (36.6%) | 602 (41.4%) | 572 (39.4%) | 422 (29.1%) | |
| High school | 1,730 (39.7%) | 544 (37.4%) | 553 (38.1%) | 633 (43.6%) | |
| Diploma | 1,030 (23.6%) | 307 (21.1%) | 326 (22.5%) | 397 (27.3%) | |
| Current Smoker | 482 (11.1%) | 166 (11.4%) | 138 (9.5%) | 178 (12.3%) | 0.072 |
| Low physical activity | 2,890 (66.3%) | 966 (66.5%) | 995 (68.6%) | 929 (64.0%) | 0.029 |
| Family history of diabetes | 1,400 (32.1%) | 513 (35.3%) | 465 (32.0%) | 422 (29.1%) | 0.002 |
| Glycemic status | <0.001 | ||||
| Normoglycemia | 3,068 (70.4%) | 943 (64.9%) | 1,021 (70.4%) | 1,104 (76.0%) | |
| Prediabetes | 1,288 (29.6%) | 510 (35.1%) | 430 (29.6%) | 348 (24.0%) | |
| Continuous Variables | |||||
| Age (yrs) | 46.4 ±13.7 | 49.0 ±13.2 | 47.0 ±13.7 | 43.3 ±13.7 | <0.001 |
| Free T4 (ng/dl) | 1.2 ±0.3 | 1.1 ±0.1 | 1.1 ±0.5 | 1.3 ±0.1 | <0.001 |
| Body mass index (kg/m2) | 28.0 ±4.7 | 28.3 ±4.6 | 28.3 ±4.8 | 27.3 ±4.6 | <0.001 |
| Waist circumference (cm) | 94.3 ±11.5 | 95.4 ±11.3 | 94.7 ±11.5 | 92.8 ±11.6 | <0.001 |
| Systolic blood pressure (mmHg) | 115.9 ±17.4 | 117.0 ±18.1 | 116.5 ±17.5 | 114.3 ±16.4 | <0.001 |
| Diastolic blood pressure(mmHg) | 77.0 ±10.8 | 77.4 ±11.1 | 76.8 ±10.7 | 76.8 ±10.7 | 0.24 |
| Fasting plasma glucose (mg/dL) | 94.3 ±8.8 | 95.1 ±8.9 | 94.2 ±8.8 | 93.4 ±8.6 | <0.001 |
| 2hPCG (mg/dL) | 105.2 ±28.1 | 107.8 ±28.6 | 106.3 ±28.2 | 101.4 ±27.0 | <0.001 |
| Triglycerides (mg/dL) | 142.8 ±87.1 | 148.8 ±92.3 | 145.6 ±86.6 | 134.2 ±81.4 | <0.001 |
| Total cholesterol (mg/dL) | 192.1 ±38.3 | 195.7 ±39.5 | 193.7 ±38.5 | 186.8 ±36.2 | <0.001 |
| TSH (mU/L) | 2.1 (1.4-3.4) | 1.4 (1.0-1.8) | 2.7 (1.7-4.4) | 2.9 (2.1-4.1) | <0.001 |
| Anti-TPO (IU/mL) | 5.8 (3.4-12.4) | 4.9 (3.0-8.8) | 6.5 (3.5-19.6) | 6.2 (3.7-13.9) | <0.001 |
Baseline characteristics of the population based on PTFQI tertiles.
The categorical and continuous variables were reported as count (percentage), mean ± SD, and median (IQR), respectively. The first, second, and third tertiles of PTFQI were described as low, medium, and high PTFQI groups, respectively. Thyroid hormone sensitivity was calculated and represented using PTFQI (Parametric Thyroid Feedback Quantile-based Index).
Regarding glycemic status, 1288 (29.6%) individuals were prediabetic and 3068 (70.4%) had normal glycemic status. The prevalence of prediabetes was lower in higher tertiles of PTFQI, TT4RI, and TSHI indices (p-values<0.001). There was a negative correlation between FPG and all thyroid hormone sensitivity indices (PTFQI: r = -0.094, TSHI: -0.1, and lnTT4RI: r = -0.098) (Figures 2A–C). There was also a negative correlation between 2-hPCG and all thyroid hormone sensitivity indices (PTFQI: r = -0.096, TSHI: -0.054, and lnTT4RI: r = -0.031) (Figures 2D–F).
Figure 2

The correlation between fasting plasma glucose and (A) PTFQI, (B) TSHI, (C) lnTT4RI, and 2-hour post-challenge plasma glucose and (D) PTFQI, (E) TSHI, (F) lnTT4RI. Thyroid hormone sensitivity was calculated and represented using the following indices: PTFQI (Parametric Thyroid Feedback Quantile-based Index), TSHI (Thyroid-stimulating hormone index), TT4RI (Thyrotroph T4 Resistance Index). PTFQI, Parametric Thyroid Feedback Quantile-based Index; TSHI, Thyroid-stimulating hormone index; TT4RI, Thyrotroph T4 Resistance Index. To better illustrate the graphs, the participants with thyroid sensitivity indices three times below and above the standard deviation values of the study population were not displayed. Outliers were excluded from the figure for visual clarity but were included in all statistical analyses. Since the results did not change meaningfully when excluding these outliers, they were retained in the final analysis to preserve the full variability of the data.
Thyroid hormone sensitivity indices based on thyroid function
Participants were divided into hypothyroidism, euthyroidism, and hyperthyroidism groups based on their thyroid function. The mean/median of indices showed a significant reduction from hypothyroidism to euthyroidism and from euthyroidism to hyperthyroidism. The mean PTFQI index in each group is as follows: 0.2 ± 0.2 (hypothyroidism), 0.1 ± 0.3 (euthyroidism), and -0.3 ± 0.3 (hyperthyroidism) (P <0.001) (Supplementary Table 3). Moreover, Supplementary Table 4 summarizes the mean/median of these indices in overt hypothyroidism, subclinical hypothyroidism, euthyroidism, subclinical hyperthyroidism, and overt hyperthyroidism groups.
Association between thyroid hormone sensitivity indices and prediabetes
Table 2 represents ORs and 95% CIs for prediabetes per 1-SD increase of PTFQI, TSHI, and lnTT4RI in the total population. One SD increase in PTFQI, TSHI, and lnTT4RI index was significantly associated with lower odds of prediabetes in all models. In the fully adjusted model, there was still a significant association between PTFQI, TSHI, and lnTT4RI and prediabetes (OR: 0.88 (95%CI: 0.82-0.94) for a 1-SD increase in PTFQI; OR: 0.84 (95%CI: 0.79-0.93) for 1-SD increase in TSHI; OR: 0.88 (95%CI: 0.81-0.94) for 1-SD increase in TT4RI). In the euthyroid subgroup of the total population, the ORs for prediabetes per one unit increase in PTFQI, TSHI, and lnTT4RI were 0.89 (95%CI: 0.83-0.97), 0.83 (95%CI: 0.74-0.94), and 0.83 (95%CI: 0.74-0.93) (Table 3).
Table 2
| Odds ratio (95%CI) of prediabetes | |||||
|---|---|---|---|---|---|
| Crude | Model 1 | Model 2 | Model 3 | Model 4 | |
| PTFQI | 0.78 (0.73-0.83) | 0.85 (0.79-0.91) | 0.84 (0.79-0.91) | 0.87 (0.81-0.93) | 0.88 (0.82-0.94) |
| TSHI | 0.8 (0.74-0.86) | 0.88 (0.81-0.95) | 0.87 (0.8-0.94) | 0.87 (0.8-0.94) | 0.86 (0.79-0.93) |
| Ln TT4RI | 0.84 (0.79-0.9) | 0.91 (0.85-0.97) | 0.9 (0.84-0.97) | 0.89 (0.83-0.96) | 0.88 (0.81-0.94) |
Odds ratio (95%CI) of prediabetes per 1 SD increase in the thyroid hormone sensitivity indices.
Model 1: Adjusted for age and sex., Model 2: Adjusted for age, sex, and anti-TPO., Model 3: Adjusted for age, sex, anti-TPO, education level, smoking status, family history of diabetes, BMI, and physical activity, Model 4: Adjusted for age, sex, anti-TPO, education level, smoking status, family history of diabetes, BMI, physical activity, HDL cholesterol, triglyceride, and total cholesterol.
Thyroid hormone sensitivity was calculated and represented using the following indices: PTFQI (Parametric Thyroid Feedback Quantile-based Index), TSHI (Thyroid-stimulating hormone index), TT4RI (Thyrotroph T4 Resistance Index).
Table 3
| Odds ratio (95%CI) of prediabetes | |||||
|---|---|---|---|---|---|
| Crude | Model 1 | Model 2 | Model 3 | Model 4 | |
| PTFQI | 0.78 (0.73-0.84) | 0.86 (0.79-0.92) | 0.85 (0.79-0.92) | 0.88 (0.81-0.95) | 0.89 (0.83-0.97) |
| TSHI | 0.7 (0.63-0.78) | 0.81 (0.73-0.91) | 0.81 (0.72-0.91) | 0.82 (0.73-0.92) | 0.83 (0.74-0.94) |
| Ln TT4RI | 0.73 (0.66-0.82) | 0.84 (0.75-0.94) | 0.83 (0.75-0.93) | 0.83 (0.74-0.93) | 0.83 (0.74-0.93) |
Odds ratio (95%CI) of prediabetes per 1 SD increase in the thyroid hormone sensitivity indices in the euthyroid population.
Model 1: Adjusted for age and sex; Model 2: Adjusted for age, sex, and anti-tpo; Model 3: Adjusted for age, sex, anti-tpo, education level, smoking status, family history of diabetes, BMI, and physical activity; Model 4: Adjusted for age, sex, anti-tpo, education level, smoking status, family history of diabetes, BMI, physical activity, HDL cholesterol, triglyceride, and total cholesterol.
Thyroid hormone sensitivity was calculated and represented using the following indices: PTFQI (Parametric Thyroid Feedback Quantile-based Index), TSHI (Thyroid-stimulating hormone index), TT4RI (Thyrotroph T4 Resistance Index).
We also evaluated the association of thyroid hormone sensitivity indices using the tertile approach. The odds ratios for the risk of prediabetes in the general population based on tertiles of PTFQI, TSHI, and TT4RI indices are also available in Supplementary Tables 5, 6. Using the PTFQI index, the odds of prediabetes were significantly lower in the medium (OR= 0.82; 95%CI: 0.69–0.98) and high PTFQI (OR= 0.74; 95%CI: 0.62–0.89) group compared to the low PTFQI group. The participants with high TSHI and TT4RI also had a significantly decreased risk of prediabetes compared to their reference groups. The associations were consistent in the euthyroid subjects for tertiles of PTFQI, TSHI, and TT4RI indices (Supplementary Table 6).
Subgroup analysis
The association between PFTQI, TSHI, and TT4RI indices and the odds of prediabetes in different subgroups was evaluated (Table 4). The association was significant in age subgroups and both obese and non-obese participants. However, in other subgroups, the association was only observed in women, anti-TPO-negative subjects, and non-smokers. The odds of prediabetes in tertiles of PFTQI, TSHI, and TT4RI in different subgroups are also presented in Supplementary Tables 7–9.
Table 4
| Odds ratio (95%CI) of prediabetes | |||
|---|---|---|---|
| TSHI | Ln TT4RI | PTFQI | |
| Sex | |||
| Male | 0.89 (0.78-1) | 0.91 (0.81-1.02) | 0.91 (0.83-1.01) |
| Female | 0.83 (0.74-0.93) | 0.85 (0.77-0.93) | 0.83 (0.75-0.93) |
| Age | |||
| <45 years | 0.83 (0.72-0.95) | 0.86 (0.76-0.98) | 0.84 (0.75-0.94) |
| ≥45 years | 0.84 (0.76-0.93) | 0.85 (0.78-0.93) | 0.89 (0.81-0.97) |
| Anti-TPO | |||
| Negative | 0.82 (0.75-0.9) | 0.83 (0.76-0.91) | 0.87 (0.8-0.93) |
| Positive | 0.96 (0.84-1.1) | 1 (0.87-1.16) | 0.99 (0.78-1.25) |
| Smoking | |||
| No | 0.84 (0.77-0.91) | 0.85 (0.79-0.92) | 0.87 (0.81-0.94) |
| Yes | 0.98 (0.84-1.16) | 1.05 (0.85-1.3) | 0.91 (0.74-1.13) |
| Obesity | |||
| Non-obese | 0.86 (0.78-0.95) | 0.88 (0.8-0.96) | 0.88 (0.8-0.96) |
| Obese | 0.84 (0.73-0.97) | 0.86 (0.75-0.98) | 0.86 (0.76-0.97) |
Odds ratio (95%CI) of prediabetes per 1 SD increase in the thyroid hormone sensitivity indices in different subgroups.
Adjusted for age, sex, anti-TPO, education level, smoking status, family history of diabetes, BMI, physical activity, HDL cholesterol, triglyceride, and total cholesterol.
Thyroid hormone sensitivity was calculated and represented using the following indices: PTFQI (Parametric Thyroid Feedback Quantile-based Index), TSHI (Thyroid-stimulating hormone index), TT4RI (Thyrotroph T4 Resistance Index).
Discussion
The current population-based study is among the first studies investigating the association between prediabetes and thyroid hormone sensitivity in a relatively large sample size. There was a negative correlation between FPG and thyroid hormone resistance. Also, decreased central thyroid hormone sensitivity, as presented by increased TSHI, TT4RI, and PTFQI, was associated with a lower risk of prediabetes even in euthyroid individuals, those without thyroid autoimmunity, and in normal, overweight, and obese individuals. The association was not observed in men, smokers, and TPOAb-positive individuals. Thyroid hormones play a crucial role in regulating insulin resistance and glucose homeostasis. Many studies have demonstrated a significant association between thyroid dysfunction and thyroid hormones and type 2 diabetes mellitus (T2DM) or prediabetes (19, 20). More consistently, hypothyroidism was associated with diabetes and FBS (20–24). However, the association of higher free thyroid hormones (FT3/FT4) with the incidence of diabetes has been reported (25–27). In the population-based Tehran thyroid Study, the longitudinal trend of serum thyroid hormones toward hyperthyroidism, rising TSH, and decreasing ft4 serum values over 10 years were associated with the development of T2DM, using a joint modeling approach (28, 29). The association of higher serum TSH and free thyroid hormones with diabetes is inconsistent with the mechanism of regulating thyroid hormone through a negative feedback loop in the hypothalamus-pituitary–thyroid (HPT). These findings suggest that any deviation from the normal range of thyroid hormone levels, whether hypo or hyperthyroid, may contribute to an increased risk of glycemic dysregulation. Previous research inconsistencies emphasize that TSH or thyroid hormone levels alone may not fully account for the connection between the thyroid system and glycemic dysregulation. Based on the conflicting data regarding the supposed negative thyroid feedback loop and mixed findings on the metabolic impacts of hypo and hyperthyroidism, it is suggested that the simultaneous presence of high TSH and high thyroid hormones could indicate a form of mild acquired resistance to thyroid hormones. This could help explain the unexpected and controversial findings.
While several studies have assessed the association between thyroid hormone sensitivity and diabetes (9, 17, 30), its association with prediabetes is scarcely investigated in the literature (31). Our findings align with emerging evidence on thyroid-glucose interplay while highlighting unique aspects. The inverse association between central thyroid resistance indices (PTFQI, TSHI, TT4RI) and prediabetes corroborates Liu et al.’s (31) cross-sectional study in China (n=4,378), where higher PTFQI (reflecting reduced sensitivity) was linked to lower prediabetes risk (OR: 0.85, 95% CI: 0.76–0.95). This relationship is further supported by two key studies: (1) Yu et al.’s (32) multicenter retrospective analysis of 30,244 coronary heart disease patients, which demonstrated negative associations between central resistance indices (TSHI, TT4RI, PTFQI) and elevated blood glucose (EBG) risk (p<0.01 for trend), and (2) Liu et al.’s (33) longitudinal study of 2,927 pregnant women in South China, where increased central/peripheral thyroid resistance during early pregnancy predicted reduced gestational diabetes risk (OR: 0.72, 95% CI: 0.56–0.93). These findings collectively suggest a protective role of thyroid hormone resistance in early dysglycemia stages. However, our results contrast with Laclaustra et al. (9), who reported impaired sensitivity (higher indices) predicting diabetes in euthyroid individuals (HR: 1.35, 95% CI: 1.12–1.63). This discrepancy may reflect differences in: (i) outcome definitions (prediabetes vs. diabetes), as compensatory FT4 elevation in early metabolic dysfunction may transiently improve insulin sensitivity via TRβ-mediated mitochondrial uncoupling (33); and (ii) population characteristics (e.g., our cohort’s younger age [46.4 ± 13.7 years] vs. Laclaustra’s [55.7 ± 8.7 years]). Mechanistically, animal studies confirm TRβ activation enhances skeletal muscle glucose uptake (34), aligning with our observed negative correlations between resistance indices and FPG (r=−0.094 to −0.1).
The inverse association between thyroid resistance and prediabetes aligns with evidence that reduced thyroid hormone action may lower hepatic gluconeogenesis and improve peripheral insulin sensitivity (35). Other pathways include the insulin signaling pathway, genes regulating insulin resistance, and beta-cell proliferation (36), and hormonal regulation (leptin) interaction between the HPT axis and glucose metabolism (35). Most previous studies showed the positive association of serum TSH and the negative association of the level of FT3 and FT4 with insulin resistance. High serum TSH values in clinical and subclinical hypothyroidism levels were associated with comparable insulin resistance due to impaired translocation of GLUT4 glucose transporters on the plasma membrane, leading to decreased insulin-stimulated glucose disposal in muscle and adipose tissue. Individuals with lower central sensitivity to thyroid hormones often exhibit higher serum FT4 levels, potentially reducing the likelihood of developing prediabetes by enhancing insulin sensitivity and glucose utilization. Leptin is secreted by adipose tissue and regulates caloric intake, and energy storage may interact between the HPT axis and glucose metabolism. Changes in leptin levels have been observed in thyroid dysfunction, affecting feeding behavior, adiposity, and glucose metabolism (35, 37). The mechanisms linking central thyroid hormone sensitivity and the leptin pathway remain unclear.
While our cross-sectional study design precludes causality, alterations in glucose metabolism may influence thyroid hormone sensitivity, potentially disrupting thyroid physiology and, in turn, affecting glucose homeostasis. A 10-year cohort study in China on 7283 participants found no evidence that thyroid hormone sensitivity status could predict diabetes development in euthyroid people, and an increased fasting glucose level preceded reduced sensitivity to thyroid hormones (38). The reciprocal relationship between glucose metabolism and thyroid function implies that altered thyroid function may also impact glucose metabolism, warranting further investigation using longitudinal designs or experimental manipulations to clarify the mechanisms underlying this intricate association.
Sex differences in thyroid hormone sensitivity and metabolism may explain the stronger association between thyroid resistance indices and prediabetes observed in women. Women have higher levels of thyroid-binding globulin due to estrogen, which affects total thyroid hormone measurements but not necessarily free hormone levels or tissue sensitivity (39). Moreover, Estrogen has been shown to enhance central sensitivity to thyroid hormones via effects on hypothalamic-pituitary-thyroid (HPT) axis regulation (40). This could mean that subtle changes in thyroid hormone resistance might manifest differently in men, who lack this estrogen-mediated modulation, potentially explaining why no significant associations were observed in male participants. Also, there are notable differences in adipose tissue distribution and insulin sensitivity between the sexes with women tending to have greater subcutaneous fat deposition, while men accumulate more visceral adiposity—a known risk factor for insulin resistance and prediabetes. Visceral fat is more metabolically active and has been shown to promote inflammation and hepatic insulin resistance, which may modify the relationship between thyroid hormone signaling and glucose homeostasis (41).
Our study demonstrates an inverse association between central thyroid hormone sensitivity indices and prediabetes, particularly in euthyroid and anti-TPO-negative individuals. The absence of this association in anti-TPO-positive subjects suggests that thyroid autoimmunity may disrupt the metabolic effect of reduced thyroid hormone sensitivity, possibly through mechanisms involving low-grade inflammation or subtle thyroid dysfunction (42, 43). Anti-TPO antibodies, markers of autoimmune thyroiditis, have been linked to altered glucose metabolism in some studies, though results remain inconsistent (44). This highlights the need to consider autoimmune status when evaluating thyroid-glucose interactions, as anti-TPO positivity may identify a distinct subgroup with divergent metabolic responses.
This study is strengthened by its population-based design on a large sample size, which evaluated a novel idea assessing thyroid hormone sensitivity with prediabetes. Moreover, we investigated these relations in euthyroid patients as well as several subgroups of them that could provide researchers with a better understanding of the possible association and pathophysiology. While our findings suggest that decreased central thyroid sensitivity is associated with lower prediabetes risk, causality cannot be inferred due to the cross-sectional design. Unmeasured confounders (e.g., cortisol, glucagon, insulin) or residual thyroid-independent effects may contribute, though our adjustments for metabolic proxies (which correlate with insulin resistance and hormonal dysregulation) e.g. obesity, lipids, and thyroid autoimmunity, mitigate some concerns. Prospective studies with repeated thyroid/glucose measurements and mediation analyses are needed to confirm whether thyroid resistance directly mitigates diabetes risk or serves as a marker of other protective metabolic adaptations. We lacked data on the menstrual cycle phase and sex hormone levels (estradiol, progesterone) that are known to modulate both thyroid function and glucose homeostasis (45). While our large sample size may partially average out these effects, residual confounding remains possible. The exclusion of individuals on thyroid/antidiabetic medications was necessary to minimize confounding and isolate the intrinsic relationship between thyroid hormone sensitivity indices and prediabetes. While this enhances internal validity, it may limit generalizability to treated or clinically complex populations, as medication effects (e.g., levothyroxine or metformin altering thyroid/glucose metabolism) and disease-specific hormonal interactions were not captured. However, our findings remain highly applicable to the general euthyroid population, aligning with the study’s primary aim. Future studies should validate these associations in cohorts with medication use or overt thyroid disease, where altered thyroid-glucose interactions may differ. In this study, fT3 was not routinely measured due to cost constraints and lower clinical utility for population screening compared to TSH/fT4. Also, Peripheral conversion (via deiodinases) is influenced by non-thyroidal factors (e.g., inflammation, malnutrition) that could confound sensitivity indices. Therefore, it seems that our focus on central resistance (pituitary-thyroid feedback) is adequately captured by TSH-fT4 dynamics.
The results of the current study could give better insight into the inevitable role of metabolic dysfunction in thyroid hormone sensitivity. Our findings suggest that decreased central sensitivity to thyroid hormones could be a protective factor for prediabetes even in euthyroid and TPOAb-negative individuals. Our study offers a novel framework by introducing thyroid hormone sensitivity indices (PTFQI, TSHI, and TT4RI) as clinically useful tools to evaluate the role of central thyroid resistance in glucose metabolism, even in euthyroid individuals. These indices, calculated from routine thyroid function tests, may identify subpopulations at altered metabolic risk, bridging a gap between traditional thyroid diagnostics and glucose homeostasis. While promising, their prognostic utility warrants validation in longitudinal and interventional studies.
Future directions
Prospective studies should investigate whether changes in thyroid sensitivity indices precede prediabetes onset, leveraging longitudinal designs to establish causality. Incorporating FT3 measurements could refine peripheral sensitivity assessments, while mechanistic research should explore tissue-specific thyroid actions (e.g., via GLUT4 or leptin pathways (35). Stratification by anti-TPO status and integration of multi-omics data (e.g., metabolomics) may uncover shared pathways, offering insights for targeted prevention strategies.
Statements
Data availability statement
The raw data supporting the conclusions of this article will be made available by the authors, without undue reservation.
Ethics statement
The studies involving humans were approved by Human Research Review Committee of the Endocrine Research Center of Shahid Beheshti University of Medical Sciences, Tehran, Iran (IR.SBMU.ENDOCRINE.REC.1399.123). The studies were conducted in accordance with the local legislation and institutional requirements. The participants provided their written informed consent to participate in this study.
Author contributions
LM: Conceptualization, Investigation, Writing – review & editing. MH: Formal analysis, Methodology, Writing – original draft, Conceptualization, Data curation, Visualization. MT: Methodology, Validation, Writing – review & editing. MA: Writing – original draft. FA: Project administration, Resources, Writing – review & editing. AA: Supervision, Writing – review & editing.
Funding
The author(s) declare that no financial support was received for the research, authorship, and/or publication of this article.
Acknowledgments
The authors thank the study participants and the Tehran Thyroid S research team for their passionate support.
Conflict of interest
The authors declare that the research was conducted in the absence of any commercial or financial relationships that could be construed as a potential conflict of interest.
Generative AI statement
The author(s) declare that no Generative AI was used in the creation of this manuscript.
Publisher’s note
All claims expressed in this article are solely those of the authors and do not necessarily represent those of their affiliated organizations, or those of the publisher, the editors and the reviewers. Any product that may be evaluated in this article, or claim that may be made by its manufacturer, is not guaranteed or endorsed by the publisher.
Supplementary material
The Supplementary Material for this article can be found online at: https://www.frontiersin.org/articles/10.3389/fendo.2025.1534058/full#supplementary-material
References
1
Richter B Hemmingsen B Metzendorf MI Takwoingi Y . Development of type 2 diabetes mellitus in people with intermediate hyperglycaemia. Cochrane Database Syst Rev. 201810(10):CD012661. doi: 10.1002/14651858.CD012661.pub2
2
Saeedi P Petersohn I Salpea P Malanda B Karuranga S Unwin N et al . Global and regional diabetes prevalence estimates for 2019 and projections for 2030 and 2045: Results from the International Diabetes Federation Diabetes Atlas. Diabetes Res Clin Pract. (2019) 157:107843. doi: 10.1016/j.diabres.2019.107843
3
Liu ZK Wu KY Dai XT Che QZ Chen S Jia J et al . Grading effect of abnormal glucose status on arterial stiffness and a new threshold of 2-h post-load glucose based on a Chinese community study. J Diabetes Invest. (2018) 9:616–22. doi: 10.1111/jdi.2018.9.issue-3
4
Kim GS Oh HH Kim SH Kim BO Byun YS . Association between prediabetes (defined by HbA1 C, fasting plasma glucose, and impaired glucose tolerance) and the development of chronic kidney disease: a 9-year prospective cohort study. BMC Nephrol. (2019) 20:1–6. doi: 10.1186/s12882-019-1307-0
5
Lee CC Perkins BA Kayaniyil S Harris SB Retnakaran R Gerstein HC et al . Peripheral neuropathy and nerve dysfunction in individuals at high risk for type 2 diabetes: the PROMISE cohort. Diabetes Care. (2015) 38:793–800. doi: 10.2337/dc14-2585
6
Lawal Y Bello F Kaoje YS . Prediabetes deserves more attention: a review. Clin Diabetes. (2020) 38:328–38. doi: 10.2337/cd19-0101
7
Chen R-H Chen H-Y Man K-M Chen S-J Chen W Liu P-L et al . Thyroid diseases increased the risk of type 2 diabetes mellitus: a nation-wide cohort study. Medicine. (2019) 98:e15631. doi: 10.1097/MD.0000000000015631
8
Rong F Dai H Wu Y Li J Liu G Chen H et al . Association between thyroid dysfunction and type 2 diabetes: a meta-analysis of prospective observational studies. BMC Med. (2021) 19:257. doi: 10.1186/s12916-021-02121-2
9
Laclaustra M Moreno-Franco B Lou-Bonafonte JM Mateo-Gallego R Casasnovas JA Guallar-Castillon P et al . Impaired sensitivity to thyroid hormones is associated with diabetes and metabolic syndrome. Diabetes Care. (2019) 42:303–10. doi: 10.2337/dc18-1410
10
Yagi H Pohlenz J Hayashi Y Sakurai A Refetoff S . Resistance to thyroid hormone caused by two mutant thyroid hormone receptors beta, R243Q and R243W, with marked impairment of function that cannot be explained by altered in vitro 3,5,3’-triiodothyroinine binding affinity. J Clin Endocrinol Metab. (1997) 82:1608–14. doi: 10.1210/jcem.82.5.3945
11
Jostel A Ryder WD Shalet SM . The use of thyroid function tests in the diagnosis of hypopituitarism: definition and evaluation of the TSH Index. Clin Endocrinol (Oxf). (2009) 71:529–34. doi: 10.1111/j.1365-2265.2009.03534.x
12
Chaker L Ligthart S Korevaar TI Hofman A Franco OH Peeters RP et al . Thyroid function and risk of type 2 diabetes: a population-based prospective cohort study. BMC Med. (2016) 14:1–8. doi: 10.1186/s12916-016-0693-4
13
Dietrich JW Landgrafe G Fotiadou EH . TSH and thyrotropic agonists: key actors in thyroid homeostasis. J Thyroid Res. (2012) 2012:351864. doi: 10.1155/2012/351864
14
Azizi F Rahmani M Emami H Mirmiran P Hajipour R Madjid M et al . Cardiovascular risk factors in an Iranian urban population: Tehran lipid and glucose study (phase 1). Sozial und Praventivmedizin. (2002) 47:408–26. doi: 10.1007/s000380200008
15
Amouzegar A Mehran L Takyar M Abdi H Azizi F . Tehran thyroid study (TTS). Int J Endocrinol Metab. (2018) 16:e84727. doi: 10.5812/ijem.84727
16
ElSayed NA Aleppo G Aroda VR Bannuru RR Brown FM Bruemmer D et al . 2. Classification and diagnosis of diabetes: standards of care in diabetes—2023. Diabetes Care. (2022) 46:S19–40. doi: 10.2337/dc23-ad08
17
Alonso-Ventura V Civeira F Alvarado-Rosas A Lou-Bonafonte JM Calmarza P Moreno-Franco B et al . A cross-sectional study examining the parametric thyroid feedback quantile index and its relationship with metabolic and cardiovascular diseases. Thyroid. (2022) 32:1488–99. doi: 10.1089/thy.2022.0025
18
Amouzegar A Delshad H Mehran L Tohidi M Khafaji F Azizi F . Reference limit of thyrotropin (TSH) and free thyroxine (FT 4) in thyroperoxidase positive and negative subjects: a population based study. J Endocrinol Invest. (2013) 36:950–4.
19
Gu L Yang J Gong Y Ma Y Yan S Huang Y et al . Lower free thyroid hormone levels are associated with high blood glucose and insulin resistance; these normalize with metabolic improvement of type 2 diabetes. J Diabetes. (2021) 13:318–29. doi: 10.1111/1753-0407.13118
20
Chaker L Ligthart S Korevaar TI Hofman A Franco OH Peeters RP et al . Thyroid function and risk of type 2 diabetes: a population-based prospective cohort study. BMC Med. (2016) 14:150. doi: 10.1186/s12916-016-0693-4
21
Gronich N Deftereos SN Lavi I Persidis AS Abernethy DR Rennert G . Hypothyroidism is a risk factor for new-onset diabetes: A cohort study. Diabetes Care. (2015) 38:1657–64. doi: 10.2337/dc14-2515
22
Jun JE Jin SM Jee JH Bae JC Hur KY Lee MK et al . TSH increment and the risk of incident type 2 diabetes mellitus in euthyroid subjects. Endocrine. (2017) 55:944–53. doi: 10.1007/s12020-016-1221-1
23
Díez JJ Iglesias P . Subclinical hyperthyroidism in patients with type 2 diabetes. Endocrine. (2012) 42:157–63. doi: 10.1007/s12020-012-9621-3
24
Khassawneh AH Al-Mistarehi AH . Prevalence and predictors of thyroid dysfunction among type 2 diabetic patients: A case-control study. Int J Gen Med. (2020) 13:803–16. doi: 10.2147/IJGM.S273900
25
Ittermann T Schipf S Dörr M Thuesen BH Jørgensen T Völzke H et al . Hyperthyroxinemia is positively associated with prevalent and incident type 2 diabetes mellitus in two population-based samples from Northeast Germany and Denmark. Nutr Metab Cardiovasc Dis: NMCD. (2018) 28:173–9. doi: 10.1016/j.numecd.2017.10.016
26
Lertrit A Chailurkit LO Ongphiphadhanakul B Aekplakorn W Sriphrapradang C . Thyroid function is associated with body mass index and fasting plasma glucose in Thai euthyroid population. Diabetes Metab Syndr. (2019) 13:468–73. doi: 10.1016/j.dsx.2018.11.004
27
Gu Y Li H Bao X Zhang Q Liu L Meng G et al . The relationship between thyroid function and the prevalence of type 2 diabetes mellitus in euthyroid subjects. J Clin Endocrinol Metab. (2017) 102:434–42. doi: 10.1210/jc.2016-2965
28
Amirabadizadeh A Mehran L Amouzegar A Asgari S Khalili D Azizi F . Association between changes in thyroid hormones and incident type 2 diabetes using joint models of longitudinal and time-to-event data: more than a decade follow up in the Tehran thyroid study. Front Endocrinol. (2024) 15:1475286. doi: 10.3389/fendo.2024.1475286
29
Amirabadizadeh A Ghorbani A Azizi F Abdi H Amouzegar A . Exploring the bidirectional association between thyrotropin and thyroid hormones in type 2 diabetes: a systematic review and meta-analysis. J Diabetes Metab Disord. (2025) 24:98. doi: 10.1007/s40200-025-01612-w
30
Mehran L Delbari N Amouzegar A Hasheminia M Tohidi M Azizi F . Reduced sensitivity to thyroid hormone is associated with diabetes and hypertension. J Clin Endocrinol Metab. (2022) 107:167–76. doi: 10.1210/clinem/dgab646
31
Liu B Wang Z Fu J Guan H Lyu Z Wang W . Sensitivity to thyroid hormones and risk of prediabetes: A cross-sectional study. Front Endocrinol. (2021) 12:657114. doi: 10.3389/fendo.2021.657114
32
Yu L Li Z Yang R Pan G Cheng Q He Y et al . Impaired sensitivity to thyroid hormones is associated with elevated blood glucose in coronary heart disease. Front Endocrinol. (2022) 13:895843. doi: 10.3389/fendo.2022.895843
33
Liu Z-M Li G Wu Y Zhang D Zhang S Hao Y-T et al . Increased central and peripheral thyroid resistance indices during the first half of gestation were associated with lowered risk of gestational diabetes—analyses based on Huizhou birth cohort in South China. Front Endocrinol. (2022) 13:806256. doi: 10.3389/fendo.2022.806256
34
Martinez B Ortiz RM . Thyroid hormone regulation and insulin resistance: insights from animals naturally adapted to fasting. Physiol (Bethesda Md). (2017) 32:141–51. doi: 10.1152/physiol.00018.2016
35
Mullur R Liu Y-Y Brent GA . Thyroid hormone regulation of metabolism. Physiol Rev. (2014) 94:355–82. doi: 10.1152/physrev.00030.2013
36
Santini F Marzullo P Rotondi M Ceccarini G Pagano L Ippolito S et al . Mechanisms in endocrinology: the crosstalk between thyroid gland and adipose tissue: signal integration in health and disease. Eur J Endocrinol. (2014) 171:R137–52. doi: 10.1530/EJE-14-0067
37
Pereira S Cline DL Glavas MM Covey SD Kieffer TJ . Tissue-specific effects of leptin on glucose and lipid metabolism. Endocr Rev. (2021) 42:1–28. doi: 10.1210/endrev/bnaa027
38
Cui C Sui H Wang Z Zhang T Zheng J Yan H et al . Thyroid hormone sensitivity and diabetes onset: a longitudinal cross-lagged cohort. Front Endocrinol. (2023) 14:1267612. doi: 10.3389/fendo.2023.1267612
39
Dowling JT Freinkel N Ingbar SH . The effect of estrogens upon the peripheral metabolism of thyroxine. J Clin Invest. (1960) 39:1119–30. doi: 10.1172/JCI104127
40
De Lean A Ferland L Drouin J Kelly P Labrie F . Modulation of pituitary thyrotropin releasing hormone receptor levels by estrogens and thyroid hormones. Endocrinology. (1977) 100:1496–504. doi: 10.1210/endo-100-6-1496
41
Wajchenberg BL . Subcutaneous and visceral adipose tissue: their relation to the metabolic syndrome. Endocr Rev. (2000) 21:697–738. doi: 10.1210/edrv.21.6.0415
42
Maratou E Hadjidakis DJ Peppa M Alevizaki M Tsegka K Lambadiari V et al . Studies of insulin resistance in patients with clinical and subclinical hyperthyroidism. Eur J Endocrinol. (2010) 163:625–30. doi: 10.1530/EJE-10-0246
43
Pyzik A Grywalska E Matyjaszek-Matuszek B Roliński J . Immune disorders in Hashimoto’s thyroiditis: what do we know so far? J Immunol Res. (2015) 2015:979167. doi: 10.1155/2015/979167
44
Blaslov K Gajski D Vucelić V Gaćina P Mirošević G Marinković J et al . The association of subclinical insulin resistance with thyroid autoimmunity in euthyroid individuals. Acta Clin Croatica. (2020) 59:696. doi: 10.20471/acc.2020.59.04.16
45
Mauvais-Jarvis F Clegg DJ Hevener AL . The role of estrogens in control of energy balance and glucose homeostasis. Endocr Rev. (2013) 34:309–38. doi: 10.1210/er.2012-1055
Summary
Keywords
thyroid function, parametric thyroid feedback quantile-based index, thyroid hormone resistance, prediabetes, thyroid-stimulating hormone index, thyrotrophic thyroxin resistance index
Citation
Mehran L, Honarvar M, Tohidi M, Adib M, Azizi F and Amouzegar A (2025) Association between central thyroid hormone sensitivity and prediabetes: Tehran thyroid study. Front. Endocrinol. 16:1534058. doi: 10.3389/fendo.2025.1534058
Received
25 November 2024
Accepted
26 May 2025
Published
17 June 2025
Volume
16 - 2025
Edited by
Maroof Alam, University of Michigan, United States
Reviewed by
Dharma Lindarto, Departement of Internal Medicine, Indonesia
Nihal Medatwal, Stony Brook University, United States
Dr Mritunjay Kumar Mishra, GMERS Medical College, India
Sadia Choudhury Shimmi, Universiti Malaysia Sabah, Malaysia
Updates
Copyright
© 2025 Mehran, Honarvar, Tohidi, Adib, Azizi and Amouzegar.
This is an open-access article distributed under the terms of the Creative Commons Attribution License (CC BY). The use, distribution or reproduction in other forums is permitted, provided the original author(s) and the copyright owner(s) are credited and that the original publication in this journal is cited, in accordance with accepted academic practice. No use, distribution or reproduction is permitted which does not comply with these terms.
*Correspondence: Atieh Amouzegar, amouzegar@endocrine.ac.ir
†ORCID: Atieh Amouzegar, orcid.org/0000-0001-9433-9408
Disclaimer
All claims expressed in this article are solely those of the authors and do not necessarily represent those of their affiliated organizations, or those of the publisher, the editors and the reviewers. Any product that may be evaluated in this article or claim that may be made by its manufacturer is not guaranteed or endorsed by the publisher.