 Lei Chen
 Bowen Qiu1†
 Yuan Lu
 Wenliang Che
 Wensu Chen
- 1Department of Cardiology, The Affiliated Hospital of Xuzhou Medical University, Xuzhou, China
- 2Department of Cardiology, Shanghai Tenth People’s Hospital, Tongji University School of Medicine, Shanghai, China
Background: Extracellular volume (ECV) is an important marker of myocardial fibrosis. However, the prognostic role of ECV in diabetes patients is unknown. In addition, synthetic ECV without blood sampling has not been reported in diabetes cohorts. This study investigated the establishment and validation of synthetic ECV and its prognostic value in type 2 diabetes mellitus (T2DM) patients with acute myocardial infarction (AMI).
Methods: This single-center retrospective study included T2DM patients with AMI who completed cardiac magnetic resonance (CMR) during hospitalization. The patients were randomly divided into a derivation group and a validation group. MACE included all-cause death, recurrent MI, stroke, or heart failure. ECV in integral (Integral ECV), non-myocardial infarction region (NMI-ECV), and myocardial infarction region (MI-ECV) was obtained by CMR.
Results: The study included 157 patients, with a median time from admission to CMR of 4 days. Bland-Altman and Pearson analysis showed good consistency and correlation between conventional ECV and synthetic ECV. Cox regression showed that Integral ECV (HR=1.07; 95%CI: 1.01 ~ 1.13, p = 0.023), MI-ECV (HR=1.03; 95%CI: 1.00 ~ 1.07, p = 0.024), and NMI-ECV (HR=1.07; 95%CI: 1.00 ~ 1.14, p = 0.039) were independently associated with MACE in different models. Kaplan-Meier analysis indicated that patients with a high synthetic ECV had a significantly higher MACE risk.
Conclusions: Synthetic ECV is strongly consistent and correlated with conventional ECV in T2DM patients with AMI. Elevated synthetic ECV is an independent risk factor for MACE in T2DM patients with AMI.
Introduction
Acute myocardial infarction (AMI) is one of the leading causes of death in the population worldwide, and type 2 diabetes mellitus (T2DM) is a major risk factor for AMI (1). Patients with diabetes have a higher risk of major adverse cardiovascular events (MACE) after AMI compared to patients without diabetes (2, 3). Although the pathophysiology of diabetes leading to cardiovascular disease is not fully understood, what can be confirmed is that myocardial fibrosis plays a key role (4). Myocardial fibrosis has been found to occur in diabetic patients in previous autopsy studies even in the absence of signs of ischemic heart disease (5, 6). Thus, myocardial fibrosis may play an important role in T2DM patients with AMI.
Histology remains the gold standard for myocardial fibrosis. However, endomyocardial biopsy is an invasive procedure that is neither reasonable nor feasible in the acute phase of AMI (7). Among the various noninvasive imaging modalities, cardiac magnetic resonance (CMR) has emerged as the most powerful tool for characterizing structural and functional changes in tissues. Extracellular volume (ECV) allows quantification of the extracellular matrix with good reproducibility and is termed “noninvasive” or “virtual biopsy” (8–10). As an alternative to myocardial fibrosis, ECV has been shown to independently predict MACE risk in a variety of diseases, including diabetes (11).
Conventional ECV measurements need to be combined with hematocrit (HCT), but HCT is highly individualized and is affected by several factors such as time of day and body position (12–14). To minimize the interference of variability, the Society for Cardiovascular Magnetic Resonance (SCMR) recommends blood collection within 24 hours of the CMR scan, which limits the routine clinical application of ECV measurement (15). In addition, conventional ECV is estimated from venous blood HCT, whereas ideally ECV calculations should be obtained from a left ventricular blood pool representing arterial blood (16). Indeed, a linear relationship between HCT and blood pool R1 (1/T1) has been extensively described (16–19). Based on this linear relationship, a method to determine synthetic ECV without blood sampling has been proposed. In these studies, good agreement was demonstrated between synthetic and conventional ECV (16, 20–22). However, the establishment and validation of synthetic ECV in diabetes patients have not been reported, and the prognostic value of different regional ECV in diabetes patients is unclear.
The main objectives of this study were as follows: First, to investigate the establishment and validation of synthetic ECV without blood sampling in T2DM patients with AMI; Second, to investigate the prognostic value of ECV from different regions in T2DM patients with AMI.
Methods
Study population
This retrospective study included T2DM patients with AMI at the Affiliated Hospital of Xuzhou Medical University from May 2019 to June 2024. Inclusion criteria: 1. Underwent CMR with T1 mapping sequences during hospitalization; 2. Underwent coronary angiography (CAG) and successful revascularization therapy (TIMI ≥ 2). Exclusion criteria: 1. Without HCT within 24 hours of the CMR examination; 2. Poor image quality; 3. History of myocardial infarction; 4. Malignancy, or inflammatory disease; 5. Severe renal insufficiency; 6.Blood disease. The Institutional Review Board (IRB) approved the study protocol (XYFY2023-KL199-01). Considering this was a retrospective study with no risk to patients, the informed consent was waived by the IRB. The patients were randomly divided into a derivation group (n = 80) and a validation group (n = 77). The clinical data, relevant laboratory indexes, and medications were obtained from the patient’s clinical records. Peak values of high-sensitivity troponin T (hs-TnT), high-sensitivity C-reactive protein (hs-CRP), and N-terminal pro-B-type natriuretic peptide (NT-proBNP) during hospitalization were collected. Infarct-related arteries (IRA) were recorded based on CAG. Considering the interference of stress glucose elevation, only patients diagnosed with T2DM before the current AMI were included in this study (Supplementary Figure 1).
Cardiac MRI protocol and cardiac MRI-related parameters
The median time to CMR completion was 4 (3.5, 6) days after hospitalization. The detailed parameters of CMR have been described in our earlier publications (23, 24). CMR assessments were conducted using 3.0 T imaging systems (Ingenia, Philips, The Netherlands). A balanced turbo field echo (BTFE) sequence was implemented. Scan parameters: slice thickness = 7 mm, no interlayer gap; echo time (TE) = 1.47 ms, repetition time (TR) = 2.94 ms; flip angle = 60°, field of view (FOV) = 300 × 300 mm, matrix = 280 × 240 mm and voxel size = 1.22 × 1.22 × 8.0 mm3. Following the administration of a gadolinium-based contrast agent (0.1 mmol/kg), short-axis images encompassing the left ventricle (LV) were obtained with 3 to 5 slices, and T1-mapping (MOLLI) was performed 10 to 15 minutes both before and after the application of the contrast medium. The CVI42 (cvi42® version 5.13.5, Circle Cardiovascular Imaging, Canada) was used for image analysis. The analysis of CMR images was carried out independently by two skilled physicians who did not know this study. End-diastolic volume (EDV), end-systolic volume (ESV), and left ventricular ejection fraction (LVEF) values were automatically derived and adjusted for body surface area (BSA). CMR feature tracking was used to measure the global longitudinal strain (GLS). Microvascular obstruction (MVO) and late gadolinium enhancement (LGE) were adjusted for the total left ventricular myocardial mass. The endocardial, epicardial, and blood pool were identified on a short-axis view to evaluate the T1 relaxation time. Average relaxation times (≥1 cm²) for two regions of interest (ROI) were recorded at both the myocardial infarction region and the non-infarction region. The limbic area and papillary muscles were meticulously avoided. The T1 value concerning the blood pool was derived from the left ventricle. Conventional ECV was computed using previously established equations: ECV = (1-HCT) × (1/Myocardial enhanced T1 -1/Myocardial native T1)/(1/Blood pool enhanced T1 -1/Blood pool native T1). ECV in integral (Integral ECV), non-myocardial infarction region (NMI-ECV), and myocardial infarction region (MI-ECV) was obtained (Supplementary Figure 2).
Calculation of synthetic ECV
Within the derivation group, an analysis was conducted on the reciprocal longitudinal relaxation time of blood (R1 = 1/T1) and HCT to explore their linear correlation, resulting in a formula for synthetic HCT. In the validation group, the synthetic ECV was then calculated by applying the synthetic HCT values. The synthetic ECV was verified by the analysis with conventional ECV in the validation group. In all patients, synthetic ECV from different regions was calculated to investigate the prognostic value in patients with AMI combined with diabetes.
Clinical outcomes and follow-up
Patients were followed up from their discharge via outpatient appointments and/or telephone communications utilizing a standardized questionnaire. In cases where the patient was unreachable, pertinent information was obtained from the patient’s family members or healthcare provider. The main follow-up endpoint was MACE, which included all-cause mortality, recurrent myocardial infarction (MI), stroke, or heart failure. The diagnosis of recurrent MI and heart failure was made following the latest guidelines from the European Society of Cardiology (ESC) (25, 26). Stroke was characterized as neurological impairment and cerebrovascular damage resulting from either cerebral ischemia or hemorrhage (27). Any patients who could not be followed up were confirmed deceased through the local official household registry.
Statistical analysis
Statistical analysis was performed using SPSS 26.0 (IBM, Chicago, USA). To evaluate the normality of the data, the Kolmogorov-Smirnov test was used. Continuous variables that followed a normal distribution were represented as mean ± standard deviation (SD), with subsequent analysis performed using Student’s t-test. Continuous variables that did not conform to normal distribution were summarized as median (Q25, Q75), and analyzed using a nonparametric test. Categorical variables were depicted in terms of frequencies and percentages, and analyzed through the chi-square test (count >5) or Fisher test (count ≤5). For the derivation group, linear regression analysis was conducted to derive the synthetic HCT formula. In the validation group, a Bland-Altman analysis was executed to evaluate the consistency between synthetic and conventional ECV. The Pearson correlation coefficient was calculated to assess relationships among continuous variable gates. To examine the association of ECV with MACE, Cox regression models were utilized. Variables associated with MACE (p < 0.1) in univariate analysis were incorporated into the multivariate model using a stepwise forward approach. To eliminate collinear interference, Integral ECV, NMI-ECV, and MI-ECV were analyzed in separate multivariate Cox regression models. Receiver operating characteristic (ROC) curve was applied to evaluate the capability of ECV in identifying MACE. Based on the cut-off values derived from the ROC analysis, all patients were stratified into two groups for Kaplan-Meier curve analysis. All P values are from two-sided tests and results were considered statistically significant at p < 0.05.
Results
Establishment of an ECV model without blood sampling
The derivation group was used to calculate the linear regression equation of synthetic HCT and ECV. There were no statistical differences in baseline characteristics between the derivation and validation groups (Supplementary Table 1). In the derivation group, R1 and conventional HCT had a linear correlation (R^2 = 0.29, p < 0.001). Through linear regression analysis, R1 was used to derive the formula to estimate synthetic HCT: HCT=697.95* (1/Blood pool T1) + 0.03207 (Supplementary Figure 3).
Validation of an ECV model without blood sampling
In the validation group, the formula was used to calculate the synthetic HCT. Then, the synthetic HCT was used to calculate synthetic ECV. In the validation group, there was no statistical difference between conventional HCT and synthetic HCT. Also, there was no statistical difference between conventional ECV and synthetic ECV from different regions (Figure 1; Table 1). Bland-Altman analysis showed good consistency between the conventional HCT and the synthetic HCT (Bias = 0.38). The synthetic ECV and conventional ECV in Integral, NMI, and MI also showed high consistency in the verification group (Bias = -0.16, -0.15, and -0.01, respectively) (Figure 2). In addition, the conventional HCT and the synthetic HCT showed a linear correlation (R^2 = 0.33, p<0.001); the synthetic ECV and conventional ECV in Integral, NMI, and MI also showed a good linear correlation (R^2 = 0.89, p<0.001; R^2 = 0.92, p<0.001; R^2 = 0.86, p<0.001; respectively) (Figure 3).
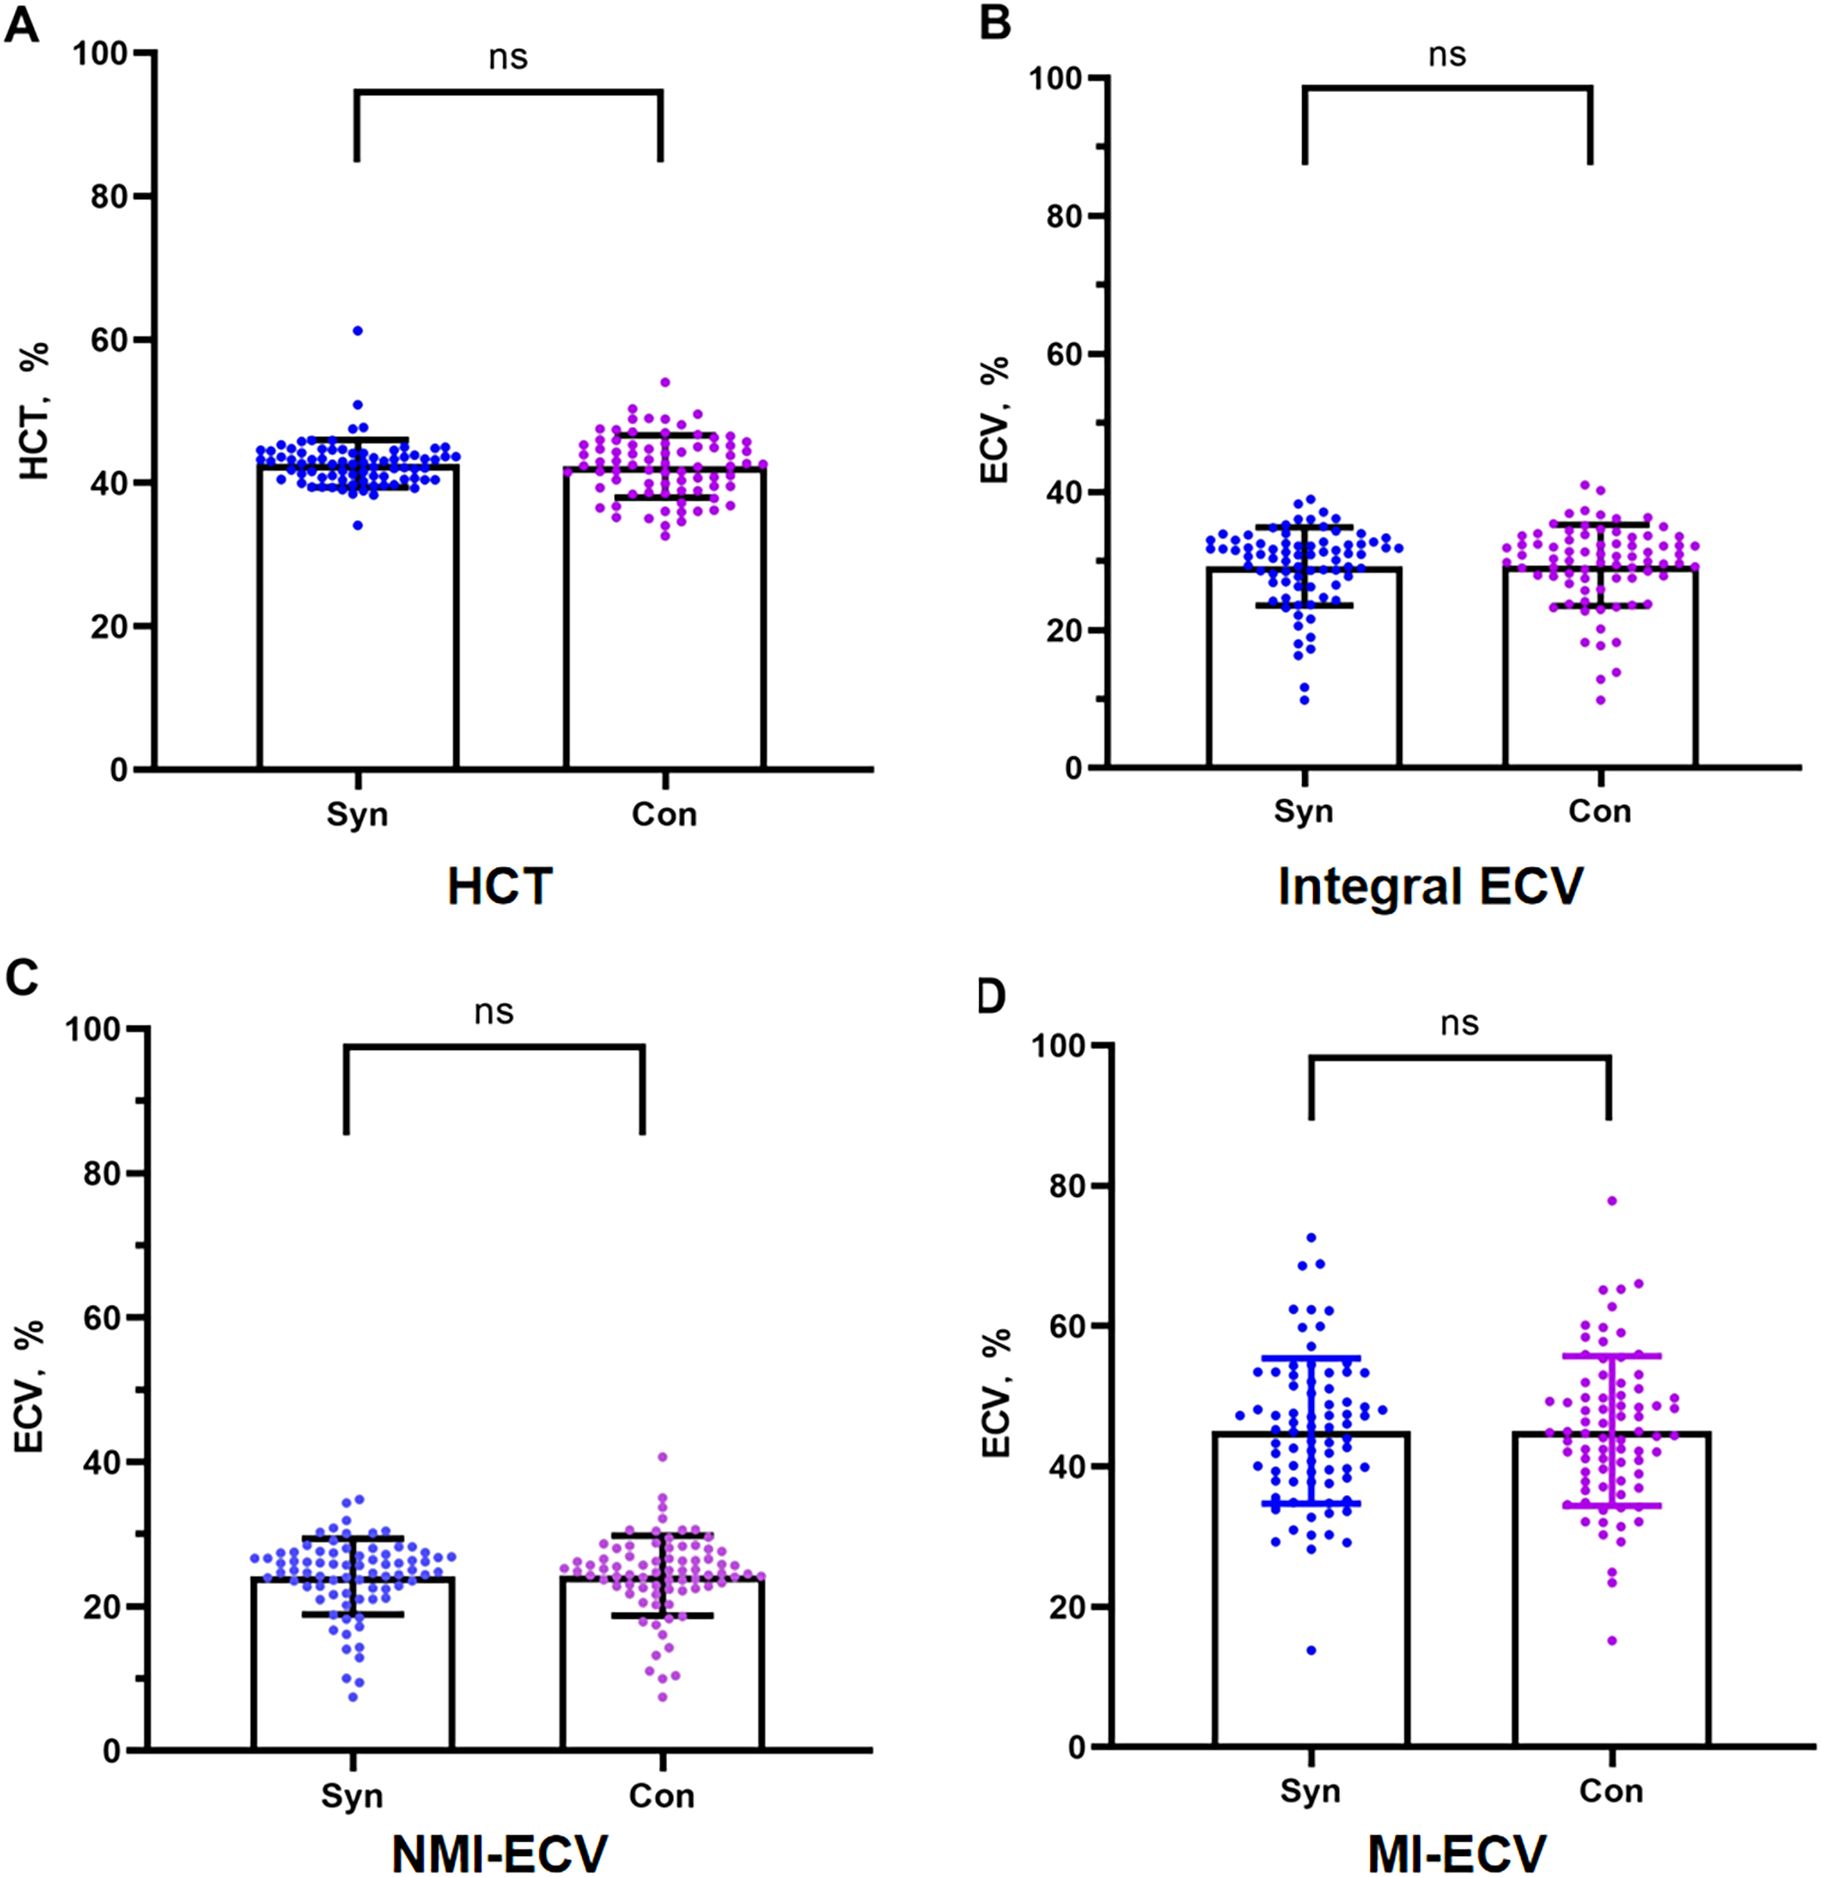
Figure 1. Comparison between conventional ECV and synthetic ECV. (A) Comparison between conventional HCT and synthetic HCT; (B) Comparison between conventional ECV and synthetic ECV in the integral myocardium; (C) Comparison between conventional NMI-ECV and synthetic NMI-ECV in NMI; (D) Comparison between conventional ECV and synthetic ECV at MI. NMI, non-myocardial infarction regions; MI, myocardial infarction regions; ECV, extracellular volume; HCT, hematocrit.
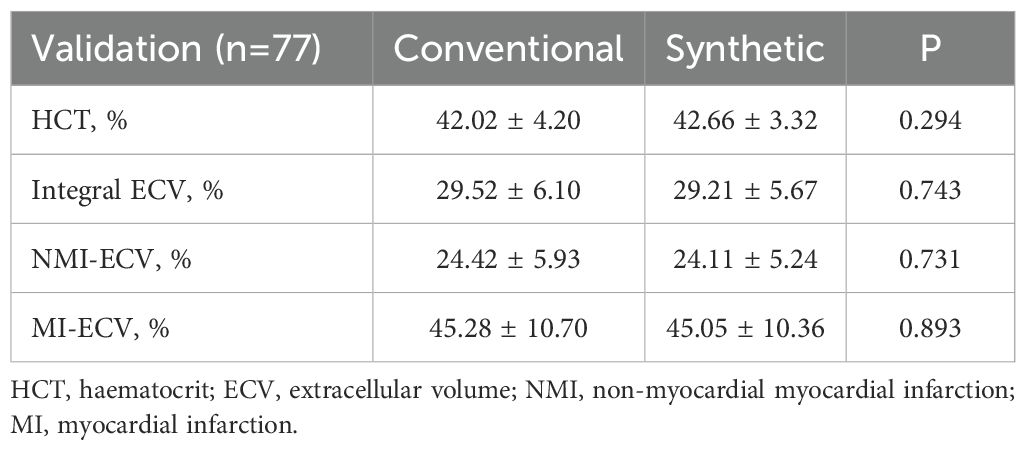
Table 1. Comparison of Pearson correlation coefficients of ECV.
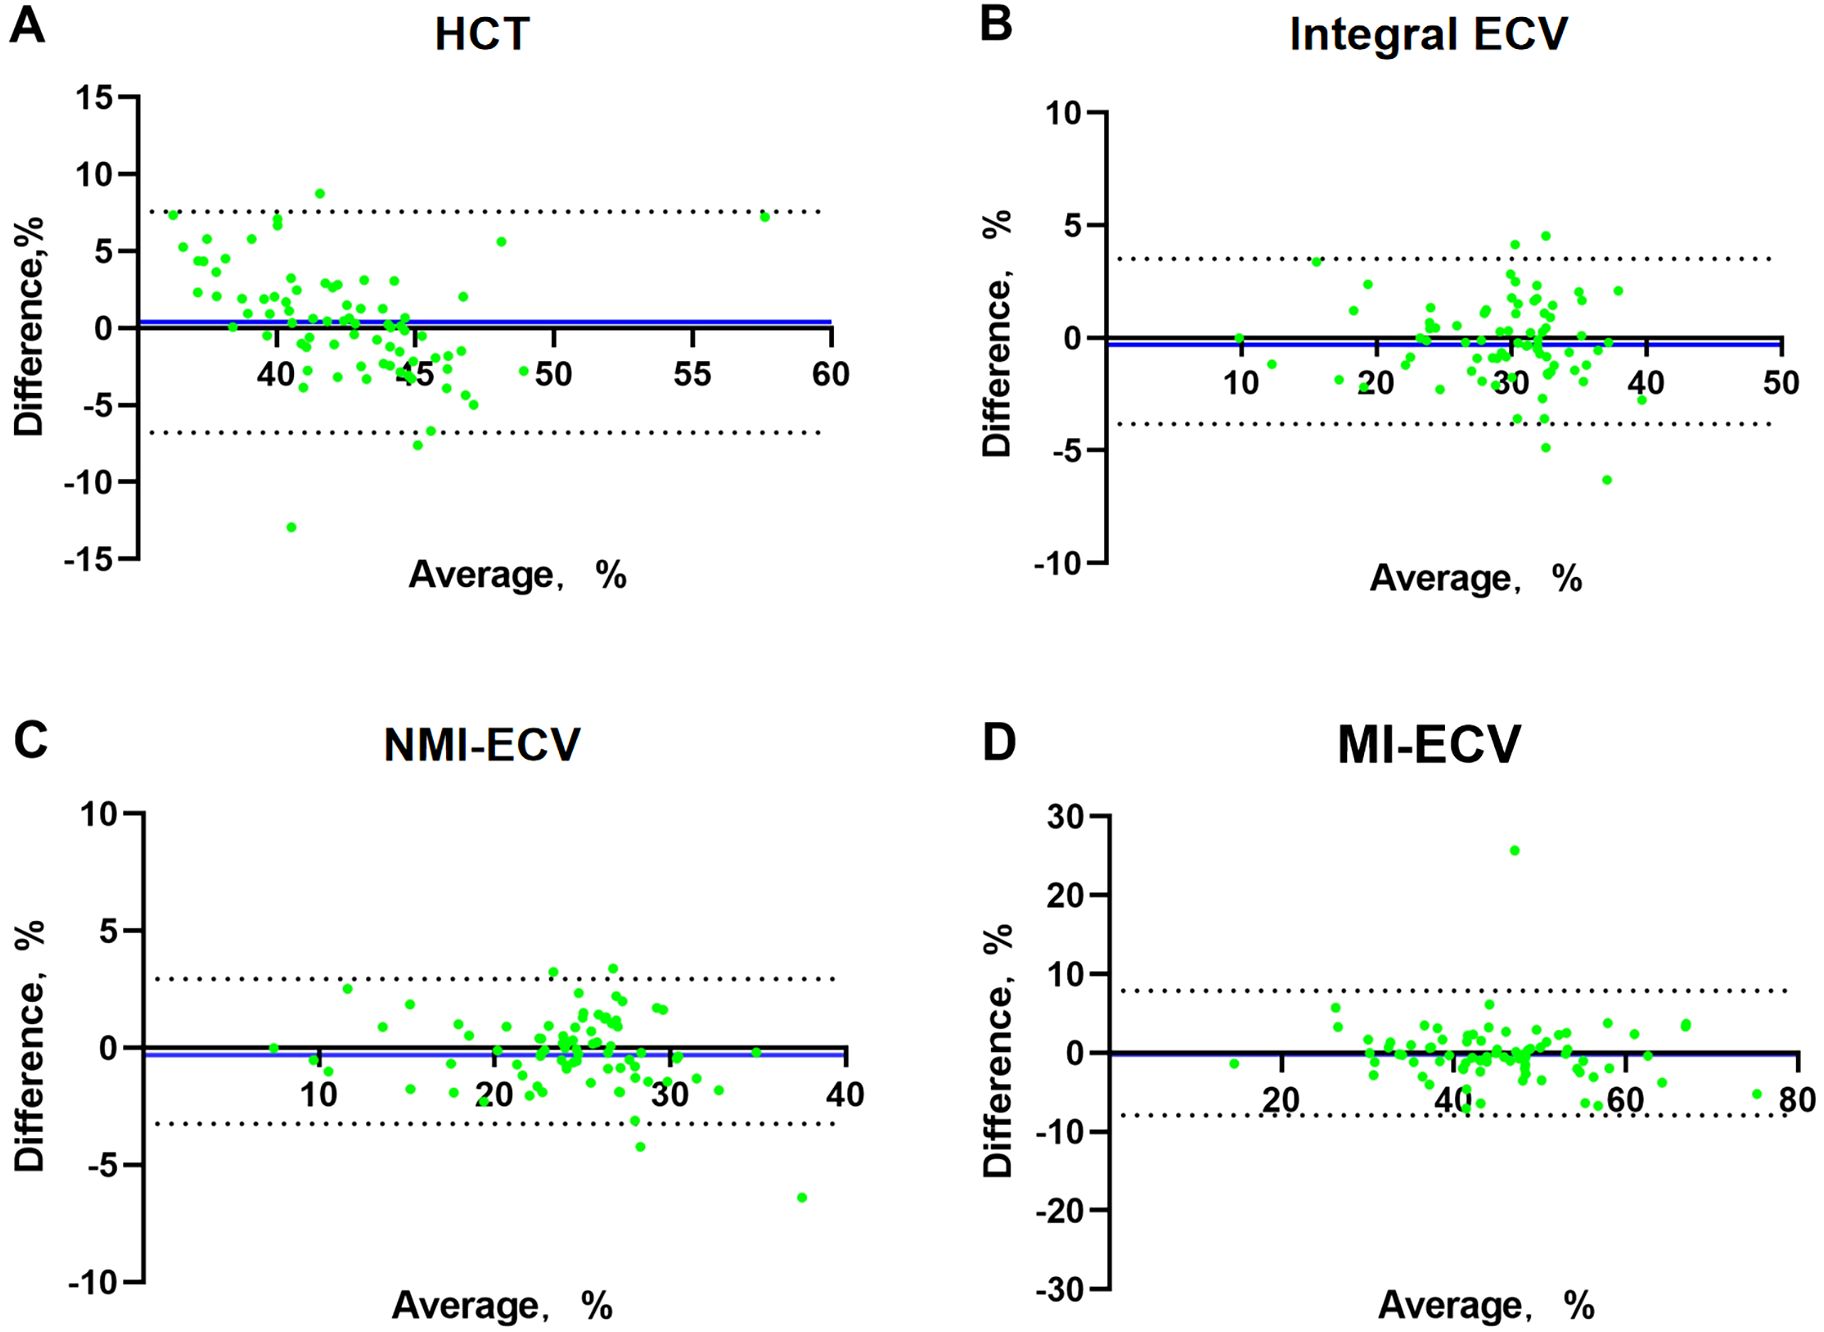
Figure 2. Bland-Altman analysis between conventional ECV and synthetic ECV. (A) Bland-Altman analysis between conventional HCT and synthetic HCT; (B) Bland-Altman analysis between conventional ECV and synthetic ECV in the integral myocardium; (C) Bland-Altman analysis between conventional ECV and synthetic ECV in NMI; (D) Bland-Altman analysis between conventional ECV and synthetic ECV in MI. The X-axis represents the mean value, The Y-axis represents Bias, The blue line is Bias. NMI, non-myocardial infarction regions; MI, myocardial infarction regions; ECV, extracellular volume; HCT, hematocrit.
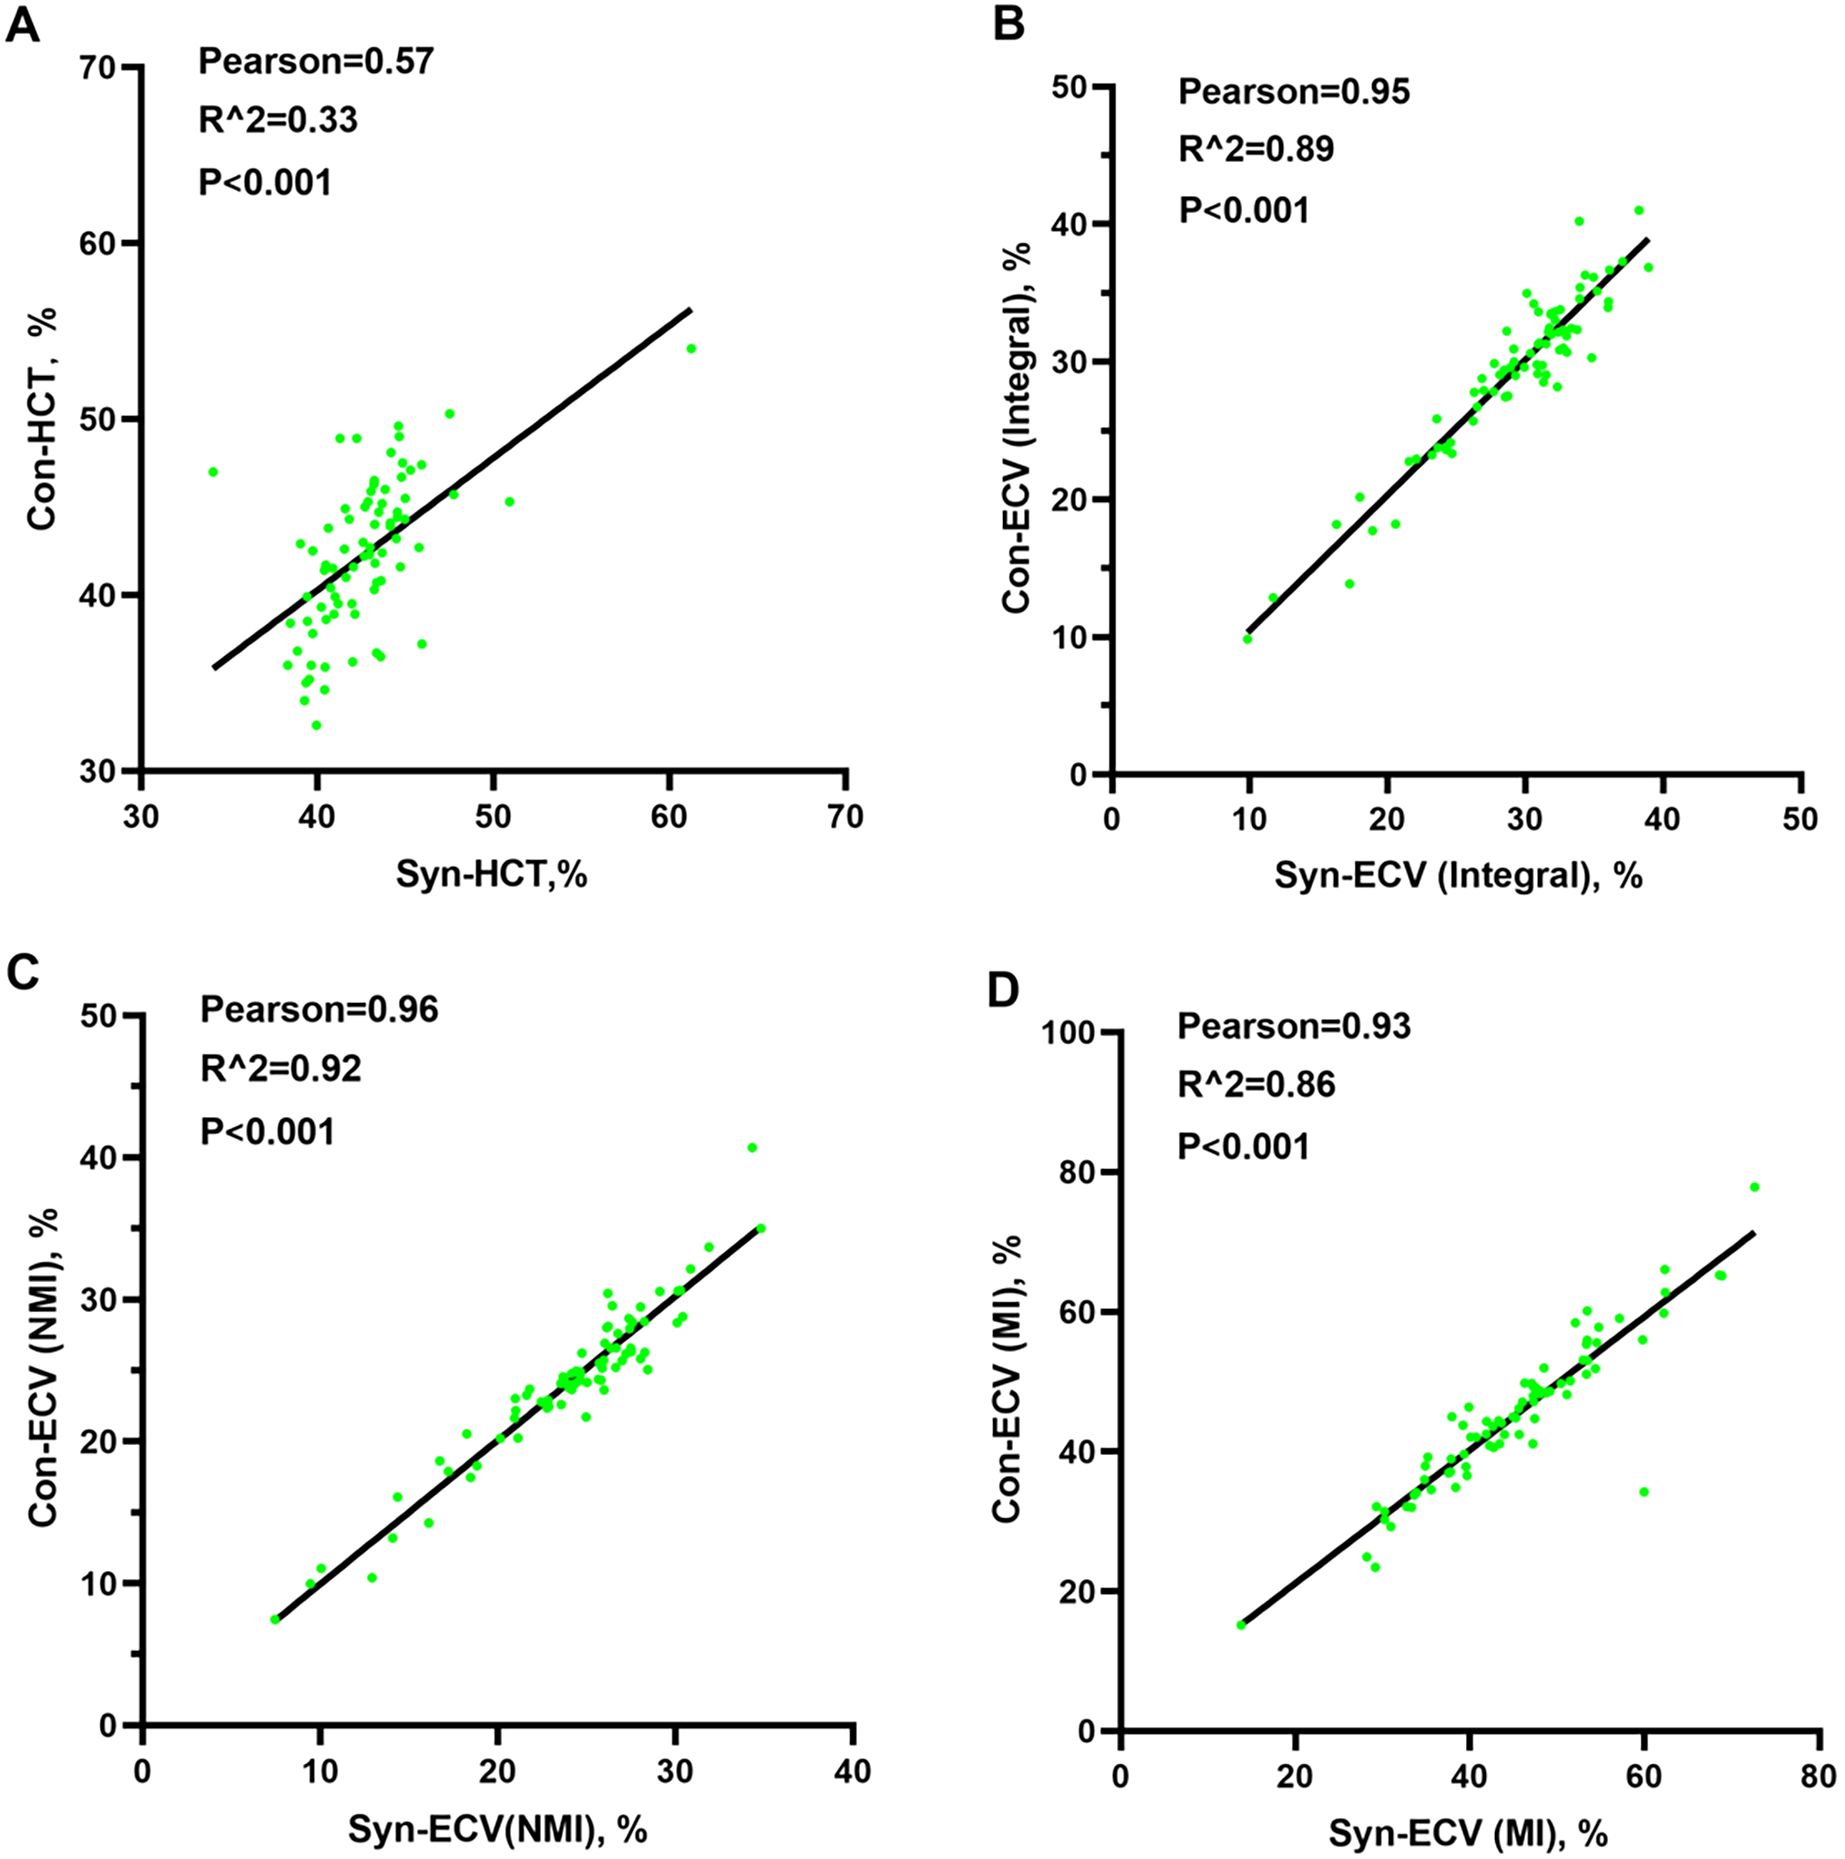
Figure 3. Pearson analysis between conventional ECV and synthetic ECV. (A) Pearson analysis between conventional HCT and synthetic HCT; (B) Pearson analysis between conventional ECV and synthetic ECV in the integral myocardium; (C) Pearson analysis between conventional ECV and synthetic ECV in NMI; (D) Pearson analysis between conventional ECV and synthetic ECV in MI. NMI, non-myocardial infarction region; MI, myocardial infarction regions; ECV, extracellular volume; HCT, hematocrit.
Baseline characteristics of patients
A total of 157 AMI patients were enrolled in this study, including 102 patients with STEMI. There were 41 (26.1%) patients with MACE after a median time of 26.6 (17.1, 38.1) months of follow-up (Supplementary Table 2). Compared with No MACE group, patients with MACE had higher age, hs-TnT, NT-proBNP, LGE%, and MVO%, lower LVEF and GLS. In addition, the MI-ECV (50.52 ± 10.49% vs. 45.37 ± 10.24%, p = 0.007), NMI-ECV (26.06 ± 5.91% vs. 23.82 ± 5.18%, p = 0.023), and Integral ECV (32.73 ± 5.85% vs. 29.42 ± 6.25%, p = 0.003) in the MACE group were significantly higher than those in the No MACE group (Table 2).
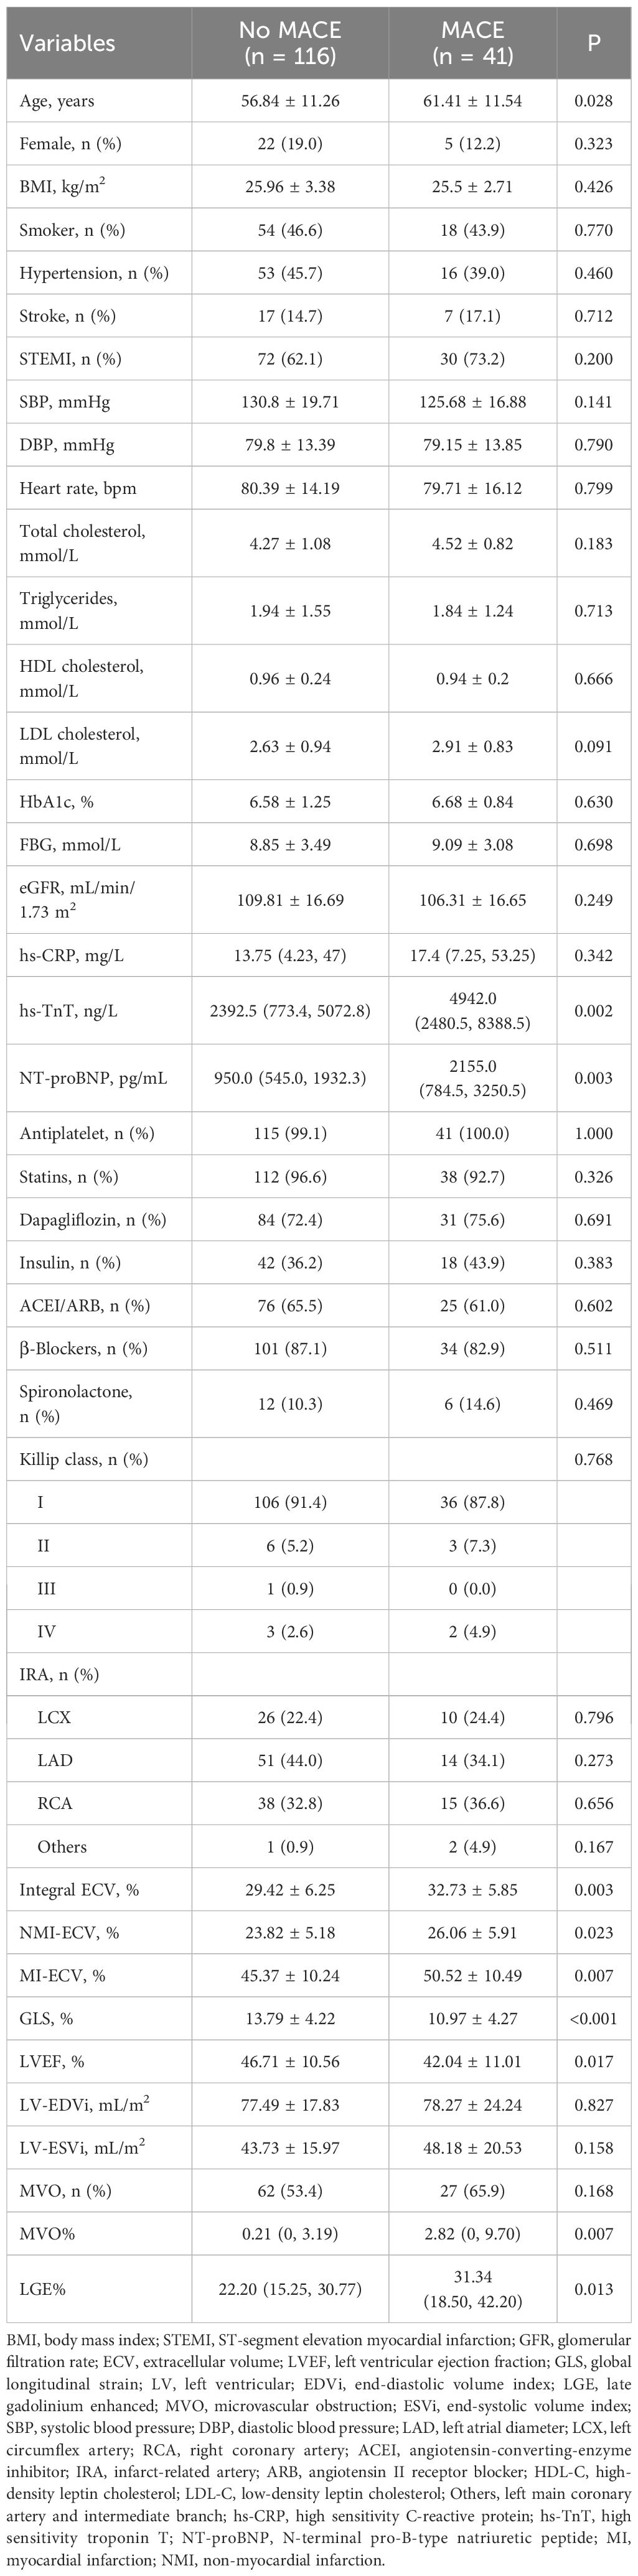
Table 2. Patient characteristics.
Relationship between synthetic ECV and MACE
Univariate COX regression analysis identified hs-TnT, NT-proBNP, MI-ECV, NMI-ECV, Integral ECV, GLS, LVEF, LGE%, and MVO% associated with MACE. Integral ECV, NMI-ECV, and MI-ECV were included in model 1, model 2, and model 3, respectively. After adjusting for confounding factors, it was found that hs-TnT, GLS, MVO%, Integral ECV (HR=1.07; 95%CI: 1.01 ~ 1.13, p = 0.023), and NMI-ECV (HR=1.07; 95%CI: 1.00 ~ 1.14, p = 0.039) were independently associated with MACE in model 1 and model 2. In model 3, it was found that hs-TnT, GLS, and MI-ECV (HR=1.03; 95%CI: 1.00 ~ 1.07, p = 0.024) were independently associated with MACE (Table 3, 4). GLS was moderately correlated with Integral ECV (r = -0.388, p < 0.001), weakly correlated with NMI-ECV (r = -0.266, p < 0.001) and NMI-ECV (r = -0.226, p = 0.004) (Figure 4).

Table 3. Association of patient characteristics With MACE: univariate and multivariate analysis.
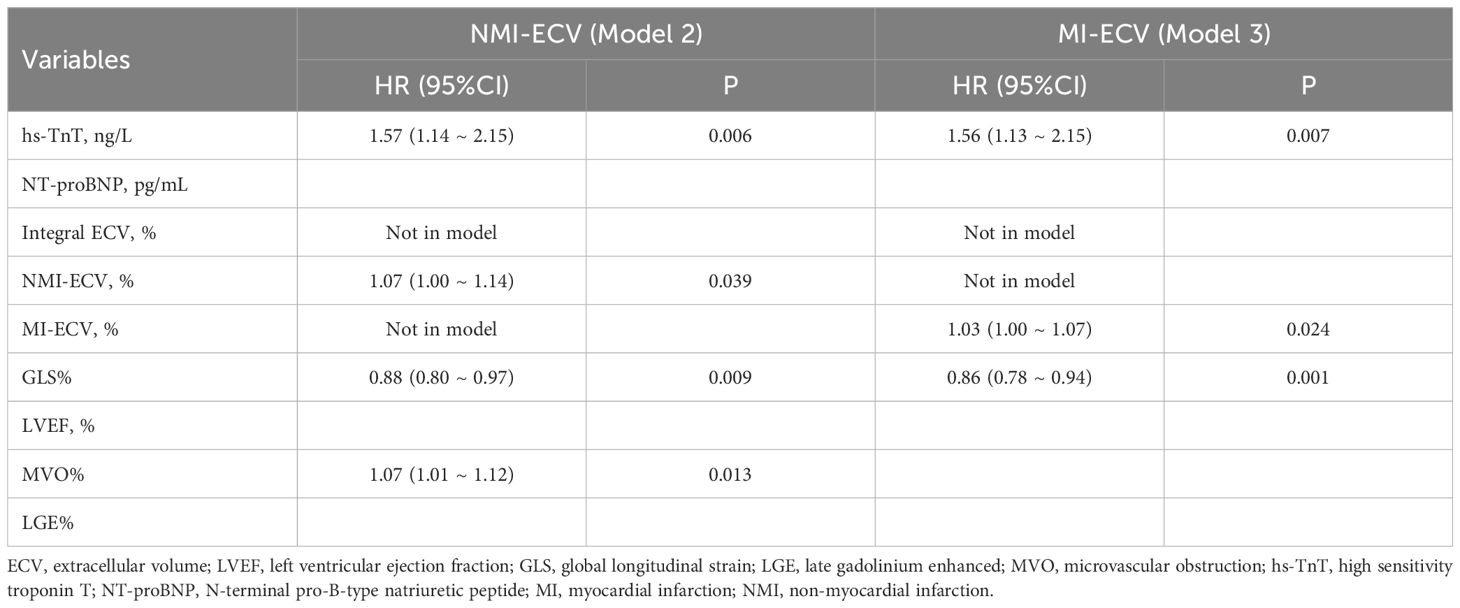
Table 4. Association of patient characteristics with MACE: multivariate analysis.
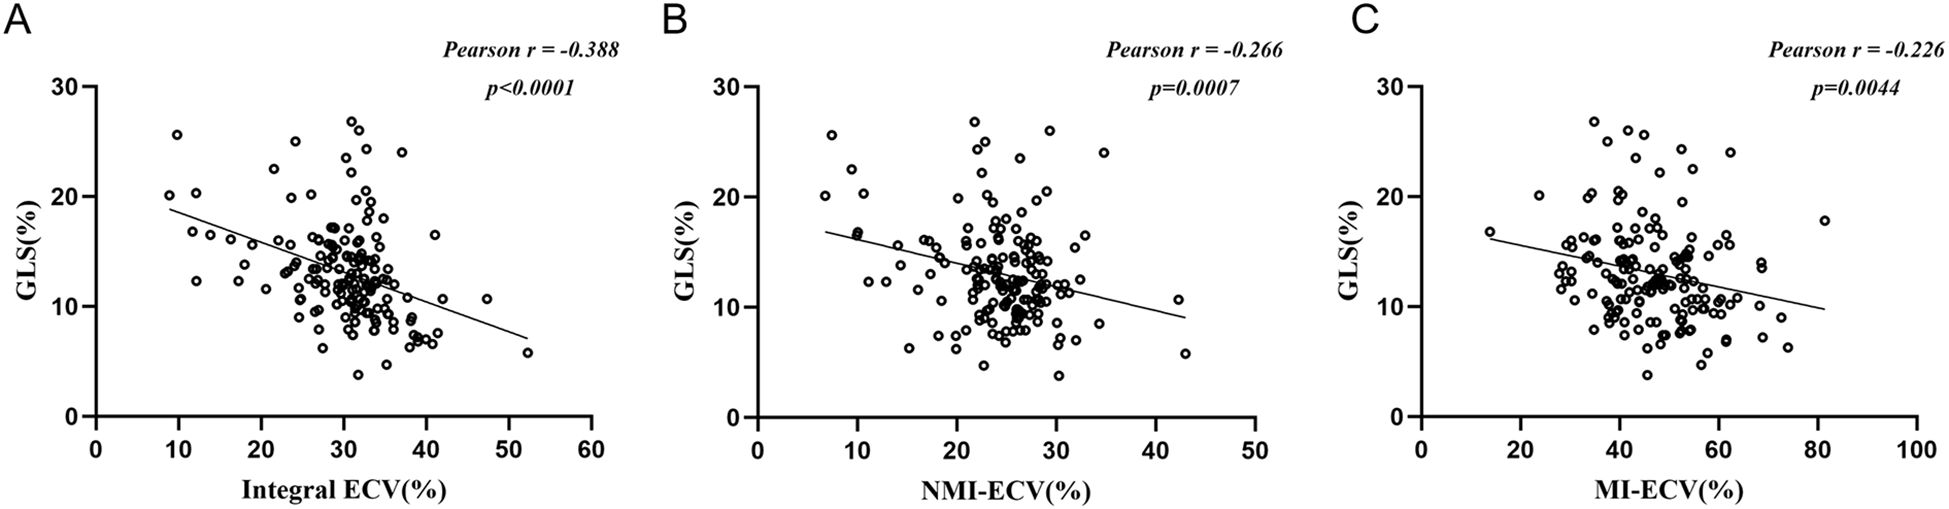
Figure 4. Pearson analysis between synthetic ECV and GLS. (A) Pearson analysis between GLS and synthetic ECV in the integral myocardium; (b) Pearson analysis between GLS and synthetic ECV in NMI; (C) Pearson analysis between GLS and synthetic ECV in MI. GLS, global longitudinal strain; NMI, non-myocardial infarction regions; MI, myocardial infarction regions; ECV, extracellular volume.
Value of synthetic ECV for predicting MACE
ROC was used to analyze the predictive value of synthetic ECV for MACE. The results showed that the area under the curve (AUC) of MI-ECV for MACE was 0.639 (95% CI 0.537 ~ 0.741, p = 0.008) with a cut-off value of 48.18%, the AUC of Integral ECV for MACE was 0.633 (95% CI 0.533 ~ 0.733, p = 0.011) with a cut-off value of 33.16%, and the AUC of NMI-ECV for MACE was 0.562 (95% CI 0.455 ~ 0.670, p = 0.236) with a cut-off value of 30.16% (Figure 5; Table 5). Based on the cut-off value of synthetic ECV, all patients were stratified into two groups for Kaplan-Meier curve analysis. Kaplan-Meier curve showed that compared with the AMI patients with low synthetic ECV, the patients with high synthetic ECV had a significantly higher long-term risk of MACE (both log-rank P < 0.05) (Figure 6).
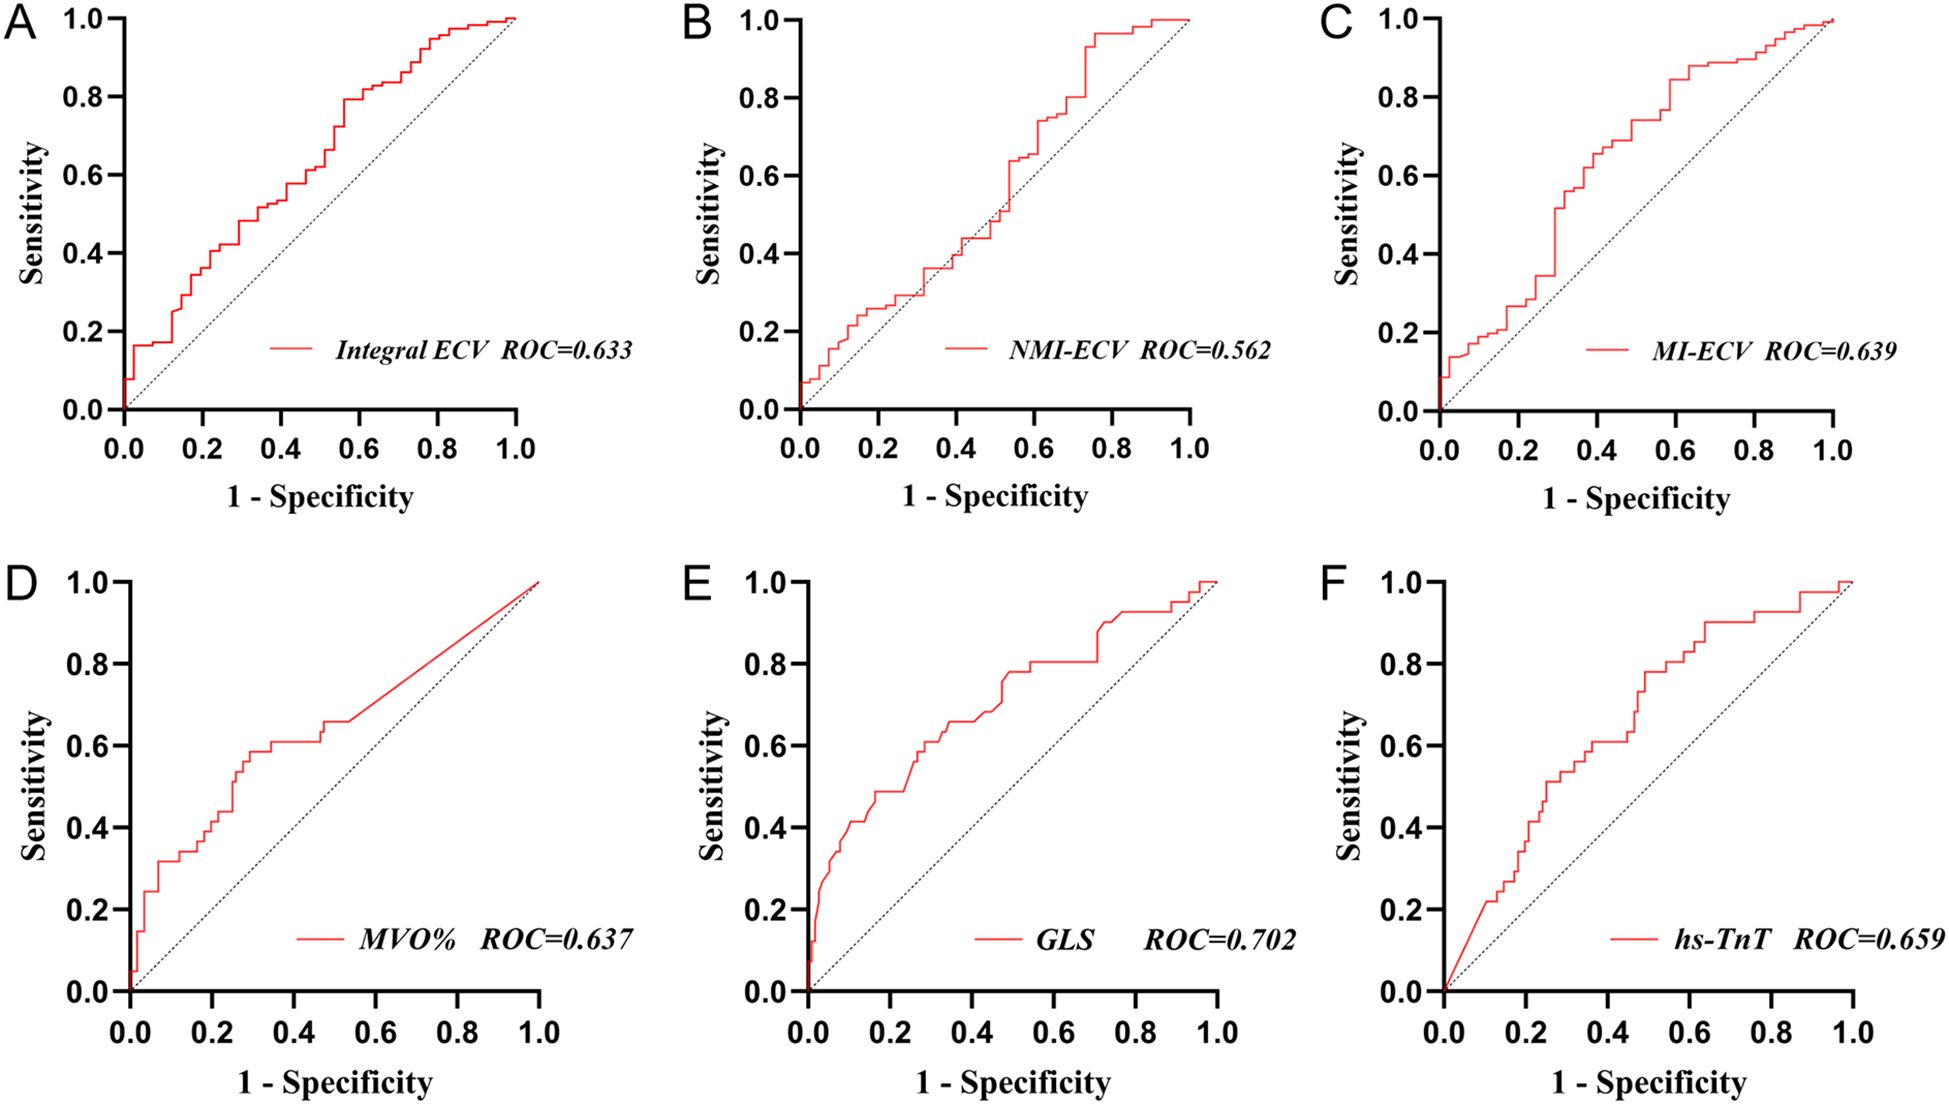
Figure 5. Receiver operating characteristic analysis of synthetic ECV for MACE. (A) ROC analysis of synthetic Integral ECV for MACE; (B) ROC analysis of synthetic NMI-ECV for MACE; (C) ROC analysis of synthetic MI-ECV for MACE; (D) ROC analysis of MVO for MACE; (E) ROC analysis of GLS for MACE; (F) ROC analysis of hs-TnT for MACE. GLS, global longitudinal strain; NMI, non-myocardial infarction regions; MI, myocardial infarction regions; ECV, extracellular volume; MVO, microvascular obstruction; hs-TnT, high sensitivity troponin T; MACE, major adverse cardiovascular events; ROC, receiver operating characteristic analysis.
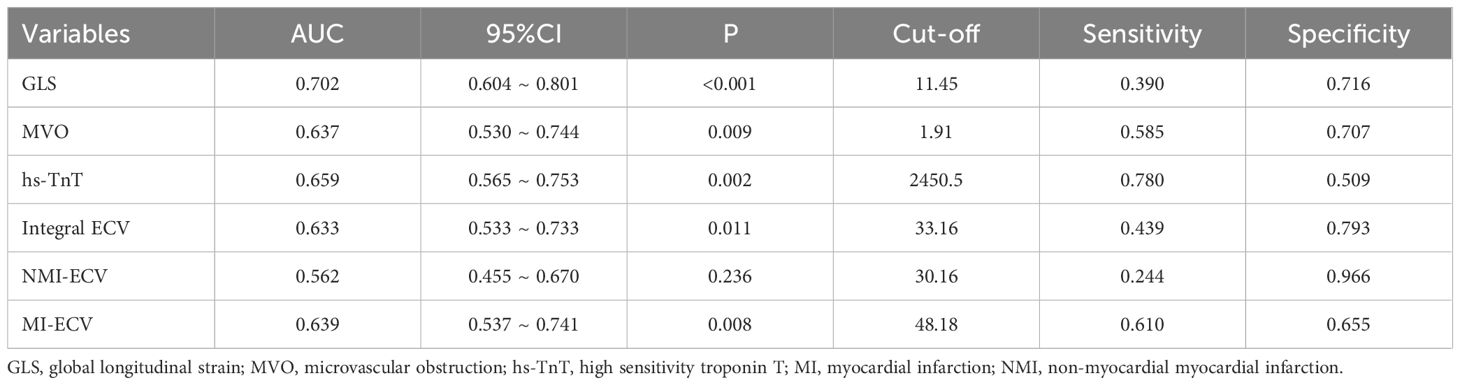
Table 5. ROC of parameters for MACE.
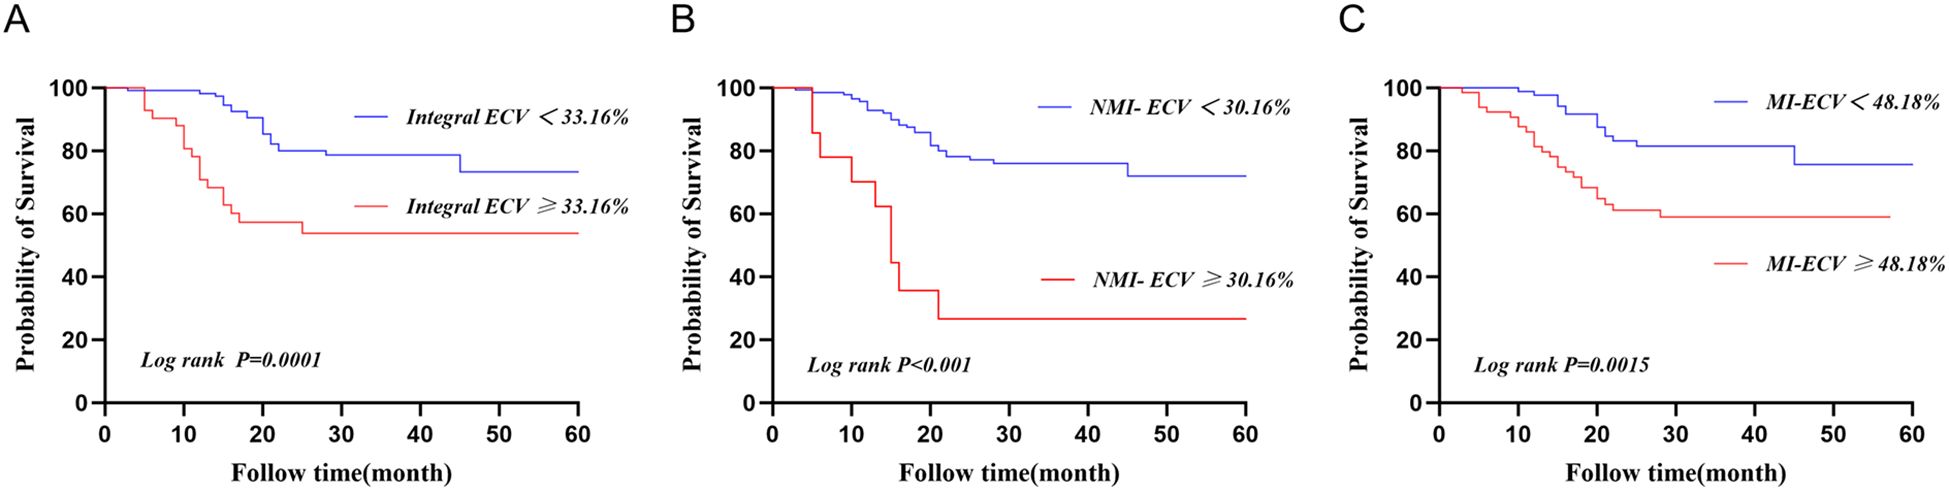
Figure 6. Kaplan-Meier curve for patients based on the cut-off values of synthetic ECV. (A) Kaplan-Meier curve of synthetic Integral ECV for MACE; (B) KaplanMeier curve of synthebtic NMI-ECV for MACE; (C) Kaplan-Meier curve of synthetic MI-ECV for MACE. ECV, extracellular volume; MACE, major adverse cardiovascular events.
Discussion
To the best of our knowledge, there are currently no relevant data in the diabetes cohort to demonstrate the consistency and correlation between synthetic and conventional ECV. The prognostic value of different regional ECV in diabetes patients is unclear. The main findings of this study are as follows. First, Synthetic ECV was strongly consistent and correlated with conventional ECV in T2DM patients with AMI. Second, Elevated synthetic ECV was an independent risk factor for MACE in T2DM patients with AMI. Third, Patients with high synthetic ECV had a significantly higher long-term risk of MACE.
ECV in T2DM patients with AMI
T2DM is a high-risk factor for MI and is associated with a high prevalence of diastolic dysfunction and congestive heart failure (28). A potential contributing factor is the accelerated accumulation of diffuse myocardial fibrosis and stiffness (29). Although biopsy remains the gold standard for assessing myocardial fibrosis, this invasive test is difficult to perform in the acute phase of AMI. ECV assessed by CMR is a marker of cardiac remodeling in the early stages of a variety of cardiac diseases and is associated with poor clinical outcomes (11, 30). Therefore, ECV may be of significant value in patients with AMI combined with diabetes. In a previous study of patients with T2DM, ECV levels were lower than in our study (27.9 ± 2.6% vs. 30.44 ± 6.5%) (11, 30). This may be because all patients included in our study combined with AMI, and acute myocardial injury may have additionally increased ECV levels.
Establishment and validation of an ECV model without blood sampling
HCT is crucial for the calculation of conventional ECV. Due to the high temporal variability of HCT, it should be as close as possible to the CMR scan time (12–15). However, this is still not an immediate HCT. It has been reported that HCT levels may even change within a few hours (12). Thus, these factors limit the applicability of ECV in routine clinical work. Recently, synthetic ECV without blood sampling has received considerable attention. The calculation of synthetic ECV is based on a linear relationship between the native R1 (1/T1) and HCT (16–19). In contrast to conventional HCT, synthetic HCT is measured during CMR scanning and is calculated from the R1 of LV blood. Thus, it somewhat avoids potential variability caused by differences in LV and peripheral venous blood or changes in body position and time that may affect conventional HCT measurements (32–34). Although some synthetic ECV models have been previously established and validated (16, 20–23), no relevant reports have been seen for diabetic patients. In this study, we established and validated the first synthetic ECV model containing only T2DM patients with AMI. Similar to previous studies, synthetic HCT was only moderately correlated with conventional HCT (16, 20, 21, 35, 36). However, the performance of synthetic ECV was favorable. The close correlation between synthetic ECV and conventional ECV may be attributed to the four additional terms (myocardial and ventricular blood R1 before and after contrast injection) that remained constant in the ECV calculations, and these constants may have partially offset the greater variability in HCT. In contrast, the differences between HCT may be related to the following reasons. First, there is high variability in HCT itself as described above. Second, blood iron outside hemoglobin has been reported to have a substantial effect on T1 relaxation time, and the R1/HCT relationship may be broken in patients with iron overload, especially those with thalassemia (37). In addition, conventional HCT is measured in peripheral venous blood, whereas synthetic HCT is derived from the T1 relaxation time of left ventricular arterial blood. Differences between arterial and venous blood may also introduce interference. In our study, we successfully established and validated a synthetic ECV model in T2DM patients with AMI. Based on the unique value of ECV for myocardial fibrosis, the role of this “pragmatic” ECV in patient prognosis is equally attractive. However, given the characteristics of HCT, the synthesis of HCT and ECV needs to be repeatedly verified in different subpopulations.
Prognostic value of synthetic ECV in T2DM patients with AMI
Elevated ECV is associated with poor prognosis in previous diabetes cohorts and animal studies (11, 38). In our study, it was found that elevated synthetic ECV was an independent risk factor for MACE in T2DM patients with AMI, patients with high synthetic ECV had a significantly higher long-term risk of MACE. Although the exact mechanism of action is unknown, myocardial fibers may be an important cause. Specifically, myocardial fibrosis is one of the core mechanisms of myocardial remodeling and poor prognosis. In diabetic patients, myocardial fibrosis can be promoted through various pathways such as inflammation and oxidative stress. ECV, as a marker of myocardial fibrosis, may account for the findings of this study (38, 39). In addition, we found that GLS was also an independent risk factor for MACE in patients with AMI, and Integral ECV, NMI-ECV, and NMI-ECV were all significantly correlated with GLS, which quantifies systolic function by measuring LV deformation and is independent of geometric factors (40, 41). Even in the presence of normal LVEF, ECV, and GLS can detect LV disease and stratify risk (40, 42). Indeed, correlations between ECV and GLS have been demonstrated in other diseases (43, 44). These may also partly explain the results of the present study. In a previous study that included 47 patients with T2DM, high HbA1c was shown to be associated with increased ECV (45). In contrast, in a larger study, the association between HbA1c and ECV was not confirmed (31), which is consistent with our findings. The different results may be related to several reasons. First, sample size limitations may have led to some bias. In addition, the study populations were different. All T2DM patients in our study were combined with AMI, and it is known that myocardial necrosis is also an important factor in myocardial fibrosis. In another cohort that includes non-diabetic patients with AMI, ECV was also proven to be a powerful predictor of heart failure and all - cause mortality (46). Given the crucial role of myocardial fibrosis, it appears that ECV is closely associated with prognosis in both diabetic and non - diabetic AMI patients.
Role of NMI-ECV in T2DM patients with AMI
In recent years, myocardial fibrosis in non-infarcted regions has received increasing attention. In the early stages of AMI, myocardial necrosis and systemic inflammatory responses can cause collagen deposition and remodeling in non-infarcted regions (47, 48). In a mouse animal model, Tsuda et al. (49) found pathological evidence of myocardial fibrosis in the non-infarcted regions in the early stages of AMI. In clinical studies, it was also found that diffuse myocardial fibrosis could occur in non-infarcted myocardium in the early stages of AMI and that elevated NMI-ECV was associated with poor LV remodeling in the chronic phase (50, 51). Consistent with these findings, we found that elevated NMI-ECV was an independent risk factor for MACE in T2DM patients with AMI. However, it is noteworthy that in the ROC analysis, the results showed no statistical significance between NMI-ECV and MACE. Indeed, the prognosis value of myocardial fibrosis in the non-infarcted regions is inadequate and controversial for the prognosis of patients. In a previous study, Marijianowski et al. (52) found that myocardial fibrosis in non-infarct regions was not associated with LV remodeling after MI in patients with end-stage heart failure. Therefore, the prognostic value of NMI-ECV in T2DM patients with AMI may be worth further investigation.
Clinical implications
One of the major advantages of synthetic ECV is that it provides CMR laboratories with the convenience of ECV measurement without the blood samples. In addition, this study emphasizes the prognostic importance of synthetic ECV (including Integral ECV, NMI-ECV, and MI-ECV) in T2DM patients with AMI. These findings increase the potential of ECV in routine clinical CMR, which could facilitate the widespread use of CMR-ECV. Certainly, there are some potential barriers to implementing synthetic ECV in routine clinical practice. For instance, differences in CMR protocols among various institutions, cost concerns, or a lack of technical expertise.
Limitations
First, the single-center, retrospective design limits generalizability. There is a potential selection bias due to exclusion of patients with poor imaging or severe comorbidities. Second, in our study, there is a lack of histopathological validation for ECV, especially considering the known heterogeneity of myocardial fibrosis in diabetic patients. Third, the sample size of this study is limited, and the follow-up time is relatively short. Longer-term data will strengthen the claims regarding prognosis. Fourth, there is high variability in HCT, so further studies after matching for age, BMI, and gender are expected. Fifth, our study included patients with AMI combined with T2DM, so some of the results may need to be replicated and validated in other diseases.
Conclusions
Synthetic ECV is strongly consistent and correlated with conventional ECV in T2DM patients with AMI. Elevated synthetic ECV is an independent risk factor for MACE in T2DM patients with AMI.
Data availability statement
The raw data supporting the conclusions of this article will be made available by the authors, without undue reservation.
Ethics statement
The studies involving humans were approved by The Institutional Review Board (IRB) of the Affiliated Hospital of Xuzhou Medical University approved this study protocol. The studies were conducted in accordance with the local legislation and institutional requirements. The requirement for signed written consent was waived owing to the no risk to the patient in accordance with the relevant IRB regulatory guidelines.
Author contributions
LC: Writing – original draft, Writing – review & editing. BQ: Writing – original draft. XD: Writing – original draft. JL: Writing – original draft. WLC: Writing – review & editing. WSC: Writing – original draft. YL: Writing – review & editing.
Funding
The author(s) declare that financial support was received for the research and/or publication of this article. This work was supported by the Noncommunicable Chronic Diseases-National Science and Technology Major Project (Grant No.2024ZD0524000).
Conflict of interest
The authors declare that the research was conducted in the absence of any commercial or financial relationships that could be construed as a potential conflict of interest.
Generative AI statement
The author(s) declare that no Generative AI was used in the creation of this manuscript.
Publisher’s note
All claims expressed in this article are solely those of the authors and do not necessarily represent those of their affiliated organizations, or those of the publisher, the editors and the reviewers. Any product that may be evaluated in this article, or claim that may be made by its manufacturer, is not guaranteed or endorsed by the publisher.
Supplementary material
The Supplementary Material for this article can be found online at: https://www.frontiersin.org/articles/10.3389/fendo.2025.1534236/full#supplementary-material
Supplementary Figure 1 | Workflow.
Supplementary Figure 2 | Measurement of ECV. (A) Native T1 map; (B) Enhanced T1 map; (C) Generate ECV images; (D) The distribution coefficient λ generates the image; Red circle marks the endocardium, green circle marks the epicardium, ROI (yellow) marks the blood pool, ROI (pink) marks the non-myocardial infarction sites, ROI (blue) marks the myocardial infarction site.
Supplementary Figure 3 | Linear regression analysis between hematocrit (HCT) and blood pool T1.
Supplementary Figure 4 | Pearson analysis between synthetic ECV and HbA1c. NMI, non-myocardial infarction regions; MI, myocardial infarction regions; ECV, extracellular volume.
References
1. Byrne RA, Rossello X, Coughlan JJ, Barbato E, Berry C, Chieffo A, et al. 2023 ESC Guidelines for the management of acute coronary syndromes [published correction appears in Eur Heart J. 2024 Apr 1;45(13):1145. doi: 10.1093/eurheartj/ehad870. Eur Heart J. (2023) 44:3720–826. doi: 10.1093/eurheartj/ehad191
2. Arnold SV, Spertus JA, Jones PG, McGuire DK, Lipska KJ, Xu Y, et al. Predicting adverse outcomes after myocardial infarction among patients with diabetes mellitus. Circ Cardiovasc Qual Outcomes. (2016) 9:372–9. doi: 10.1161/CIRCOUTCOMES.115.002365
3. Divakaran S, Singh A, Biery D, Yang J, DeFilippis EM, Collins BL, et al. Diabetes is associated with worse long-term outcomes in young adults after myocardial infarction: the partners YOUNG-MI registry. Diabetes Care. (2020) 43:1843–50. doi: 10.2337/dc19-0998
4. Biernacka A, Cavalera M, Wang J, Russo I, Shinde A, Kong P, et al. Smad3 signaling promotes fibrosis while preserving cardiac and aortic geometry in obese diabetic mice. Circ Heart Fail. (2015) 8:788–98. doi: 10.1161/CIRCHEARTFAILURE.114.001963
5. Rubler S, Dlugash J, Yuceoglu YZ, Kumral T, Branwood AW, and Grishman A. New type of cardiomyopathy associated with diabetic glomerulosclerosis. Am J Cardiol. (1972) 30:595–602. doi: 10.1016/0002-9149(72)90595-4
6. Lundbaek K. Diabetic angiopathy: a specific vascular disease. Lancet. (1954) 266:377–9. doi: 10.1016/s0140-6736(54)90924-1
7. Connelly KA and Sarak B. Diabetes and myocardial fibrosis: is CMR the force leading to the rise of “Scar wars”? JACC Cardiovasc Imaging. (2022) 15:809–11. doi: 10.1016/j.jcmg.2022.01.015
8. Kramer CM, Chandrashekhar Y, and Narula J. T1 mapping by CMR in cardiomyopathy: a noninvasive myocardial biopsy? JACC Cardiovasc Imaging. (2013) 6:532–4. doi: 10.1016/j.jcmg.2013.02.002
9. Fontana M, White SK, Banypersad SM, Sado DM, Maestrini V, Flett AS, et al. Comparison of T1 mapping techniques for ECV quantification. Histological validation and reproducibility of ShMOLLI versus multibreath-hold T1 quantification equilibrium contrast CMR. J Cardiovasc Magn Reson. (2012) 14:88. doi: 10.1186/1532-429X-14-88
10. Lurz JA, Luecke C, Lang D, Besler C, Rommel KP, Klingel K, et al. CMR-derived extracellular volume fraction as a marker for myocardial fibrosis: the importance of coexisting myocardial inflammation. JACC Cardiovasc Imaging. (2018) 11:38–45. doi: 10.1016/j.jcmg.2017.01.025
11. Wong TC, Piehler KM, Kang IA, Kadakkal A, Kellman P, Schwartzman DS, et al. Myocardial extracellular volume fraction quantified by cardiovascular magnetic resonance is increased in diabetes and associated with mortality and incident heart failure admission. Eur Heart J. (2014) 35:657–64. doi: 10.1093/eurheartj/eht193
12. Sennels HP, Jørgensen HL, Hansen AL, Goetze JP, and Fahrenkrug J. Diurnal variation of hematology parameters in healthy young males: the Bispebjerg study of diurnal variations. Scand J Clin Lab Invest. (2011) 71:532–41. doi: 10.3109/00365513.2011.602422
13. Thirup P. Haematocrit: within-subject and seasonal variation. Sports Med. (2003) 33:231–43. doi: 10.2165/00007256-200333030-00005
14. Engblom H, Kanski M, Kopic S, Nordlund D, Xanthis CG, Jablonowski R, et al. Importance of standardizing timing of hematocrit measurement when using cardiovascular magnetic resonance to calculate myocardial extracellular volume (ECV) based on pre- and post-contrast T1 mapping. J Cardiovasc Magn Reson. (2018) 20:46. doi: 10.1186/s12968-018-0464-9
15. Messroghli DR, Moon JC, Ferreira VM, Grosse-Wortmann L, He T, Kellman P, et al. Clinical recommendations for cardiovascular magnetic resonance mapping of T1, T2, T2* and extracellular volume: A consensus statement by the Society for Cardiovascular Magnetic Resonance (SCMR) endorsed by the European Association for Cardiovascular Imaging (EACVI) [published correction appears in J Cardiovasc Magn Reson. 2018 Feb 7;20(1):9. doi: 10.1186/s12968-017-0408-9. . J Cardiovasc Magn Reson. (2017) 19:75. doi: 10.1186/s12968-017-0389-8
16. Chen W, Doeblin P, Al-Tabatabaee S, Klingel K, Tanacli R, Jakob Weiß K, et al. Synthetic extracellular volume in cardiac magnetic resonance without blood sampling: a reliable tool to replace conventional extracellular volume. Circ Cardiovasc Imaging. (2022) 15:e013745. doi: 10.1161/CIRCIMAGING.121.013745
17. Piechnik SK, Ferreira VM, Lewandowski AJ, Ntusi NA, Banerjee R, Holloway C, et al. Normal variation of magnetic resonance T1 relaxation times in the human population at 1.5 T using ShMOLLI. J Cardiovasc Magn Reson. (2013) 15:13. doi: 10.1186/1532-429X-15-13
18. Li W, Grgac K, Huang A, Yadav N, Qin Q, and van Zijl PC. Quantitative theory for the longitudinal relaxation time of blood water. Magn Reson Med. (2016) 76:270–81. doi: 10.1002/mrm.25875
19. Spees WM, Yablonskiy DA, Oswood MC, and Ackerman JJ. Water proton MR properties of human blood at 1.5 Tesla: magnetic susceptibility, T(1), T(2), T*(2), and non-Lorentzian signal behavior. Magn Reson Med. (2001) 45:533–42. doi: 10.1002/mrm.1072
20. Treibel TA, Fontana M, Maestrini V, Castelletti S, Rosmini S, Simpson J, et al. Automatic measurement of the myocardial interstitium: synthetic extracellular volume quantification without hematocrit sampling. JACC Cardiovasc Imaging. (2016) 9:54–63. doi: 10.1016/j.jcmg.2015.11.008
21. Fent GJ, Garg P, Foley JRJ, Swoboda PP, Dobson LE, Erhayiem B, et al. Synthetic myocardial extracellular volume fraction. JACC Cardiovasc Imaging. (2017) 10:1402–4. doi: 10.1016/j.jcmg.2016.12.007
22. Kammerlander AA, Duca F, Binder C, Aschauer S, Zotter-Tufaro C, Koschutnik M, et al. Extracellular volume quantification by cardiac magnetic resonance imaging without hematocrit sampling: Ready for prime time? Wien Klin Wochenschr. (2018) 130:190–6. doi: 10.1007/s00508-017-1267-y
23. Chen L, Zhang Z, Du X, Liu J, Liu Z, Chen W, et al. Establishment and validation of an extracellular volume model without blood sampling in ST-segment elevation myocardial infarction patients. Eur Heart J Imaging Methods Pract. (2024) 2:qyae053. doi: 10.1093/ehjimp/qyae053
24. Chen L, Zhang M, Chen W, Li Z, Wang Y, Liu D, et al. Cardiac MRI left atrial strain associated with new-onset atrial fibrillation in patients with ST-segment elevation myocardial infarction. J Magn Reson Imaging. (2023) 58:135–44. doi: 10.1002/jmri.28491
25. Thygesen K, Alpert JS, Jaffe AS, Chaitman BR, Bax JJ, Morrow DA, et al. Fourth universal definition of myocardial infarction (2018). Eur Heart J. (2019) 40:237–69. doi: 10.1093/eurheartj/ehy462
26. McDonagh TA, Metra M, Adamo M, Gardner RS, Baumbach A, Böhm M, et al. 2021 ESC Guidelines for the diagnosis and treatment of acute and chronic heart failure [published correction appears in Eur Heart J. 2021 Dec 21;42(48):4901. doi: 10.1093/eurheartj/ehab670. . Eur Heart J. (2021) 42:3599–726. doi: 10.1093/eurheartj/ehab368
27. Hicks KA, Mahaffey KW, Mehran R, Nissen SE, Wiviott SD, Dunn B, et al. 2017 Cardiovascular and stroke endpoint definitions for clinical trials. J Am Coll Cardiol. (2018) 71:1021–34. doi: 10.1016/j.jacc.2017.12.048
28. Gao Y, Xu HY, Guo YK, Wen XL, Shi R, Li Y, et al. Impact of myocardial scars on left ventricular deformation in type 2 diabetes mellitus after myocardial infarction by contrast-enhanced cardiac magnetic resonance. Cardiovasc Diabetol. (2021) 20:215. doi: 10.1186/s12933-021-01407-2
29. Russo I and Frangogiannis NG. Diabetes-associated cardiac fibrosis: Cellular effectors, molecular mechanisms and therapeutic opportunities. J Mol Cell Cardiol. (2016) 90:84–93. doi: 10.1016/j.yjmcc.2015.12.011
30. Jin C, Weber J, Singh H, Gliganic K, and Cao JJ. The association of reduced left ventricular strains with increased extracellular volume and their collective impact on clinical outcomes [published correction appears in J Cardiovasc Magn Reson. 2021 Nov 18;23(1):128. doi: 10.1186/s12968-021-00826-0. . J Cardiovasc Magn Reson. (2021) 23:93. doi: 10.1186/s12968-021-00776-7
31. Bojer AS, Sørensen MH, Gæde P, and Madsen PL. Myocardial extracellular volume expansion in type 2 diabetes is associated with ischemic heart disease, autonomic neuropathy, and active smoking. Diabetes Care. (2022) 45:3032–9. doi: 10.2337/dc22-0942
32. Su MY, Huang YS, Niisato E, Chow K, Juang JJ, Wu CK, et al. Is a timely assessment of the hematocrit necessary for cardiovascular magnetic resonance-derived extracellular volume measurements? J Cardiovasc Magn Reson. (2020) 22:77. doi: 10.1186/s12968-020-00689-x
33. Jacob G, Raj SR, Ketch T, Pavlin B, Biaggioni I, Ertl AC, et al. Postural pseudoanemia: posture-dependent change in hematocrit. Mayo Clin Proc. (2005) 80:611–4. doi: 10.4065/80.5.611
34. Chen W, Faragli A, Goetze C, Zieschang V, Weiss KJ, Hashemi D, et al. Quantification of myocardial extracellular volume without blood sampling. Eur Heart J Imaging Methods Pract. (2023) 1:qyad022. doi: 10.1093/ehjimp/qyad022
35. Raucci FJ Jr, Parra DA, Christensen JT, Hernandez LE, Markham LW, Xu M, et al. Synthetic hematocrit derived from the longitudinal relaxation of blood can lead to clinically significant errors in measurement of extracellular volume fraction in pediatric and young adult patients. J Cardiovasc Magn Reson. (2017) 19:58. doi: 10.1186/s12968-017-0377-z
36. Lim EH, Le TT, Bryant J, Chung YC, Su B, Gan J, et al. Importance of sex-specific regression models to estimate synthetic hematocrit and extracellular volume fraction. JACC Cardiovasc Imaging. (2018) 11:1366–7. doi: 10.1016/j.jcmg.2017.11.035
37. Rosmini S, Bulluck H, Abdel-Gadir A, Treibel TA, Culotta V, Thompson R, et al. The effect of blood composition on T1 mapping. JACC Cardiovasc Imaging. (2019) 12:1888–90. doi: 10.1016/j.jcmg.2019.03.018
38. Shi C, Zhang H, Zhang N, Liu D, Fan Z, Sun Z, et al. The dynamic characteristics of myocardial contractility and extracellular volume in type 2 diabetes mellitus mice investigated by 7.0T cardiac magnetic resonance. J Clin Med. (2022) 11:4262. doi: 10.3390/jcm11154262
39. Low Wang CC, Hess CN, Hiatt WR, and Goldfine AB. Clinical update: cardiovascular disease in diabetes mellitus: atherosclerotic cardiovascular disease and heart failure in type 2 diabetes mellitus - mechanisms, management, and clinical considerations. Circulation. (2016) 133:2459–502. doi: 10.1161/CIRCULATIONAHA.116.022194
40. Russo C, Jin Z, Elkind MS, Rundek T, Homma S, Sacco RL, et al. Prevalence and prognostic value of subclinical left ventricular systolic dysfunction by global longitudinal strain in a community-based cohort. Eur J Heart Fail. (2014) 16:1301–9. doi: 10.1002/ejhf.154
41. Stokke TM, Hasselberg NE, Smedsrud MK, Sarvari SI, Haugaa KH, Smiseth OA, et al. Geometry as a confounder when assessing ventricular systolic function: comparison between ejection fraction and strain. J Am Coll Cardiol. (2017) 70:942–54. doi: 10.1016/j.jacc.2017.06.046
42. Schelbert EB, Sabbah HN, Butler J, and Gheorghiade M. Employing extracellular volume cardiovascular magnetic resonance measures of myocardial fibrosis to foster novel therapeutics. Circ Cardiovasc Imaging. (2017) 10:e005619. doi: 10.1161/CIRCIMAGING.116.005619
43. Bojer AS, Sørensen MH, Madsen SH, Broadbent DA, Plein S, Gæde P, et al. The independent association of myocardial extracellular volume and myocardial blood flow with cardiac diastolic function in patients with type 2 diabetes: a prospective cross-sectional cohort study. Cardiovasc Diabetol. (2023) 22:78. doi: 10.1186/s12933-023-01804-9
44. Fröjdh F, Fridman Y, Bering P, Sayeed A, Maanja M, Niklasson L, et al. Extracellular volume and global longitudinal strain both associate with outcomes but correlate minimally. JACC Cardiovasc Imaging. (2020) 13:2343–54. doi: 10.1016/j.jcmg.2020.04.026
45. Al-Badri A, Hashmath Z, Oldland GH, Miller R, Javaid K, Syed AA, et al. Poor glycemic control is associated with increased extracellular volume fraction in diabetes. Diabetes Care. (2018) 41:2019–25. doi: 10.2337/dc18-0324
46. Black N, Bradley J, Schelbert EB, Bonnett LJ, Lewis GA, Lagan J, et al. Remote myocardial fibrosis predicts adverse outcome in patients with myocardial infarction on clinical cardiovascular magnetic resonance imaging. J Cardiovasc Magn Reson. (2024) 26:101064. doi: 10.1016/j.jocmr.2024.101064
47. Kramer CM, Barkhausen J, Flamm SD, Kim RJ, and Nagel E. Society for Cardiovascular Magnetic Resonance Board of Trustees Task Force on Standardized Protocols. Standardized cardiovascular magnetic resonance (CMR) protocols 2013 update. J Cardiovasc Magn Reson. (2013) 15:91. doi: 10.1186/1532-429X-15-91
48. Moon JC, Messroghli DR, Kellman P, Piechnik SK, Robson MD, Ugander M, et al. Myocardial T1 mapping and extracellular volume quantification: a Society for Cardiovascular Magnetic Resonance (SCMR) and CMR Working Group of the European Society of Cardiology consensus statement. J Cardiovasc Magn Reson. (2013) 15:92. doi: 10.1186/1532-429X-15-92
49. Tsuda T, Gao E, Evangelisti L, Markova D, Ma X, and Chu ML. Post-ischemic myocardial fibrosis occurs independent of hemodynamic changes. Cardiovasc Res. (2003) 59:926–33. doi: 10.1016/s0008-6363(03)00519-4
50. Bulluck H, Rosmini S, Abdel-Gadir A, White SK, Bhuva AN, Treibel TA, et al. Automated extracellular volume fraction mapping provides insights into the pathophysiology of left ventricular remodeling post-reperfused ST-elevation myocardial infarction. J Am Heart Assoc. (2016) 5:e003555. doi: 10.1161/JAHA.116.003555
51. Carrick D, Haig C, Rauhalammi S, Ahmed N, Mordi I, McEntegart M, et al. Pathophysiology of LV remodeling in survivors of STEMI: inflammation, remote myocardium, and prognosis. JACC Cardiovasc Imaging. (2015) 8:779–89. doi: 10.1016/j.jcmg.2015.03.007
Keywords: cardiac magnetic resonance, synthetic extracellular volume, diabetes, acute myocardial infarction, major adverse cardiac events
Citation: Chen L, Qiu B, Du X, Liu J, Lu Y, Che W and Chen W (2025) Establishment of a synthetic ECV model and its prognostic value in diabetes patients with acute myocardial infarction. Front. Endocrinol. 16:1534236. doi: 10.3389/fendo.2025.1534236
Received: 25 November 2024; Accepted: 04 June 2025;
Published: 25 June 2025.
Edited by:
Manoj Kumar Mahata, Belle Vue Clinic, IndiaReviewed by:
Alexander E Berezin, Paracelsus Medical University, AustriaHanqing Liu, Zhejiang University, China
Copyright © 2025 Chen, Qiu, Du, Liu, Lu, Che and Chen. This is an open-access article distributed under the terms of the Creative Commons Attribution License (CC BY). The use, distribution or reproduction in other forums is permitted, provided the original author(s) and the copyright owner(s) are credited and that the original publication in this journal is cited, in accordance with accepted academic practice. No use, distribution or reproduction is permitted which does not comply with these terms.
*Correspondence: Yuan Lu, eHlmeWx1eXVhbkAxNjMuY29t; Wensu Chen, Y2hlbi53ZW5zdUAxNjMuY29t; Wenliang Che, Y2hld2VubGlhbmdAdG9uZ2ppLmVkdS5jbg==
†These authors have contributed equally to this work