 Yipeng Fang
 Aizhen Dou
 Ying Zhang1
 Yunfei Zhang
 Yan Cui
 Keliang Xie
- 1Department of Critical Care Medicine, Tianjin Medical University General Hospital, Tianjin, China
- 2Firth Clinical College, Xinxiang Medical University, Xinxiang, Henan, China
- 3Tianjin Hospital, Tianjin, China
- 4Department of Pathogen Biology, School of Basic Medical Sciences, Tianjin Medical University, Tianjin, China
- 5Department of Anesthesiology, Tianjin Institute of Anesthesiology, Tianjin Medical University General Hospital, Tianjin, China
Background: Stress hyperglycemia ratio (SHR), which adjusts blood glucose levels using glycated hemoglobin to eliminate the influence of chronic hyperglycemia, has been demonstrated to have superior predictive value than absolute hyperglycemia. However, its predictive value for sepsis-associated acute kidney injury (SA-AKI) remains unclear. This study aimed to investigate the relationship between the SHR and the risk of developing SA-AKI.
Methods: Data were extracted from the Medical Information Mart for Intensive Care IV (MIMIC-IV) database. Restricted cubic splines (RCS) were employed to depict the relationship between SHR and the likelihood of SA-AKI, determining an optimal cut-off value. Based on this threshold, patients were categorized into two groups. Logistic regression was utilized to evaluate SHR’s predictive value for SA-AKI, with adjustments for confounding variables. Propensity score matching (PSM) was applied to balance baseline characteristics. Subgroup and sensitivity analyses were conducted.
Results: A total of 2,249 patients were included. The RCS curve indicated a non-linear positive association between SHR and the likelihood of SA-AKI (P for non-linearity < 0.001), with an optimal cut-off at 1.55. Accordingly, patients were divided into SHR ≤ 1.55 and SHR > 1.55 subgroups, comprising 1,131 and 1,118 individuals, respectively. A higher incidence of SA-AKI was observed in the SHR > 1.55 group (38.64% vs. 27.23%, P < 0.001). This association persisted after baseline adjustment through PSM. Logistic regression analysis confirmed that SHR > 1.55 was linked to increased odds of SA-AKI in both unadjusted (OR: 1.68, P < 0.001) and adjusted models (OR: 1.73, P < 0.001), with SHR ≤ 1.55 serving as the reference. In subgroup analysis, all subgroups consistently demonstrated a significant association between SHR > 1.55 and elevated odds of SA-AKI (all OR > 1). Sensitivity analysis validated that SHR > 1.55 remained significantly correlated with SA-AKI occurrence in the survival subgroup (OR: 1.46, P < 0.001) and the non-CKD subgroup (OR: 1.69, P < 0.001).
Conclusion: The findings indicate a non-linear positive relationship between SHR and the likelihood of SA-AKI in patients with sepsis, suggesting that SHR could be a potential predictor for SA-AKI.
1 Background
Sepsis is a complex condition triggered by infection, leading to a cascade of pathological, physiological, and molecular changes in the body (1). It remains a leading cause of mortality in intensive care units (ICUs) worldwide (2), often associated with the onset of multi-organ failure. When acute kidney injury (AKI) develops in the context of sepsis, it is referred to as sepsis-associated acute kidney injury (SA-AKI) (3, 4). Evidence indicates that the clinical outcomes for SA-AKI are poorer compared to sepsis accompanied by other complications (3, 5), underscoring the potential benefits of early SA-AKI detection to improve the prognosis of patients with sepsis.
Stress hyperglycemia frequently occurs in acute illnesses, characterized by a transient rise in blood glucose levels due to inflammatory and neuroendocrine disturbances during the illness (6). However, assessing stress hyperglycemia based solely on blood glucose levels may fail to account for the effects of chronic hyperglycemia. To address this limitation, glycated hemoglobin (HbA1c) has been suggested as a baseline indicator of blood glucose, with the stress hyperglycemia ratio (SHR) proposed as a more precise biomarker for evaluating acute hyperglycemia rather than absolute blood glucose elevation (7). SHR was initially reported by Roberts GW in 2015 and is calculated by dividing the absolute blood glucose level by the estimated chronic glucose level derived from HbA1c conversion (7). HbA1c reflects average glucose levels over the previous three months and remains relatively unaffected by the acute onset of illness (8–10). Previous research has predominantly explored the association between SHR and adverse outcomes in cardiovascular events, such as acute coronary syndrome and severe myocardial infarction (11, 12).
During sepsis, the body undergoes a state of stress characterized by activation of the sympathetic nervous system and elevated corticosteroid levels, resulting in increased glucose metabolism and dysregulation, which in turn contribute to higher mortality rates (13–15). Current research examining the link between stress hyperglycemia and sepsis is still limited. In 2020, Fabbri et al. conducted an observational study, finding that SHR ≥ 1.14 was strongly associated with all-cause mortality (OR = 5.25, 95% CI 3.62–7.63) among patients with diabetes and sepsis (16). Another study demonstrated a U-shaped relationship between SHR and both 28-day all-cause mortality and in-hospital mortality in patients with sepsis, regardless of type 2 diabetes status (17). Evidence suggests that hyperglycemia at admission may impair renal function by intensifying oxidative stress, inflammation, endothelial dysfunction, hypovolemia, and dehydration, all of which reduce renal perfusion (6). Research by Yu Shan et al. showed a significant correlation between SHR and increased incidence of contrast-induced AKI (CI-AKI) in patients undergoing coronary angiography (CAG) or percutaneous coronary intervention (PCI) (18). However, no studies to date have investigated the potential association between SHR and AKI occurrence specifically in patients with sepsis.
This study hypothesized that higher SHR is associated with increased likelihood of developing SA-AKI, indicating its potential value for early identification of SA-AKI. The aim was to explore the relationship between SHR and the likelihood of AKI in patients with sepsis, with the goal of informing early detection and prevention strategies, ultimately leading to improving patient outcomes.
2 Study design and methods
2.1 Data source
This single-center retrospective study leveraged data from the Medical Information Mart for Intensive Care (MIMIC-IV version 2.2) database, a comprehensive, publicly accessible dataset containing over 70,000 de-identified ICU records from 50,000 patients admitted to Beth Israel Deaconess Medical Center (BIDMC) between 2008 and 2019 (19). Access to the database was granted following completion of training and examination through the National Institutes of Health (NIH) online course (certificate number 43025968). The MIMIC-IV database has ethical approval from the Massachusetts Institute of Technology (MIT) Ethics Committee, and the requirement for informed consent was waived due to the retrospective nature of the study and the use of anonymized data.
2.2 Study population
The study population consisted of patients admitted to the ICU from 2008 to 2019, with the following exclusion criteria applied: repeat admissions, patients under 18 years of age, absence of sepsis diagnosis, AKI preceding the onset of sepsis, incomplete SHR data (missing blood glucose or HbA1c), and ICU stays shorter than 48 hours. Sepsis was diagnosed according to the Sepsis 3.0 criteria (20), while sepsis-associated acute kidney injury (SA-AKI) was defined based on the 28th Acute Disease Quality Initiative workgroup’s consensus, as AKI meeting the KDIGO diagnostic criteria following sepsis onset (21). In this study, only the creatinine-based KDIGO criteria were utilized, with AKI defined as either a 50% increase in serum creatinine from baseline within seven days of sepsis diagnosis or an increase in serum creatinine by more than 26.5 μmol/L within 48 hours (22).
2.3 Exposure and outcomes
The primary exposure variable was the SHR, a composite index derived from blood glucose and HbA1c, calculated using the following formula: SHR = blood glucose (mg/dL)/(28.7 × HbA1c (%) − 46.7) (7). The highest recorded blood glucose and HbA1c values during the ICU stay were used for SHR calculation in patients with sepsis.
The primary outcome was the incidence of new-onset AKI within the first 48 hours following sepsis diagnosis. Secondary outcomes included hospital mortality, ICU mortality, 28-day mortality, 90-day mortality, as well as length of hospital stay (hospital-LOS) and ICU stay (ICU-LOS).
2.4 Data extraction and definitions
In this study, baseline information included demographic data, comorbidities, laboratory parameters, mean blood pressure (MBP), interventions, and disease severity scores. Demographic details covered age, sex, race, and body weight. Comorbidities were identified using International Classification of Diseases (ICD) codes and the Charlson Comorbidity Index, including conditions such as coronary heart disease, heart failure, hypertension, diabetes mellitus, anemia, chronic pulmonary disease, chronic kidney disease, liver disease, and malignant cancer. Laboratory data collected from ICU admission until sepsis diagnosis included the maximum or minimum values of white blood cell count, hemoglobin, mean corpuscular volume (MCV), red cell distribution width (RDW), platelets, sodium, potassium, total calcium, anion gap (AG), alanine aminotransferase (ALT), aspartate aminotransferase (AST), alkaline phosphatase (ALP), bilirubin, creatinine, blood urea nitrogen (BUN), international normalized ratio (INR), prothrombin time (PT), activated partial thromboplastin time (APTT), lactate, and SHR. Data on interventions received from ICU admission to sepsis diagnosis, such as mechanical ventilation, vasoactive drugs, and diuretic use, were also collected. Vital signs within the same timeframe were recorded.
2.5 Data cleaning
Patients missing either blood glucose or HbA1c data required for SHR calculation were excluded from the final analysis. To preserve data integrity in AKI diagnosis, all creatinine values were maintained in their original form without any imputation. Outliers for continuous variables with normal distribution were defined as values more than three standard deviations (SD) from the mean. For non-normally distributed continuous variables, outliers were defined as values beyond three times the interquartile range (IQR) above the third quartile (Q3) or below the first quartile (Q1) and were treated as missing data. Missing values were imputed using the mean or median, depending on data distribution, if the percentage of missing data was below 10%. For 10-20% missing data, random forest interpolation was applied. Variables with over 20% missing values were excluded from the analysis.
2.6 Statistical analysis
Continuous variables following a normal distribution were presented as mean ± SD and analyzed using the unpaired Student’s t-test. Those with a non-normal distribution were reported as median and IQR and assessed with the Mann-Whitney U test. Categorical variables were expressed as counts and percentages, with analyses performed using the Chi-square test.
Restricted cubic spline (RCS) regression was employed to visualize the potential non-linear relationship between SHR and the odds of developing SA-AKI. An optimal cut-off value of 1.55 was identified, prompting the categorization of patients into SHR ≤ 1.55 and SHR > 1.55 groups. Logistic regression analysis, both univariate and multivariate, was used to investigate the association between SHR and SA-AKI odds. Adjusted models were constructed to minimize the influence of confounders, incorporating demographic characteristics and comorbidities. Multicollinearity was assessed using the variance inflation factor (VIF), with variables showing VIF > 10 converted to binary variables based on median or mean values to address collinearity concerns. Adjusted models were also applied in the RCS analysis. Propensity score matching (PSM) was conducted to balance baseline characteristics, employing a 1:1 nearest neighbor matching without replacement and a caliper width of 0.02. Subgroup analyses were performed based on age, sex, race, weight, diabetes status, SOFA score, and diuretic use to explore potential interactions and assess result robustness. Forest plots were generated to illustrate subgroup analysis findings. Additionally, sensitivity analysis was performed by excluding patients who died or had a prior history of CKD to further validate the stability of the results.
Data analyses were conducted using Stata (version 15.0 S.E.) and R (version 4.3.2), with statistical significance set at a two-sided P-value of ≤ 0.05.
3 Results
3.1 Baseline information and clinical endpoints
Figure 1 illustrates the flowchart for patient selection, showing that 2,249 patients were included in the study, with 740 patients diagnosed with SA-AKI and 1,509 without. Table 1 compares baseline characteristics between the SA-AKI and non-SA-AKI groups. Patients in the SA-AKI group were older (70.14 ± 13.09 vs. 66.71 ± 14.60, P < 0.001) and had a higher prevalence of coronary artery disease, heart failure, diabetes, anemia, and chronic kidney disease, while hypertension was less common (all P < 0.01). Additionally, patients with SA-AKI were more likely to require mechanical ventilation, vasoactive drugs, and diuretics and had elevated SOFA and SAPSII scores (all P < 0.01). Laboratory comparisons revealed that the SA-AKI group had significantly higher levels of white blood cells, RDW, AG, creatinine, BUN, INR, PT, APTT, lactate, and SHR, while hemoglobin, platelet count, and sodium levels were lower (all P < 0.001). The SA-AKI group also exhibited higher mortality rates and longer LOS compared to the non-SA-AKI group (all P < 0.01).
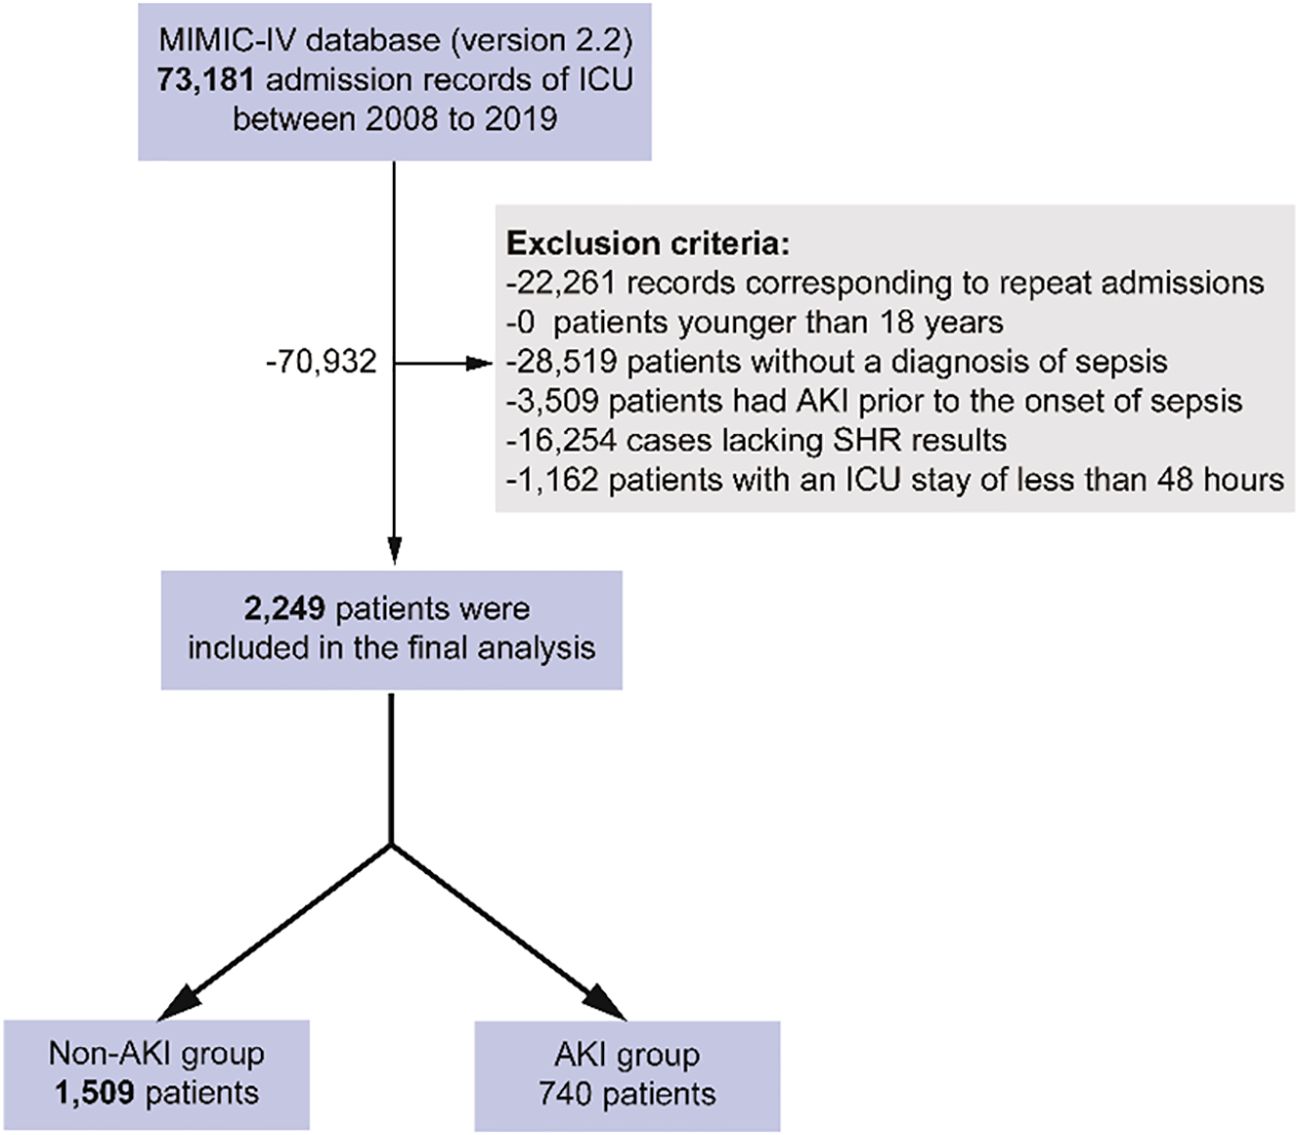
Figure 1. Flowchart of patient selection.
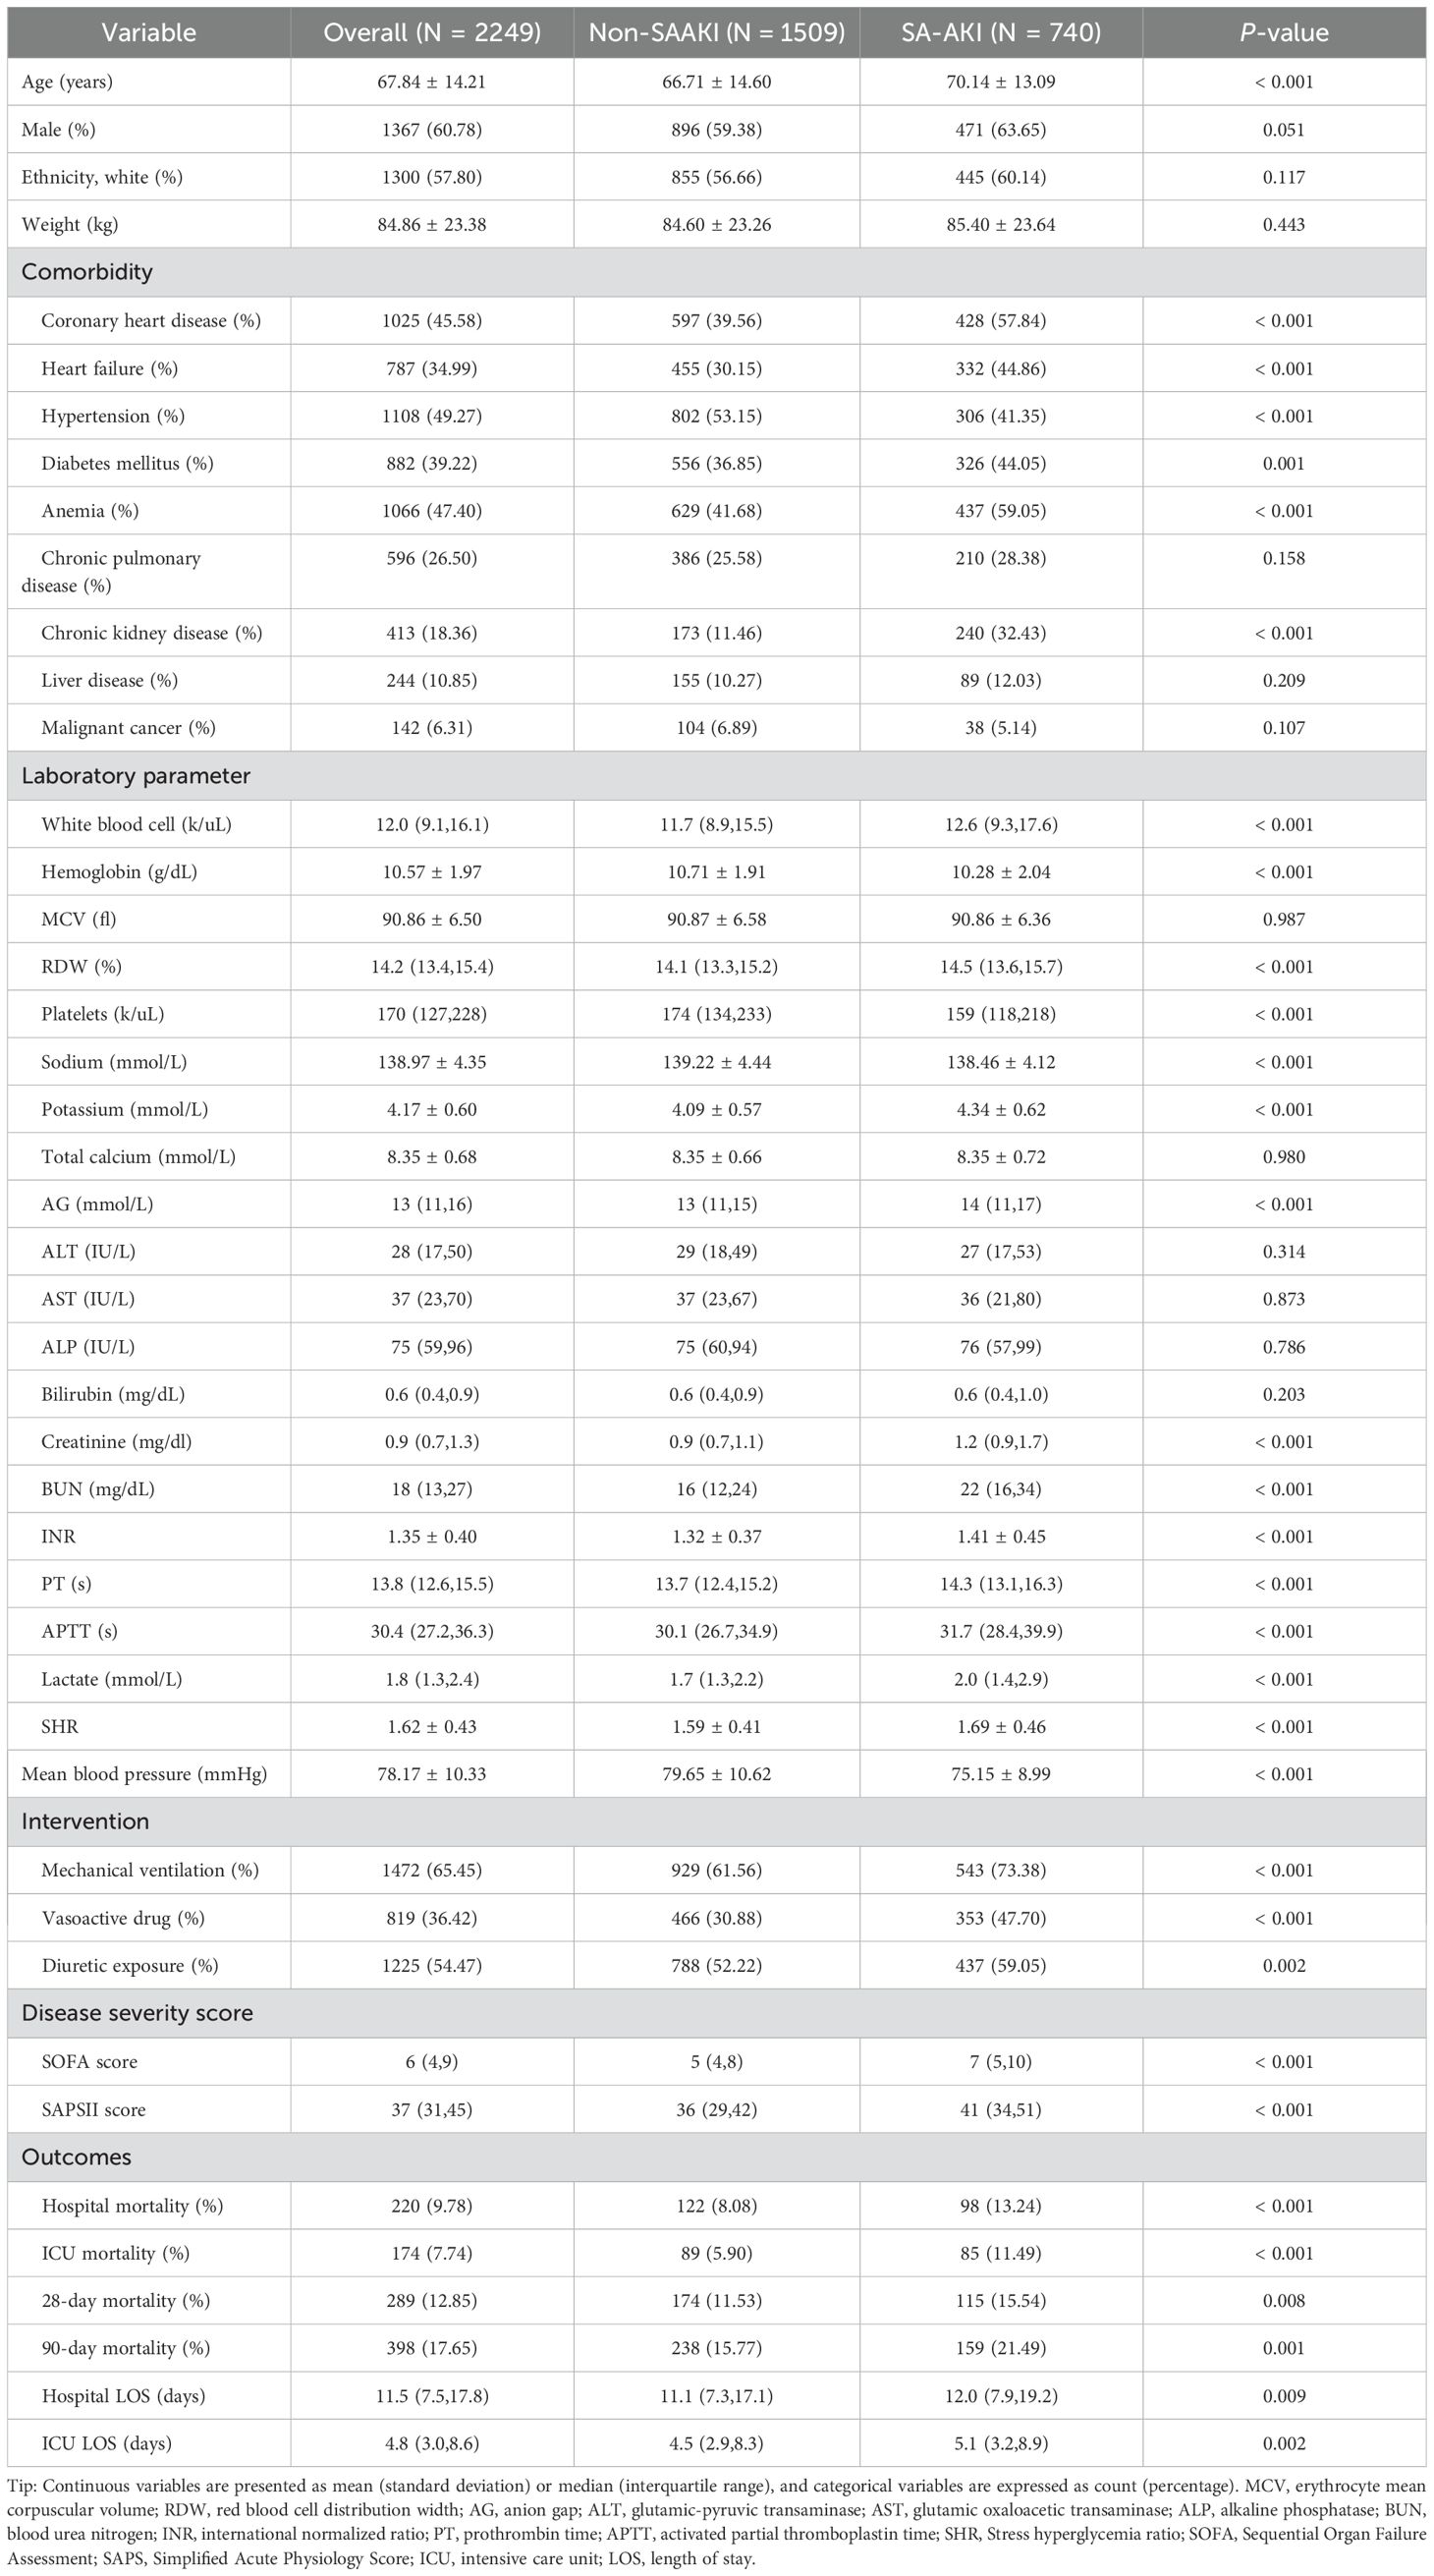
Table 1. Baseline information and clinical endpoints in patients with and without SA-AKI.
3.2 Non-linear relationship between SHR and the odds of SA-AKI
Figure 2 displays the RCS curve analysis, revealing a non-linear positive relationship between SHR and the likelihood of developing SA-AKI (P for non-linearity < 0.001), with the odds increasing as SHR rises. An SHR value above 1.55 emerged as an independent risk factor for SA-AKI (Figure 2A), a pattern that persisted in the adjusted model (Figure 2B).
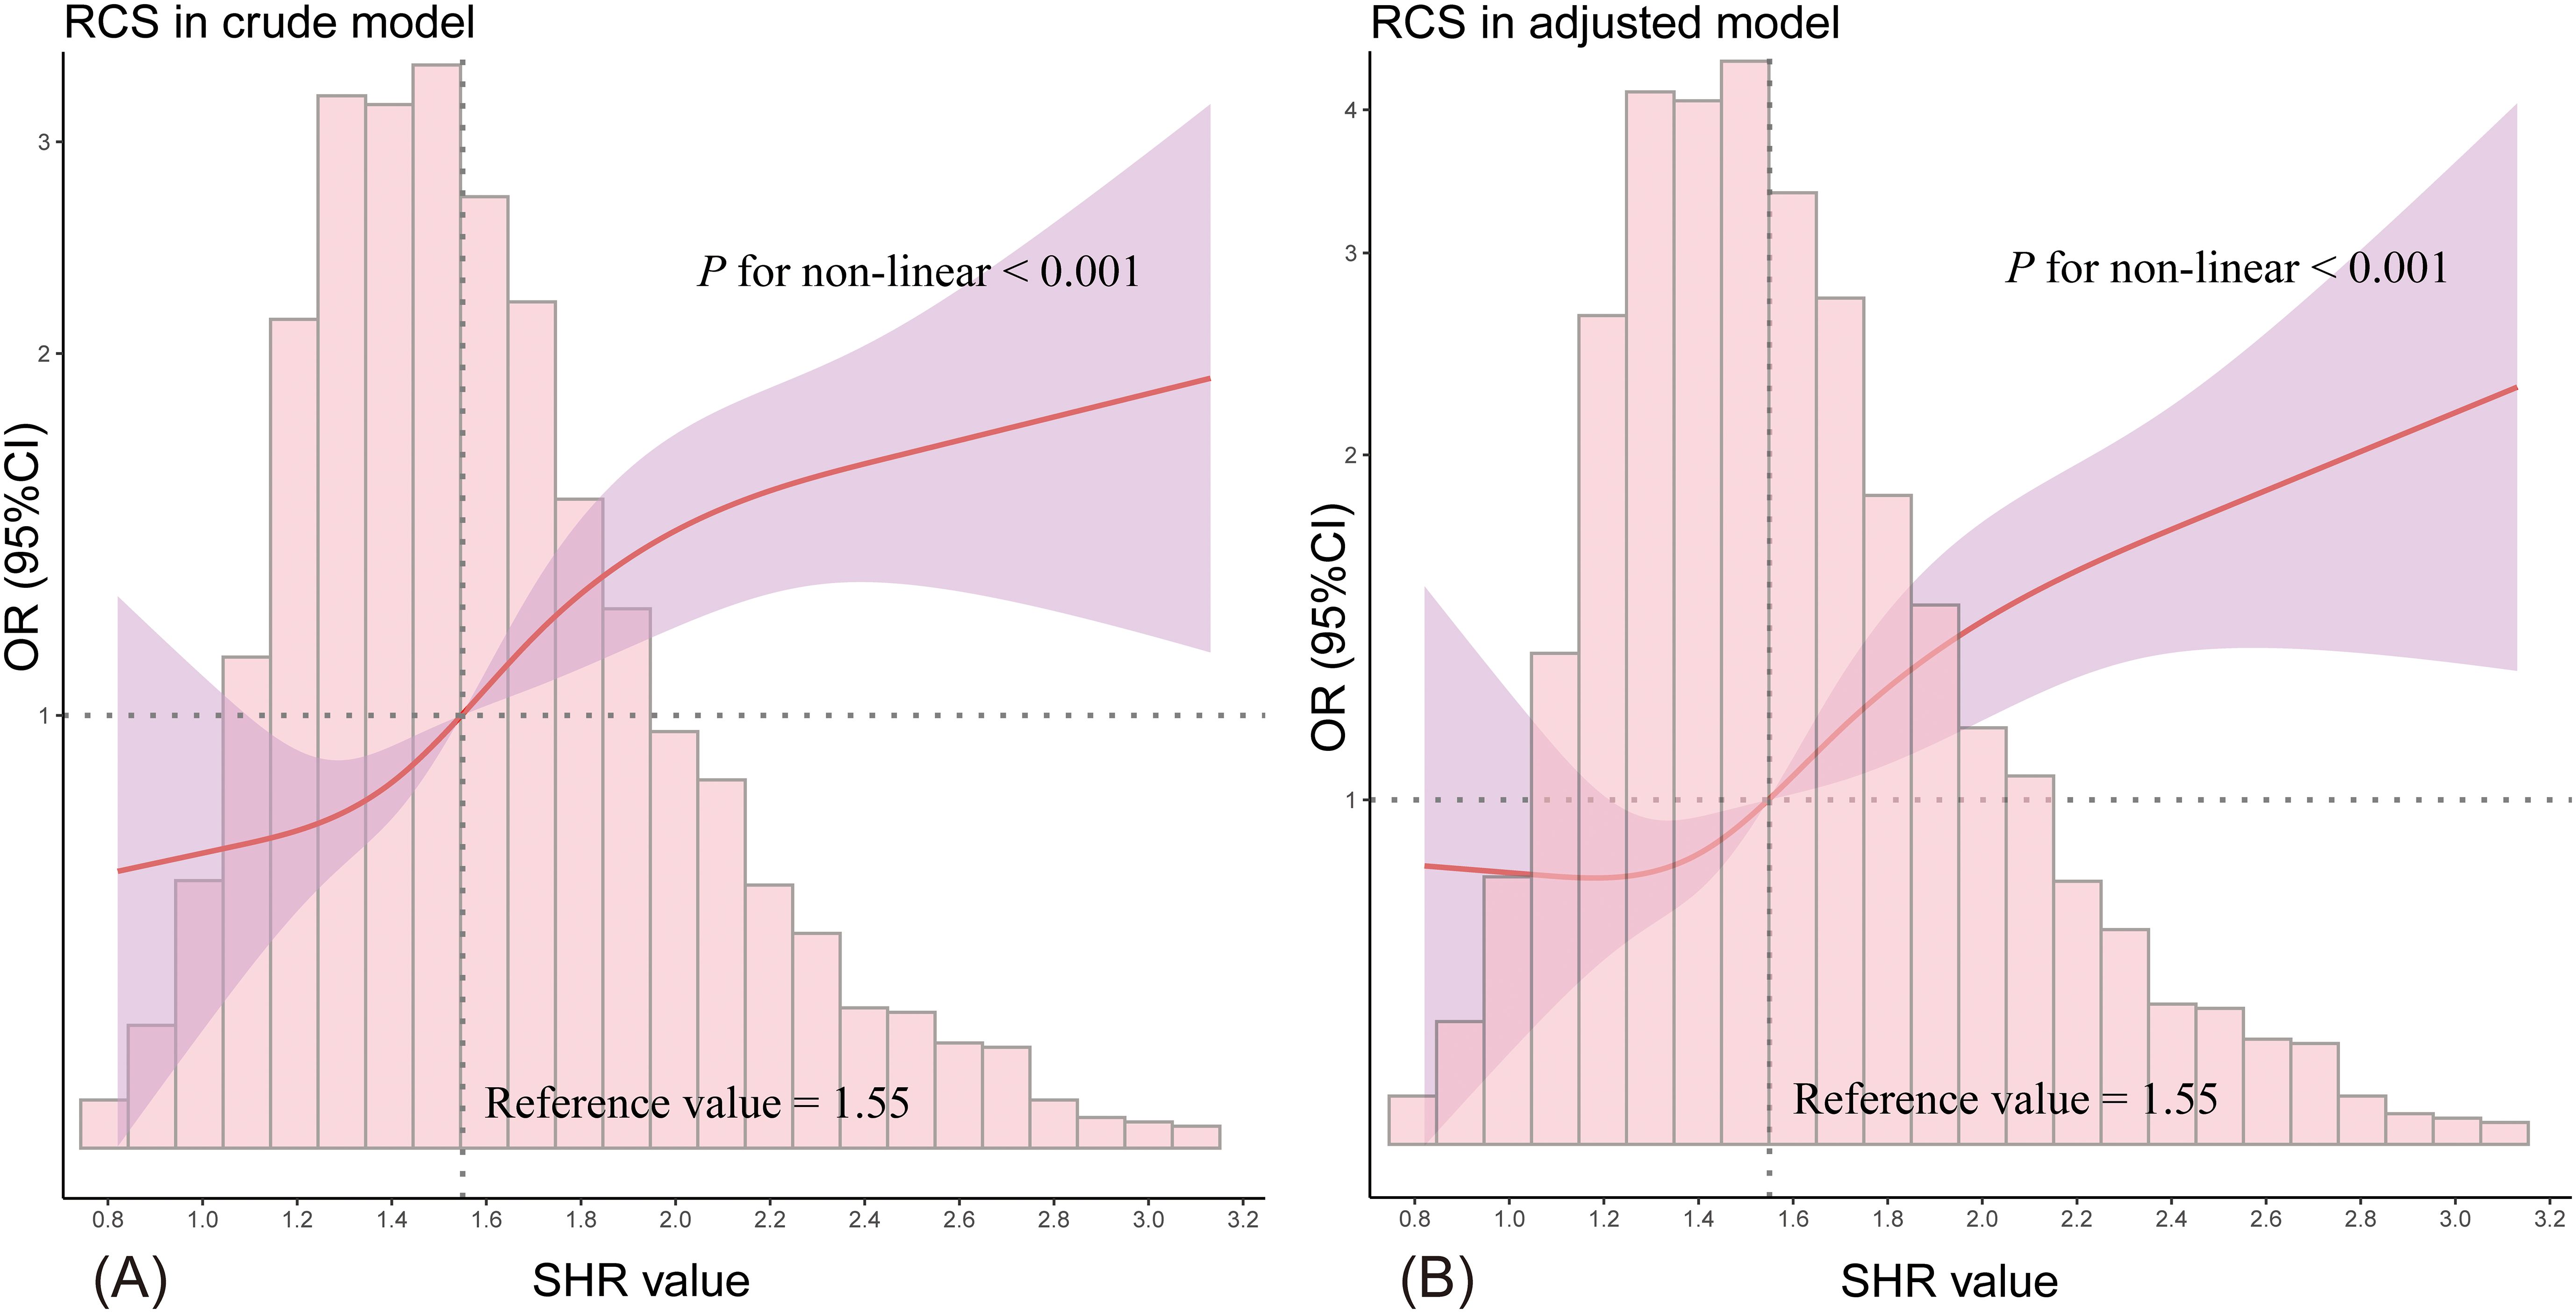
Figure 2. The RCS curve illustrates the non-linear relationship between SHR and the likelihood of SA-AKI. (A) shows the results from the unadjusted model, while (B) presents the adjusted model outcomes. The red solid line represents the odds ratio (OR), the purple shaded area indicates the 95% confidence intervals (95% CI), and the horizontal dashed line marks the null line (OR = 1). The accompanying bar chart displays the distribution of patient proportions.
3.3 Clinical outcomes across various SHR categories
Patients with SHR > 1.55 had a significantly higher incidence of SA-AKI (38.64% vs. 27.23%, P < 0.001, Table 2) compared to those with SHR ≤ 1.55. However, no significant difference was found in the stage of SA-AKI between the groups (P = 0.214). More patients with SA-AKI in the SHR > 1.55 group required CRRT treatment than those in the SHR ≤ 1.55 group (P = 0.006). Additionally, the SHR > 1.55 group showed significantly higher 28-day, 90-day, hospital, and ICU mortality rates, as well as longer hospital and ICU LOS (all P < 0.001). Patients with SHR > 1.55 also had higher SOFA scores and were more likely to need mechanical ventilation and vasopressor support (all P < 0.001). After adjusting for baseline characteristics using PSM, SHR > 1.55 remained significantly associated with a higher incidence of SA-AKI (37.83% vs. 28.01%, P < 0.001), as detailed in Table 3.
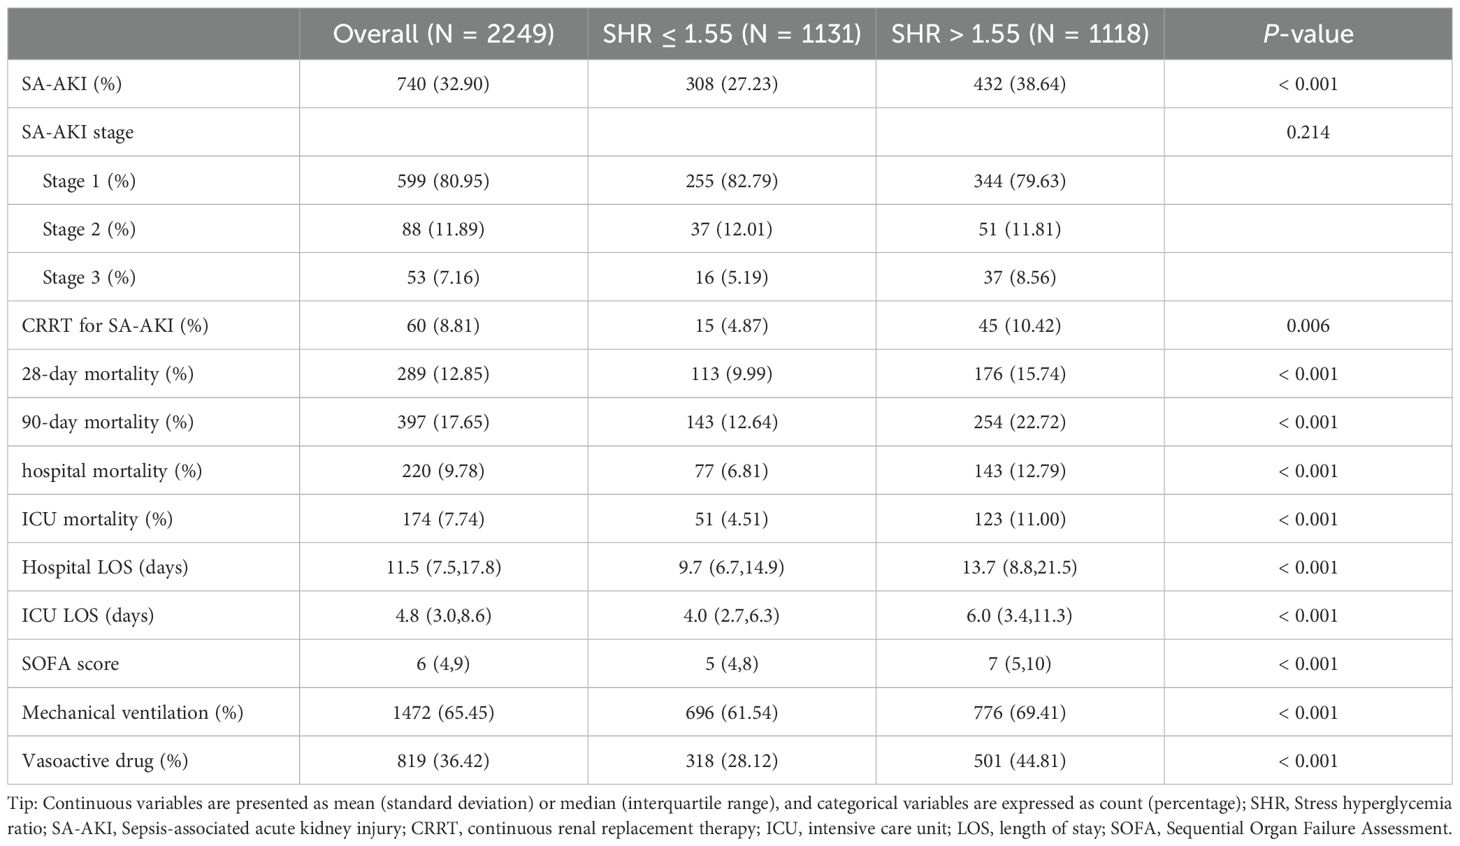
Table 2. Clinical outcomes across various SHR categories.
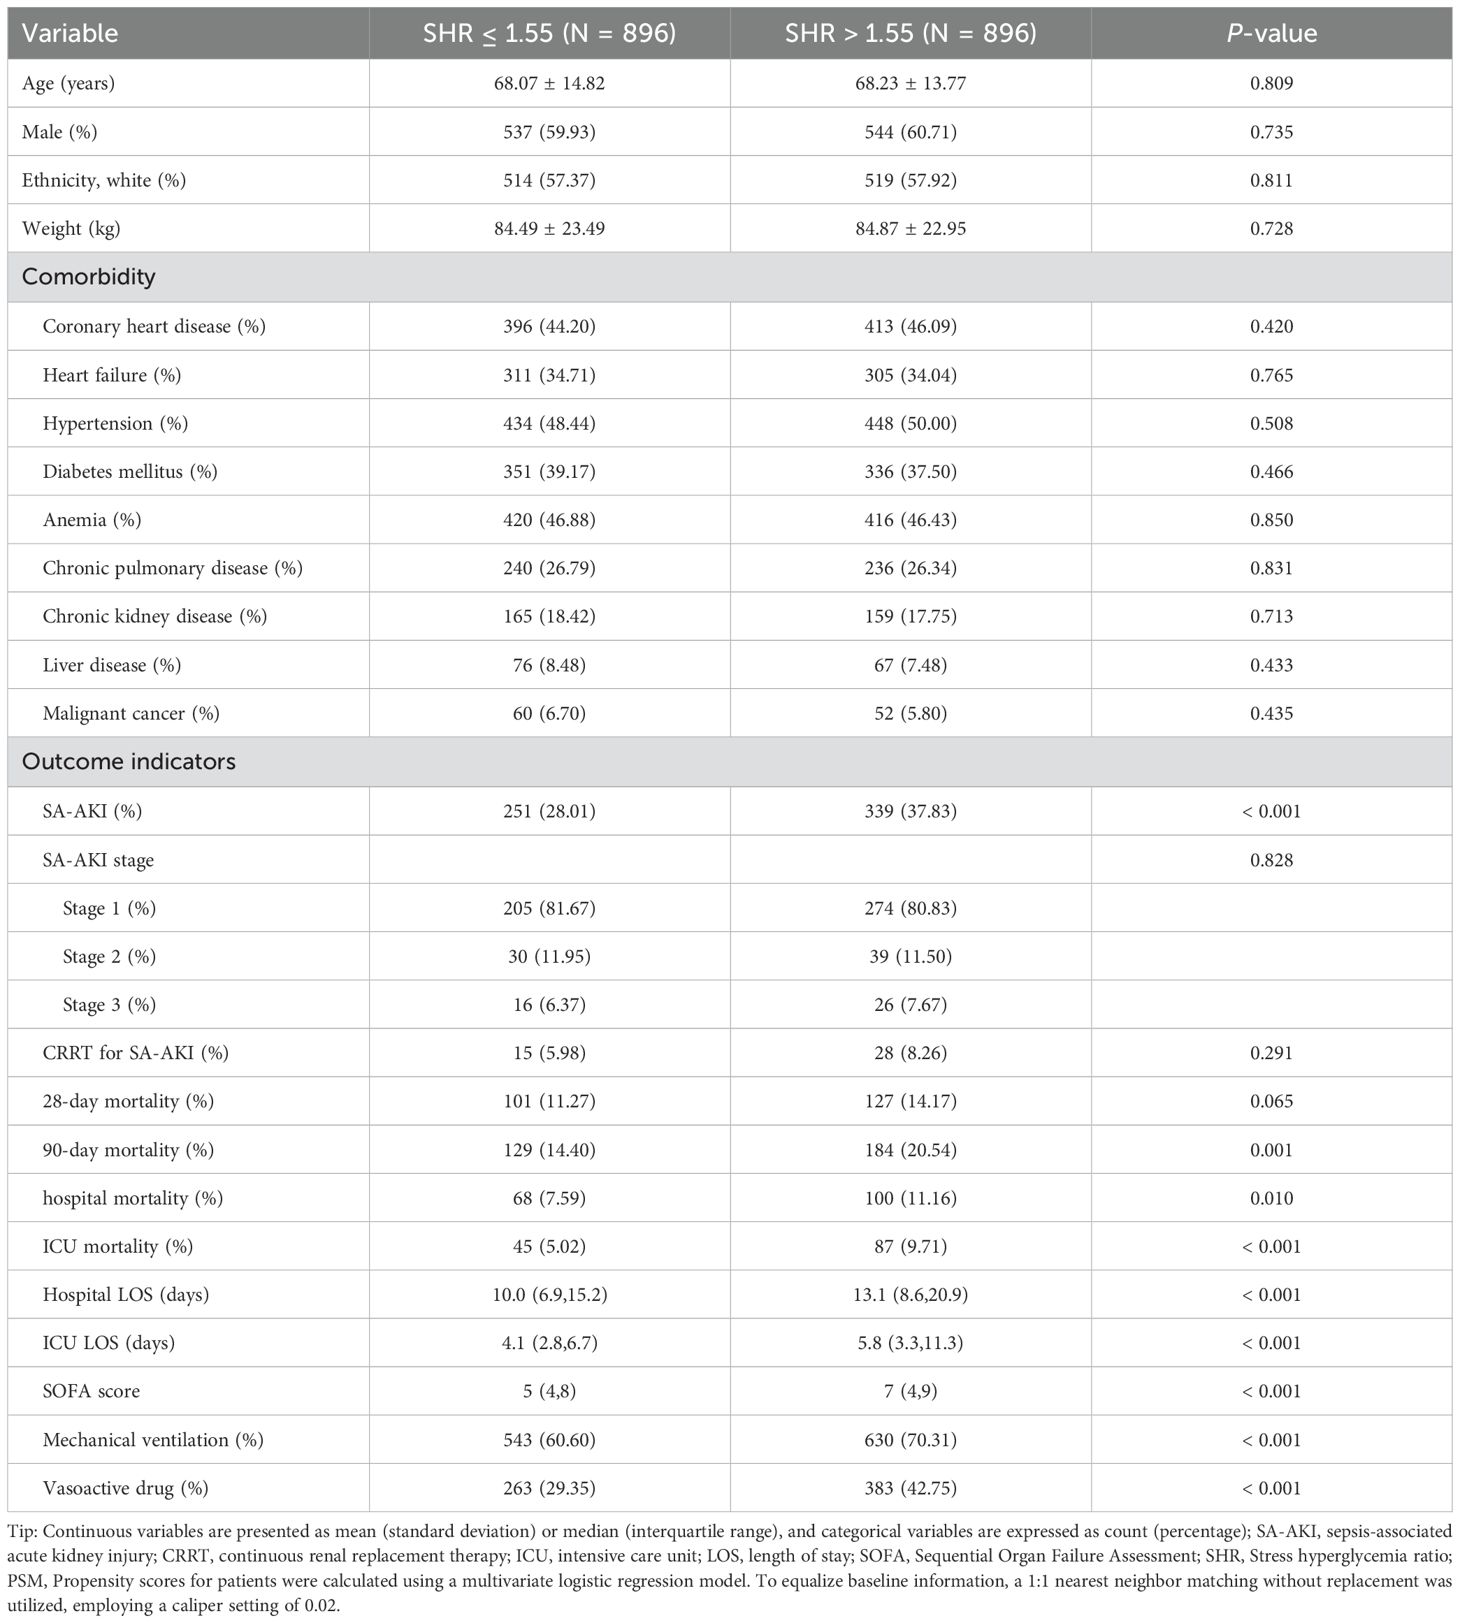
Table 3. Baseline information and clinical endpoints in PSM cohorts.
3.4 Logistic regression analysis
Table 4 presents the logistic regression analysis results, indicating that when SHR was analyzed as a continuous variable, it was significantly associated with a higher likelihood of developing SA-AKI (OR 1.76, 95% CI 1.44–2.15, P < 0.001). This association remained robust after adjusting for potential confounders (OR 1.94, 95% CI 1.56–2.40, P < 0.001). Using SHR ≤ 1.55 as a reference, SHR > 1.55 was significantly linked to the incidence of SA-AKI (OR 1.68, 95% CI 1.41–2.01, P < 0.001), indicating a 73% increased probability of SA-AKI (OR 1.73, 95% CI 1.44–2.09, P < 0.001). Additionally, SHR was categorized into quartiles: Q1 (SHR ≤ 1.31), Q2 (1.31 < SHR ≤ 1.55), Q3 (1.55 < SHR ≤ 1.85), and Q4 (SHR > 1.85). Compared to Q1, the Q4 category showed an 82% higher likelihood of SA-AKI (OR 1.82, 95% CI 1.42–2.35, P < 0.001), followed by Q3 (OR 1.58, 95% CI 1.22–2.03, P < 0.001). No significant difference was observed between Q1 and Q2 (OR 1.02, 95% CI 0.78–1.32, P = 0.908).
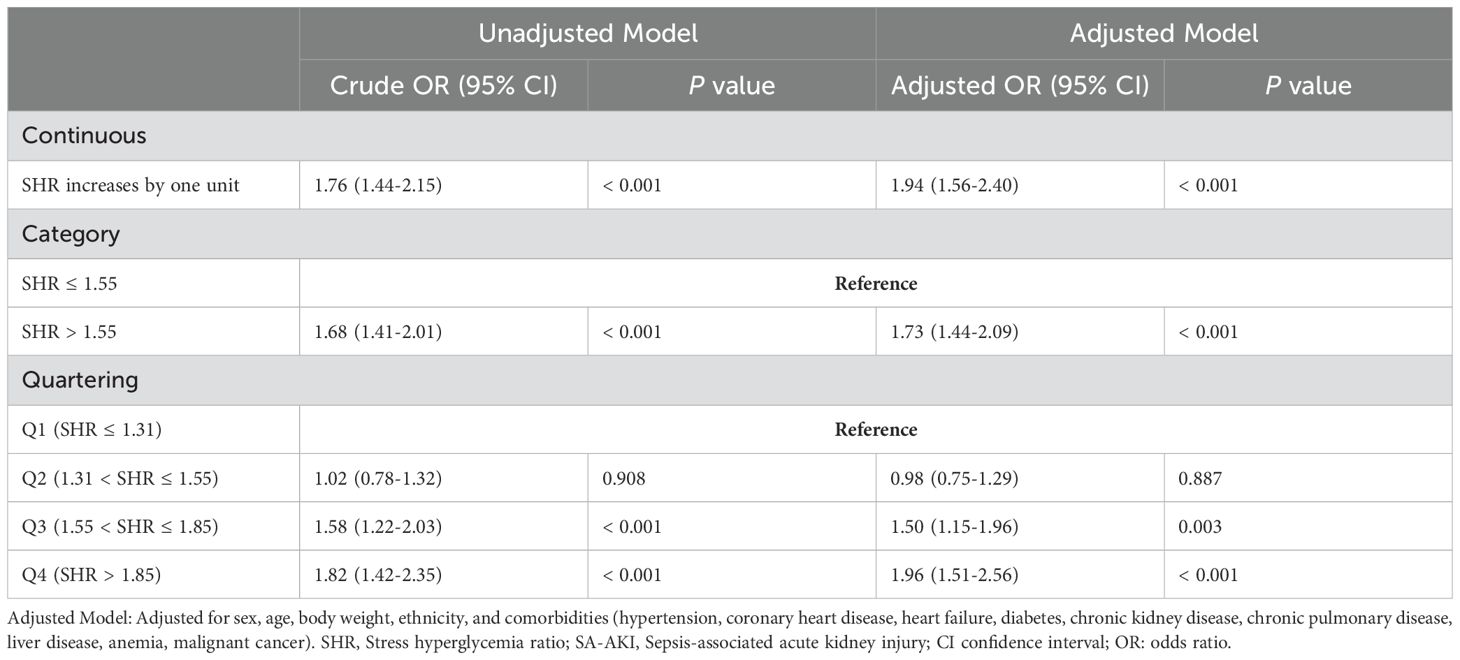
Table 4. Logistic regression analysis evaluating the impact of SHR on the development of SA-AKI.
3.5 Subgroup analysis
Figures 3A, B depicts the forest plot from the subgroup analysis. Apart from a significant interaction between body weight and SHR (P for interaction = 0.028), no other significant interactive effects were found, including diabetes (all P > 0.05). Obese patients (body weight ≥ 84 kg) exhibited a more pronounced association with SA-AKI (OR 2.22, 95% CI 1.67–2.96). The analysis consistently demonstrated a significant relationship between elevated SHR and increased odds of SA-AKI (all OR > 1). To further explore how diabetes affects the relationship between SHR and developing SA-AKI, RCS curves were constructed in both diabetic and non-diabetic populations separately. While 1.55 remained a valid cutoff, and the non-diabetic subgroup showed a nonlinear relationship consistent with the overall cohort (P for non-linearity < 0.001, see in Figure 3C). However, the diabetic subgroup exhibited a linear relationship with a weaker association between SHR and SA-AKI risk (P for non-linearity = 0.878, shown in Figure 3D).
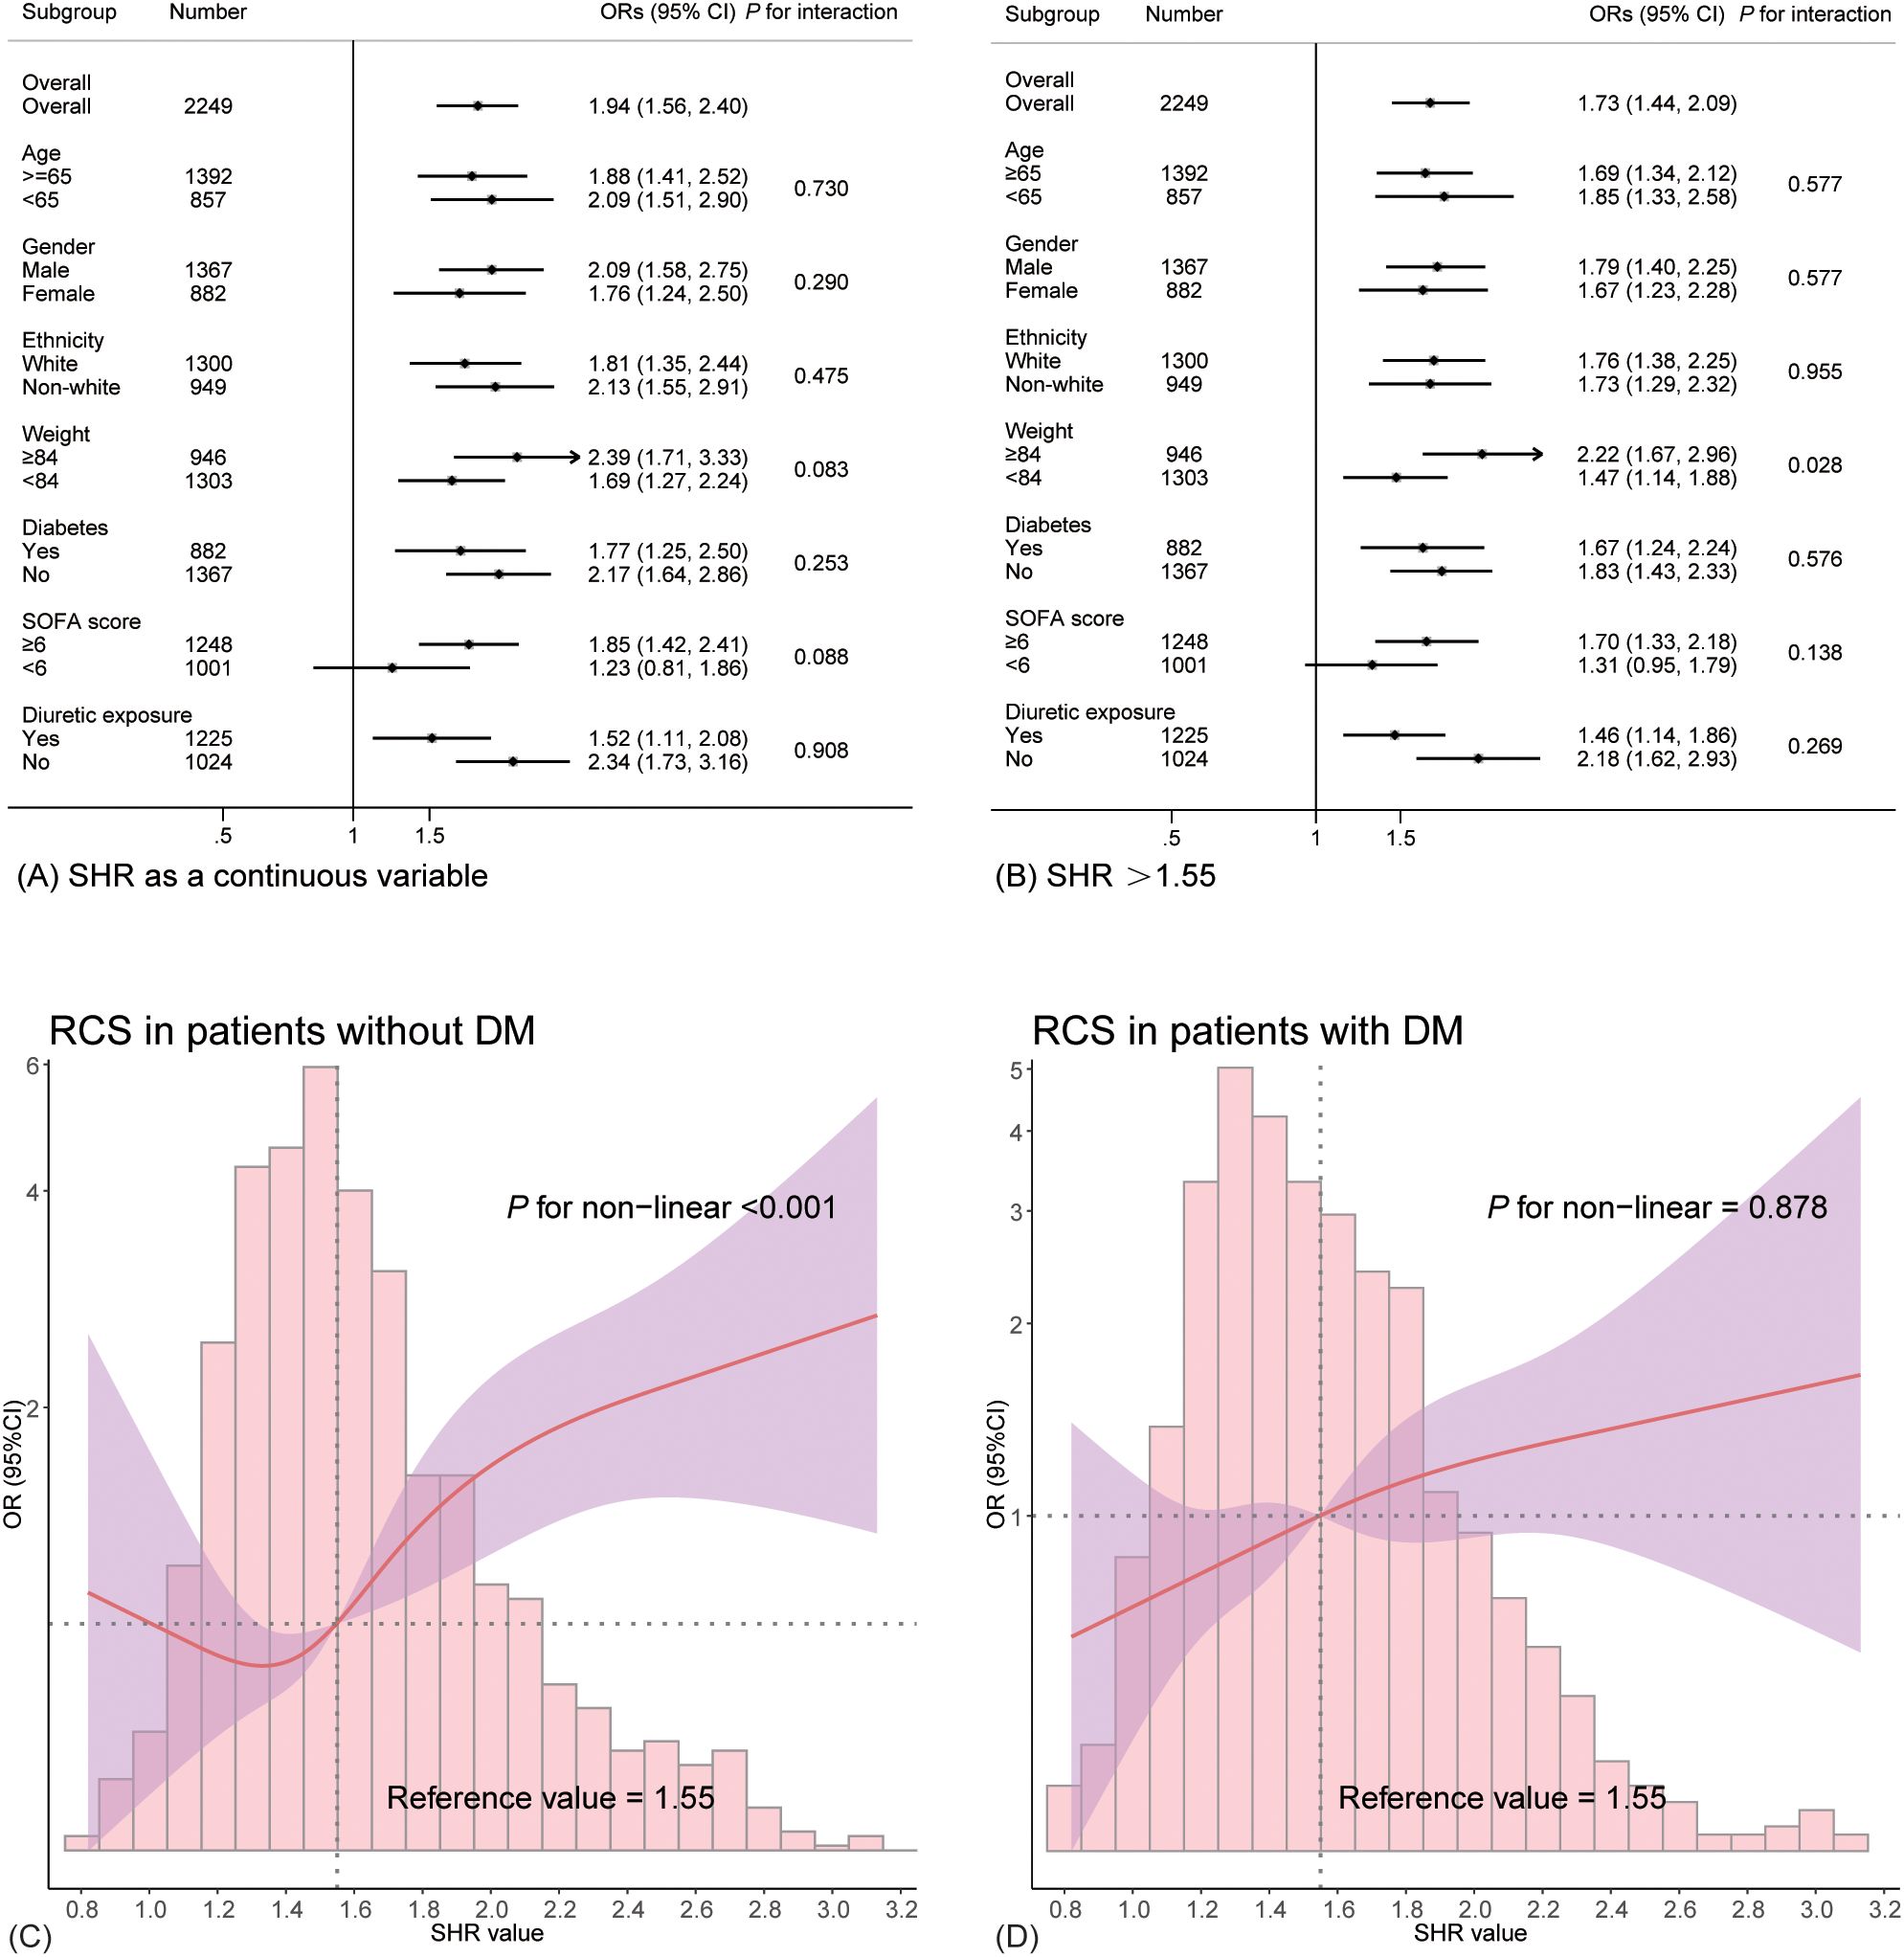
Figure 3. Subgroup analysis depicted in forest plots and RCS curves. (A) presents the results with SHR as a continuous variable, while (B) shows the findings for SHR >1.55. (C, D) illustrates the relationship between SHR and the likelihood of SA-AKI in non-diabetic and diabetic patients.
3.6 Sensitivity analysis
Further logistic regression was performed after excluding non-survivors and patients with a history of chronic kidney disease (CKD) to strengthen the robustness of the findings (Table 5). The results showed that, when treated as a continuous variable, SHR remained significantly associated with higher odds of developing SA-AKI in both the survival subgroup (OR 1.60, 95% CI 1.25–2.04, P < 0.001) and the non-CKD subgroup (OR 2.02, 95% CI 1.59–2.57, P < 0.001). When SHR was treated as a categorical variable, the significant association persisted (all P < 0.001). Using Q1 as the reference, Q4 continued to show a significant association with increased SA-AKI odds (P < 0.001), while no significant differences were observed in Q3 and Q2 (all P > 0.05).
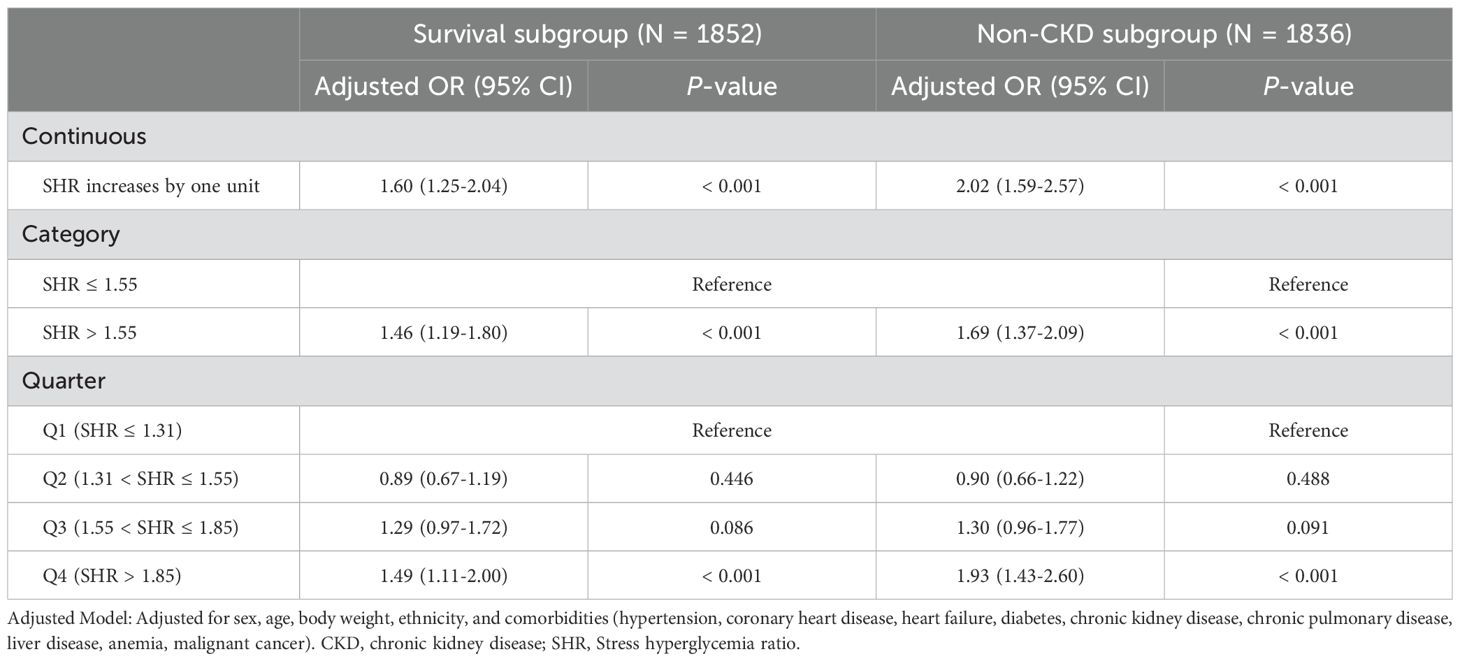
Table 5. Sensitivity analysis in survival and non-CKD subgroups.
4 Discussion
This study represents the novel investigation into the relationship between SHR and the likelihood of developing AKI in patients with sepsis. The RCS curve revealed a non-linear positive association between SHR and the odds of SA-AKI, with a cut-off value identified at 1.55. Logistic regression analysis confirmed that SHR >1.55 was significantly associated with an increased likelihood of SA-AKI. These findings were consistent across subgroup and sensitivity analyses, suggesting the robustness of the results. Given the widespread availability of blood glucose and HbA1c testing and the ease of SHR calculation, SHR could potentially serve as a convenient and effective predictor for SA-AKI.
Stress hyperglycemia is characterized by a marked elevation in blood glucose levels triggered by physiological or pathological stress. Its development is influenced by various complex physiological responses, including hyperproliferation, activation of the sympathoadrenal system, counter-regulatory hormones (e.g., catecholamines, cortisol), and pro-inflammatory cytokines (e.g., TNF-α), which together create a vicious cycle (23–26). By incorporating HbA1c, SHR adjusts for the confounding effects of chronic glucose levels, making it a more precise measure. Recently, SHR has gained recognition as a biomarker significantly associated with increased mortality in various cardiovascular diseases (11, 12, 27, 28). This association may be explained by mechanisms such as endothelial dysfunction and oxidative stress induced by stress hyperglycemia (6). Moreover, hyperglycemia is associated with decreased nitric oxide bioavailability, increased coagulation, and reduced fibrinolytic activity, collectively promoting a prothrombotic state and higher mortality risk (29, 30). Additionally, recent studies have suggested that stress hyperglycemia can stimulate the production of mitochondrial reactive oxygen species (ROS) and advanced glycation end products (AGEs), leading to epigenetic modifications, such as DNA methylation and post-translational histone modifications (31). These epigenetic changes can affect gene expression, and even short-term stress hyperglycemia may have lasting effects on long-term cardiovascular health, a phenomenon referred to as “metabolic memory” (31).
Research indicates that nearly 10% of ICU patients experience stress hyperglycemia (32), an adaptive metabolic response to acute stress (33, 34). However, evidence also suggests that stress hyperglycemia may lead to poorer outcomes in critically ill patients. A study by Mamtani et al., involving 739,152 critically ill patients, demonstrated a significant association between stress hyperglycemia and higher ICU mortality rates, as well as prolonged ICU-LOS (35). Similarly, Zhang et al. identified elevated SHR as an independent risk factor for ICU mortality in a cohort of 3,887 critically ill patients (OR 2.92, 95% CI 2.14–3.97, P < 0.001) (36). Sepsis, a common cause of critical illness, often induces stress states due to abnormal immune activation and massive cytokine release (37), leading to significant blood glucose fluctuations. In line with previous studies (16, 17), our research also found that higher SHR levels were associated with increased mortality and longer hospital stays among patients with sepsis. SHR has been proposed as a potential indicator of disease severity in critically ill populations (7, 27). Our study further supports this, showing a significant association between increased SHR levels and higher SOFA scores, which reflect the extent of organ dysfunction in sepsis (P < 0.001) (38). However, no significant differences were found in the staging of SA-AKI (P > 0.05). Additionally, patients with sepsis exhibiting elevated SHR were more likely to require mechanical ventilation or vasopressor support, highlighting the relationship between high SHR levels and more severe clinical interventions.
The link between stress hyperglycemia and SA-AKI remains unclear, though studies have examined the relationship between stress hyperglycemia and AKI in other contexts. For example, Gao et al. found that in patients with acute myocardial infarction (AMI) and diabetes, each one-unit increase in SHR was associated with a 218% higher odds of developing AKI (OR 3.18, 95% CI 1.99–5.09, P < 0.001) (39). Another study identified a U-shaped relationship between SHR and AKI in individuals with congestive heart failure, with an inflection point at 0.98 (40). Moreover, the analysis revealed variations across subgroups, irrespective of the presence of diabetes or CKD (40). This study is the first to establish a significant correlation between elevated SHR levels and the likelihood of developing AKI in patients with sepsis. The differential performance of SHR in diabetic and non-diabetic populations highlights the complex interplay between chronic hyperglycemia and AKI risk. While no significant differences were observed using the 1.55 cutoff, a weaker association between SHR and SA-AKI risk was found in diabetic subgroup. This may be attributed to elevated chronic glucose levels in diabetes, which reduce the magnitude of SHR changes during acute hyperglycemia, as well as renal adaptation to glucose fluctuations and the influence of comorbidities such as hypertension and cardiovascular diseases. These factors likely diminish the direct impact of acute hyperglycemia on AKI risk in diabetic patients. Despite HbA1c correction for chronic hyperglycemia, the intrinsic effects of diabetes cannot be fully eliminated. The decrease in statistical ability caused by a smaller subgroup sample size may also cannot be ignored. Future research should aim to address these limitations to further validate the findings.
The mechanisms by which stress hyperglycemia contributes to adverse outcomes and the development of AKI in patients with sepsis are multifaceted. First, stress hyperglycemia exacerbates the stress response during sepsis, inducing oxidative stress and endoplasmic reticulum stress, which together drive pathological changes in kidney tissue (41–46). Second, hyperglycemia-induced metabolic alterations impair endothelial function. This occurs through increased mitochondrial ROS production, free fatty acid secretion, and disruptions in endothelial nitric oxide synthase (eNOS) and prostacyclin synthase activity (47, 48). These changes compromise endothelial integrity and microvascular function, leading to increased vascular permeability and capillary leakage, which negatively impacts organ perfusion, including that of the kidneys. Third, hyperglycemia promotes atherosclerosis, causing vascular narrowing (49) that reduces renal perfusion and raises the risk of cardiovascular events such as myocardial infarction and stroke, further diminishing renal blood flow. This interplay between heart and kidney dysfunction is referred to as “cardiorenal syndrome” (CRS) (50). Lastly, stress hyperglycemia facilitates non-enzymatic glycation of platelet glycoproteins, contributing to platelet activation and an elevated risk of thrombosis (51). These mechanisms collectively contribute to the poor prognosis and increased incidence of AKI in patients with sepsis.
Our findings hold potential positive value for further guiding the clinical treatment of sepsis patients. Currently, sepsis management strategies emphasize early risk identification and organ function preservation to improve prognosis. The high SHR group (>1.55) showed an 11% higher incidence of SA-AKI compared to the low SHR group, suggesting SHR’s potential as an early warning biomarker for SA-AKI. Notably, septic patients complicated with AKI not only face elevated mortality risks but also impose substantial burdens on healthcare systems, underscoring the clinical-economic significance of early high-risk population identification (3, 5). These findings propose that implementing intensive monitoring (e.g., enhanced urinary output surveillance and frequent renal function assessments) for patients with elevated SHR at admission may surpass conventional approaches. This stratified management strategy could optimize medical resource allocation while enabling high-risk patients to benefit from preventive interventions through early detection. Furthermore, initiating renal protection protocols during early sepsis diagnosis for high-SHR cohorts, including hemodynamic optimization, avoidance of nephrotoxic agents, and dynamic glucose control, may mitigate the progression risks of AKI, consequently reducing requirements for renal replacement therapy and secondary complications such as infections and multi-organ failure (52–54). We believe future high-quality prospective multicenter studies will be crucial to validate these findings and advance the clinical application of SHR in sepsis management.
Despite offering novel insights, this study has limitations that warrant cautious interpretation. First, as a retrospective analysis, it does not establish a causal relationship between SHR and SA-AKI development. Second, certain potential confounders, such as hemoglobinopathies, hypothyroidism, and the use of iron supplements or erythropoietin, which can influence HbA1c levels, were not excluded (55–57). Third, although logistic regression was used to adjust for several confounders, residual unknown factors may still affect the reliability of the findings. Fourth, since the identification of SA-AKI cases in this study was solely based on serum creatinine levels, we might have missed some SA-AKI cases that presented primarily with anuria or oliguria. Therefore, the applicability of our findings to SA-AKI patients without elevated creatinine levels remains uncertain. Accurately determining the temporal sequence between blood glucose/HbA1c measurements and AKI onset is challenging. We cannot guarantee that creatinine measurements were obtained immediately at AKI onset, and using the timing of creatinine measurement as the AKI diagnosis time may introduce bias. Finally, the single-center design limits the generalizability of the results, despite the large sample size provided by the MIMIC database. Therefore, multi-center and prospective studies are essential in order to confirm these findings.
5 Conclusions
The current study revealed a non-linear positive relationship between SHR and the likelihood of AKI in patients with sepsis, with SHR > 1.55 significantly associated with a higher likelihood of developing SA-AKI. As a novel biomarker, SHR shows promise for aiding in the early detection and prevention of SA-AKI, potentially improving patient outcomes.
Availability of data and materials
The study utilized data from the publicly accessible MIMIC-IV (v2.2) database, available at https://physionet.org/content/mimiciv/2.2/. Raw data and analysis code can be obtained from the corresponding author upon request.
Data availability statement
The original contributions presented in the study are included in the article/supplementary material. Further inquiries can be directed to the corresponding authors.
Author contributions
YF: Writing – original draft. AD: Writing – original draft. YZ: Writing – review & editing. HX: Writing – review & editing. YiZ: Writing – review & editing. YuC: Writing – review & editing. KX: Writing – review & editing.
Funding
The author(s) declare that financial support was received for the research and/or publication of this article. This research was funded by grants from the National Natural Science Foundation of China (Grant number: 81971879), the Clinical Research Program of Tianjin Medical University General Hospital (Grant number: 22ZYYLCCG05), and the 2021-N-15 project of the China International Medical Foundation (Grant number: 2021-N-15-8), primarily benefiting KX.
Acknowledgments
We express our gratitude to the Beth Israel Deaconess Medical Center and the Massachusetts Institute of Technology for their significant contributions in creating and maintaining the MIMIC database, which has enabled innovative research. We also thank the researchers who have shared their analysis code on GitHub, promoting a collaborative research environment. Finally, we acknowledge the foundational work of the authors and institutions cited in this study, whose insights and theories have significantly supported our research.
Conflict of interest
The authors declare that the research was conducted in the absence of any commercial or financial relationships that could be construed as a potential conflict of interest.
Generative AI statement
The author(s) declare that no Generative AI was used in the creation of this manuscript.
Publisher’s note
All claims expressed in this article are solely those of the authors and do not necessarily represent those of their affiliated organizations, or those of the publisher, the editors and the reviewers. Any product that may be evaluated in this article, or claim that may be made by its manufacturer, is not guaranteed or endorsed by the publisher.
References
1. Huang M, Cai S, Su J. The pathogenesis of sepsis and potential therapeutic targets. Int J Mol Sci. (2019) 20:5376. doi: 10.3390/ijms20215376
2. Fleischmann-Struzek C, Mellhammar L, Rose N, Cassini A, Rudd KE, Schlattmann P, et al. Incidence and mortality of hospital- and ICU-treated sepsis: results from an updated and expanded systematic review and meta-analysis. Intensive Care Med. (2020) 46:1552–62. doi: 10.1007/s00134-020-06151-x
3. Peerapornratana S, Manrique-Caballero CL, Gómez H, Kellum JA. Acute kidney injury from sepsis: current concepts, epidemiology, pathophysiology, prevention and treatment. Kidney Int. (2019) 96:1083–99. doi: 10.1016/j.kint.2019.05.026
4. Poston JT, Koyner JL. Sepsis associated acute kidney injury. BMJ. (2019) 364:k4891. doi: 10.1136/bmj.k4891
5. Hoste EA, Bagshaw SM, Bellomo R, Cely CM, Colman R, Cruz DN, et al. Epidemiology of acute kidney injury in critically ill patients: the multinational AKI-EPI study. Intensive Care Med. (2015) 41:1411–23. doi: 10.1007/s00134-015-3934-7
6. Dungan KM, Braithwaite SS, Preiser JC. Stress hyperglycaemia. Lancet. (2009) 373:1798–807. doi: 10.1016/S0140-6736(09)60553-5
7. Roberts GW, Quinn SJ, Valentine N, Alhawassi T, O’Dea H, Stranks SN, et al. Relative hyperglycemia, a marker of critical illness: introducing the stress hyperglycemia ratio. J Clin Endocrinol Metab. (2015) 100:4490–7. doi: 10.1210/jc.2015-2660
8. Nathan DM, Turgeon H, Regan S. Relationship between glycated haemoglobin levels and mean glucose levels over time. Diabetologia. (2007) 50:2239–44. doi: 10.1007/s00125-007-0803-0
9. Nathan DM, Kuenen J, Borg R, Zheng H, Schoenfeld D, Heine RJ, et al. Translating the A1C assay into estimated average glucose values. Diabetes Care. (2008) 31:1473–8. doi: 10.2337/dc08-0545
10. Luethi N, Cioccari L, Tanaka A, Kar P, Giersch E, Deane AM, et al. Glycated hemoglobin A1c levels are not affected by critical illness. Crit Care Med. (2016) 44:1692–4. doi: 10.1097/CCM.0000000000001656
11. Yang J, Zheng Y, Li C, Gao J, Meng X, Zhang K, et al. The impact of the stress hyperglycemia ratio on short-term and long-term poor prognosis in patients with acute coronary syndrome: insight from a large cohort study in Asia. Diabetes Care. (2022) 45:947–56. doi: 10.2337/dc21-1526
12. Liu J, Zhou Y, Huang H, Liu R, Kang Y, Zhu T, et al. Impact of stress hyperglycemia ratio on mortality in patients with critical acute myocardial infarction: insight from american MIMIC-IV and the chinese CIN-II study. Cardiovasc Diabetol. (2023) 22:281. doi: 10.1186/s12933-023-02012-1
13. Malkova OG, Leiderman IN, Levit AL, Alasheev AM. Changes in lipid and carbohydrate metabolism in patients with severe sepsis of different etiology. Anesteziol Reanimatol. (2014) (2):15–21.
14. Lee SH, Park MS, Park BH, Jung WJ, Lee IS, Kim SY, et al. Prognostic Implications of Serum Lipid Metabolism over Time during Sepsis. BioMed Res Int. (2015) 2015:789298. doi: 10.1155/2015/789298
15. Horn P, Metzing UB, Steidl R, Romeike B, Rauchfuß F, Sponholz C, et al. Chemerin in peritoneal sepsis and its associations with glucose metabolism and prognosis: a translational cross-sectional study. Crit Care. (2016) 20:39. doi: 10.1186/s13054-016-1209-5
16. Fabbri A, Marchesini G, Benazzi B, Morelli A, Montesi D, Bini C, et al. Stress hyperglycemia and mortality in subjects with diabetes and sepsis. Crit Care Explor. (2020) 2:e0152. doi: 10.1097/CCE.0000000000000152
17. Yan F, Chen X, Quan X, Wang L, Wei X, Zhu J. Association between the stress hyperglycemia ratio and 28-day all-cause mortality in critically ill patients with sepsis: a retrospective cohort study and predictive model establishment based on machine learning. Cardiovasc Diabetol. (2024) 23:163. doi: 10.1186/s12933-024-02265-4
18. Shan Y, Lin M, Gu F, Ying S, Bao X, Zhu Q, et al. Association between fasting stress hyperglycemia ratio and contrast-induced acute kidney injury in coronary angiography patients: a cross-sectional study. Front Endocrinol (Lausanne). (2023) 14:1300373. doi: 10.3389/fendo.2023.1300373
19. Johnson A, Bulgarelli L, Pollard T, Horng S, Celi LA, Mark R. MIMIC-IV (version 2.2). PhysioNet. (2023). doi: 10.13026/6mm1-ek67
20. Singer M, Deutschman CS, Seymour CW, Shankar-Hari M, Annane D, Bauer M, et al. The third international consensus definitions for sepsis and septic shock (Sepsis-3). JAMA. (2016) 315:801–10. doi: 10.1001/jama.2016.0287
21. Zarbock A, Nadim MK, Pickkers P, Gomez H, Bell S, Joannidis M, et al. Sepsis-associated acute kidney injury: consensus report of the 28th Acute Disease Quality Initiative workgroup. Nat Rev Nephrol. (2023) 19:401–17. doi: 10.1038/s41581-023-00683-3
22. Khwaja A. KDIGO clinical practice guidelines for acute kidney injury. Nephron Clin Pract. (2012) 120:c179–84. doi: 10.1159/000339789
23. Morohoshi M, Fujisawa K, Uchimura I, Numano F. Glucose-dependent interleukin 6 and tumor necrosis factor production by human peripheral blood monocytes in vitro. Diabetes. (1996) 45:954–9. doi: 10.2337/diab.45.7.954
24. Esposito K, Nappo F, Marfella R, Giugliano G, Giugliano F, Ciotola M, et al. Inflammatory cytokine concentrations are acutely increased by hyperglycemia in humans: role of oxidative stress. Circulation. (2002) 106:2067–72. doi: 10.1161/01.cir.0000034509.14906.ae
25. Huberlant V, Preiser JC. Year in review 2009: critical care–metabolism. Crit Care. (2010) 14:238. doi: 10.1186/cc9256
26. Lazzeri C, Valente S, Chiostri M, Picariello C, Gensini GF. Acute glucose dysmetabolism in the elderly with ST elevation myocardial infarction submitted to mechanical revascularization. Int J Cardiol. (2012) 155:66–9. doi: 10.1016/j.ijcard.2011.01.075
27. Marenzi G, Cosentino N, Milazzo V, De Metrio M, Cecere M, Mosca S, et al. Prognostic value of the acute-to-chronic glycemic ratio at admission in acute myocardial infarction: A prospective study. Diabetes Care. (2018) 41:847–53. doi: 10.2337/dc17-1732
28. Xu W, Song Q, Wang X, Zhao Z, Meng X, Xia C, et al. Association of stress hyperglycemia ratio and in-hospital mortality in patients with coronary artery disease: insights from a large cohort study. Cardiovasc Diabetol. (2022) 21:217. doi: 10.1186/s12933-022-01645-y
29. Worthley MI, Holmes AS, Willoughby SR, Kucia AM, Heresztyn T, Stewart S, et al. The deleterious effects of hyperglycemia on platelet function in diabetic patients with acute coronary syndromes mediation by superoxide production, resolution with intensive insulin administration. J Am Coll Cardiol. (2007) 49:304–10. doi: 10.1016/j.jacc.2006.08.053
30. Stegenga ME, van der Crabben SN, Blümer RM, Levi M, Meijers JC, Serlie MJ, et al. Hyperglycemia enhances coagulation and reduces neutrophil degranulation, whereas hyperinsulinemia inhibits fibrinolysis during human endotoxemia. Blood. (2008) 112:82–9. doi: 10.1182/blood-2007-11-121723
31. Cooper ME, El-Osta A. Epigenetics: mechanisms and implications for diabetic complications. Circ Res. (2010) 107:1403–13. doi: 10.1161/CIRCRESAHA.110.223552
32. Ertorer ME, Haydardedeoglu FE, Erol T, Anaforoglu I, Binici S, Tutuncu NB, et al. Newly diagnosed hyperglycemia and stress hyperglycemia in a coronary intensive care unit. Diabetes Res Clin Pract. (2010) 90:8–14. doi: 10.1016/j.diabres.2010.05.023
33. Van den Berghe G. Beyond diabetes: saving lives with insulin in the ICU. Int J Obes Relat Metab Disord. (2002) 26 Suppl 3:S3–8. doi: 10.1038/sj.ijo.0802171
34. Chao HY, Liu PH, Lin SC, Chen CK, Chen JC, Chan YL, et al. Association of in-hospital mortality and dysglycemia in septic patients. PloS One. (2017) 12:e0170408. doi: 10.1371/journal.pone.0170408
35. Mamtani M, Kulkarni H, Bihari S, Prakash S, Chavan S, Huckson S, et al. Degree of hyperglycemia independently associates with hospital mortality and length of stay in critically ill, nondiabetic patients: Results from the ANZICS CORE binational registry. J Crit Care. (2020) 55:149–56. doi: 10.1016/j.jcrc.2019.11.003
36. Zhang C, Shen HC, Liang WR, Ning M, Wang ZX, Chen Y, et al. Relationship between stress hyperglycemia ratio and allcause mortality in critically ill patients: Results from the MIMIC-IV database. Front Endocrinol (Lausanne). (2023) 14:1111026. doi: 10.3389/fendo.2023.1111026
37. Hotchkiss RS, Monneret G, Payen D. Immunosuppression in sepsis: a novel understanding of the disorder and a new therapeutic approach. Lancet Infect Dis. (2013) 13:260–8. doi: 10.1016/S1473-3099(13)70001-X
38. Vincent JL, Moreno R, Takala J, Willatts S, De Mendonça A, Bruining H, et al. The SOFA (Sepsis-related Organ Failure Assessment) score to describe organ dysfunction/failure. On behalf of the Working Group on Sepsis-Related Problems of the European Society of Intensive Care Medicine. Intensive Care Med. (1996) 22:707–10. doi: 10.1007/BF01709751
39. Gao S, Liu Q, Chen H, Yu M, Li H. Predictive value of stress hyperglycemia ratio for the occurrence of acute kidney injury in acute myocardial infarction patients with diabetes. BMC Cardiovasc Disord. (2021) 21:157. doi: 10.1186/s12872-021-01962-2
40. Li L, Ding L, Zheng L, Wu L, Hu Z, Liu L, et al. Relationship between stress hyperglycemia ratio and acute kidney injury in patients with congestive heart failure. Cardiovasc Diabetol. (2024) 23:29. doi: 10.1186/s12933-023-02105-x
41. Paneni F, Beckman JA, Creager MA, Cosentino F. Diabetes and vascular disease: pathophysiology, clinical consequences, and medical therapy: part I. Eur Heart J. (2013) 34:2436–43. doi: 10.1093/eurheartj/eht149
42. Peng J, Li X, Zhang D, Chen JK, Su Y, Smith SB, et al. Hyperglycemia, p53, and mitochondrial pathway of apoptosis are involved in the susceptibility of diabetic models to ischemic acute kidney injury. Kidney Int. (2015) 87:137–50. doi: 10.1038/ki.2014.226
43. Jha JC, Ho F, Dan C, Jandeleit-Dahm K. A causal link between oxidative stress and inflammation in cardiovascular and renal complications of diabetes. Clin Sci (Lond). (2018) 132:1811–36. doi: 10.1042/CS20171459
44. Couto S, da Fonseca CD, Watanabe M, de Fátima Fernandes Vattimo M. Protection of coenzyme Q10 against contrast-induced acute kidney injury in male diabetic rats. Diabetol Metab Syndr. (2021) 13:69. doi: 10.1186/s13098-021-00689-6
45. DeFronzo RA, Reeves WB, Awad AS. Pathophysiology of diabetic kidney disease: impact of SGLT2 inhibitors. Nat Rev Nephrol. (2021) 17:319–34. doi: 10.1038/s41581-021-00393-8
46. Xu L, Zhou Y, Wang G, Bo L, Jin B, Dai L, et al. The UDPase ENTPD5 regulates ER stress-associated renal injury by mediating protein N-glycosylation. Cell Death Dis. (2023) 14:166. doi: 10.1038/s41419-023-05685-4
47. Patschan D, Müller GA. Acute kidney injury in diabetes mellitus. Int J Nephrol. (2016) 2016:6232909. doi: 10.1155/2016/6232909
48. Kosiborod M. Hyperglycemia in acute coronary syndromes: from mechanisms to prognostic implications. Endocrinol Metab Clin North Am. (2018) 47:185–202. doi: 10.1016/j.ecl.2017.11.002
49. Poznyak A, Grechko AV, Poggio P, Myasoedova VA, Alfieri V, Orekhov AN. The diabetes mellitus-atherosclerosis connection: the role of lipid and glucose metabolism and chronic inflammation. Int J Mol Sci. (2020) 21:1835. doi: 10.3390/ijms21051835
50. Rangaswami J, Bhalla V, Blair J, Chang TI, Costa S, Lentine KL, et al. Cardiorenal syndrome: classification, pathophysiology, diagnosis, and treatment strategies: A scientific statement from the American heart association. Circulation. (2019) 139:e840–840e878. doi: 10.1161/CIR.0000000000000664
51. Ferroni P, Basili S, Falco A, Davì G. Platelet activation in type 2 diabetes mellitus. J Thromb Haemost. (2004) 2:1282–91. doi: 10.1111/j.1538-7836.2004.00836.x
52. Munroe ES, Weinstein J, Gershengorn HB, Karlic KJ, Seelye S, Sjoding MW, et al. Understanding how clinicians personalize fluid and vasopressor decisions in early sepsis management. JAMA Netw Open. (2024) 7:e247480. doi: 10.1001/jamanetworkopen.2024.7480
53. Beran A, Altorok N, Srour O, Malhas SE, Khokher W, Mhanna M, et al. Balanced crystalloids versus normal saline in adults with sepsis: A comprehensive systematic review and meta-analysis. J Clin Med. (2022) 11:1971. doi: 10.3390/jcm11071971
54. Tackaert T, Van Moorter N, De Mey N, Demeyer I, De Decker K. The association between increasing fluid balance, acute kidney injury and mortality in patients with sepsis and septic shock: A retrospective single center audit. J Crit Care. (2023) 78:154367. doi: 10.1016/j.jcrc.2023.154367
55. Radin MS. Pitfalls in hemoglobin A1c measurement: when results may be misleading. J Gen Intern Med. (2014) 29:388–94. doi: 10.1007/s11606-013-2595-x
56. Shepard JG, Airee A, Dake AW, McFarland MS, Vora A. Limitations of A1c interpretation. South Med J. (2015) 108:724–9. doi: 10.14423/SMJ.0000000000000381
Keywords: sepsis, sepsis-associated acute kidney injury, stress hyperglycemia, stress hyperglycemia ratio, biomarker
Citation: Fang Y, Dou A, Zhang Y, Xie H, Zhang Y, Cui Y and Xie K (2025) Association between stress hyperglycemia ratio and acute kidney injury development in patients with sepsis: a retrospective study. Front. Endocrinol. 16:1542591. doi: 10.3389/fendo.2025.1542591
Received: 10 December 2024; Accepted: 26 March 2025;
Published: 15 April 2025.
Edited by:
Hjalmar Bouma, University Medical Center Groningen, NetherlandsReviewed by:
Xiaoming Zhou, Uniformed Services University of the Health Sciences, United StatesPeter Van Dijk, Isala Clinic, Netherlands
Copyright © 2025 Fang, Dou, Zhang, Xie, Zhang, Cui and Xie. This is an open-access article distributed under the terms of the Creative Commons Attribution License (CC BY). The use, distribution or reproduction in other forums is permitted, provided the original author(s) and the copyright owner(s) are credited and that the original publication in this journal is cited, in accordance with accepted academic practice. No use, distribution or reproduction is permitted which does not comply with these terms.
*Correspondence: Keliang Xie, eGlla2VsaWFuZzIwMDlAaG90bWFpbC5jb20=; bXprMjAxMUAxMjYuY29t; Yan Cui, Y3VpeWFuYmlvNDVAMTYzLmNvbQ==
†These authors have contributed equally to this work