 Chuang Gao1†
 Dehong Liu
 Qiming Li
 Yong Han
- 1Department of Emergency, Shenzhen Dapeng New District Kuichong People’s Hospital, Shenzhen, China
- 2Department of Emergency, Shenzhen Second People’s Hospital, Shenzhen, Guangdong, China
Objective: Current research on the association between the Gamma-glutamyl transferase to high-density lipoprotein ratio (GHR) and the risk of prediabetes (pre-DM) remains scarce. This study aims to explore the potential link between GHR and the risk of progression from normoglycemia to pre-DM.
Methods: This retrospective cohort study included 8,168 individuals who voluntarily underwent health examinations at Shenzhen Dapeng New District Kuichong People’s Hospital between January 2018 and December 2023. To assess the association between GHR and the risk of developing pre-DM, Cox proportional hazards regression models were employed. Cox proportional hazards regression model with cubic spline function was further utilized to investigate potential nonlinear association. Moreover, a competing risk Cox proportional hazards model was applied to account for the progression from normoglycemia to diabetes (DM) as a competing event in the progression from normoglycemia to pre-DM. Subgroup analyses and multiple sensitivity analyses were also performed to ensure the robustness of the findings.
Results: Following multivariate adjustment, elevated GHR demonstrated a significant correlation with increased risk of progression from normoglycemia to pre-DM, showing a hazard ratio(HR) of 1.061 (95% CI: 1.028-1.095) for each 5-unit increment. A nonlinear relationship between them was identified, with an inflection point at a GHR value of 24.37. On the left side of the inflection point, the HR for the association between GHR (per 5-unit increase) and pre-DM risk was 1.394 (95% CI: 1.197, 1.623). Furthermore, the competing risk model revealed an HR of 1.05 (95% CI: 1.02, 1.09) for the association between GHR (per 5-unit increase) and pre-DM risk. Multiple sensitivity analyses confirmed the stability and reliability of these results.
Conclusion: This study demonstrates that elevated GHR exhibits both a positive and nonlinear relationship with the risk of progression from normoglycemia to pre-DM among Chinese adults. Maintaining GHR values below the threshold of 24.37, coupled with further reduction efforts, may serve as an effective strategy to minimize pre-DM risk.
Introduction
Diabetes Mellitus (DM), a complex metabolic condition arising from the interplay between hereditary predisposition and environmental influences, manifests through compromised insulin action, inadequate hormone production, and disrupted glucose regulation (1). The escalating prevalence and substantial burden of DM-related morbidity and mortality have established it as a critical challenge to global health systems (2–5). The intermediate metabolic state known as prediabetes (pre-DM) represents a crucial phase where glycemic parameters exceed normal limits but fall short of DM diagnostic thresholds (6). This condition not only heightens DM risk but also independently contributes to various complications, including ocular damage, renal dysfunction, and adverse cardiovascular outcomes (7–10). Recent data from the International Diabetes Federation (IDF) revealed that 374 million adults globally exhibited pre-DM in 2017, constituting 7.7% of the population. Projections indicate this figure will surge to 548 million by 2045, reaching 8.4% worldwide (4). Within China specifically, epidemiological investigations utilizing American Diabetes Association (ADA) criteria have identified a remarkably high pre-DM prevalence of 35.7%, surpassing rates of other chronic conditions (11). It is estimated that 5-10% of individuals with pre-DM progress to DM annually, and over 70% eventually develop DM (6). Importantly, lifestyle modifications have been shown to reduce the risk of diabetes in prediabetic individuals by as much as 58% (12). Therefore, identifying risk factors for pre-DM and implementing targeted interventions are essential steps in preventing the onset of DM.
Recent studies have identified a strong association between high-density lipoprotein cholesterol (HDL-c), Gamma-glutamyl transferase (GGT), and metabolic disorders such as nonalcoholic fatty liver disease (NAFLD) and DM (13–17). Findings from two cross-sectional studies revealed that an increased GGT/HDL-c ratio (GHR) is significantly linked to both NAFLD and metabolically associated fatty liver disease (MAFLD) (18–20). Besides, evidence suggests that NAFLD is closely connected to glucose metabolism disorders, with GGT, HDL-c, and NAFLD all playing roles in the development of insulin resistance (IR) (21–24). Additional studies have demonstrated that DM and NAFLD share overlapping pathophysiological mechanisms, including inflammation, oxidative stress, and IR (25, 26). A study from China found that after adjusting for potential confounding factors, each 1-unit increase in the GHR is associated with a 1.3% increase in the incidence of DM (HR = 1.013, 95% CI: 1.002, 1.024) (27). Given that IR is the core pathophysiological mechanism underlying the onset and progression of DM, we hypothesize that an elevated GHR may be closely associated with pre-DM, which serves as the intermediate metabolic state in the transition from normoglycemia to DM. However, to date, no studies have systematically explored the relationship between the GHR and the risk of pre-DM. Therefore, this study aims to conduct a cohort study among Chinese adults with normoglycemia to investigate the association between the GHR and pre-DM, validate this hypothesis, and provide new scientific evidence for the early screening and intervention of pre-DM.
Methods
Study design and study population
This retrospective cohort study analyzed medical records of individuals who voluntarily participated in health examinations at Shenzhen Dapeng New District Kuichong People’s Hospital between January 2018 and December 2023. The baseline cohort consisted of 23,665 participants over the age of 20 who underwent health check-ups during the initial period from January to December 2018. The exclusion criteria were as follows: (i) Participants diagnosed with DM during their first health check-up in 2018 (n=433); (ii) Participants with FPG >5.6 mmol/L or HbA1c ≥5.7% during their first health check-up in 2018 (n=554); (iii) Participants with missing FPG or HbA1c data during their first health check-up in 2018 (n=4,300); (iv) Participants who did not return for health check-ups at the hospital between 2019 and 2023 or whose interval between the first and second check-up was less than one year (n=4,644); (v) Participants with unclear pre-DM diagnostic information during follow-up (n=4,311); (vi) Participants with missing GGT or HDL-c data (n=1,095) or participants with abnormal/extreme GHR values (n=160), where abnormal/extreme values are defined as those falling below or above three standard deviations from the mean (28, 29). Ultimately, 8,168 participants were included in the final analysis. Figure 1 illustrates the process undertaken to screen and select the study participants.
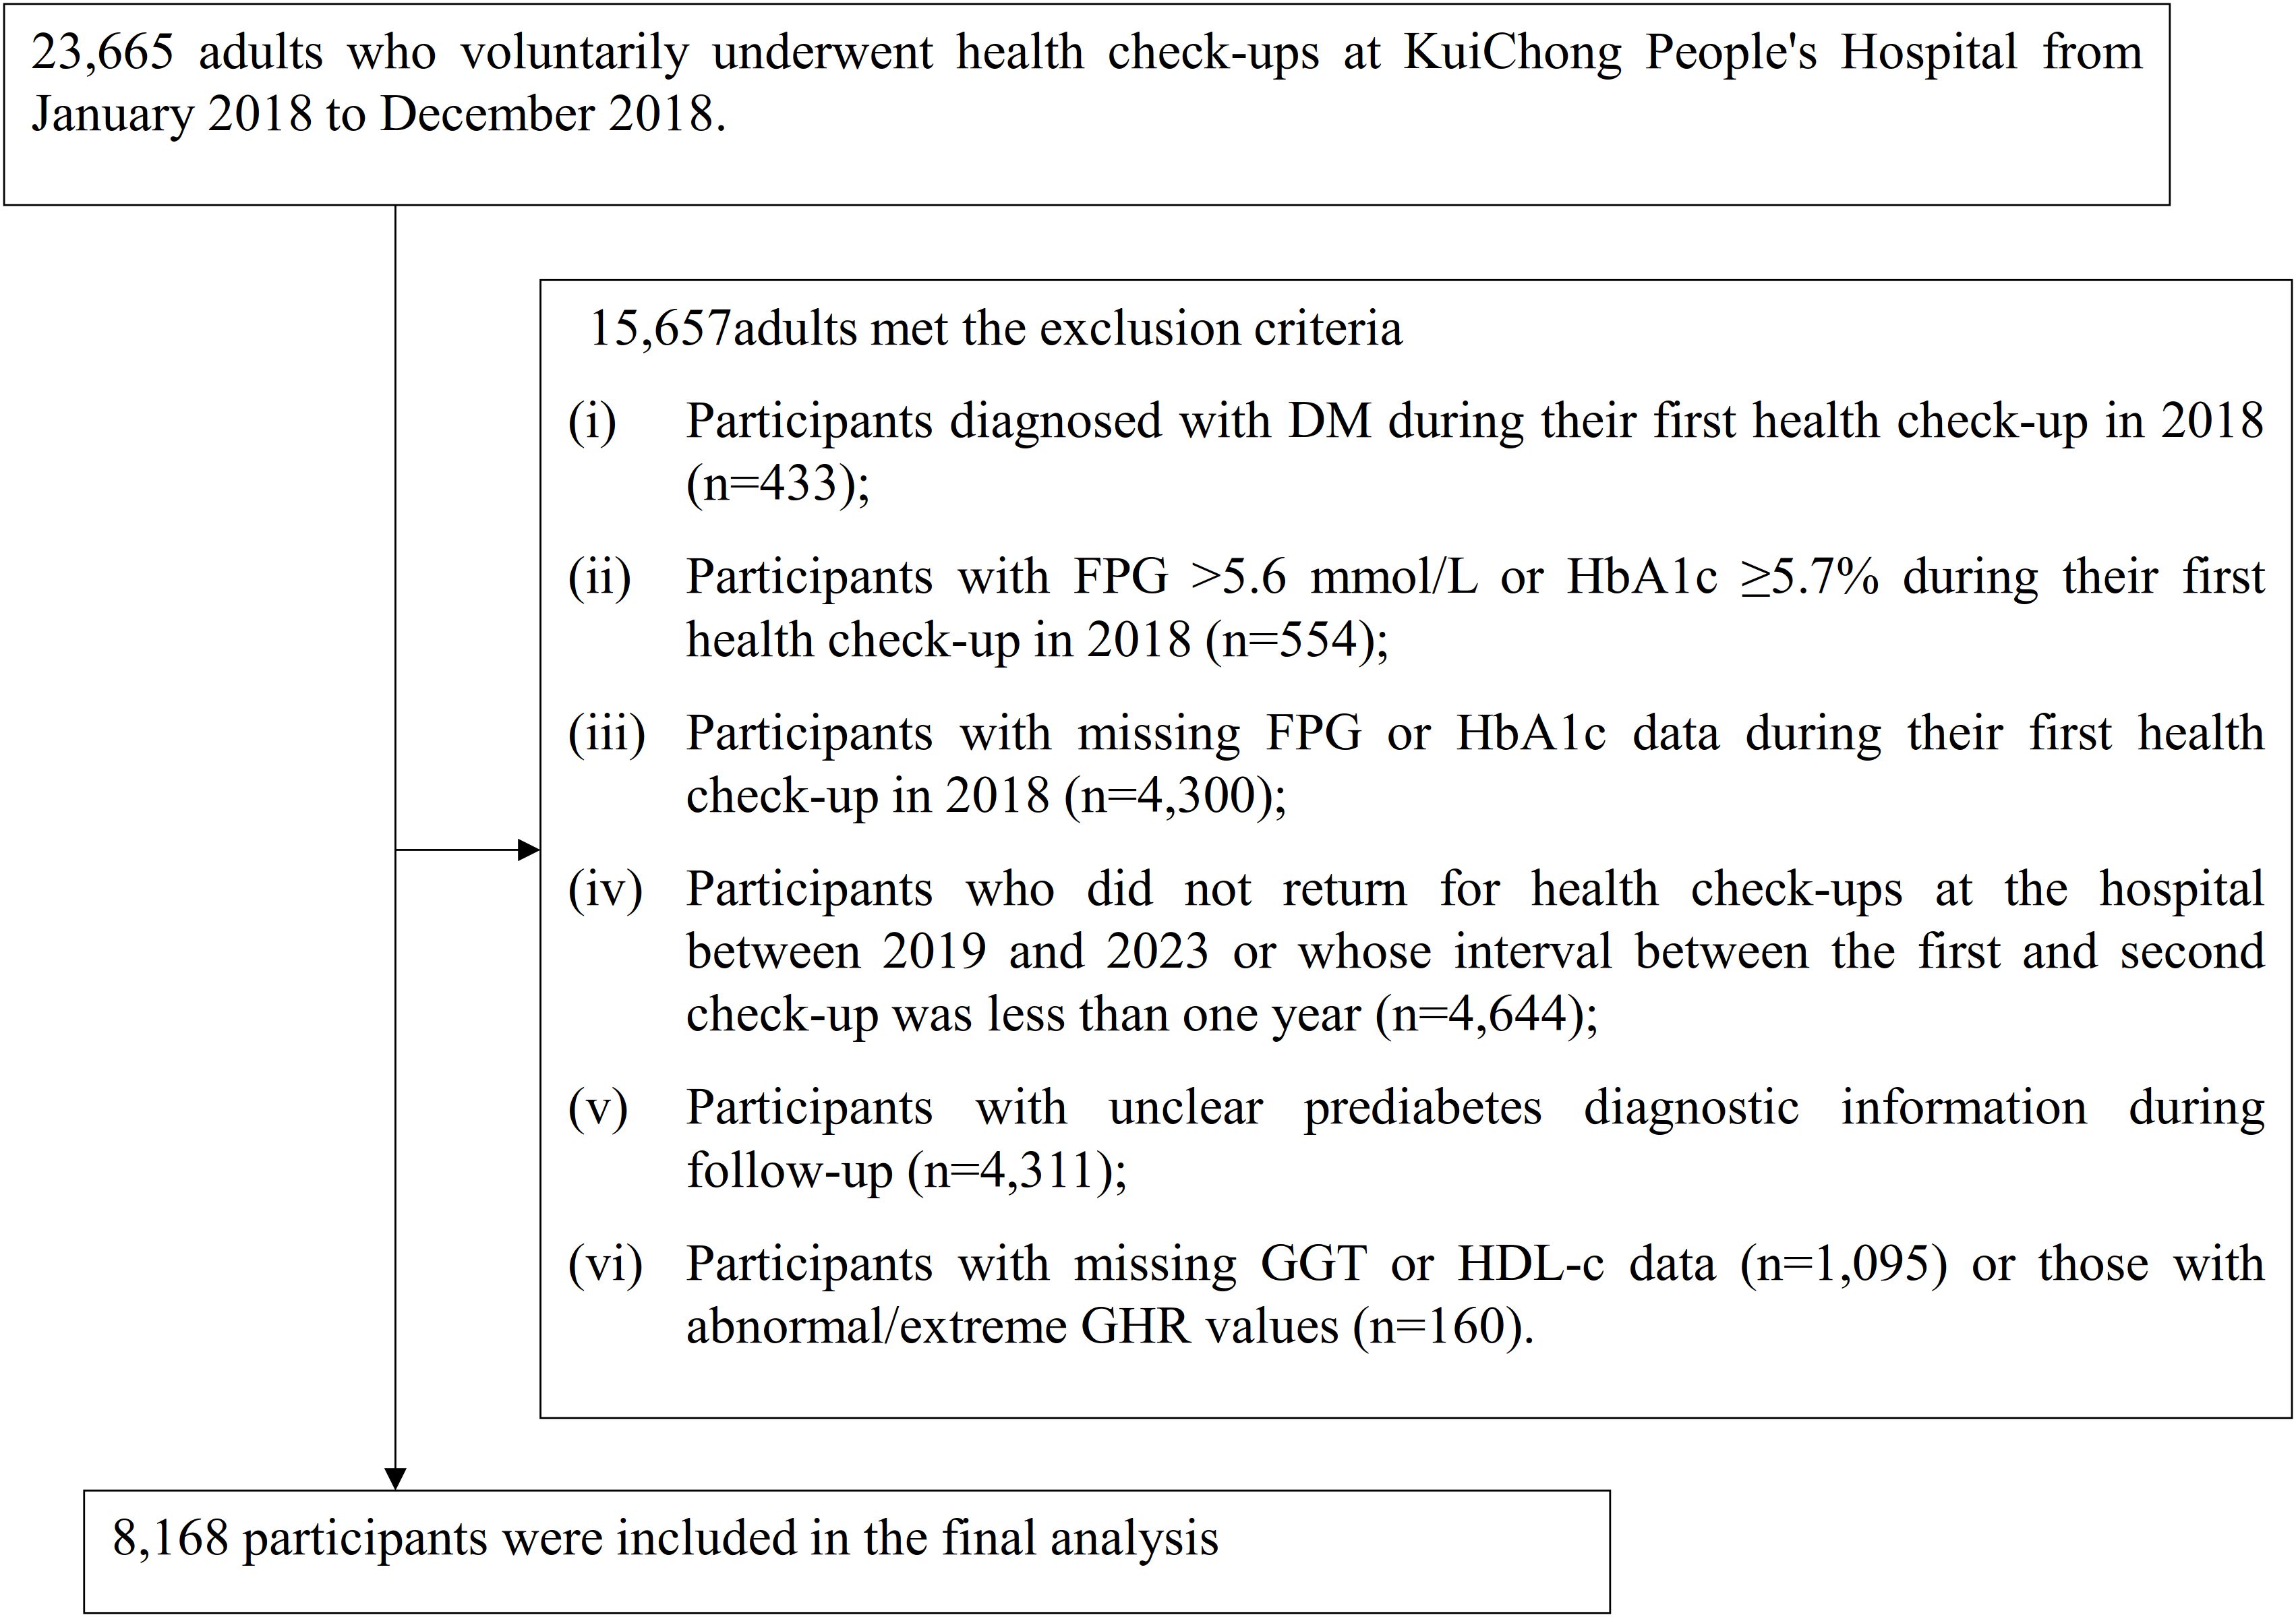
Figure 1. Flowchart of the study participant screening process.
Ethical approval and consent
The Ethics Committee of Shenzhen Dapeng New District Kuichong People’s Hospital approved this study (Ethics Approval Number: 2024005). Given the retrospective design and the complete anonymization of all data, the committee granted a waiver for informed consent. Additionally, the study was conducted in full compliance with the ethical guidelines set forth in the Declaration of Helsinki, ensuring adherence to its principles and relevant ethical standards and regulations.
Variables
The Ratio of GGT to HDL-c
The gamma-glutamyl transferase to high-density lipoprotein cholesterol ratio (GHR) was analyzed as a continuous variable. This ratio was calculated by dividing serum GGT (measured in U/L) by HDL-c (measured in mmol/L).
Definition of prediabetes
Pre-DM was identified based on the American Diabetes Association’s diagnostic criteria. Specifically, participants were classified as having pre-DM if they maintained normal blood glucose at baseline, did not progress to DM during follow-up, and exhibited either fasting plasma glucose (FPG) values ranging from 5.6 to <7.0 mmol/L or hemoglobin A1c (HbA1c) levels between 5.7% and <6.5% (30).
Covariates
The selection of covariates was based on previous studies and our clinical expertise (16, 31, 32). Variables used as covariates included: (i) Continuous variables: age, body mass index (BMI), alanine aminotransferase (ALT), aspartate aminotransferase (AST), systolic blood pressure (SBP), diastolic blood pressure (DBP), low-density lipoprotein cholesterol (LDL-c), total cholesterol (TC), triglycerides (TG), glycated hemoglobin (HbA1c), fasting plasma glucose (FPG), high-sensitivity C-reactive protein(Hs-CRP), and serum creatinine (Scr). (ii) Categorical variables: sex, hypertension, drinking status, physical activity, and smoking status.
Data collection
Qualified physical examination staff conducted physical examinations and gathered baseline data on lifestyle factors, including alcohol intake and smoking habits, as well as demographic information, such as age and sex, along with hypertension status, utilizing a standardized questionnaire. Blood pressure measurements were taken from participants in the morning while they were fasting, sitting quietly for 5 minutes, using a standard mercury sphygmomanometer. All participants in the examination were required to fast for at least 10 hours before the collection of fasting venous blood samples for comprehensive biochemical tests. Biochemical parameters, including FPG, TC, TG, HDL-c, and LDL-c, were analyzed using the Beckman 5800 automatic analyzer. Additionally, hemoglobin levels were assessed with the Mindray 5180 hematology analyzer.
Handling of missing data
Missing data is a common phenomenon in observational studies and is often unavoidable. In this study, missing data were observed for several variables, including hypertension (65, 0.80%), SBP (16, 0.20%), DBP (16, 0.20%), Scr (278, 3.40%), smoking status (474, 5.80%), BMI (133, 1.63%), drinking status (774, 9.48%), and physical activity (1073, 13.14%). To reduce bias caused by missing variables, multiple imputations (five times) were used to handle the missing data (33, 34). The imputation model applied linear regression with 10 iterations and included the following variables: age, sex, BMI, AST, ALT, SBP, DBP, TG, LDL-c, TC, smoking status, physical activity, hypertension, drinking status, FPG, HbA1c, Scr, and CRP. The missing data were analyzed under the assumption of missing at random (MAR) (34). It should be noted that five imputed datasets were generated, allowing for separate estimates, such as means, regression coefficients, and so forth, to be made for each dataset. Rubin’s Rules were then applied to combine these estimates.
Statistical analysis
Statistical analyses were conducted using R software version 3.4.3 and Empower(R) software version 4.2. A P-value of less than 0.05 (two-sided) was considered statistically significant. Participants were categorized based on quartiles of GHR. For continuous variables that followed a normal distribution, both the mean and standard deviation were reported. In contrast, for variables exhibiting a skewed distribution, the median and interquartile range were presented. Categorical variables were summarized using percentages and frequencies. To evaluate statistical significance across groups, the Kruskal-Wallis H test was applied for skewed variables, one-way analysis of variance (ANOVA) was utilized for normally distributed variables, and the chi-squared (χ²) test was employed for categorical variables.
Univariate and multivariate Cox proportional hazards regression models were used to explore the association between GHR and pre-DM risk. Three models were applied: Model I was unadjusted, Model II was minimally adjusted for sex and age, and Model III was fully adjusted for sex, BMI, age, drinking status, ALT, TG, FPG, DBP, smoking status, Scr, AST, hypertension, and SBP. TC was excluded from the multivariate analysis due to collinearity with other variables (Supplementary Table S1). Additionally, patients diagnosed with DM during follow-up could interfere with the assessment of normoglycemia progression to pre-DM. Therefore, a competing risk multivariate Cox proportional hazards regression, based on the Fine and Gray method, was used to verify the relationship between GHR and pre-DM, treating the progression from normoglycemia to DM as a competing event (35, 36).
Additionally, a Cox proportional hazards regression model incorporating a cubic spline function was employed to examine the potential non-linear association between the GHR and the risk of pre-DM. If nonlinearity was identified, a recursive algorithm was applied to pinpoint the inflection point. Following this, a two-part Cox proportional hazards regression model was developed for each side of the identified inflection point. Ultimately, the optimal Model that best described the relationship between GHR and pre-DM risk was selected based on the log-likelihood ratio test.
Previous research has demonstrated a significant link between hypertension, obesity, and glucose metabolism (37–39). To confirm the findings of our study, we performed several sensitivity analyses. Initially, we limited the analysis to participants with BMI<28 kg/m² (40). Additionally, we excluded individuals with hypertension from sensitivity analyses. Besides, a generalized additive model (GAM) was utilized to integrate continuous covariates into the multivariate Cox proportional hazards regression equation. Lastly, to evaluate the potential impact of unmeasured confounding variables on the relationship between the GHR and the risk of pre-DM, we calculated the E-value (41).
A stratified Cox proportional hazards regression model was applied for subgroup analyses based on factors such as drinking status, sex, smoking status, age, physical activity, SBP, and. Continuous variables, including age, SBP, and DBP, were categorized using clinical thresholds (age: <30, 30–40, 40–50, ≥50 years; DBP: <90, ≥90 mmHg; SBP: <140, ≥140 mmHg). Adjustments were made for covariates such as sex, BMI, age, drinking status, ALT, TG, FPG, DBP, smoking status, Scr, AST, hypertension, and SBP, in addition to the stratification factors. To assess potential interactions, the likelihood ratio test was conducted to compare models with and without interaction terms.
Results
Participant characteristics
A total of 8,168 participants are included in the study, consisting of 2,170 women and 5,998 men, with a mean age of 41.48 years (SD: 8.52). The GHR exhibits a left-skewed distribution, ranging from 3.90 to 102.79, with a median value of 21.57 and an interquartile range (IQR) of 13.93–33.35 (Figure 2). Table 1 summarizes the anthropometric and biochemical characteristics of participants across GHR quartiles. The findings reveal that individuals in higher GHR quartiles tend to have elevated levels of LDL-c, age, DBP, SBP, BMI, ALT, TC, AST, TG, Scr, Hs-CRP, and HbA1c compared to those in the lowest quartile. Conversely, HDL-c levels are lower in participants with higher GHR values. Furthermore, the proportion of males, smokers, individuals engaging in low physical activity, and current drinkers is noticeably greater in the upper GHR quartiles compared to the lowest quartile.
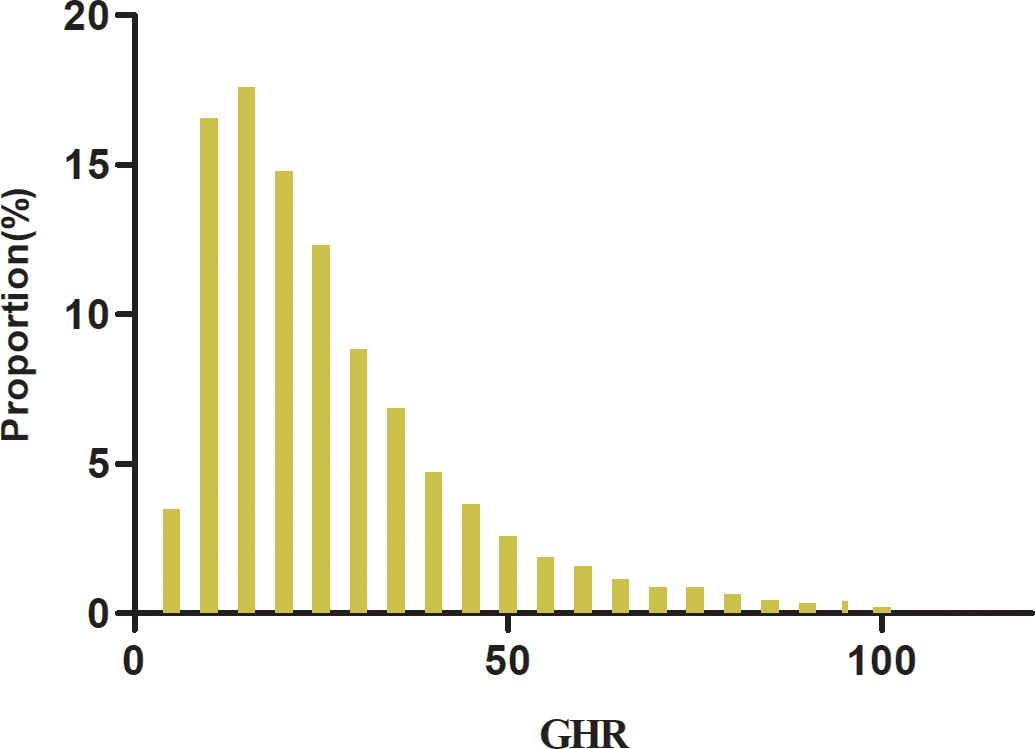
Figure 2. Distribution of GHR. Figure 2 shows that the GHR had a left-skewed distribution ranging from 3.90 to 102.79 with a median value of 21.57 and an interquartile range (IQR) of 13.93 to 33.35.
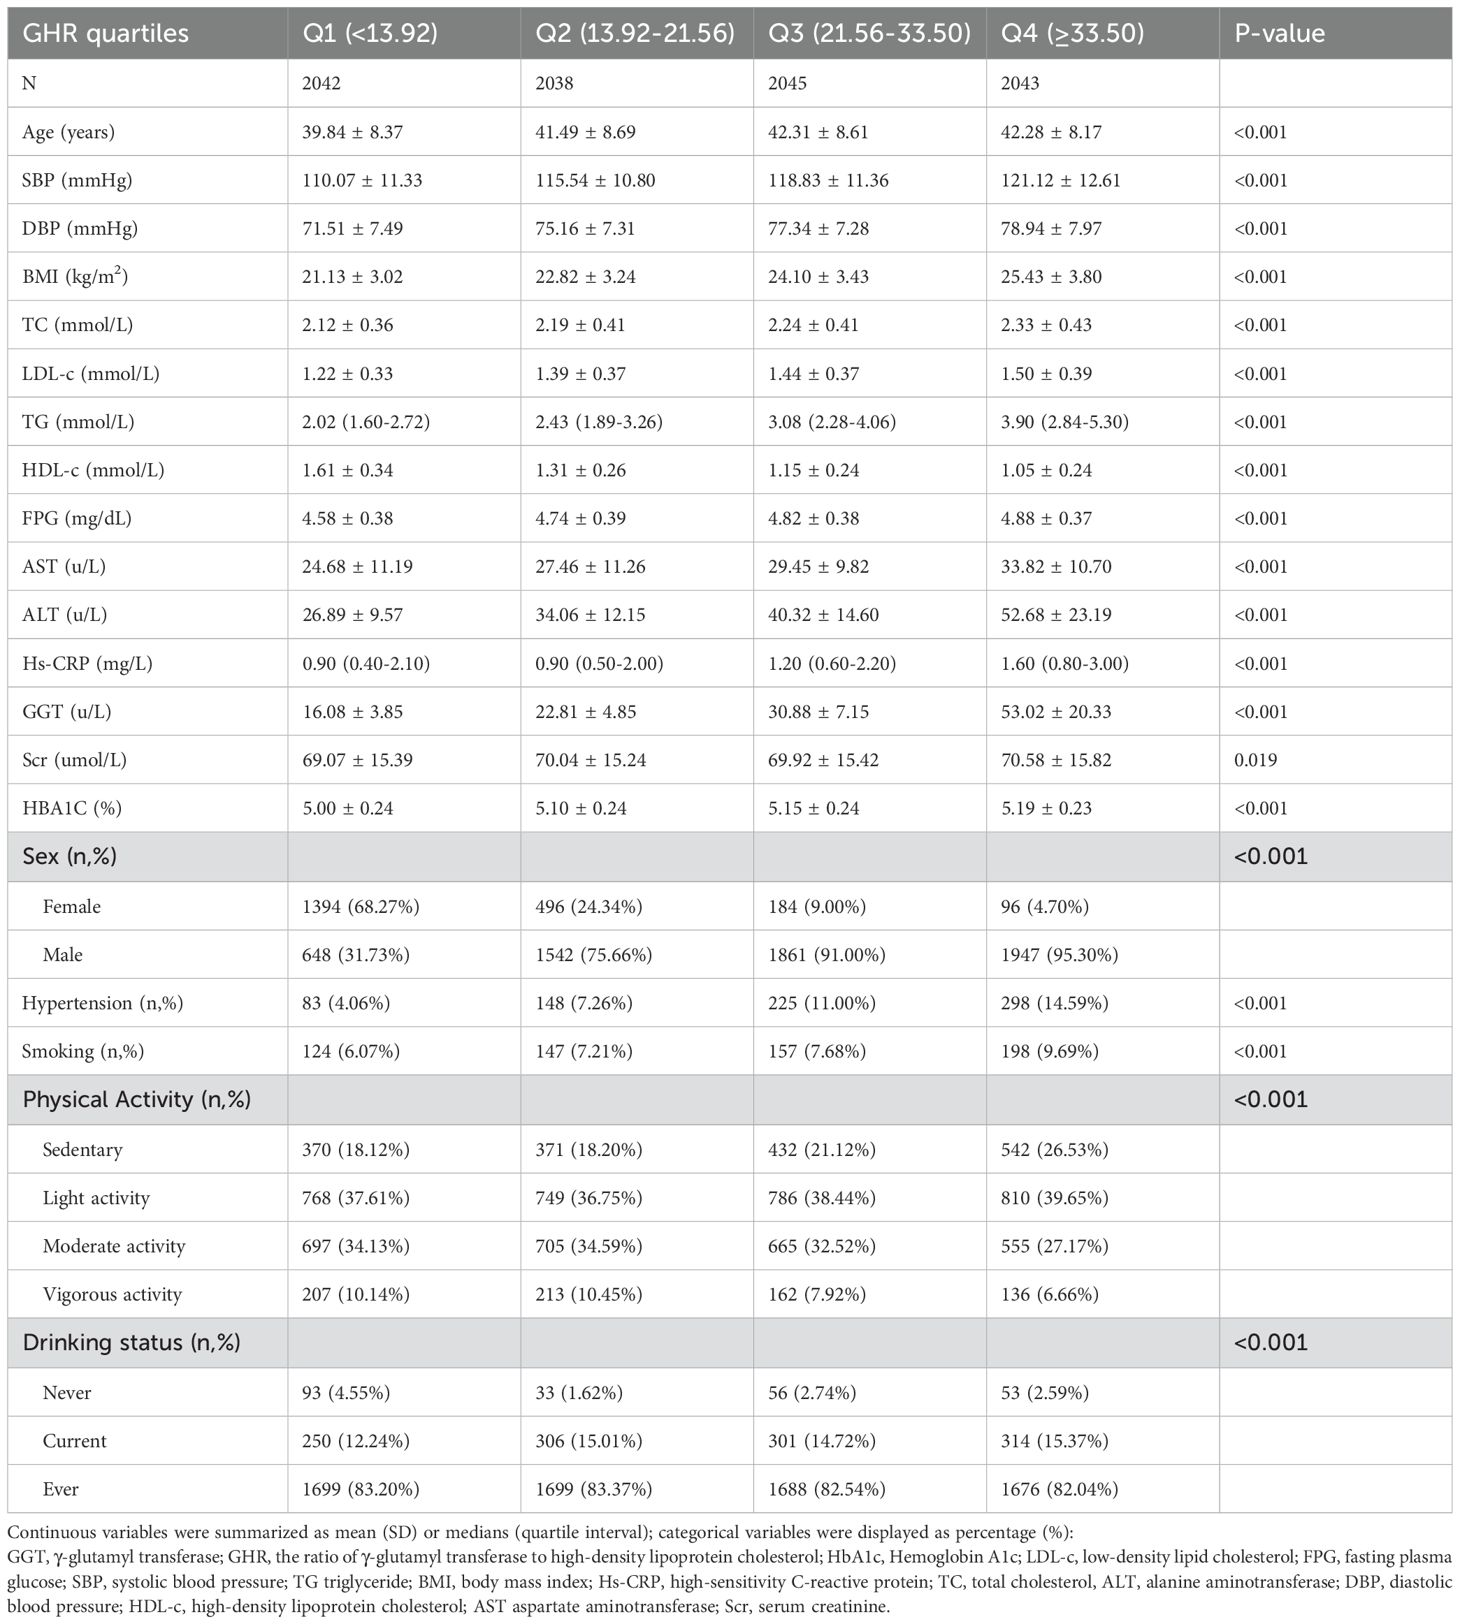
Table 1. The baseline characteristics of participants with normoglycemia.
The incidence of prediabetes
During a median follow-up of 1.96 years, 311 participants (10.63%) transition from normoglycemia to pre-DM. The incidence rates of pre-DM across the GHR quartiles are 95.52, 194.24, 332.84, and 505.01 cases per 10,000 person-years, respectively. The cumulative incidence of pre-DM is 2.81%, with a quartile-specific cumulative incidence of 1.27% in Q1, 2.65% in Q2, 4.4% in Q3, and 6.9% in Q4. Participants in the highest GHR quartile (Q4) exhibit a significantly greater risk of developing pre-DM compared to those in the lowest quartile (Q1) (p<0.001 for trend) (Table 2). When stratified by 10-year age intervals, males consistently show a higher likelihood of progressing to pre-DM than females, regardless of age group. Moreover, the incidence of pre-DM increases with advancing age in both sexes (Figure 3).
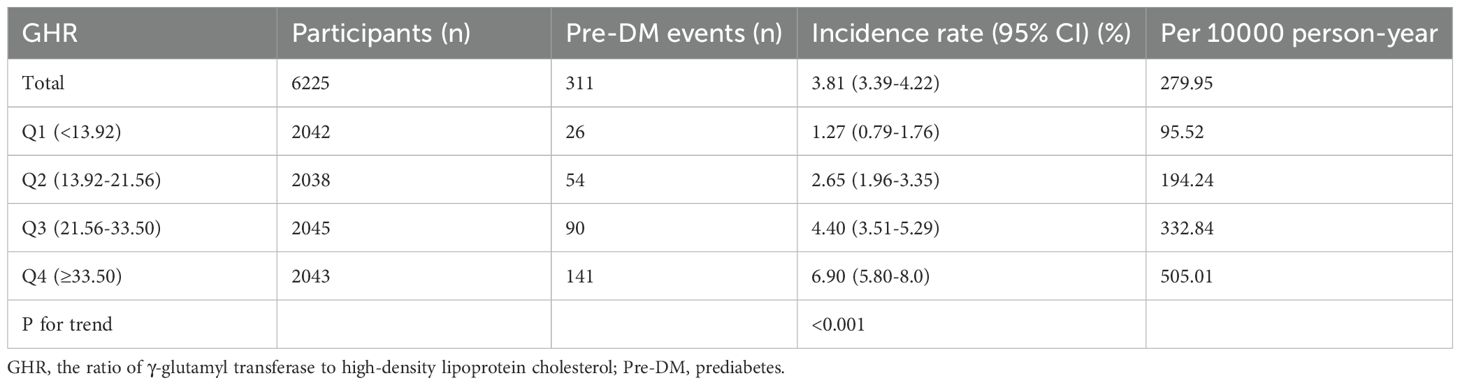
Table 2. Incidence of prediabetes (% or per 10,000 person-years).
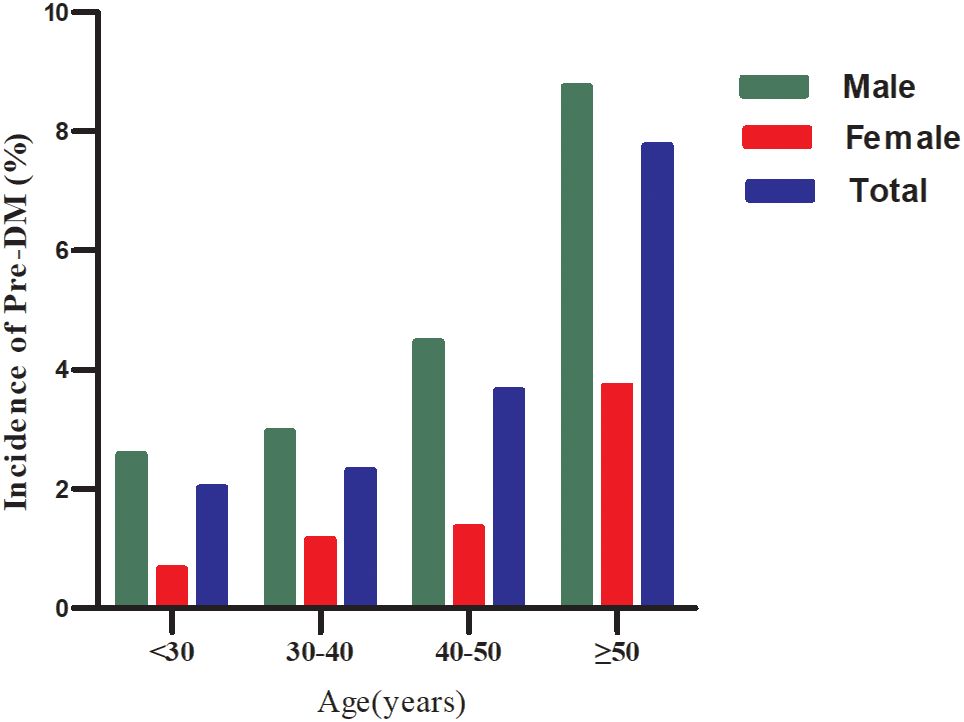
Figure 3. Incidence of prediabetes stratified by age in 10 intervals and sex.
The influencing factors of prediabetes were analyzed using univariate Cox proportional hazards regression
The univariate analysis revealed that the risk of progression from normoglycemia to pre-DM was positively correlated with factors such as age, male sex, hypertension, SBP, BMI, DBP, AST, TG, ALT, FPG, GGT, BUN, and current alcohol consumption (all P<0.05). In contrast, HDL-c exhibited a negative association with pre-DM risk. No significant relationships were identified between pre-DM and smoking, Scr, LDL-c, or Hs-CRP (all P>0.05) (Supplementary Table S2). Kaplan-Meier survival curves, stratified by GHR quartiles and shown in Figure 4, illustrate the probability of prediabetes-free survival differed significantly between the GHR quartiles (log-rank test, p<0.001). The probability of prediabetes-free survival gradually decreased with increasing GHR, suggesting that participants with the highest GHR had the greatest risk of pre-DM.
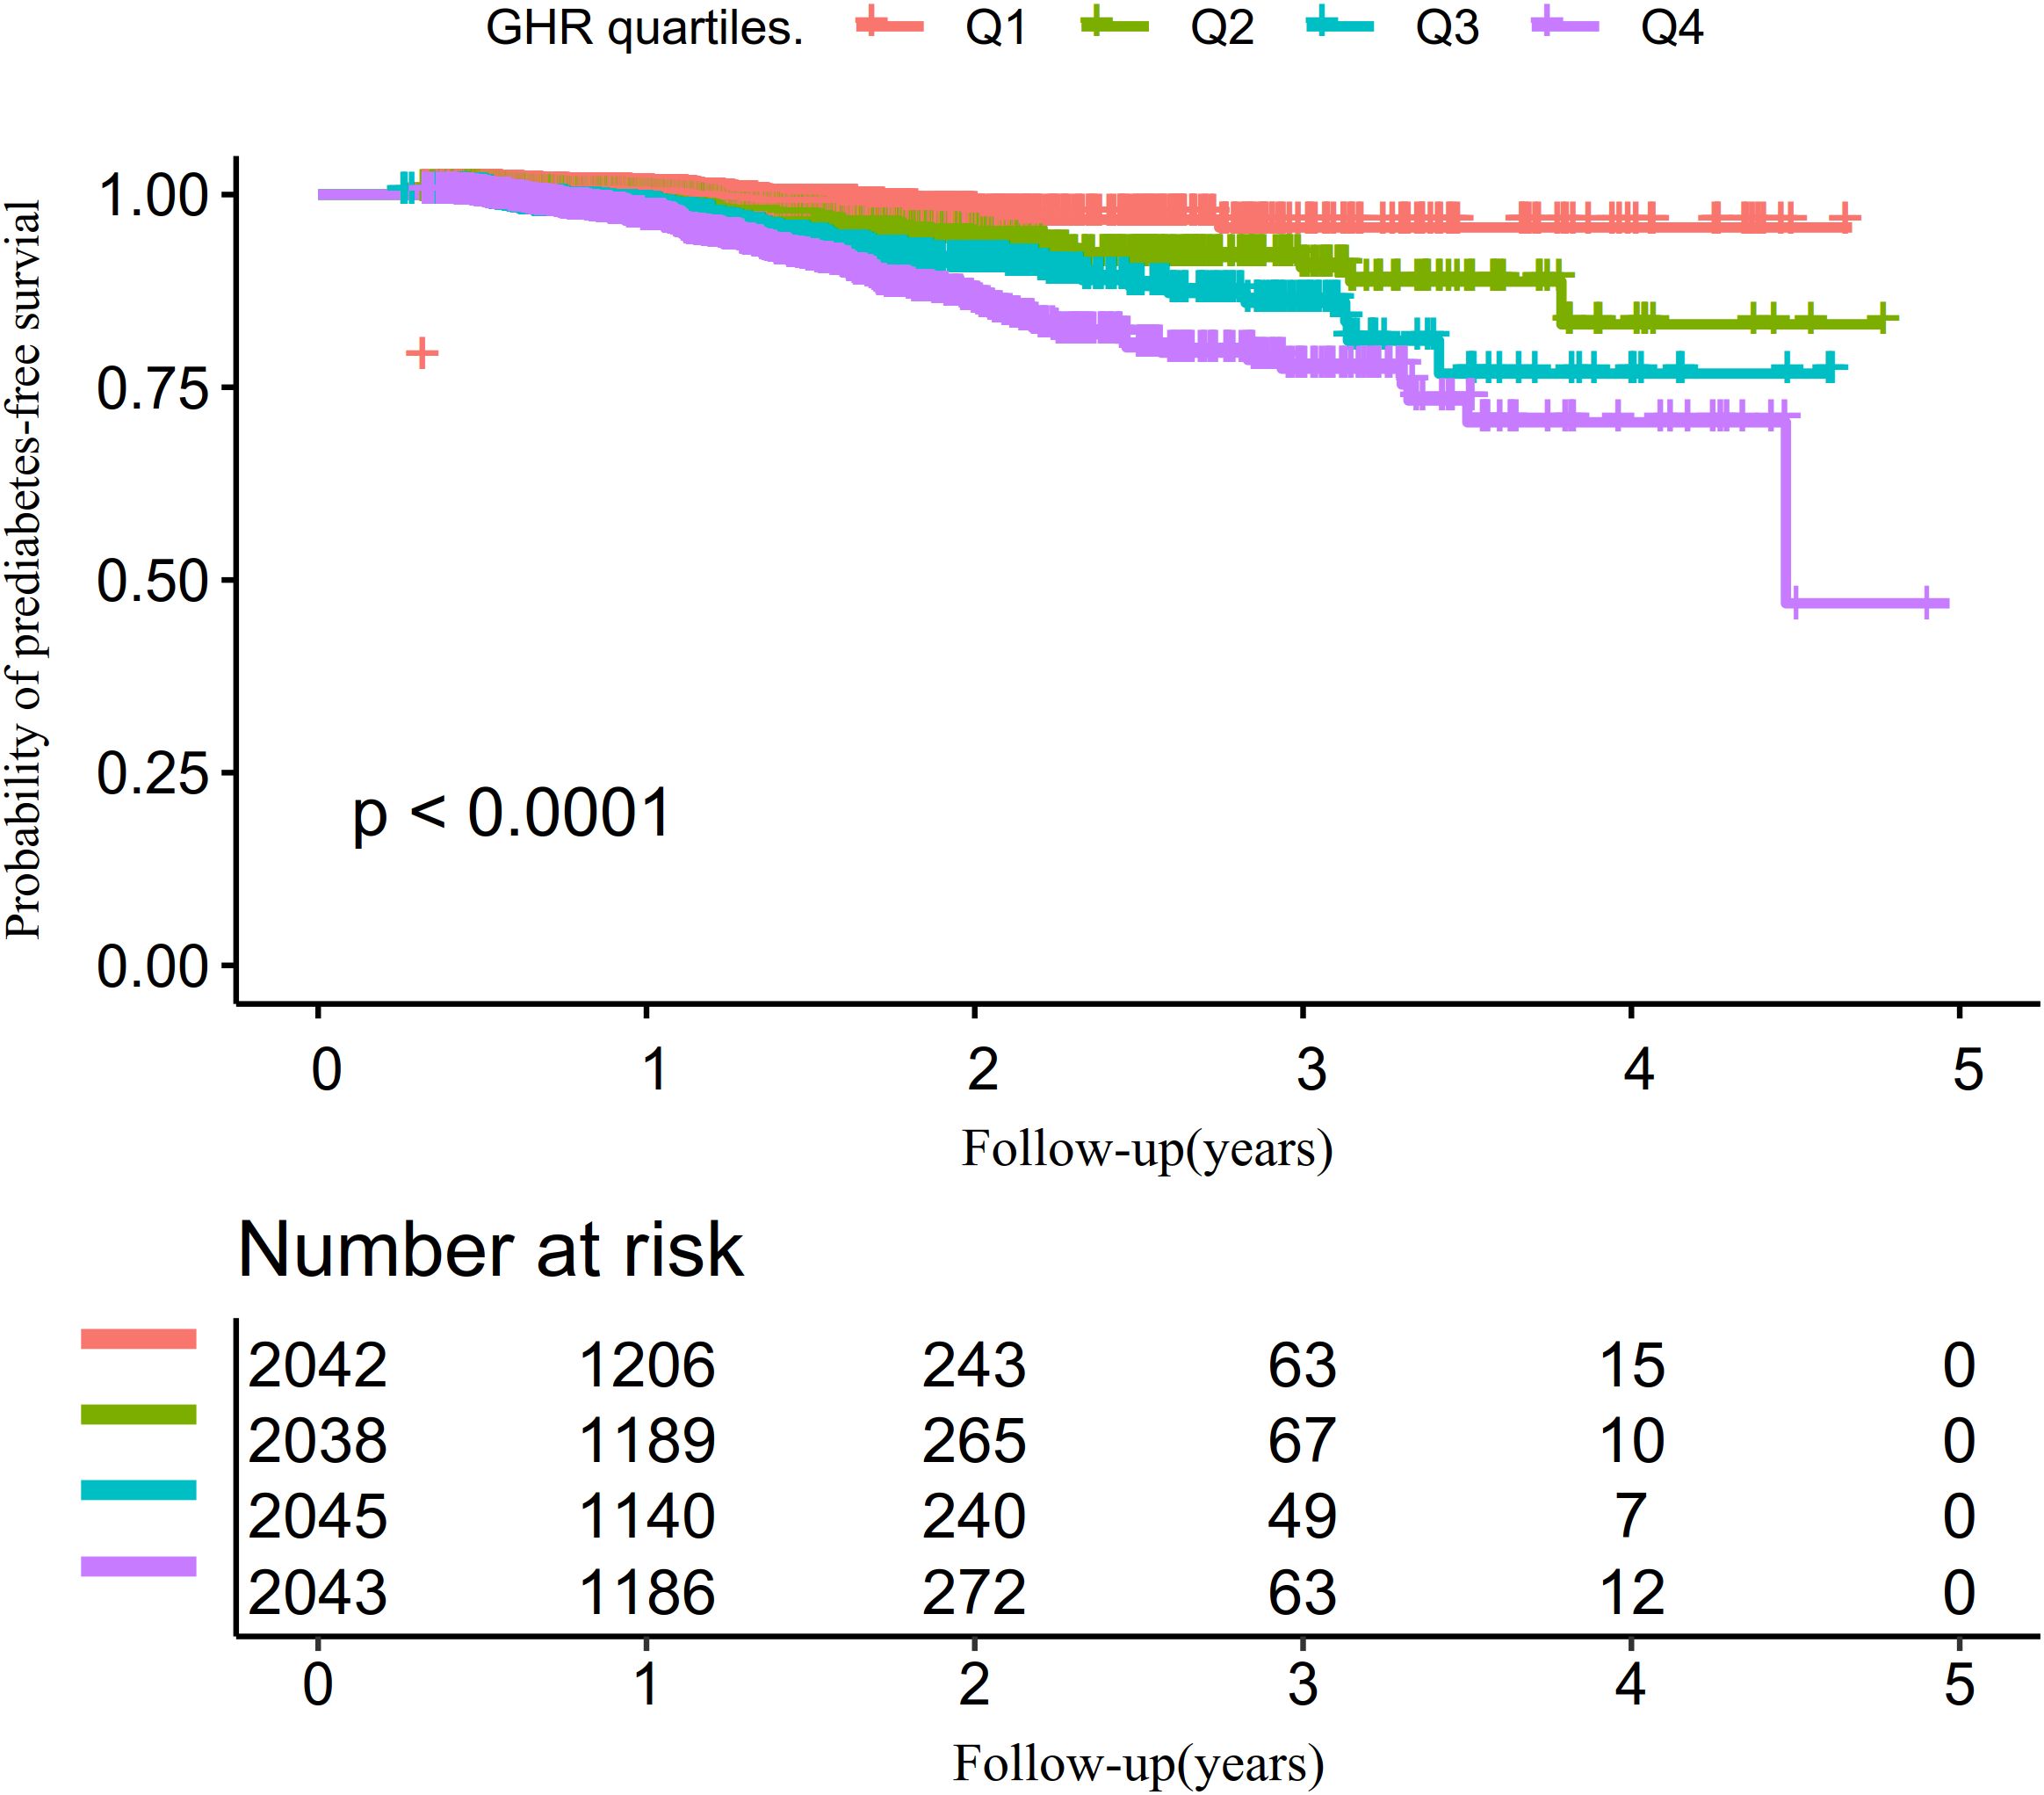
Figure 4. Kaplan–Meier event-free survival curve.
The relationship between GHR and the risk of progression from normoglycemia to prediabetes
To investigate the association between GHR and the risk of pre-DM, we established three Cox proportional hazards regression models. In Model I, each 5-unit increase in GHR was linked to an 11.2% higher risk of progression from normoglycemia to pre-DM (HR = 1.112, 95% CI: 1.085–1.139). Model II, adjusted for demographic variables, demonstrated that a 5-unit rise in GHR was significantly associated with a 10.2% increase in pre-DM risk (HR = 1.102, 95% CI: 1.074–1.131). Finally, Model III, which incorporated adjustments for a range of potential confounders, further validated the relationship, showing that each 5-unit increment in GHR corresponded to a 6.1% increase in the risk of pre-DM (HR = 1.061, 95% CI: 1.028–1.095) (Table 3).
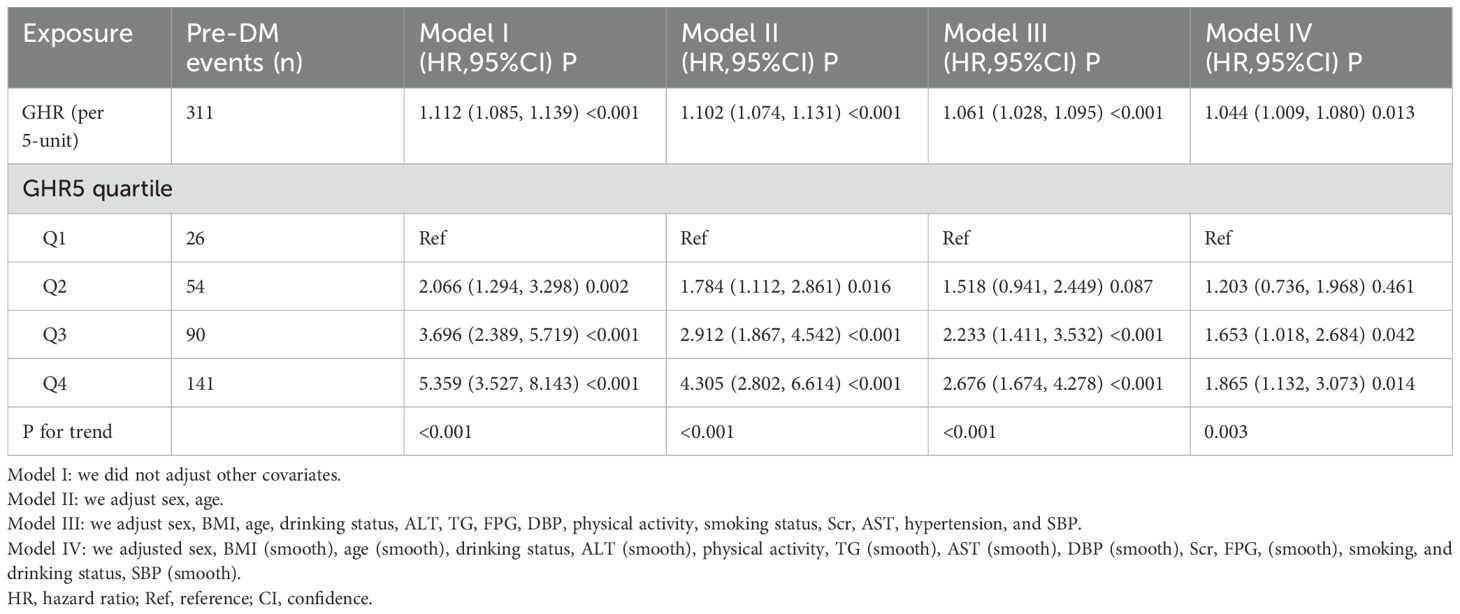
Table 3. The relationship between GHR and the risk of progression from normoglycemia to prediabetes.
Additionally, GHR was transformed from a continuous variable into a categorical one and reintroduced into the Cox proportional hazards regression model. In the multivariable-adjusted Model, using the first quartile (Q1, 26 pre-DM events) of GHR as the reference group, HRs for progression to pre-DM were 1.518 (95% CI: 0.941–2.449) for the second quartile (Q2, 54 pre-DM events), 2.233 (95% CI: 1.411–3.532) for the third quartile (Q3, 90 pre-DM events), and 2.676 (95% CI: 1.674–4.278) for the fourth quartile (Q4, 141 pre-DM events). This indicates that, compared to individuals in Q1, those in Q2 had a 51.8% higher risk of progression from normoglycemia to pre-DM, while participants in Q3 and Q4 had a 123.3% and 167.6% increased risk, respectively (Table 3 - Model III).
The competitive risk multivariate Cox proportional hazards regression results
Table 4 presented the findings of the competing risk analysis, which accounted for the progression from normoglycemia to DM as a competing event for the progression from normoglycemia to pre-DM. In Model I, a positive association was observed between GHR and the risk of pre-DM, with a subdistribution hazard ratio (SHR) of 1.11 (95% CI: 1.09–1.14) per 5-unit increase in GHR. After adjusting for sex and age in Model II, the SHR for the association between GHR and pre-DM risk was 1.09 (95% CI: 1.06–1.12) per 5-unit increment. In the fully adjusted Model (Model III), which controlled for potential confounders such as sex, BMI, age, drinking status, ALT, TG, FPG, DBP, smoking, Scr, AST, hypertension, and SBP, the positive relationship between GHR(per 5-unit) and pre-DM risk persisted, with an SHR of 1.05 (95% CI: 1.02–1.09).
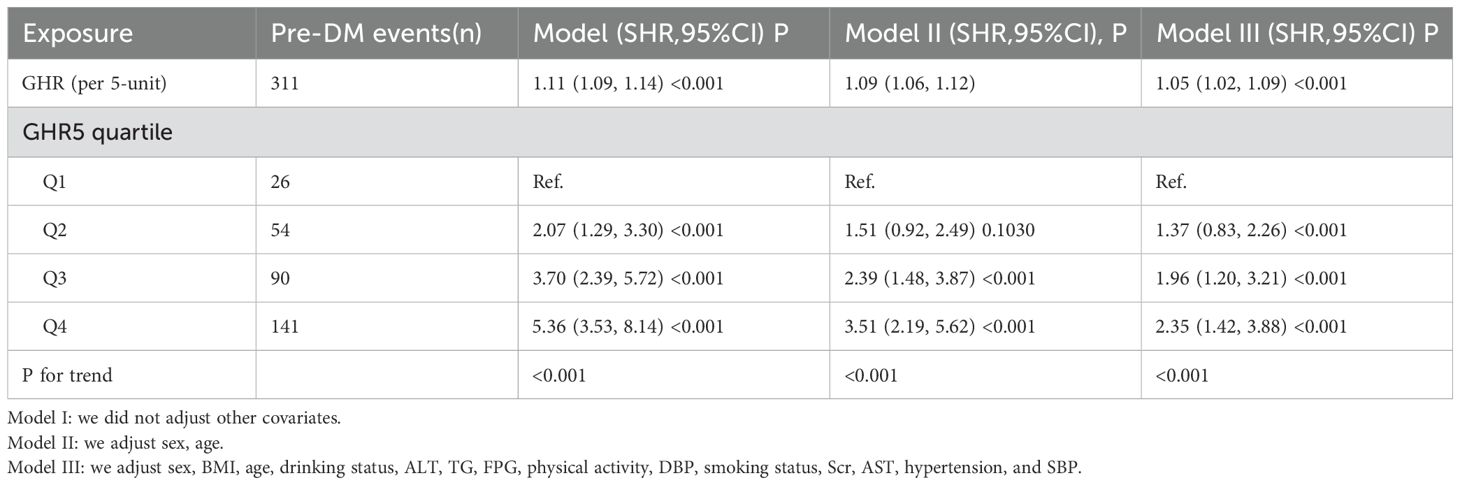
Table 4. The relationship between GHR and the progression from normoglycemia to pre-DM in different competing risk models.
The same pattern was observed when GHR was treated as a categorical variable. In the fully adjusted Model, participants in the second quartile(Q2, 54 pre-DM events) exhibited a 37% higher risk of developing pre-DM compared to those in the first quartile (Q1, 26 pre-DM events) (SHR = 1.37, 95% CI: 0.83–2.26). Those in the third quartile (Q3, 90 pre-DM events) had a 96% increased risk (SHR = 1.96, 95% CI: 1.20–3.21), while participants in the fourth quartile(Q4, 141 pre-DM events) demonstrated a 135% higher risk (SHR = 2.35, 95% CI: 1.42–3.88) relative to Q1.
Sensitivity analysis
To validate the robustness of our findings, we conducted multiple sensitivity analyses. First, continuous covariates were incorporated into the Model as smooth curves using GAM. As shown in Table 3 (Model IV), the results were largely consistent with those of the fully adjusted Model. Specifically, the analysis indicated that GHR (per 5-unit increase) was associated with an elevated risk of progressing from normoglycemia to pre-DM, with an HR of 1.044 (95% CI: 1.009–1.080). A sensitivity analysis was also performed on a subset of 6,205 participants with a BMI below 28 kg/m². After adjusting for potential confounders, the positive association between GHR (per 5-unit increase) and pre-DM risk persisted (HR = 1.062, 95% CI: 1.025–1.100). Furthermore, when individuals with hypertension were excluded from the analysis(n=7,441), the relationship between GHR (per 5-unit increase) and pre-DM risk remained significant after adjusting for confounding factors (HR = 1.059, 95% CI: 1.012–1.109) (Table 5).
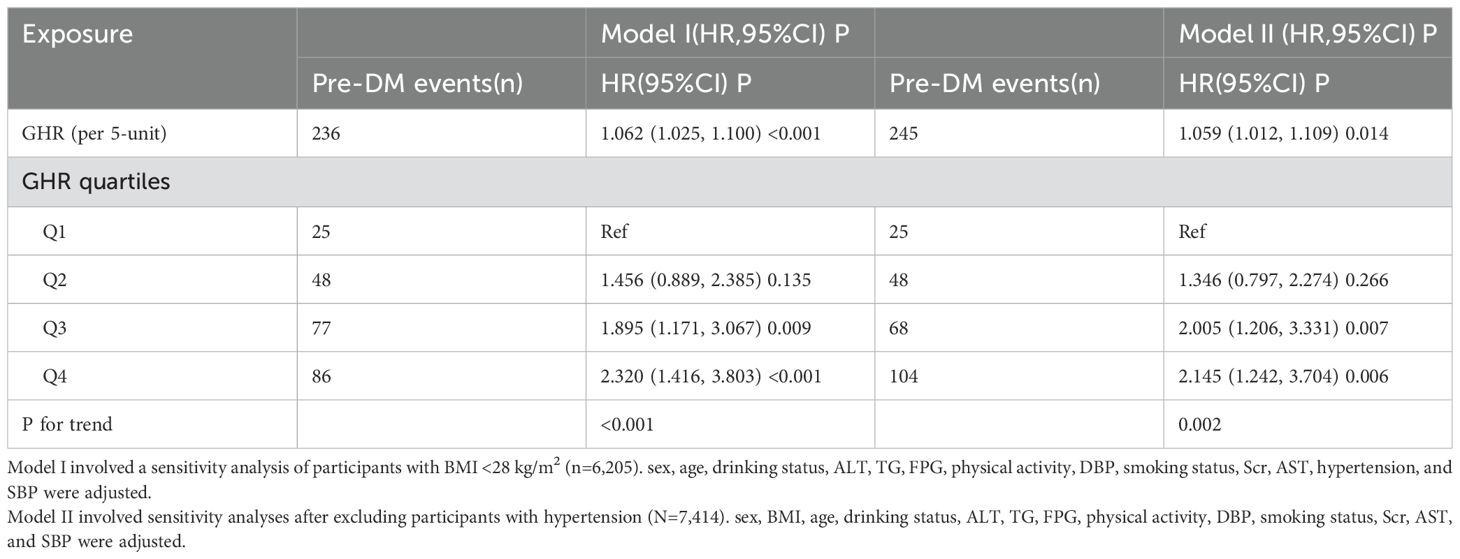
Table 5. The relationship between GHR and the progression from normoglycemia to pre-DM in different sensitivity analyses.
In addition, we observe that the E-value is 1.32, which exceeds the relative risk of 1.27 for the relationship between unmeasured confounders and GHR and is lower than the relative risk of 1.37 for the relationship between unmeasured confounders and pre-DM. This suggests that unknown or unmeasured confounders are unlikely to have a significant impact on the relationship between GHR and the risk of progression from normoglycemia to pre-DM. Furthermore, to evaluate the validity of the multiple imputation data, we compared the datasets obtained before and after the imputation. The results showed no significant differences in baseline characteristics between the two groups, with a p-value greater than 0.05 for the inter-group comparison. This indicates that the data are consistent, enhancing the credibility and validity of analyses conducted using the multiple imputation data (Supplementary Table S3). These comprehensive sensitivity analyses support the robustness and reliability of our research findings.
Non-linear relationship between GHR and the risk of progression from normoglycemia to pre-DM
Using the Cox proportional hazards regression model with cubic spline functions, we identify a non-linear association between GHR and the risk of progression from normoglycemia to pre-DM (Figure 5). Through a recursive algorithm, the inflection point for GHR is determined to be 24.37. To further explore this relationship, a two-segment Cox proportional hazards regression model is applied to estimate the HRs on either side of the inflection point. Below the inflection point, each 5-unit increase in GHR is associated with a significantly higher risk of progression to pre-DM (HR = 1.394, 95% CI: 1.197–1.623). However, above the inflection point, the HR is 1.024 (95% CI: 0.985–1.065), which is not statistically significant (Table 6).
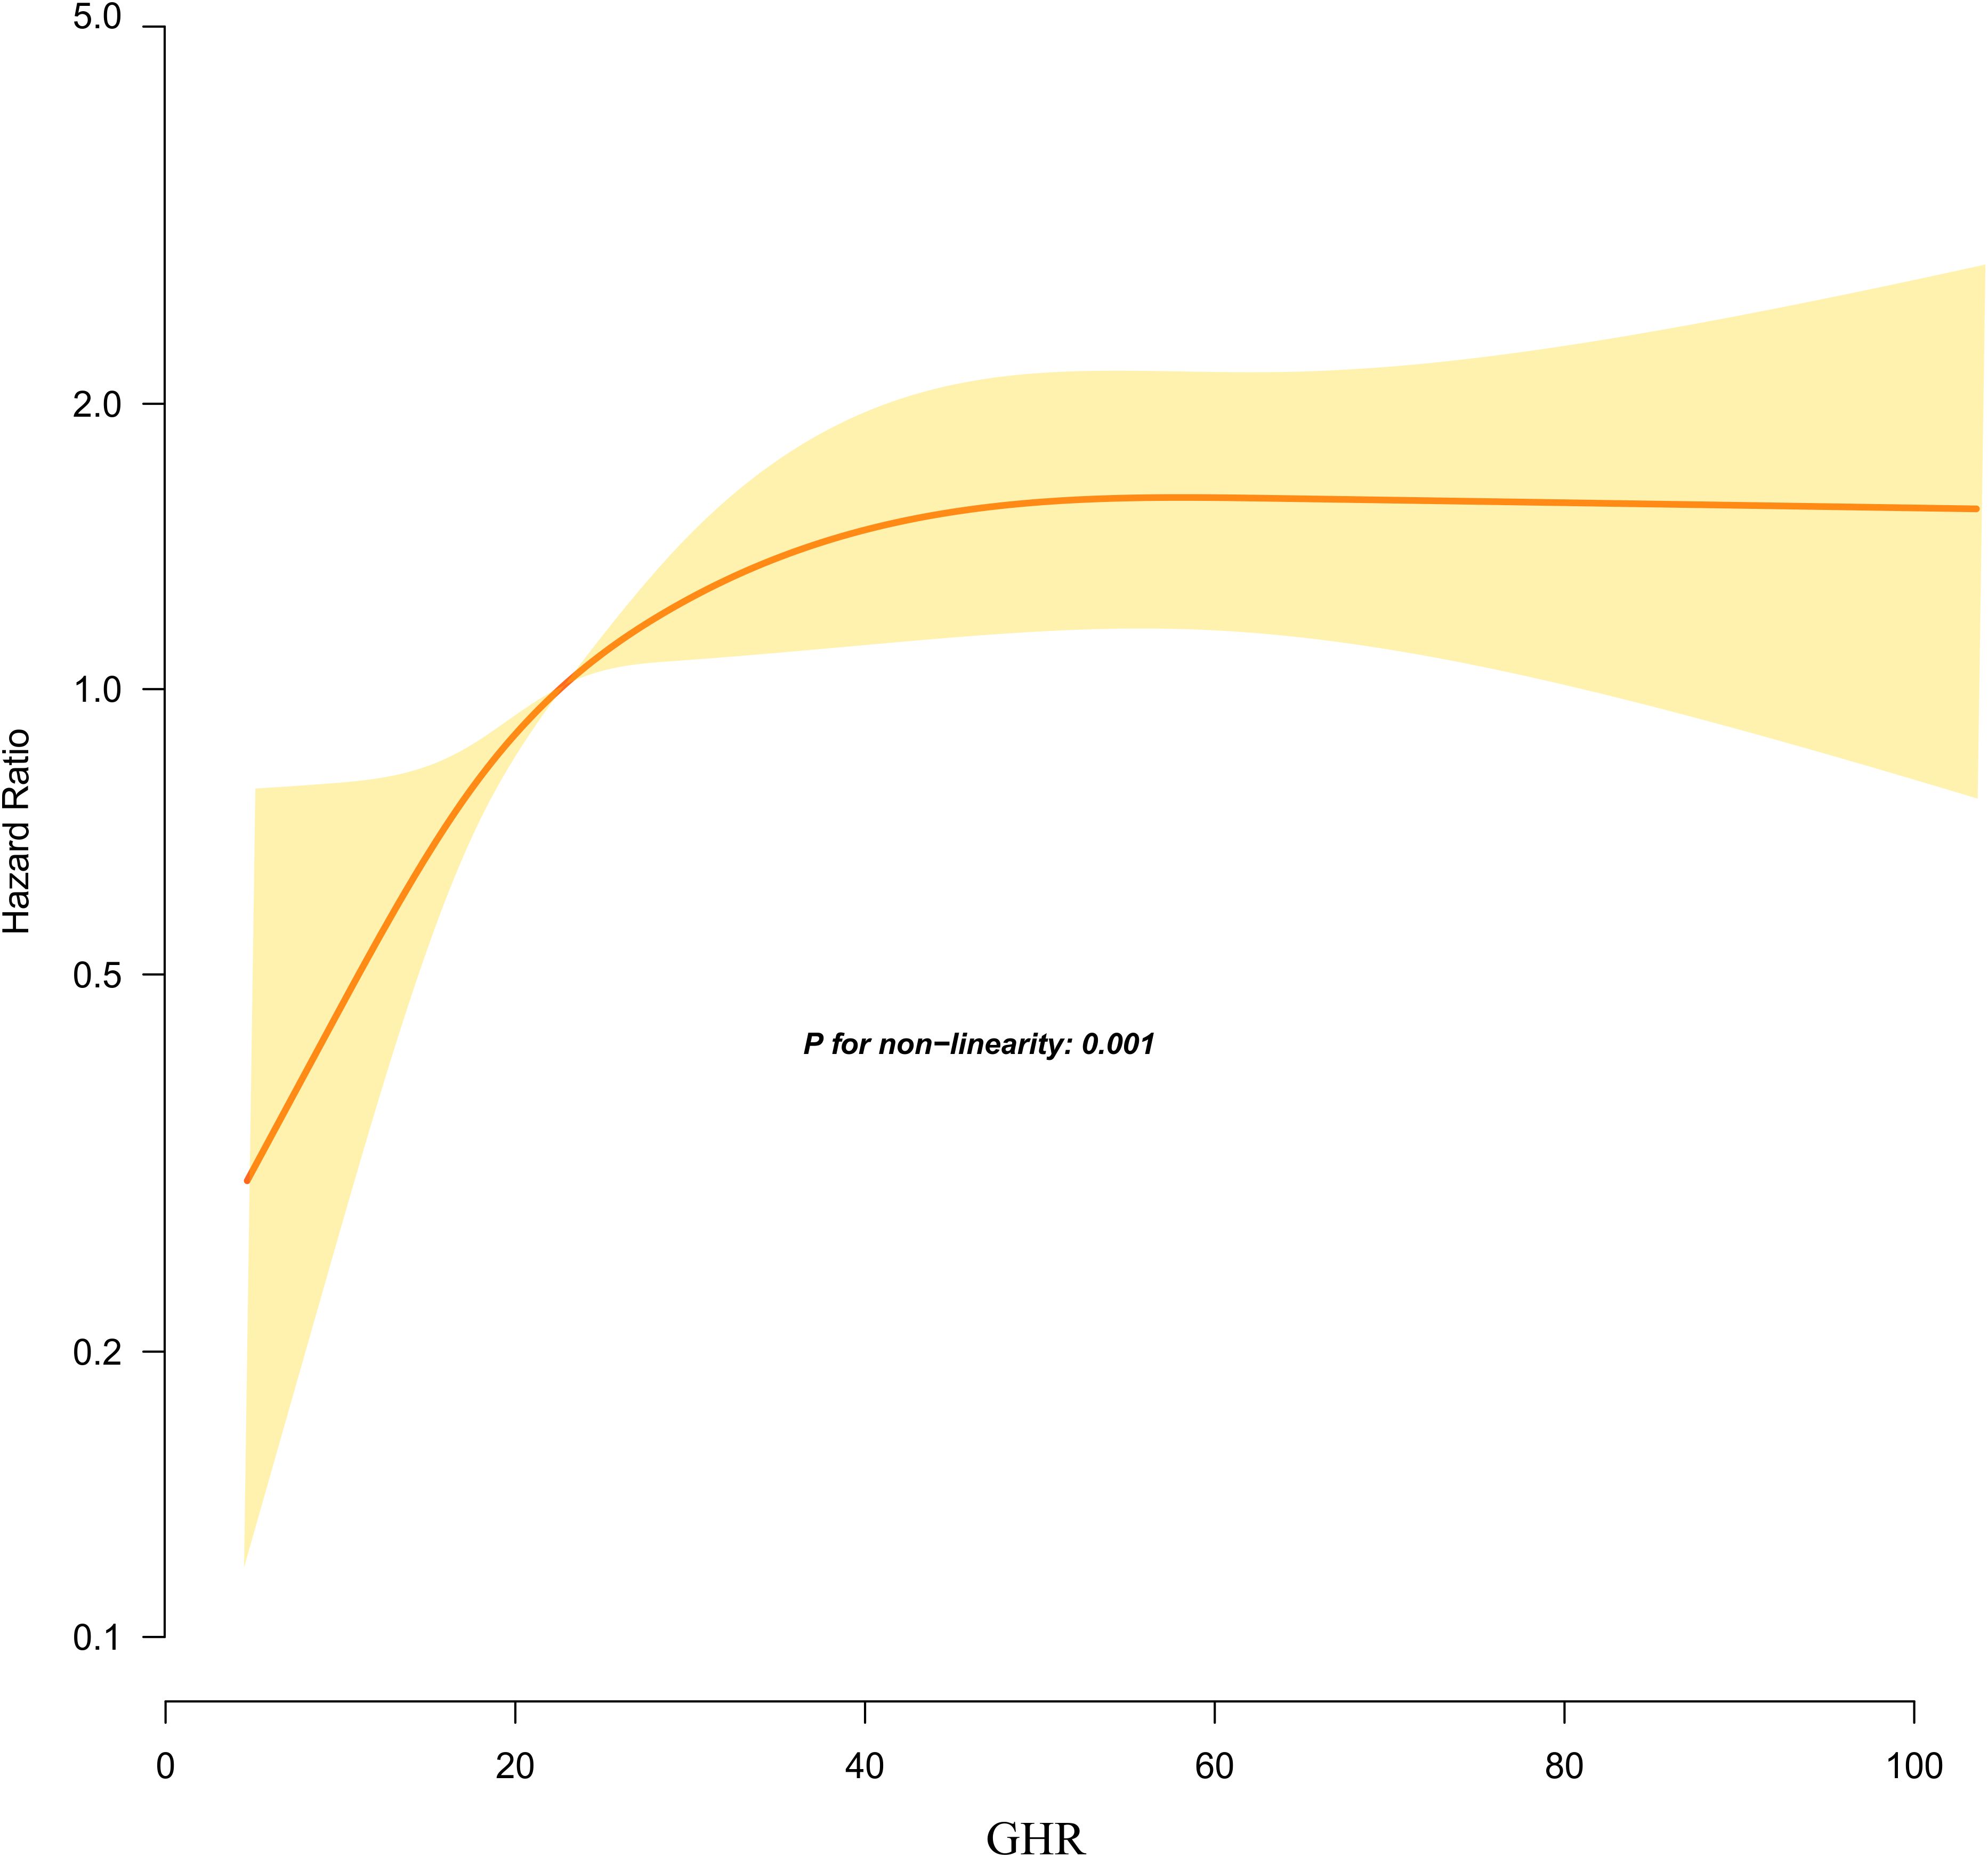
Figure 5. Kaplan–Meier event-free survival curve. The probability of prediabetes-free survival differed significantly between the GHR quartiles (log-rank test, p<0.001). The probability of prediabetes-free survival gradually decreased with increasing GHR, suggesting that the group with the highest GHR had the highest risk of prediabetes. Non-linear relationship between GHR and the risk of progression from normoglycemia to prediabetes.
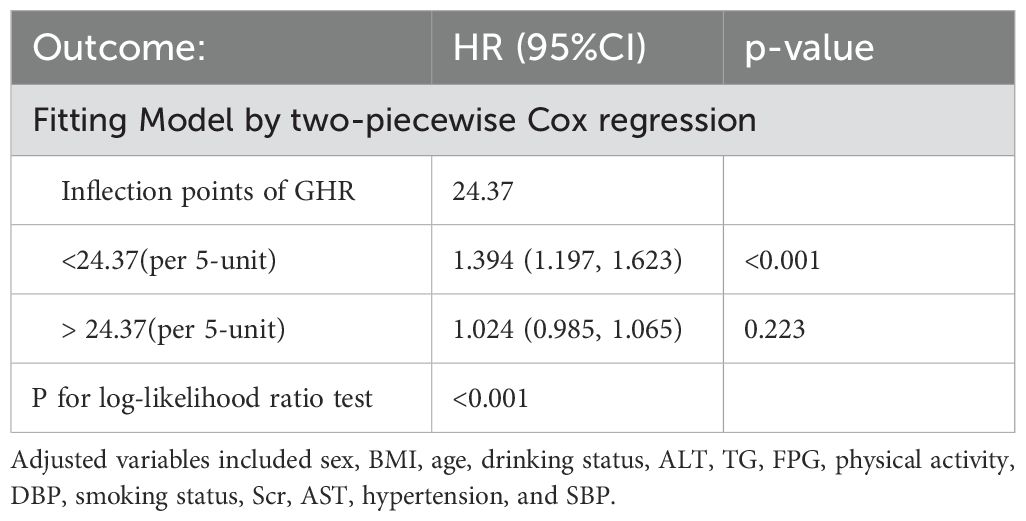
Table 6. The result of two-piecewise linear regression model.
Subgroup analysis
Across all predefined and exploratory subgroup analyses (Supplementary Table S4), no significant interactions were observed between GHR and variables such as sex, age, smoking, SBP, DBP, physical activity, or drinking status (P > 0.05 for interactions). These findings suggest that none of these factors significantly influence or modify the association between GHR and the risk of progression from normoglycemia to pre-DM.
Discussion
This retrospective cohort study revealed an independent positive link between GHR and the risk of progression from normoglycemia to pre-DM. Moreover, a saturation effect curve was identified, with an inflection point at a GHR value of 24.37. The association between GHR and the risk of progression to pre-DM varied on either side of this threshold.
The rising global prevalence of pre-DM has become a significant public health concern (42). The term “pre-DM” is used to identify individuals who are at risk of developing DM in the future. However, pre-DM is also associated with a high burden of cardiometabolic risk factors, DM-related complications, and adverse outcomes (6, 8, 43, 44). For example, one study suggests that abnormal glucose metabolism can induce a series of systemic metabolic and non-metabolic abnormalities, potentially leading to myocardial dysfunction, such as inflammation, fibrosis, and myocardial stiffening, which may result in heart failure with preserved ejection fractions (44). Therefore, identifying the risk factors for pre-DM and implementing early interventions are essential for preventing DM and its complications.
GGT, a biomarker commonly used to evaluate hepatocellular damage, is widely recognized as a predictor of NAFLD. Previous studies have demonstrated a significant association between elevated GGT levels and IR (45–47). Moreover, research has established a positive link between GGT and glucose metabolism disorders. For instance, a cohort study conducted in Korea involving 4,088 men reported that, compared to individuals with GGT levels below 9 U/L (31% of participants), the adjusted relative risks (RR) for DM incidence were 8.0, 13.3, 12.6, 19.6, and 25.8 for those with GGT concentrations of 10–19, 20–29, 30–39, 40–49, and above 50 U/L, respectively (48). Similarly, another Korean cohort study found that, after adjusting for confounding factors, men in the highest quartile of serum GGT levels had a 2.55-fold increased risk of developing DM compared to those in the lowest quartile (HR = 2.55, 95% CI: 1.86–3.51). Meanwhile, women in the highest quartile exhibited a 90% higher risk (HR = 1.90, 95% CI: 1.40–2.58) (49). Further supporting these findings, a cohort study of Japanese men observed comparable results. After adjusting for potential confounders, participants in the fifth quintile of GGT levels had a 1.44-fold increased risk of DM compared to those in the first quintile (RR = 2.44, 95% CI: 1.34–4.46) (50). In addition to GGT, HDL-c levels have been shown to have a significant inverse relationship with IR (51, 52). A cohort study in the United States involving 2,829 participants found that higher HDL-c levels were associated with a reduced risk of DM, with an HR of 0.78 (95% CI: 0.50–0.63) per standard deviation increase (53). Similarly, a secondary analysis of data from a Japanese cohort study revealed that low HDL-c levels were linked to an elevated risk of DM (HR = 0.54, 95% CI: 0.35–0.82 (54). Likewise, a study focusing on middle-aged and elderly individuals in China reported similar conclusions. Compared to participants with HDL-c levels below 1.15 mmol/L, the adjusted HRs for those with HDL-c levels of 1.15–1.39 mmol/L, 1.40–1.69 mmol/L, and ≥1.70 mmol/L were 0.98 (95% CI: 0.62–1.55), 0.48 (95% CI: 0.27–0.85), and 0.44 (95% CI: 0.25–0.80), respectively (55). Based on these findings, it can be inferred that GHR may be positively associated with the risk of progression from normoglycemia to pre-DM. Unfortunately, no studies to date have explored this potential relationship. Our findings provide evidence supporting this hypothesis. Furthermore, we analyzed this relationship by examining GHR as both a continuous and categorical variable, which allowed us to minimize information loss and quantify the association more precisely. Sensitivity analyses focusing on participants with BMI below 28 kg/m² and those without hypertension further validated the consistency of these findings within specific subgroups. Additionally, the results of the competing risk multivariate Cox proportional hazards regression analysis were consistent with those obtained from the standard multivariate Cox proportional hazards model, reinforcing the robustness of our conclusions. In conclusion, elucidating the relationship between GHR and pre-DM holds significant clinical value. Incorporating GHR into routine clinical assessments could enable healthcare providers to identify high-risk individuals at an earlier stage, facilitating timely lifestyle or pharmacological interventions to prevent or delay the onset of pre-DM and ultimately reduce the incidence of DM.
Moreover, a nonlinear relationship between GHR and the risk of pre-DM was identified for the first time. The inflection point for GHR was determined to be 24.37. Below this threshold, each 5-unit increase in GHR was associated with a 39.4% higher risk of progressing from normoglycemia to pre-DM. However, when GHR exceeded 24.37, the relationship was no longer statistically significant. In other words, the risk of progression from normoglycemia to pre-DM increased significantly with higher GHR levels in patients. However, when GHR reached 24.37, further increases in GHR did not lead to additional increases in the risk of progression from normoglycemia to pre-DM. The study found that participants with GHR ≥24.37 had higher levels of age, SBP, DBP, LDL-c, TG, SBP, and ALT compared to those with GHR <24.37. Additionally, participants with GHR ≥24.37 had higher proportions of physical inactivity, hypertension, and smoking (Supplementary Table S5). However, these indicators are closely related to glucose metabolism and IR (56–59). When GHR exceeded 24.37, the impact of GHR on pre-DM became relatively weaker due to the presence of these risk factors. Conversely, in populations with GHR less than 24.37, these risk factors for diabetic metabolic disorders were at lower levels, resulting in a reduced impact on DM and a relatively stronger effect of GHR. This might explain the nonlinear relationship between GHR and pre-DM risk. The identification of this nonlinear association carries important clinical implications. It offers valuable guidance for clinical counseling and provides a reference for optimizing strategies to prevent pre-DM and DM. Specifically, maintaining GHR levels below 24.37 through dietary interventions and lifestyle modifications and further reducing GHR levels could significantly decrease the risk of progressing from normoglycemia to pre-DM.
This study presents several significant strengths: (i) It is the first to explore the association between GHR and the risk of pre-DM in individuals with normoglycemia; (ii) The study elucidated the nonlinear relationship between GHR and the risk of progression from normoglycemia to pre-DM and identified the inflection point. This represents a significant advance; (iii) multiple imputation techniques were utilized to address missing data, thereby enhancing statistical power and reducing bias associated with absent covariate information; and (iv) to validate our findings, we conducted a series of sensitivity analyses. These included transforming GHR into a categorical variable, incorporating continuous covariates as curves in GAM, utilizing competing risk models, and re-evaluating the relationship between GHR and pre-DM incidence after excluding participants with a BMI greater than 28 kg/m² or those with hypertension.
However, several limitations should be noted: First, the association between GHR and the progression from normoglycemia to pre-DM may differ among various ethnic groups, indicating that our results require further validation across diverse racial populations. We intend to collaborate with international researchers to explore these associations in cohorts with different genetic backgrounds. Second, as this study is a retrospective cohort study, we cannot adjust for unobserved factors. For example, this study did not collect information on hepatitis C viruses, which previous study has shown to have a significant association with DM and IR (60). To address this, we calculated E-values to evaluate the potential influence of unmeasured confounding factors, which indicated that such factors were unlikely to significantly impact our findings. In future investigations, we will include as many relevant variables as possible, including lifestyle factors, lipid-lowering medications, and information on hepatitis C virus infection, in order to conduct a more comprehensive analysis of the relationship between GHR and the progression from normoglycemia to pre-DM. Additionally, this study only measured GHR and other parameters at baseline, without assessing changes in GHR over time. Future research efforts will involve either conducting new studies or collaborating with other researchers to gather more comprehensive data, including longitudinal changes in GHR levels. Lastly, it is important to note that while this retrospective observational study can establish an independent association between GHR and the incidence of prediabetes, it cannot determine a causal relationship between the two. This needs to be further explored in future prospective studies.
Conclusion
This study reveals a positive, nonlinear association between GHR and the risk of progression from normoglycemia to pre-DM in Chinese adults. Specifically, when GHR is below 24.37, a significant positive association exists between GHR and the risk of pre-DM. Healthcare providers and patients can work together to lower GHR levels through dietary interventions and lifestyle changes. Lowering GHR to at least below 24.37 and further decreasing it has the potential to substantially reduce the risk of progression from normoglycemia to pre-DM. This study provides valuable insights to support clinical consultations and optimize prevention strategies for pre-DM and DM.
Data availability statement
The raw data supporting the conclusions of this article will be made available by the authors, without undue reservation.
Ethics statement
The studies involving humans were approved by the Ethics Committee of Shenzhen Dapeng New District Kuichong People's Hospital (Ethics Approval Number: 2024005). The studies were conducted in accordance with the local legislation and institutional requirements. The ethics committee/institutional review board waived the requirement of written informed consent for participation from the participants or the participants' legal guardians/next of kin because of the retrospective design of the study and the complete anonymization of all data.
Author contributions
CG: Data curation, Investigation, Methodology, Writing – original draft. CY: Data curation, Formal Analysis, Investigation, Software, Writing – original draft. PS: Data curation, Investigation, Project administration, Supervision, Writing – review & editing. DL: Funding acquisition, Methodology, Validation, Writing – review & editing. QL: Software, Supervision, Validation, Writing – review & editing. YH: Software, Supervision, Validation, Writing – review & editing.
Funding
The author(s) declare that financial support was received for the research and/or publication of this article. Shenzhen Second People’s Hospital Clinical Research Fund of Shenzhen High-level Hospital Construction Project provided financial support for this study under Grant No. 20243357011.
Acknowledgments
We extend our gratitude to the colleagues from the Emergency Department of Kuichong People’s Hospital for their efforts in data collection and organization.
Conflict of interest
The authors declare that the research was conducted in the absence of any commercial or financial relationships that could be construed as a potential conflict of interest.
Generative AI statement
The author(s) declare that no Generative AI was used in the creation of this manuscript.
Publisher’s note
All claims expressed in this article are solely those of the authors and do not necessarily represent those of their affiliated organizations, or those of the publisher, the editors and the reviewers. Any product that may be evaluated in this article, or claim that may be made by its manufacturer, is not guaranteed or endorsed by the publisher.
Supplementary material
The Supplementary Material for this article can be found online at: https://www.frontiersin.org/articles/10.3389/fendo.2025.1552044/full#supplementary-material
Abbreviations
GHR, the ratio of γ-glutamyl transferase to high-density lipoprotein cholesterol; Hs-CRP, high-sensitivity C-reactive protein; TG, triglyceride; HbA1c, hemoglobin A1c; ALT, alanine aminotransferase; HDL-c, high-density lipoprotein cholesterol; Ref, reference; AST, aspartate aminotransferase; BMI, body mass index; DM, diabetes mellitus; CI, confidence interval; Scr, serum creatinine; SBP, systolic blood pressure; GAM, generalized additive Model; FPG, fasting plasma glucose; HR, hazard ratio; LDL-c, low-density lipid cholesterol; IDF, International Diabetes Federation; DBP, diastolic blood pressure; TC, total cholesterol; GGT, γ-glutamyl transferase; Pre-DM, prediabetes.
References
1. Kuzuya T. Early diagnosis, early treatment and the new diagnostic criteria of diabetes mellitus. Br J Nutr. (2000) 84 Suppl 2:S177–81. doi: 10.1079/096582197388644
2. Sun H, Saeedi P, Karuranga S, Pinkepank M, Ogurtsova K, Duncan BB, et al. IDF Diabetes Atlas: Global, regional and country-level diabetes prevalence estimates for 2021 and projections for 2045. Diabetes Res Clin Pract. (2022) 183:109119. doi: 10.1016/j.diabres.2021.109119
3. Fradkin JE, Cowie CC, Hanlon MC, and Rodgers GP. Celebrating 30 years of research accomplishments of the diabetes control and complications trial/epidemiology of diabetes interventions and complications study. Diabetes. (2013) 62:3963–67. doi: 10.2337/db13-1108
4. Tran KB, Lang JJ, Compton K, Xu R, Acheson AR, Henrikson HJ, et al. The global burden of cancer attributable to risk factors, 2010-19: a systematic analysis for the Global Burden of Disease Study 2019. Lancet. (2022) 400:563–91. doi: 10.1016/S0140-6736(22)01438-6
5. Ebrahimi H, Aryan Z, Saeedi Moghaddam S, Bisignano C, Rezaei S, Pishgar F, et al. Global, regional, and national comparative risk assessment of 84 behavioural, environmental and occupational, and metabolic risks or clusters of risks for 195 countries and territories, 1990-2017: a systematic analysis for the Global Burden of Disease Study 2017. Lancet. (2018) 392:1923–94. doi: 10.1016/S0140-6736(18)32225-6
6. Tabák AG, Herder C, Rathmann W, Brunner EJ, and Kivimäki M. Prediabetes: a high-risk state for diabetes development. Lancet. (2012) 379:2279–90. doi: 10.1016/S0140-6736(12)60283-9
7. Echouffo-Tcheugui JB and Selvin E. Prediabetes and what it means: the epidemiological evidence. Annu Rev Public Health. (2021) 42:59–77. doi: 10.1146/annurev-publhealth-090419-102644
8. White NH, Pan Q, Knowler WC, Schroeder EB, Dabelea D, Chew EY, et al. Risk factors for the development of retinopathy in prediabetes and type 2 diabetes: the diabetes prevention program experience. Diabetes Care. (2022) 45:2653–61. doi: 10.2337/dc22-0860
9. Echouffo-Tcheugui JB, Narayan KM, Weisman D, Golden SH, and Jaar BG. Association between prediabetes and risk of chronic kidney disease: a systematic review and meta-analysis. Diabetes Med. (2016) 33:1615–24. doi: 10.1111/dme.13113
10. Cai X, Zhang Y, Li M, Wu JH, Mai L, Li J, et al. Association between prediabetes and risk of all cause mortality and cardiovascular disease: updated meta-analysis. BMJ. (2020) 370:m2297. doi: 10.1136/bmj.m2297
11. Wang L, Gao P, Zhang M, Huang Z, Zhang D, Deng Q, et al. Prevalence and ethnic pattern of diabetes and prediabetes in China in 2013. JAMA. (2017) 317:2515–23. doi: 10.1001/jama.2017.7596
12. Knowler WC, Barrett-Connor E, Fowler SE, Hamman RF, Lachin JM, Walker EA, et al. Reduction in the incidence of type 2 diabetes with lifestyle intervention or metformin. N Engl J Med. (2002) 346:393–403. doi: 10.1056/NEJMoa012512
13. Wu L, Zhang M, Hu H, and Wan Q. Elevated gamma-glutamyl transferase has a non-linear association with incident non-alcoholic fatty liver disease in the non-obese Chinese population: a secondary retrospective study. Lipids Health Dis. (2021) 20:142. doi: 10.1186/s12944-021-01577-8
14. Fadaei R, Poustchi H, Meshkani R, Moradi N, Golmohammadi T, and Merat S. Impaired HDL cholesterol efflux capacity in patients with non-alcoholic fatty liver disease is associated with subclinical atherosclerosis. Sci Rep. (2018) 8:11691. doi: 10.1038/s41598-018-29639-5
15. Karami S, Poustchi H, Sarmadi N, Radmard AR, Ali YF, Pakdel A, et al. Association of anti-oxidative capacity of HDL with subclinical atherosclerosis in subjects with and without non-alcoholic fatty liver disease. Diabetol Metab Syndr. (2021) 13:121. doi: 10.1186/s13098-021-00741-5
16. Park JY, Han K, Kim HS, Cho JH, Yoon KH, Kim MK, et al. Cumulative exposure to high γ-glutamyl transferase level and risk of diabetes: A nationwide population-based study. Endocrinol Metab (Seoul). (2022) 37:272–80. doi: 10.3803/EnM.2022.1416
17. Zhao W, Tong J, Liu J, Liu J, Li J, and Cao Y. The dose-response relationship between gamma-glutamyl transferase and risk of diabetes mellitus using publicly available data: A longitudinal study in Japan. Int J Endocrinol. (2020) 2020:5356498. doi: 10.1155/2020/5356498
18. Feng G, Feng L, and Zhao Y. Association between ratio of γ-glutamyl transpeptidase to high-density lipoprotein cholesterol and prevalence of nonalcoholic fatty liver disease and metabolic syndrome: a cross-sectional study. Ann Transl Med. (2020) 8:634. doi: 10.21037/atm-19-4516
19. Xing Y, Chen J, Liu J, and Ma H. Associations between GGT/HDL and MAFLD: A cross-sectional study. Diabetes Metab Syndr Obes. (2022) 15:383–94. doi: 10.2147/DMSO.S342505
20. Li Q, Han Y, Hu H, and Zhuge Y. Gamma-glutamyl transferase to high-density lipoprotein cholesterol ratio has a non-linear association with non-alcoholic fatty liver disease: A secondary prospective cohort study in non-obese Chinese adults. Front Med (Lausanne). (2022) 9:995749. doi: 10.3389/fmed.2022.995749
21. Zheng X, Cao C, He Y, Wang X, Wu J, and Hu H. Association between nonalcoholic fatty liver disease and incident diabetes mellitus among Japanese: a retrospective cohort study using propensity score matching. Lipids Health Dis. (2021) 20:59. doi: 10.1186/s12944-021-01485-x
22. Long Y, Jia D, Wei L, Yang Y, Tian H, and Chen T. Liver-specific overexpression of gamma-glutamyltransferase ameliorates insulin sensitivity of male C57BL/6 mice. J Diabetes Res. (2017) 2017:2654520. doi: 10.1155/2017/2654520
23. Li T, Yan H, Geng Y, Shi H, Li H, Wang S, et al. Target genes associated with lipid and glucose metabolism in non-alcoholic fatty liver disease. Lipids Health Dis. (2019) 18:211. doi: 10.1186/s12944-019-1154-9
24. Lonardo A, Lugari S, Ballestri S, Nascimbeni F, Baldelli E, and Maurantonio M. A round trip from nonalcoholic fatty liver disease to diabetes: molecular targets to the rescue? Acta Diabetol. (2019) 56:385–96. doi: 10.1007/s00592-018-1266-0
25. Firneisz G. Non-alcoholic fatty liver disease and type 2 diabetes mellitus: the liver disease of our age? World J Gastroenterol. (2014) 20:9072–89. doi: 10.3748/wjg.v20.i27.9072
26. Tilg H, Moschen AR, and Roden M. NAFLD and diabetes mellitus. Nat Rev Gastroenterol Hepatol. (2017) 14:32–42. doi: 10.1038/nrgastro.2016.147
27. Hu H, Han Y, Guan M, Wei L, Wan Q, and Hu Y. Elevated gamma-glutamyl transferase to high-density lipoprotein cholesterol ratio has a non-linear association with incident diabetes mellitus: A second analysis of a cohort study. J Diabetes Investig. (2022) 13:2027–37. doi: 10.1111/jdi.13900
28. Chen W, Hu H, Cao C, Liu D, and Han Y. Link between remnant cholesterol and the reversion to normoglycemia in Chinese adults with prediabetes: a 5-year cohort study. Sci Rep. (2024) 14:18098. doi: 10.1038/s41598-024-69169-x
29. Qin Q, Wan H, Wang D, Li J, Qu Y, Zhao J, et al. The association of CSF sTREM2 with cognitive decline and its dynamic change in Parkinson’s disease: analysis of the PPMI cohort. Front Aging Neurosci. (2022) 14:892493. doi: 10.3389/fnagi.2022.892493
30. ElSayed NA, Aleppo G, Aroda VR, Bannuru RR, Brown FM, Bruemmer D, et al. 2. Classification and diagnosis of diabetes: standards of care in diabetes-2023. Diabetes Care. (2023) 46:S19–40. doi: 10.2337/dc23-S002
31. Zheng X, Zhang X, Han Y, Hu H, and Cao C. Nonlinear relationship between atherogenic index of plasma and the risk of prediabetes: a retrospective study based on Chinese adults. Cardiovasc Diabetol. (2023) 22:205. doi: 10.1186/s12933-023-01934-0
32. Han Y, Hu H, Li Q, Deng Z, and Liu D. Triglyceride glucose-body mass index and the risk of progression to diabetes from prediabetes: A 5-year cohort study in Chinese adults. Front Public Health. (2023) 11:1028461. doi: 10.3389/fpubh.2023.1028461
33. Groenwold RH, White IR, Donders AR, Carpenter JR, Altman DG, and Moons KG. Missing covariate data in clinical research: when and when not to use the missing-indicator method for analysis. Cmaj. (2012) 184:1265–69. doi: 10.1503/cmaj.110977
34. White IR, Royston P, and Wood AM. Multiple imputation using chained equations: Issues and guidance for practice. Stat Med. (2011) 30:377–99. doi: 10.1002/sim.4067
35. Basak R, Mistry H, and Chen RC. Understanding competing risks. Int J Radiat Oncol Biol Phys. (2021) 110:636–40. doi: 10.1016/j.ijrobp.2021.01.008
36. Berger M, Schmid M, Welchowski T, Schmitz-Valckenberg S, and Beyersmann J. Subdistribution hazard models for competing risks in discrete time. Biostatistics. (2020) 21:449–66. doi: 10.1093/biostatistics/kxy069
37. Ohishi M. Hypertension with diabetes mellitus: physiology and pathology. Hypertens Res. (2018) 41:389–93. doi: 10.1038/s41440-018-0034-4
38. Han Y, Hu H, Huang Z, and Liu D. Association between body mass index and reversion to normoglycemia from impaired fasting glucose among Chinese adults: a 5-year cohort study. Front Endocrinol (Lausanne). (2023) 14:1111791. doi: 10.3389/fendo.2023.1111791
39. Shah VN, Prattichizzo F, and Ceriello A. Obesity and diabetes. Diabetes Technol Ther. (2023) 25:S217–26. doi: 10.1089/dia.2023.2515
40. Zhou BF. Predictive values of body mass index and waist circumference for risk factors of certain related diseases in Chinese adults–study on optimal cut-off points of body mass index and waist circumference in Chinese adults. BioMed Environ Sci. (2002) 15:83–96. doi: 10.1046/j.1440-6047.11.s8.9.x
41. Haneuse S, VanderWeele TJ, and Arterburn D. Using the E-value to assess the potential effect of unmeasured confounding in observational studies. JAMA. (2019) 321:602–03. doi: 10.1001/jama.2018.21554
42. Echouffo-Tcheugui JB, Perreault L, Ji L, and Dagogo-Jack S. Diagnosis and management of prediabetes: A review. JAMA. (2023) 329:1206–16. doi: 10.1001/jama.2023.4063
43. Sasso FC, Pafundi PC, Gelso A, Bono V, Costagliola C, Marfella R, et al. High HDL cholesterol: A risk factor for diabetic retinopathy? Findings from NO BLIND study. Diabetes Res Clin Pract. (2019) 150:236–44. doi: 10.1016/j.diabres.2019.03.028
44. Salvatore T, Galiero R, Caturano A, Vetrano E, Rinaldi L, Coviello F, et al. Dysregulated epicardial adipose tissue as a risk factor and potential therapeutic target of heart failure with preserved ejection fraction in diabetes. Biomolecules. (2022) 12:176. doi: 10.3390/biom12020176
45. Wei D, Chen T, Gao Y, and Tian H. Serum gamma-glutamyltransferase and ferritin are related to insulin resistance: A population-based study. Clin Lab. (2015) 61:1157–61. doi: 10.7754/clin.lab.2015.150227
46. Ishizaka N, Ishizaka Y, Toda E, Yamakado M, Koike K, and Nagai R. Association between gamma-glutamyltransferase levels and insulin resistance according to alcohol consumption and number of cigarettes smoked. J Atheroscler Thromb. (2010) 17:476–85. doi: 10.5551/jat.2717
47. Shin JY, Chang SJ, Shin YG, Seo KS, and Chung CH. Elevated serum gamma-glutamyltransferase levels are independently associated with insulin resistance in non-diabetic subjects. Diabetes Res Clin Pract. (2009) 84:152–57. doi: 10.1016/j.diabres.2009.02.004
48. Lee DH, Ha MH, Kim JH, Christiani DC, Gross MD, Steffes M, et al. Gamma-glutamyltransferase and diabetes–a 4 year follow-up study. Diabetologia. (2003) 46:359–64. doi: 10.1007/s00125-003-1036-5
49. Lee JH, Lee HS, and Lee YJ. Serum γ-glutamyltransferase as an independent predictor for incident type 2 diabetes in middle-aged and older adults: Findings from the KoGES over 12 years of follow-up. Nutr Metab Cardiovasc Dis. (2020) 30:1484–91. doi: 10.1016/j.numecd.2020.04.027
50. Nakanishi N, Suzuki K, and Tatara K. Serum gamma-glutamyltransferase and risk of metabolic syndrome and type 2 diabetes in middle-aged Japanese men. Diabetes Care. (2004) 27:1427–32. doi: 10.2337/diacare.27.6.1427
51. Budak N, Oztürk A, Mazicioglu M, Yazici C, Bayram F, and Kurtoglu S. Decreased high-density lipoprotein cholesterol and insulin resistance were the most common criteria in 12- to 19-year-old adolescents. Eur J Nutr. (2010) 49:219–25. doi: 10.1007/s00394-009-0066-2
52. Hoofnagle AN, Wu M, Gosmanova AK, Becker JO, Wijsman EM, Brunzell JD, et al. Low clusterin levels in high-density lipoprotein associate with insulin resistance, obesity, and dyslipoproteinemia. Arterioscler Thromb Vasc Biol. (2010) 30:2528–34. doi: 10.1161/ATVBAHA.110.212894
53. Agoons DD, Musani SK, Correa A, Golden SH, Bertoni AG, and Echouffo-Tcheugui JB. High-density lipoprotein-cholesterol and incident type 2 diabetes mellitus among African Americans: The Jackson Heart Study. Diabetes Med. (2022) 39:e14895. doi: 10.1111/dme.14895
54. Cao C, Hu H, Zheng X, Zhang X, Wang Y, and He Y. Non-linear relationship between high-density lipoprotein cholesterol and incident diabetes mellitus: a secondary retrospective analysis based on a Japanese cohort study. BMC Endocr Disord. (2022) 22:163. doi: 10.1186/s12902-022-01074-8
55. Cao X, Tang Z, Zhang J, Li H, Singh M, Sun F, et al. Association between high-density lipoprotein cholesterol and type 2 diabetes mellitus among Chinese: the Beijing longitudinal study of aging. Lipids Health Dis. (2021) 20:71. doi: 10.1186/s12944-021-01499-5
56. Sakr HF, Sirasanagandla SR, Das S, Bima AI, and Elsamanoudy AZ. Insulin resistance and hypertension: mechanisms involved and modifying factors for effective glucose control. Biomedicines. (2023) 11:2271. doi: 10.3390/biomedicines11082271
57. Wu WC, Wei JN, Chen SC, Fan KC, Lin CH, Yang CY, et al. Progression of insulin resistance: A link between risk factors and the incidence of diabetes. Diabetes Res Clin Pract. (2020) 161:108050. doi: 10.1016/j.diabres.2020.108050
58. Deboer MD, Wiener RC, Barnes BH, and Gurka MJ. Ethnic differences in the link between insulin resistance and elevated ALT. Pediatrics. (2013) 132:e718–26. doi: 10.1542/peds.2012-3584
59. Nakamura M and Sadoshima J. Cardiomyopathy in obesity, insulin resistance and diabetes. J Physiol. (2020) 598:2977–93. doi: 10.1113/JP276747
Keywords: prediabetes, γ-glutamyl transferase, γ-glutamyl transferase to high-density lipoprotein ratio, nonlinearity, competing risk model
Citation: Gao C, Yu C, Shi P, Liu D, Li Q and Han Y (2025) Nonlinear association between gamma-glutamyl transferase to high-density lipoprotein cholesterol ratio and risk of progression from normoglycemia to prediabetes: a 5-year cohort study. Front. Endocrinol. 16:1552044. doi: 10.3389/fendo.2025.1552044
Received: 27 December 2024; Accepted: 23 June 2025;
Published: 07 July 2025.
Edited by:
Luca Rinaldi, University of Molise, ItalyReviewed by:
Alfredo Caturano, Università telematica San Raffaele, ItalyRaffaele Galiero, University of Campania Luigi Vanvitelli, Italy
Copyright © 2025 Gao, Yu, Shi, Liu, Li and Han. This is an open-access article distributed under the terms of the Creative Commons Attribution License (CC BY). The use, distribution or reproduction in other forums is permitted, provided the original author(s) and the copyright owner(s) are credited and that the original publication in this journal is cited, in accordance with accepted academic practice. No use, distribution or reproduction is permitted which does not comply with these terms.
*Correspondence: Dehong Liu, ZGhsaXVfZW1lcmdlbmN5QDE2My5jb20=; Qiming Li, bGlxaW1pbmcyMzFAaG90bWFpbC5jb20=; Yong Han, aGFueW9uZzUxMTAyM0AxNjMuY29t
†These authors have contributed equally to this work