 Palihaderu Arachchige Dineth Supasan Palihaderu1
 Balapuwaduge Isuru Layan Madusanka Mendis1†
 Jayasekara Mudiyanselage Krishanthi Jayarukshi Kumari Premarathne2
 Wajjakkara Kankanamlage Ruwin Dias3
 Swee Keong Yeap4
 Wan Yong Ho5
 Arosha Sampath Dissanayake6
 Iyanthimala Harshini Rajapakse7
 Panduka Karunanayake8
 Upul Senarath9
 Dilan Amila Satharasinghe1*
- 1Department of Basic Veterinary Sciences, Faculty of Veterinary Medicine and Animal Science, University of Peradeniya, Peradeniya, Sri Lanka
- 2Department of Livestock and Avian Sciences, Faculty of Livestock, Fisheries, and Nutrition, Wayamba University of Sri Lanka, Makandura, Gonawila, Sri Lanka
- 3Department of North Indian Music, Faculty of Music, University of the Visual and Performing Arts, Colombo, Sri Lanka
- 4China-ASEAN College of Marine Sciences, Xiamen University Malaysia, Sepang, Selangor, Malaysia
- 5Faculty of Science and Engineering, University of Nottingham Malaysia, Semenyih, Malaysia
- 6Department of Clinical Medicine, Faculty of Medicine, University of Ruhuna, Galle, Sri Lanka
- 7Department of Psychiatry, Faculty of Medicine, University of Ruhuna, Galle, Sri Lanka
- 8Department of Clinical Medicine, Faculty of Medicine, University of Colombo, Colombo, Sri Lanka
- 9Department of Community Medicine, Faculty of Medicine, University of Colombo, Colombo, Sri Lanka
Introduction: Type 2 Diabetes mellitus is a major global health concern. MicroRNA plays an important role in regulating pancreatic beta cells as well as peripheral insulin signaling. This study aimed to identify reference microRNA s in type 2 Diabetes mellitus plasma and validate two target microRNAs among a Sri Lankan population with type 2 diabetes mellitus.
Methods: This is a cross-sectional experiment. A total of fifty-three (N = 53) non-hemolyzed plasma samples from individuals with type 2 diabetes mellitus were selected to evaluate stability, in comparison to thirty-eight (N = 38) normoglycemic non-hemolyzed plasma samples. Initially, the stability of four candidate reference microRNAs (hsa-miR-16-5p, hsa-miR-425-5p, hsa-miR-191-5p, and hsa-miR-22-5p) was assessed. Stability was analyzed using the geNorm and BestKeeper algorithms. The relative expression changes of hsa-miR-29a-3p and hsa-miR-375-3p in the plasma of the same samples were evaluated using the validated reference microRNAs. The selected regulatory microRNAs were directly linked with type 2 diabetes mellitus pathogenesis and proved to be upregulated in type 2 diabetes mellitus plasma and serum.
Results and discussion: The expressions of miR-16-5p and miR-191-5p were not stable between the two groups, miR-22-5p and miR-425-5p levels were found to be stable. A significant upregulation of hsa-miR-29a-3p and hsa-miR-375-3p was observed in type 2 diabetes mellitus patients compared to normoglycemic individuals (p ≤ 0.05). This was the first study to claim hsa-miR-425-5p and hsa-miR-22-5p as stably expressed reference microRNAs in type 2 diabetes mellitus patients. Sri Lankan type 2 diabetic patients also had increased hsa-miR-29a-3p and hsa-miR-375-3p levels. However, large and well-matched sample studies were suggested to ensure that these microRNAs can be used as type 2 diabetes diagnostic markers in Sri Lanka.
Introduction
Diabetes mellitus (DM) has become a major concern and is recognized as one of the fastest-growing challenges of the 21st century (1). As one of the major DM types, type 2 DM has accomplished the utmost concern in the past few decades due to its increased worldwide emergence. The burden of type 2 DM in the world is being increased at an exponential rate in almost every region in the world (1, 2). Without exception, the prevalence of type 2 DM is rapidly increasing in Sri Lanka.– A recent meta-analysis based on prevalence data from 1990 to 2021 revealed that the prevalence of type 2 DM among the general Sri Lankan population has tripled within two decades (3).
MicroRNAs (miRNAs) are one of the key modulators that act post-transcriptionally on messenger RNA (mRNAs) ultimately regulating the subsequent protein translation and thereby the gene expression (4, 5). These small nc-RNA molecules play a role in the etiology and regulation of DM. In type 2 DM, the ablation of beta-cell survival and function progressed due to impaired glucose homeostasis (2, 6, 7). MiRNA expression patterns in the pancreatic beta-cells are different in type 2 DM patients compared to non-disease individuals and were shown regulatory role in beta-cell survival and function. Insulin’s effects on peripheral tissues, like regulating blood glucose, rely on the insulin signaling (IS) pathway. Key molecules in this pathway, like Insulin signaling receptor (INSR) and glucose transporter 4 (GLUT4) (6), are controlled by miRNAs. Dysregulation of these proteins caused by specific miRNAs can lead to insulin resistance. Furthermore, atypical expression of extracellular miRNAs has been demonstrated in type 2 DM (8). Due to their differential expressions and stability, extracellular miRNAs were often studied for their applicability as non-invasive biological markers for type 2 DM diagnostics, disease stratification, and prognostic determination (9).
Accurately quantifying miRNA expression changes in the extracellular environment relies heavily on the selection of stable reference genes (RG) or reference miRNAs (RMs) whose expression remains constant amidst the disease processes (10, 11). These genes/miRNAs act as internal controls, allowing researchers to normalize the expression of regulatory gene/miRNAs of interest and accurately compare expression levels across different samples (11–13). While several templates have been employed as reference controls in past type 2 DM-related miRNA expression studies, their suitability and stability within the specific context of type 2 DM plasma remain to be thoroughly evaluated (14, 15). However, no single “perfect” RM exists for normalizing circulating miRNAs in all situations. This is because the expression of these miRNAs can change depending on the disease of interest or condition being studied (11, 16). Therefore, researchers need to carefully choose and validate RG/RMs specific to their experiment (study population, sample type, and disease) (11). Prior validation of RMs ensures reliable results when measuring miRNA expressions using RT-qPCR.
In this study, we focused on two objectives. Initially, we aim to assess the potential validation of four candidate RMs in type 2 DM patients. Four miRNAs were selected for this study as the candidate RMs. Those included hsa-miR-16-5p, hsa-miR-22a-5p, hsa-miR-191-5p, and hsa-miR-425-5p. As the second objective, we aimed to determine if we could replicate previous observations of hsa-miR-29a-3p and hsa-miR-375-3p using our newly validated RMs in Sri Lankan type 2 DM patients compared to normoglycemic individuals. To the best of our knowledge, no studies published on the expression levels of miRNAs in the Sri Lankan type 2 DM population making this the first study of this caliber. Though the existing miRNA studies have focused on other diseases, such an approach remains unexplored in Sri Lanka (17, 18). By examining the expression levels of these miRNAs in Sri Lankan individuals with type 2 diabetes, we tried to explore the potential of using them as diagnostic markers for the type 2 DM condition in the Sri Lankan population.
Methodology
Ethics approval
The study protocol was reviewed and approved by the ethics committee, Faculty of Medicine, University of Colombo (EC-20-010), and the ethics committee of the National Hospital of Sri Lanka.
Recruitment of type 2 DM patients and individuals with normoglycemia
Potential type 2 DM patients were recruited from the general medicine ward of the National Hospital of Sri Lanka. Individuals with normoglycemia were recruited from the community from the 1st of March 2022 to the 30th of November 2022. Both type 2 DM patients and normoglycemic individuals were provided with the necessary information and obtained their written consent to participate in the study. This was done initially, either when the subjects attended their clinics or any other place that was convenient for the candidates by trained research assistants. Individuals who consented were initially screened by a trained medical officer. Type 2 DM patients suffering from chronic infections, hepatic and other endocrine metabolic diseases, recent traumas, cancers, hypertension, and macro and microvascular complications were initially screened and excluded. The medical officer evaluated and excluded the individuals who were suspected to be normoglycemic for possible malignant tumors, cardiovascular diseases, or other non-diabetic chronic diseases.
When recruiting normoglycemic individuals, a convenient sampling method was followed. The caretakers, close relatives, or spouses who accompanied type 2 DM patients to the clinic were targeted. The medical officer evaluated and excluded the individuals who were suspected to be normoglycemic for possible malignant tumors, cardiovascular diseases, or other non-diabetic chronic diseases. However, the participants’ candidacy for the selected group was pre-confirmed by an initial Glycated hemoglobin 1c (HbA1c) test. A patient was considered a type 2 DM patient if the HbA1c level was ≥ 6.5% while the subjects with an HbA1c level < 5.6% were considered normoglycemic based on WHO and ADA guidelines (19, 20). HbA1c level, age, and gender were collected as demographics in both groups (Figure 1).
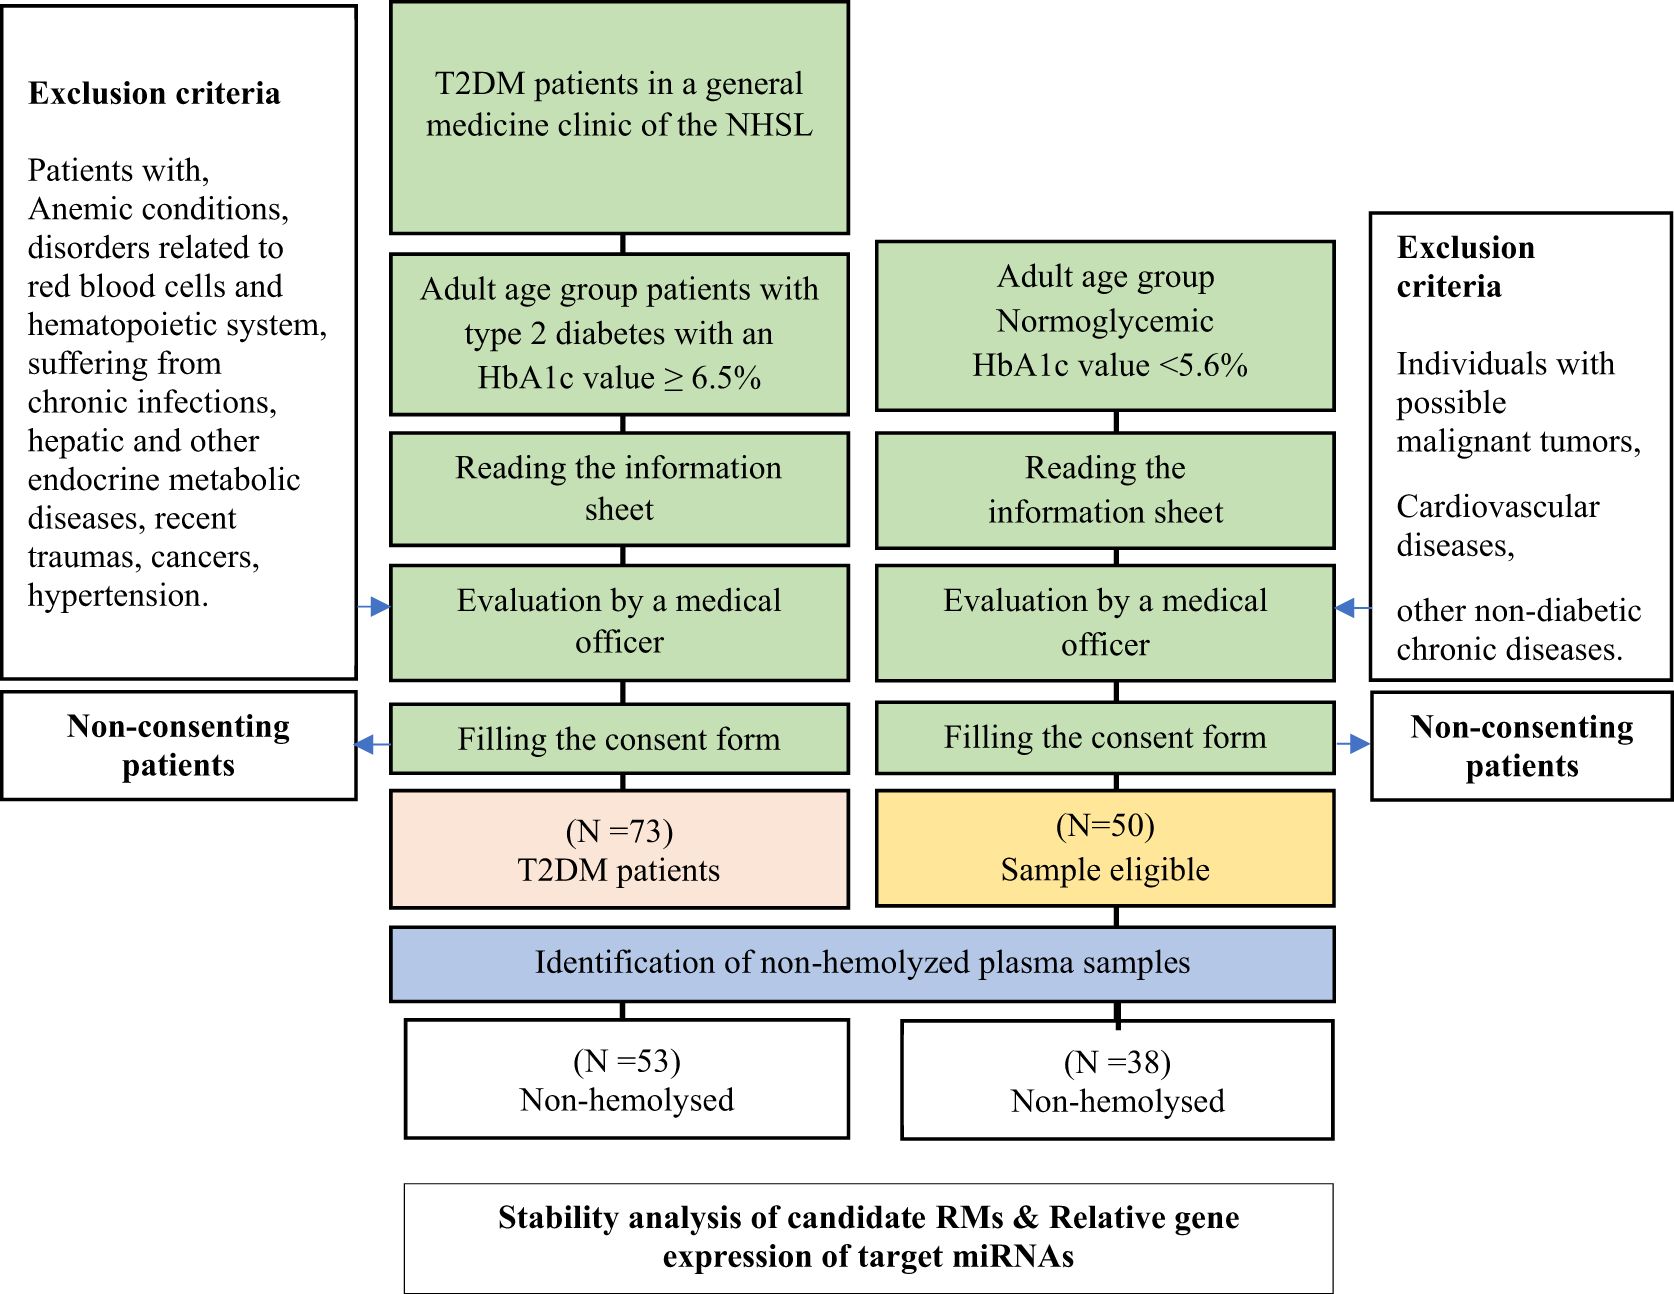
Figure 1. Sample selection and experimental design.
Blood sample collection and plasma separation
Venous blood was drawn and collected in the EDTA-coated tubes (Becton-Dickinson, Franklin Lakes, New Jersey, USA) and stored at 4 °C (21). Venepunctures were conducted by nursing officers. Venous blood was taken into 5.0 mL EDTA-containing tubes. For the HbA1c analysis, 2 mL was used, and for the miRNA analysis, 3 mL was taken. The blood samples for the HbA1c test were delivered to a nearby accredited third-party laboratory. The fraction collected for miRNA analysis was transported at 4 °C to the molecular laboratory within 24 hours (21). Blood was drawn from the type 2 DM patients in the clinic in a sterile environment. Similarly, a sterile environment was maintained when collecting blood from normoglycemic individuals.
The HbA1c was assessed by an ISO 15189 accredited third-party laboratory using the Variant II Turbo Hemoglobin testing system (Bio-Rad, USA). The laboratory used a system that was certified with the National Glycohemoglobin Program (NGSP) and traceable to the International Federation of Clinical Chemistry (IFCC) reference method.
For the miRNA analysis, plasma was separated from normoglycemic individuals and type 2 DM patients following the manufacturer’s protocol (miRNeasy Serum/Plasma Advanced Kit, (QIAGEN, Germany). The blood samples were centrifuged for 10 min at 1900×g (3000 rpm) at 4°C within 24 hours from the blood sample collection. The upper plasma phases were transferred to new micro-centrifuge tubes. To remove the additional cellular nucleic acids attached to the cell debris, the plasma samples were re-centrifuged for 15 min at 3000×g (6200 rpm) at 4°C. The supernatant was transferred to microcentrifuge tubes and immediately stored in 1 mL aliquots at −80 °C until analysis. The frozen plasma was thawed at room temperature (25 °C) before being used for analysis.
Hemolysis assessment
The levels of hemolysis were measured by spectral analysis using the Nanodrop 2000 spectrophotometer (ThermoFisher Scientific, USA). The absorbance values of each plasma at 414 nm wavelength were measured (22).
RNA isolation and quality evaluation
Total RNA was from the plasma using miRNeasy Serum/Plasma Advanced Kit (QIAGEN, Germany). The initial plasma volume was 300 µL. Spike–in controls were used to evaluate the extraction and complementary DNA (cDNA) synthesis steps (miRNeasy Serum/Plasma Spike-In Control, Qiagen, Germany). Total RNA was extracted from serum samples stored at -80°C. Samples were thawed at room temperature and mixed with a Spike-In extraction solution within an RPL buffer. Plasma was then added, followed by additional buffers and mixing steps. After centrifugation, the supernatant was transferred and mixed with isopropanol before being loaded onto an RNeasy UCP MinElute column. Sequential washing steps with buffers (RWT and, RPE) and ethanol eliminated impurities. Finally, RNA was eluted with RNase-free water and collected for downstream reactions. Even though RNA stabilizers were not used (23) to prevent RNA degradation, precautions were taken to minimize the RNA loss. Immediately after the isolation, RNA was stored at -80°C.
cDNA synthesis and quantitative real-time PCR analysis
The total RNA concentration and the RNA integrity were measured using the Nanodrop 2000 spectrophotometer (ThermoFisher Scientific, USA). For miRNA expression analysis, 20ng of the extracted RNA was reverse transcribed using miRCURY LNA RT Kit (QIAGEN, Hildon, Germany) according to the given protocol. The mixture contained 2 µL 5×miRCURY RT Reaction Buffer, 1 µL 10× miRCURY RT Enzyme Mix, RNA template, and RNAse free water. The volume corresponding to 20ng of RNA template was added and topped up the volume to 10 µL using the RNAse-free water.
Then, the reverse transcription was conducted using the CFX96 Touch TM Real-time PCR detection system (Bio-Rad, USA) with a parameter of 42 °C for 60 min, followed by 95 °C for 5 min and 4 °C cooling.
The prepared cDNA was diluted (2-fold) with nuclease-free water before proceeding. The expression was screened using the miRCURY SYBR Green PCR Kit (QIAGEN, Germany). In-house designed and validated primers were used for the analysis of miRNA expression in the CFX96 Touch TM Real-time PCR detection system (Bio-Rad, USA).
The PCR amplification was performed following, a reaction cycle of 95°C for 2 minutes followed by denaturation at 95°C for 10 sec and annealing and extension at 56°C for 60 sec. Melt curve analysis was performed to check the specificity of the amplification products. Meld curves were run from 60°C to 95°C using the CFX96 Touch TM Real-time PCR detection system (Bio-Rad, USA).
Selection of reference and target microRNAs
The hsa-miR-16-5p, hsa-miR-425-5p, hsa-miR-195-5p, and hsa-miR-22-5p were selected as RMs of interest primarily because they were discovered to be endogenous RMs in the plasma and serum of individuals with diverse diseases. In the human blood plasma, serum, and other organs of patients suffering from various ailments, these selected miRNAs were found to be quite stable, and even previous studies have utilized these miRNAs as reference controls including type 2 DM (Supplementary Table 1). Furthermore, according to our prior research survey (from year 2019 -2020), though previous research has shown that these miRNAs have regulatory functions in other diseases, no direct association has been identified between their plasma expressions and type 2 DM.
According to previous studies, hsa-miR-29a-3p and hsa-miR-375-3p were up-regulated in type 2 DM plasma and involved in both beta-cell growth and function and insulin-mediated peripheral glucose uptake (9). Furthermore, in-vitro findings revealed that exosomal miR-29a-3p and miR-375-3p are secreted from organs associated with glucose metabolism to the circulatory system (Figure 2). Extracellular miRNA profiling found that plasma and serum had greater levels of hsa-miR-29a-3p. However, the expression levels of hsa-miR-375-3p varied according to the stage of type 2 DM (24). Higher expression levels were reported in the patients who were having poor glycemic control (25).
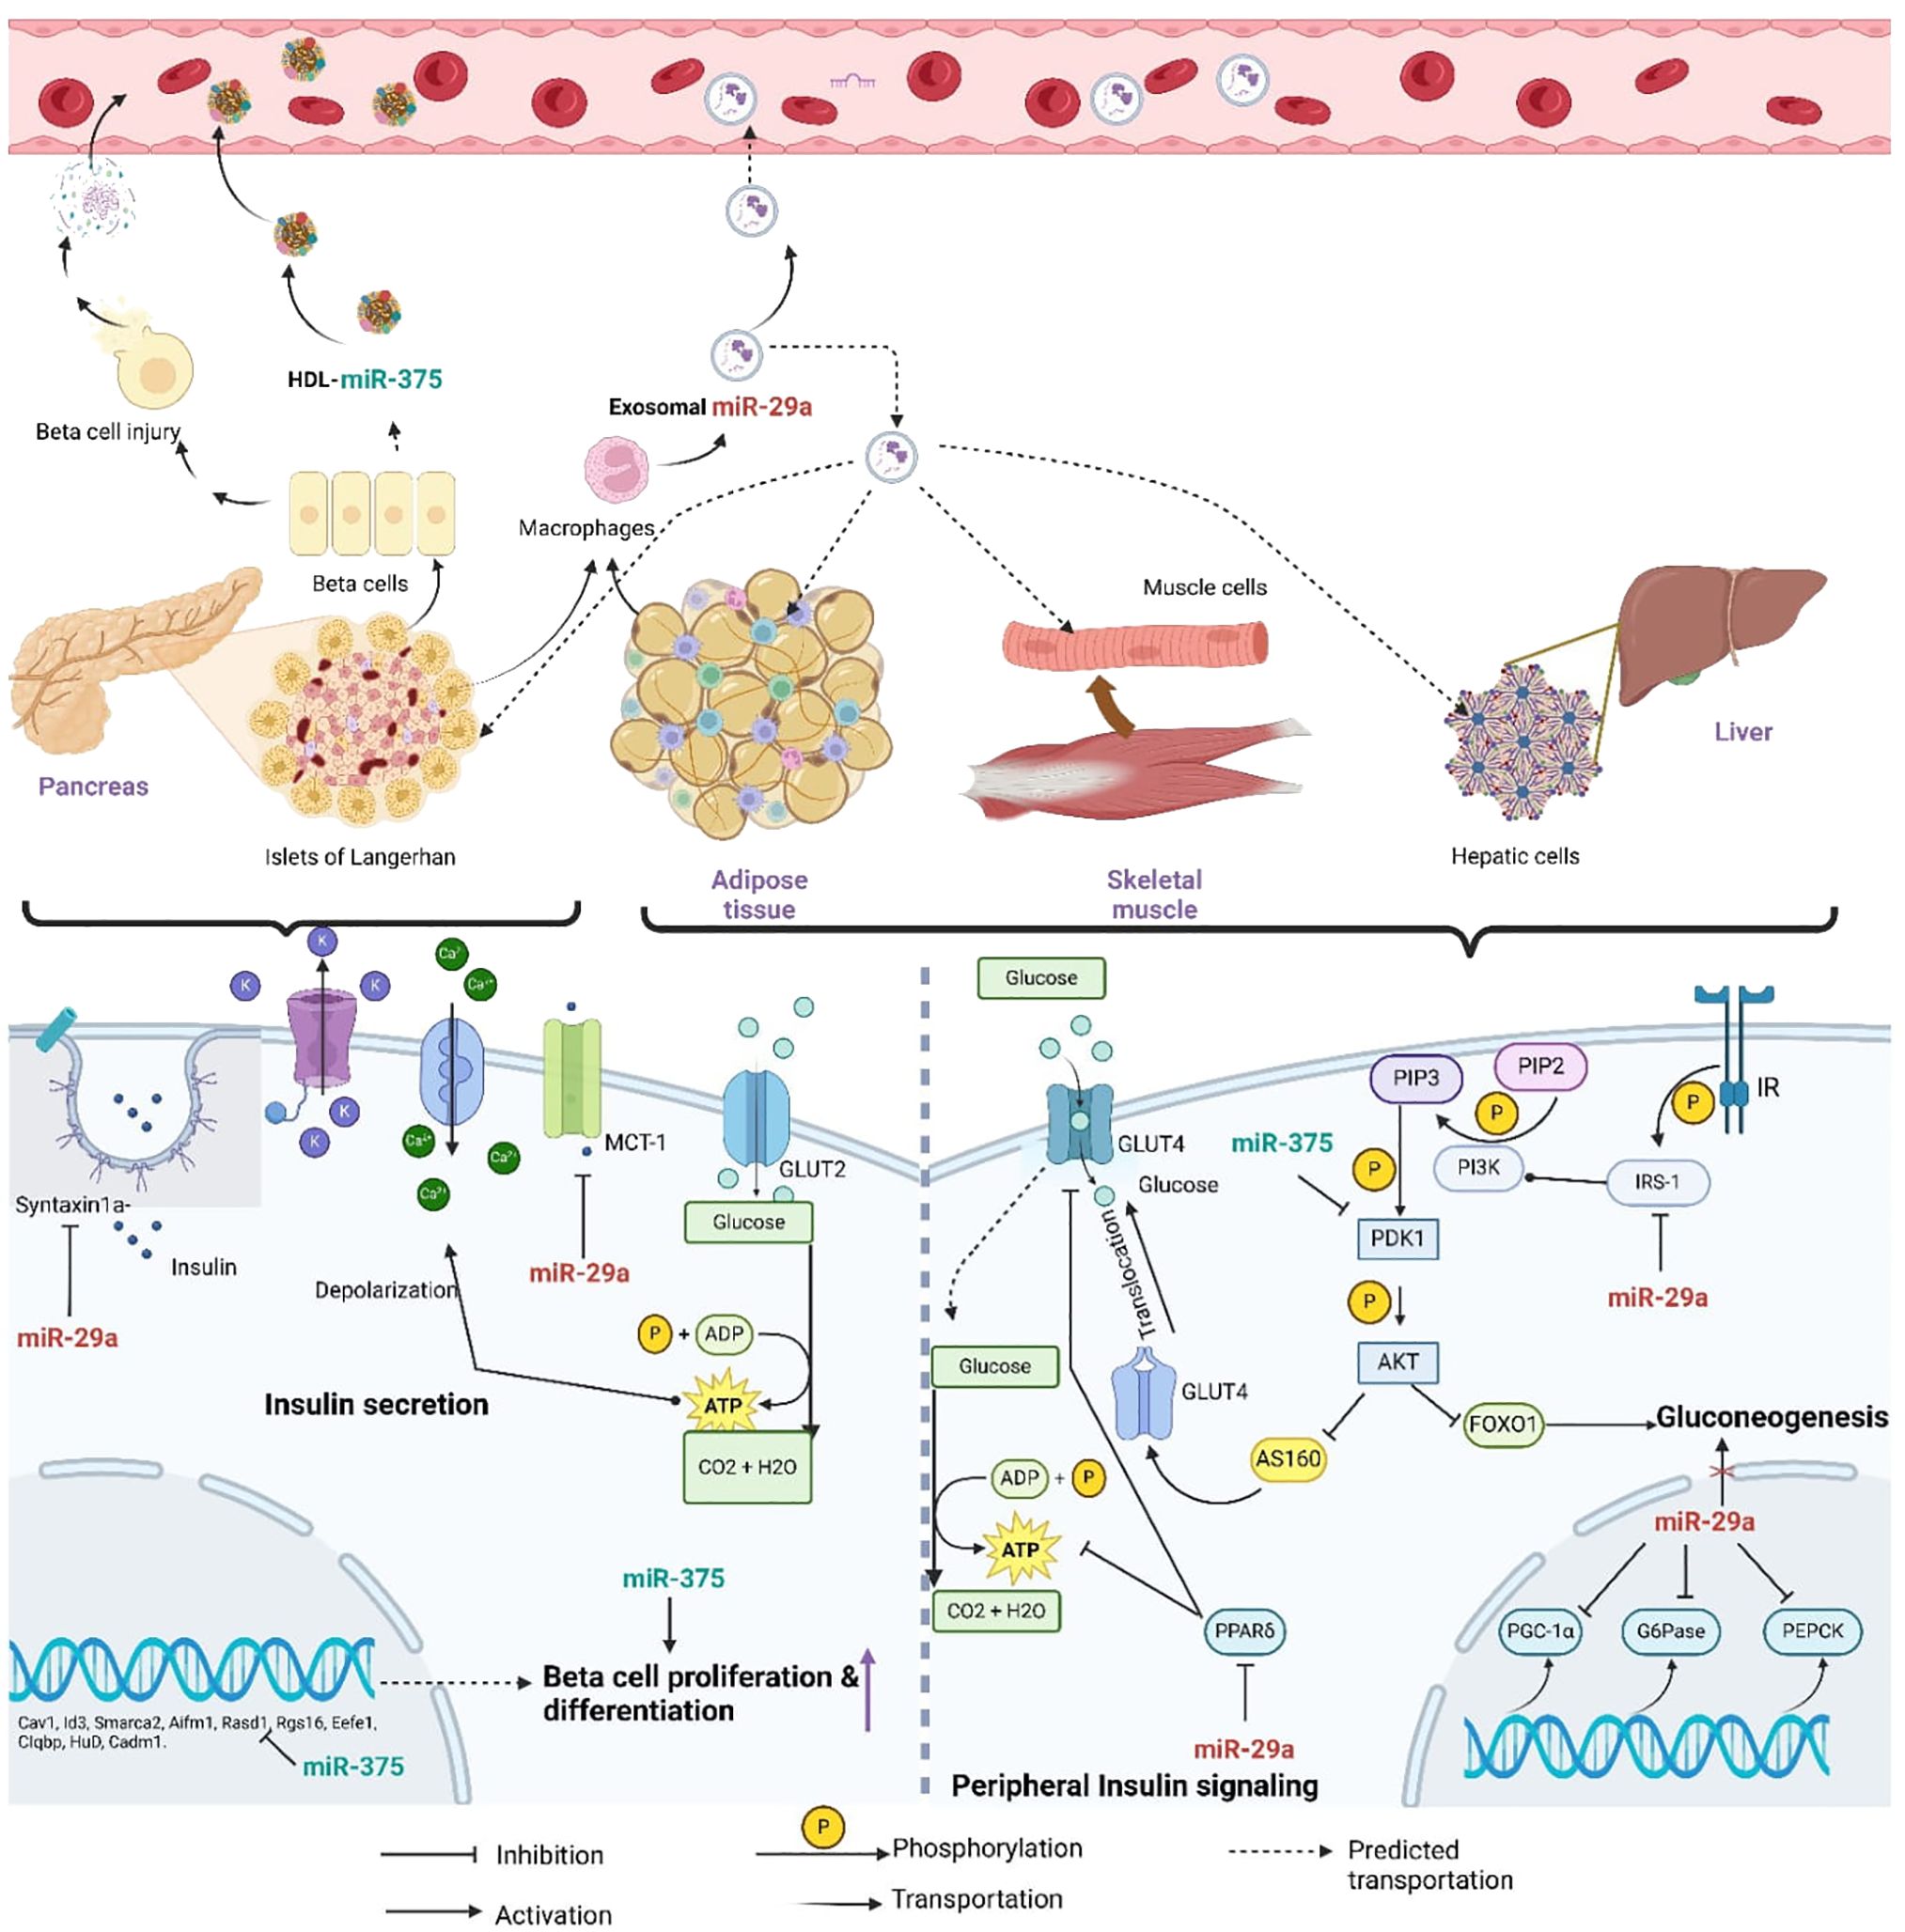
Figure 2. Diagram of the predicted mechanisms of horizontal transfer and the regulatory involvement of miR- 29a-3p and miR-375-3p in T2DM related molecular pathways (miR-29a, miR-29a-3p; miR-375, miR-375-3p; Syntaxin a, t-SNARE protein syntaxin -1A; MCT-1, Monocarboxylate transporter-1; GLUT2, Glucose transporter 2; GLUT4, Glucose transporter 04; ADP, Adinosine diphosphate; ATP, Adinosine triphosphate; PIP3, phosphaditylinositol triphosphate; PIP2, phosphaditylinositol bisphosphate; PI3K, phosphoinositide 3-kinase; IR, Insulin signaling receptor; IRS-1, Insulin receptor substrate; PDK1, AKT; serine/threonine kinase; PPAR, peroxisome-proliferator activated receptor δ; FOXO1, Forkhead box protein 1; PGC-1 α, peroxisome-proliferator receptor δ coactivator-1α; G6Pase, Glucose-6-phosphatase; PEPCK, Phosphoenolpyruvate carboxykinase).
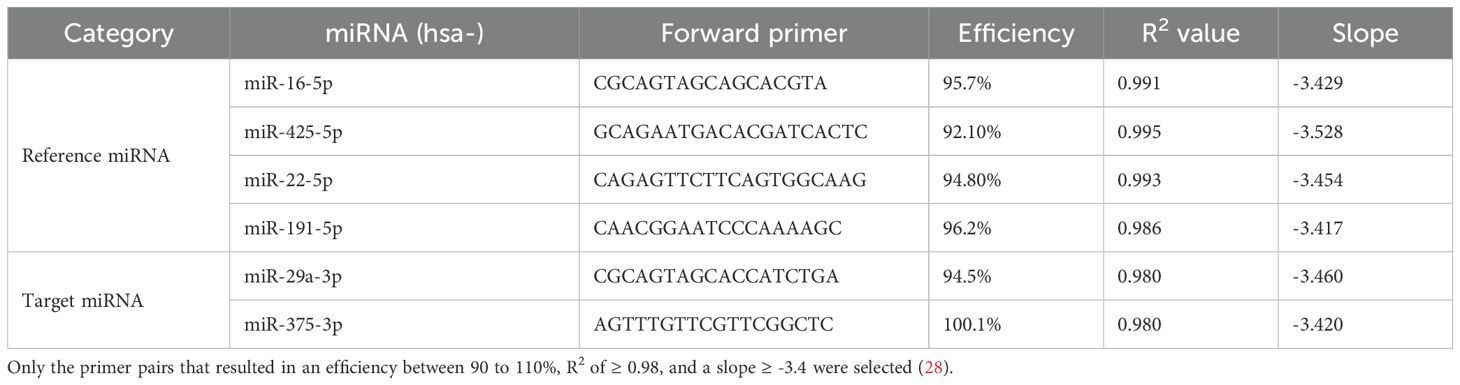
Table 1. Selected candidate reference miRNAs and the parameters of their optimization.
In-house primer designing and validation
Primers were designed using the miRPrimer software (26). From the primer pair options provided by the software, the best-ranked pair was selected. The specificity of the selected pair was pre-evaluated using the sequence search option on the miRBase website (27). Selected primers were commercially designed (Integrated DNA Technologies (IDT), USA) and validated by producing standard curves (Table 1). The primer pairs and the protocol which resulted in an efficiency between 90 to 110%, R2 of ≥ 0.98, and a slope ≥ -3.4 were selected for further analysis (28).
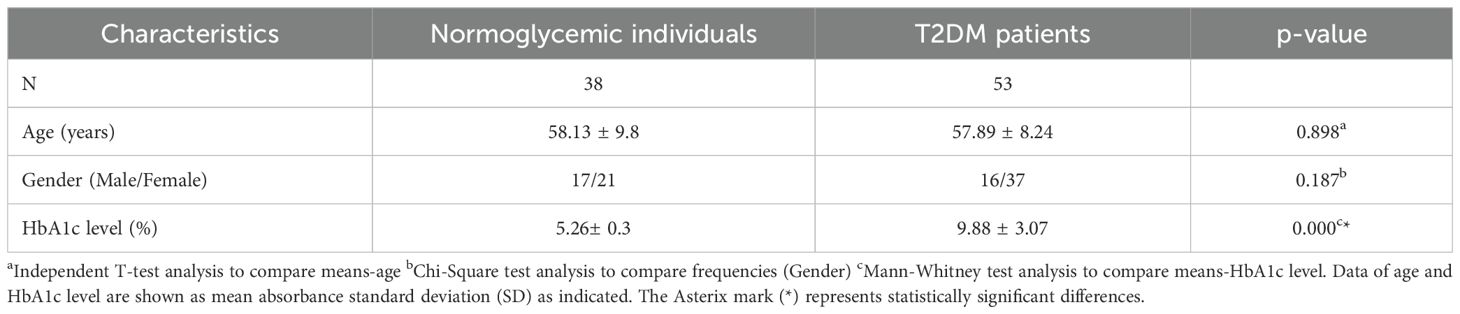
Table 2. Demographic characteristics of participants.
Statistical analysis
Raw Cq values were obtained from the Bio-Rad CFX Maestro 2.3 software (Version 5.3.022.1030) with baseline subtracted curve fit where the threshold was set at 10.0. The duplicates obtained per sample were averaged to get the mean Ct values. Demographic data were collected into a main database. All statistical evaluations were performed using SPSS Statistics Version 22 (SPSS Inc., Chicago, IL, USA) after the normality test. Probability values that were less than 0.05 were considered statistically significant. Graphical representations were generated using GraphPad Prism 8.0.1 (2018, Boston, MA). Kolmogorov-Smirnov and Shapiro-Wilk analyses were conducted to evaluate the normality of the data (Supplementary Table 3). After assessing the normality of the data, subsequent statistical analyses were chosen accordingly.
Analysis of the stability
GeNorm software, which was integrated into Bio-Rad CFX Maestro 2.3 software (Version 5.3.022.1030), and BestKeeper software (29) were employed to evaluate the stability of the miRNAs.
Analysis of the relative expression of selected target miRNAs
Relative miRNA expression of the selected miRNAs was determined by using hsa-miR-22-5p and hsa-miR-425-5p as RMs. The normoglycemic people were used as controls. The relative miRNA expression was calculated using CFX Maestro Software (Bio-Rad, USA) using the ΔΔCq method (30). The cut-off value of the FC was adjusted to 2.
Results
Recruitment of type 2 DM patients and normoglycemic individuals
Fifty-three (N = 53) non-hemolyzed plasma samples from type 2 DM were chosen to assess the stability in comparison to thirty-eight (N = 38) normoglycemic non-hemolyzed plasma samples (Figure 1, Supplementary Table 2). Total RNA was isolated from all the selected non-hemolyzed plasma.
Analysis of the statistical significance-Demographic data
Both age and gender data were normally distributed according to the Kolmogorov-Smirnov and Shapiro-Wilk analyses. The independent T-test showed no significant difference between the two groups in terms of their age (p ≥ 0.05). Chi-square (2 x 2) analysis showed that there was no significant association between the two samples in terms of gender (p≥0.05).
However, HbA1c data were not normally distributed (Supplementary Table 3). Thus, the Mann- Whitney test was conducted to evaluate the significance of the mean difference between type 2 DM patients and normoglycemic individuals. HbA1c levels of normoglycemic individuals were significantly lower compared to type 2 DM patients (Table 2, p ≤ 0.05).
Reference microRNA stability analysis of Type 2 DM patients compared to normoglycemic individuals
Analysis of statistical significance- quantitative PCR data
The independent t-test revealed no significant differences in baseline miRNA expression between type 2 DM patients and normoglycemic individuals for hsa-miR-425-5p, and hsa-miR-22-5p (p≥0.05, Table 3). The mean differences for hsa-miR-16-5p and hsa-miR-191-5p were significant (p ≤ 0.05, Table 3).
Reference microRNA stability analysis by Bestkeeper and GeNorm
Between type 2 DM patients and normoglycemic controls, the mean expressions of hsa-miR-16-5p and hsa-miR-191-5p expression varied significantly (Table 3). According to BestKeeper analysis, the SD values of the remaining hsa-miR-425-5p and hsa-miR-22-5p were 1.10 and 1.13 respectively (Table 3). Both miRNAs have a CV% of less than 10%. Additionally, Table 4 shows they had Correlation coefficient (r) values between 0.7 and 0.9. These r values were also significant (p ≤ 0.05). And power (x-fold) data of hsa-miR-425-5p and hsa-miR-22-5p were 1.55 and 1.59 respectively. According to GeNorm analysis, the hsa-miR-22-5p and hsa-miR-425-5p showed an average M value of 0.421. The miRNA with the lowest GM was hsa-miR-425-5p (GM=25.68), followed by hsa-miR-22-5p (GM = 29.85).
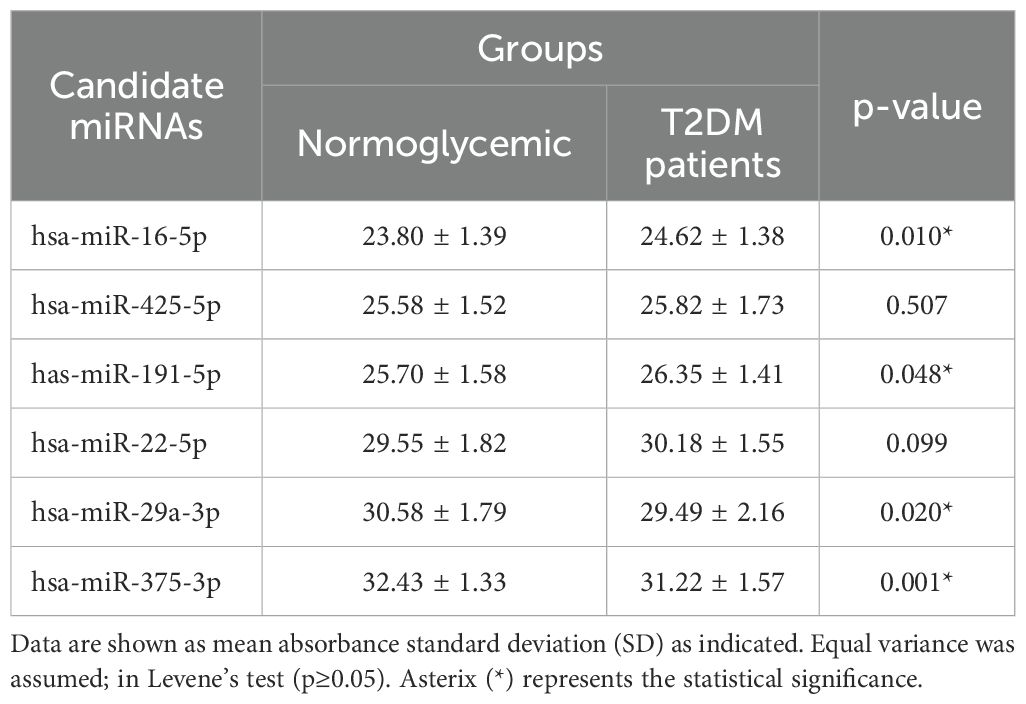
Table 3. Statistical distribution of Cq values in study participants.
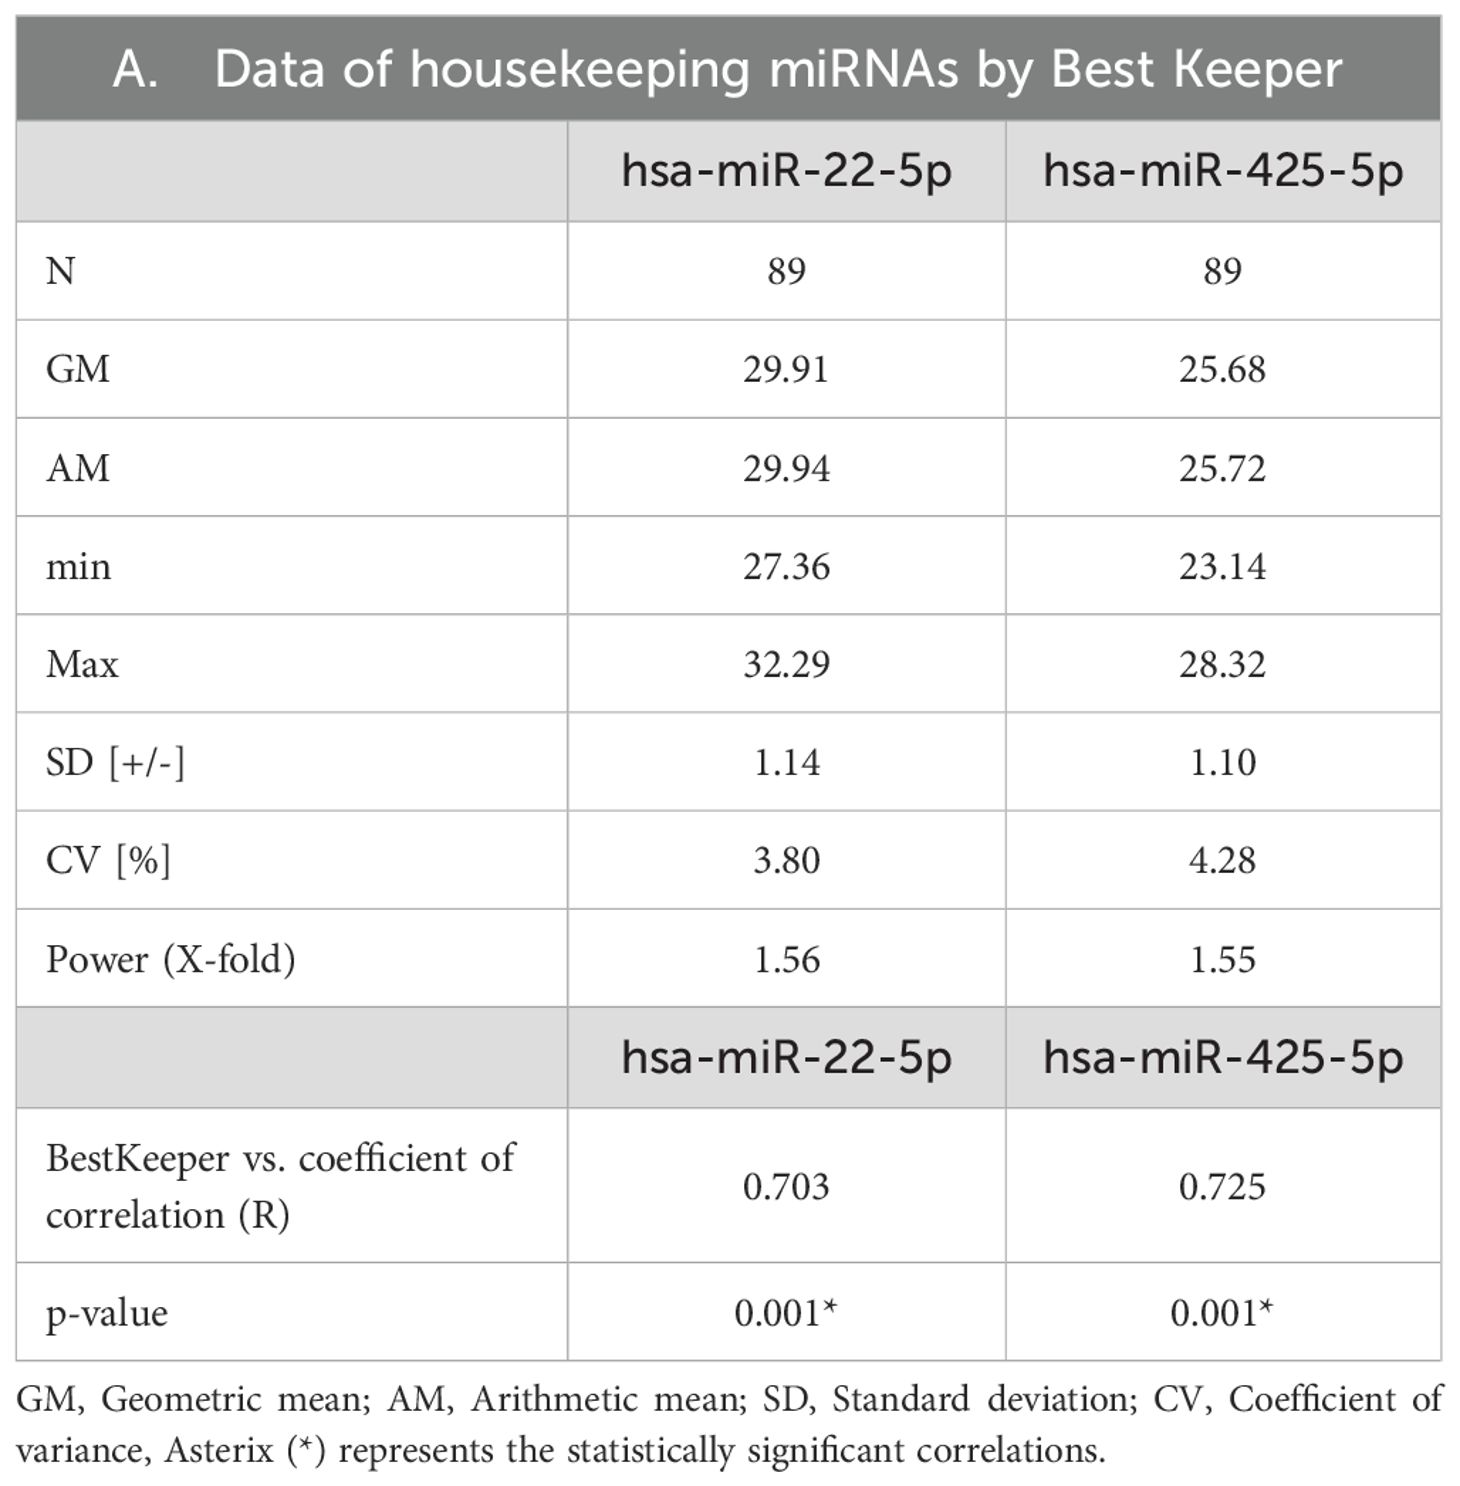
Table 4. Analysis of candidate reference miRNAs by BestKeeper application software.
Relative miRNA expression analysis of hsa-miR-29a-3p and hsa-miR-375-3p in Sri Lankan type 2 DM patients
Analysis of statistical significance- quantitative PCR data
Independent t-tests revealed significant changes in baseline miRNA expression between type 2 DM patients and normoglycemic individuals for hsa-miR-29a-3p and hsa-miR-375-3p (Table 3).
Relative expression analysis of selected target miRNAs
Type 2 DM patients had higher levels of hsa-miR-375-3p and hsa-miR-29a-3p than those who did not have diabetes (Figure 3). Hsa-miR-29a-3p and hsa-miR-375-3p were significantly upregulated with FCs of 2.76 and 3.28 respectively in type 2 DM patients compared to normoglycemic individuals (Figure 4).
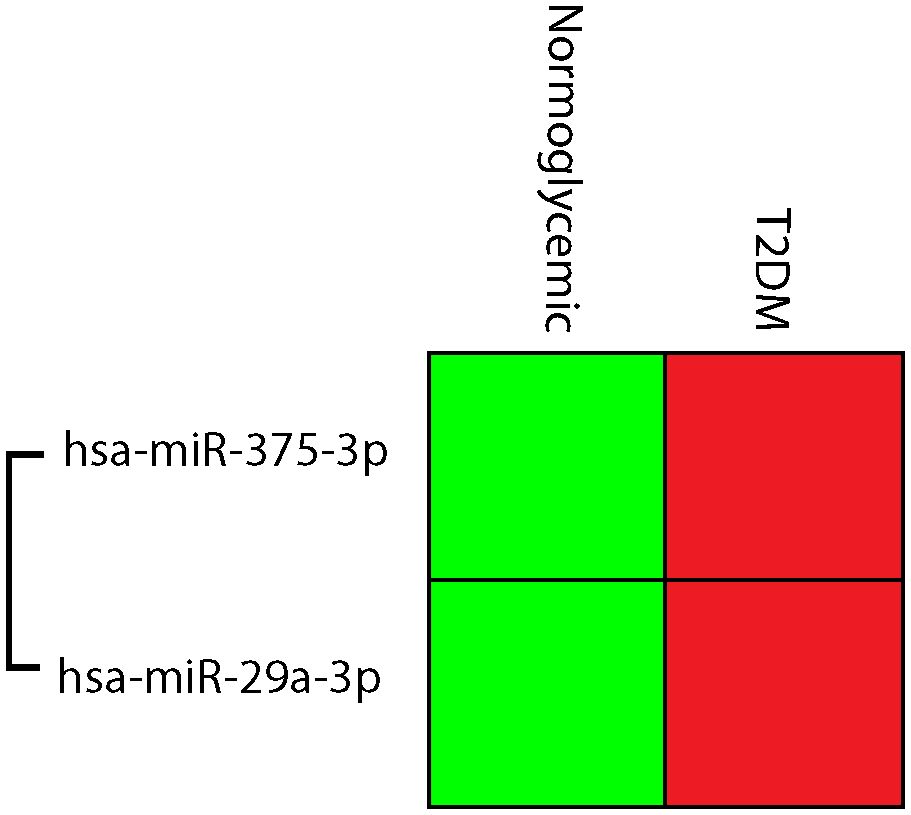
Figure 3. Cluster gram of normalized expressions; hsa-miR-375-3p, and hsa-miR-29a-3p, Relative higher normalized expression was indicated in red, while low normalized expressions were green.
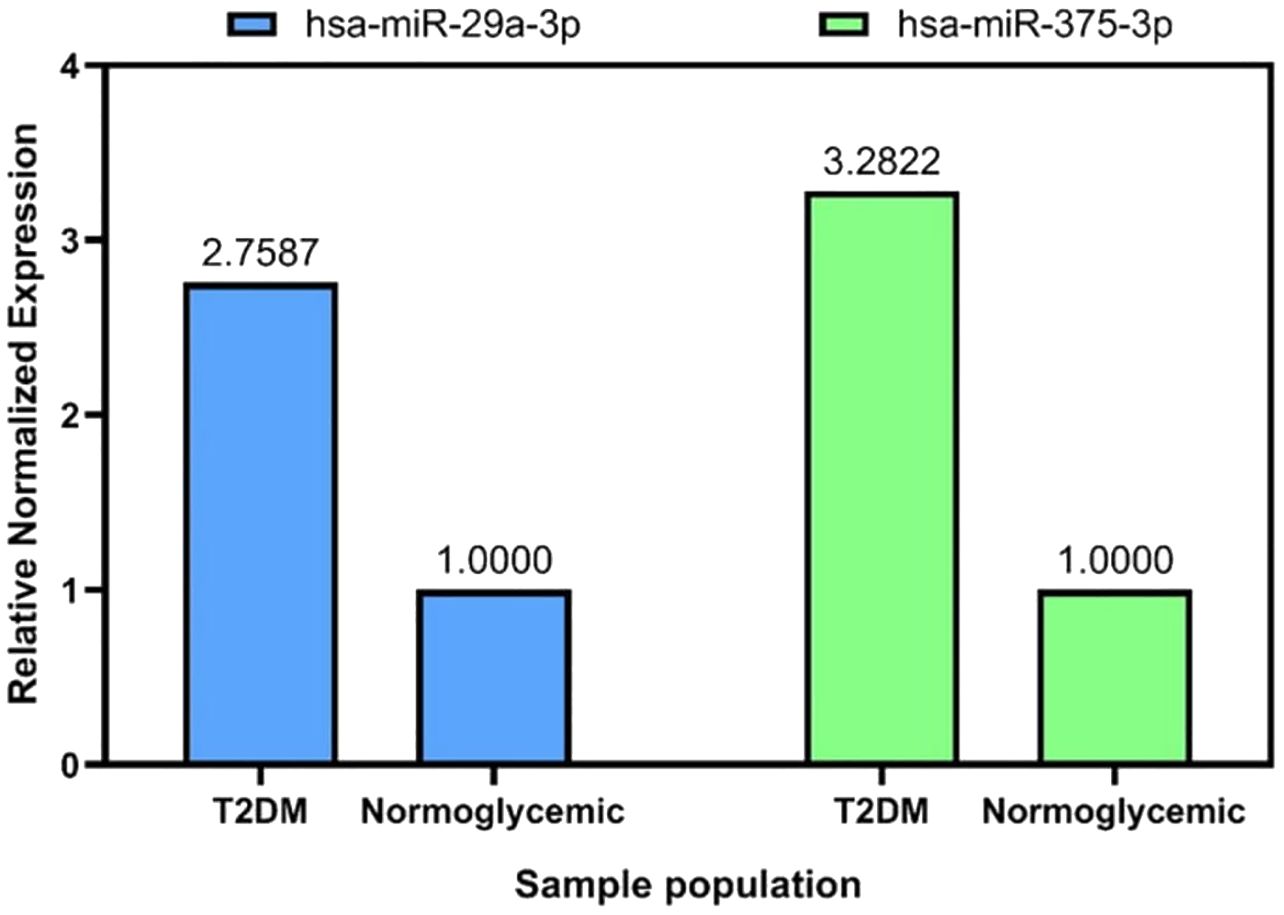
Figure 4. Relative miRNA expression of has-29a-3p, and has-miR-375-3p compared to normoglycemic individuals.
Discussion
Hsa-miR-425-5p and hsa-miR-22-5p were stable in Sri Lankan type 2 DM patients and normoglycemic individuals
Among hsa-miR-16-5p, hsa-miR-425-5p, hsa-miR-191-5p, and hsa-miR-22a-5p, the expression levels of hsa-miR-191-5p and hsa-miR-16-5p showed statistically significant variation between the two groups (Table 3, p ≤ 0.05). However, a stable RM should have consistent expression levels across all samples in an experiment regardless of the disease status, i.e., normoglycemic or type 2 DM (31). Therefore, we excluded the hsa-miR-16-5p and hsa-miR-191-5p from further analysis.
Consistent with our findings, the instability of hsa-miR-191-5p and hsa-miR-16-5p was confirmed by recent investigations. The most recent investigation done by Ramanjayaneya and colleagues showed that hsa-miR-191-5p was downregulated in the plasma of type 2 DM patients once hypoglycemia was induced. Thus, plasma hsa-miR-191-5p was related to glucose metabolism (32). Another recent study showed the potential role of miR-191 and arsenic-induced mice hepatic insulin resistance. This in-vivo experiment conducted on livers of C57BL/6J mice exhibited that miR-191 inhibited the IRS1/AKT pathway and GLUT4 translocation (33).
Furthermore, recent studies showed significant FC in the expressions of circulating hsa-miR-16-5p in type 2 DM patients compared to non-diabetic individuals. Most recently, a miRNA profile analysis conducted on Indian type 2 DM patients showed a 3.3-fold downregulation of hsa-miR-16-5p compared to non-diabetic control (34). A study between euglycemic people, patients with impaired fasting glucose and recently diagnosed to have type 2 DM revealed similar variance in serum hsa-miR-16-5p expressions (35). Another computational analysis conducted in 2023 identified hsa-miR-16-5p as one of the dysregulated circulating miRNAs in type 2 DM (36). Even though the pre-clinical studies, including animal models and computer analysis, provide similar findings, this community-based clinical trial offered a more direct and relevant evaluation regarding the instability of hsa-miR-191-5p and hsa-miR-16-5p further strengthening the results.
To evaluate the stability of the remaining RMs, BestKeeper and Genorm algorithms were employed. Both algorithms recommended that the hsa-miR-425-5p and hsa-miR-22-5p were stable. MiRNAs that had smaller SDs, CVs less than 10%, r values close to 1, and power (x-fold) values less than 2 were generally regarded as stable in BestKeeper (29). Both miRNAs fell into the recommended cut-off values of each BestKeeper matrix except SD values. The investigated miRNAs had marginally increased SDs than the recommended value of 1 (37). Since the resulting SDs were close to 1 and other matrices (CV, r, and Power) provided acceptable values, further evaluation was conducted with GeNorm analysis. GeNorm provides a stability value (M) for each miRNA. Generally, if the M ≤ 1.5, the corresponding miRNA is considered stable (38). GeNorm identified both hsa-miR-425-5p and hsa-miR-22-5p miRNAs were under the acceptable range to consider them stable.
Unpresidently, our study found that hsa-miR-425-5p and hsa-miR-22-5p were stable in type 2 DM patients and normoglycemic individuals. However, a recent publication by Liu et al. reported that serum hsa-miR-425-5p level exhibited a gradual increment in the healthy control group, DM patients without DR, and DR patients (39). Therefore, they have suggested hsa-miR-425-5p as the potential prognostic miRNA for DR (39). Interestingly, the miRNA expression changes were minimal between healthy controls and DM without DR, but greater between healthy controls and those with DR. Importantly, our study evaluated the stability between normoglycemic vs type 2 DM. Furthermore, this discrepancy could be due to the reference (U6) which was used for normalization in Liu’s experiment. U6 was a non-coding RNA that was suggested to be unstable among type 2 DM patients and patients with DR (31). Nonetheless, the comparatively larger sample size in our study offered more reliability and validity for our findings.
However, these contrasting findings warrant further research to elucidate the plasma expression of hsa-miR-425-5p in type 2 DM against normoglycemic individuals. In addition, no prior research was found that examined the plasma expression levels of hsa-miR-22-5p in type 2 DM patients.
Hsa-miR-29a-3p and hsa-miR-375-3p were highly expressed in Sri Lankan type 2 DM patients
Hsa-miR-29a-3p and hsa-miR-375-5p were two main miRNAs that were differentially expressed in type 2 DM populations. Both miRNAs were elevated in Sri Lankan type 2 DM patients compared to normoglycemic individuals when normalized using stable miRNAs hsa-miR-425-5p and hsa-miR-22-5p.
Previous studies on plasma and serum revealed an elevated level of hsa-miR-29a-3p, which was consistent with our findings. According to a meta-analysis published in 2015, miR-29a was the most often reported and elevated miRNA in the circulation of all examined miRNA profiling studies on type 2 DM patients (N=10) (9). MiR-29a-3p was shown to be consistently elevated in type 2 DM patients and even highly expressed in prediabetic people (40). Overweight women tend to have decreased levels of miR-29a-3p, if treated with metformin to improve their hepatic insulin sensitivity (41). In type 2 DM patients, serum miR-29a-3p levels were considerably greater than in healthy persons whereas the relative concentration of miR-29a was determined using miR2911 as a reference. The average relative concentration of miR-29a in healthy people was 11.30 nmol/L, whereas in type 2 DM patients it was 20.66 nmol/L (42). Obese women with early gestational DM (GDM) had higher miR-29a-3p levels, indicating a direct relationship between miR-29a-3p overexpression and impaired glucose metabolism (43).
Importantly, the suggested regulatory role of miR-29a-3p was in line with the observed expression patterns. As elaborated in Figure 2, intercellularly elevated miR-29a-3p relates to pancreatic beta-cell insulin secretion, beta-cell inflammation, and insulin signaling pathways (44–47). Further, it has been postulated that exosomal miR-29a could be produced by macrophages associated with adipose tissues (48). Exosomes secreted by macrophages present in the adipose tissues were found to have a higher amount of miR-29a. This exosomal miR-29a transfers into nearby adipocytes, myocytes, and hepatocytes to induce insulin resistance (49).
On the other hand, previous findings on the plasma expression level of hsa-miR-375-3p in type 2 DM patients were less conclusive. Some studies found that miR-375 was increased in type 2 DM patients compared to normoglycemic persons, while others found the opposite or no significant difference. Zhu et al. revealed that it was the most highly elevated miRNA in examined human profiling investigations (9). Similar findings were published in 2014, where serum concentrations of miR-375 were five times greater in type 2 DM patients than in individuals with normal glucose tolerance (50). Significant upregulation of hsa-miR-375-3p was found in the serum of newly diagnosed type 2 DM patients compared to normoglycemic individuals who were susceptible to type 2 DM. Interestingly, in that study, the expression level of hsa-miR-375 was similar in individuals with impaired fasting glucose and normoglycemic individuals (51). However, overexpression of miR-375-3p in the type 2 DM circulatory system was confirmed by in vitro and in vivo investigations (24).
In contrast, a clinical study indicated that, when compared to patients with normal glucose tolerance, plasma expressions of miR-375 were downregulated in patients with impaired glucose tolerance but raised in patients with type 2 DM (25). Similarly, a recent investigation suggested that hsa-miR-375-3p was significantly downregulated in the plasma of newly diagnosed type 2 DM patients, and type 2 DM susceptible subjects compared to healthy controls (52). However, the underlying explanation for this discrepancy has yet to be resolved.
MiR-375-3p promotes beta-cell growth and function (24). When beta-cells were stressed or died, miR-375-3p was released into the bloodstream. As a result, greater levels of miR-375-3p might serve as a marker for beta-cell damage (Figure 2). According to the literature, beta-cell damage in type 2 DM occurred gradually, beginning in the early stages (53, 54). Therefore, we may assume that the miR-375-3p expression may depend on which stage the studied population was in throughout the experiment. However, the higher expression level of hsa-miR-375-3p in our work was highly supported by the proposed regulatory role of miR-375-3p in type 2 DM. MiR-375 has been vastly experimented with for its regulatory role in beta-cell proliferation due to its high expression in human pancreatic islet development (24, 55) (Figure 2).
However, methodological differences could be one of the causes for the inconsistent findings related to miR-375. Previous studies that evaluated plasma had not reported their hemolysis status although the miR-375 level in plasma was extremely vulnerable to hemolysis (25, 52). In contrast, only the non-hemolyzed plasma samples were evaluated in our experiment. Validated RMs were utilized to explore the relative expression. Furthermore, our tested type 2 DM patients had poor glycemic control (Mean HbA1c level = 9.88+/-3.07). Furthermore, the higher expression level of hsa-miR-375-3p in our work was highly supported by the proposed regulatory role of miR-375-3p in type 2 DM. Furthermore, the results of the relative expression depend on the reference control used (56). Some of the RMs employed in the stated studies were not verified and demonstrated to have a regulatory effect on type 2 DM, i.e., miR-191-5p (32, 52). For hsa-miR-375-5p, despite prior inconsistencies, our improved methodology revealed upregulation, aligning with its proposed role in type 2 DM development.
While this study paved the way for future investigations offering promising results, it is important to acknowledge the limitations of the study. One of the limitations was the hemolysis that restricted the sample sizes. Mostly improper venipuncture and forceful aspiration of blood would cause hemolysis (57). However, given the involvement of trained nurses in blood collection, observed hemolysis due to improper technique was unlikely, yet could not be entirely excluded. The storage time of plasma and mechanical disruption due to transportation would cause hemolysis (58). However, compared to previous validation studies, we managed to achieve a comparable sample size in terms of patients and controls (Supplementary Table 1) (31, 59, 60). During this experiment, DNase treatment was not conducted for the extracted RNA. The serum/plasma contains very low levels of DNA. Furthermore, the extracted RNA contains very low levels of miRNAs. Thus, the DNase treatment could reduce the miRNA yield (61). The convenient sampling method that was used for selecting participants with normal blood sugar levels would limit the generalizability of the findings to the entire normoglycemic of Sri Lanka. Thus, more related investigations for broader representative samples are recommended in the future to establish the validity of these RMs further to the Sri Lankan type 2 DM population.
Conclusion
To conclude, the human plasma expressions of hsa-miR-425-5p and hsa-miR-22-5p were stable in both type 2 DM patients and normoglycemic individuals in Sri Lanka. This study represents a novel contribution to the understanding of stable miRNAs in type 2 DM patients. While the lack of research underscores the need for further exploration, this study on the stability of hsa-miR-425-5p and hsa-miR-22-5p offers valuable groundwork for future investigations about stable miRNAs in type 2 DM plasma. Higher expression of hsa-miR-29a-3p and hsa-miR-375-3p was present in type 2 DM patients compared to normoglycemic individuals in Sri Lanka. Future studies will have to apply replications with balanced and matched cohorts to verify the identified miRNAs as T2DM diagnostic markers. Logistic regression and Area under the curve analysis should be employed in the inclusion to quantify diagnostic performance and compare against standard blood glucose assays. Supplemental analysis has to be applied to strengthen discoveries and increase the clinical application of the identified miRNAs.
Data availability statement
The original contributions presented in the study are included in the article/Supplementary Material, further inquiries can be directed to the corresponding author/s.
Ethics statement
The studies involving humans were approved by Ethics Review Committee, Faculty of Medicine, University of Colombo. The studies were conducted in accordance with the local legislation and institutional requirements. The participants provided their written informed consent to participate in this study.
Author contributions
PP: Conceptualization, Investigation, Writing – original draft. BM: Data curation, Investigation, Writing – review & editing. JP: Funding acquisition, Project administration, Writing – review & editing. WD: Funding acquisition, Project administration, Writing – review & editing. SY: Methodology, Resources, Software, Supervision, Writing – review & editing. WH: Methodology, Supervision, Writing – review & editing. AD: Funding acquisition, Investigation, Project administration, Resources, Writing – review & editing. IHR: Project administration, Resources, Supervision, Writing – review & editing. PK: Data curation, Investigation, Resources, Supervision, Writing – review & editing. US: Funding acquisition, Project administration, Validation, Writing – review & editing. DS: Conceptualization, Investigation, Methodology, Supervision, Writing – review & editing, Funding acquisition.
Funding
The author(s) declare that financial support was received for the research and/or publication of this article. The research was funded by the World Bank under the project AHEAD/DOR/STEM+HEMS No78 project.
Conflict of interest
The authors declare that the research was conducted in the absence of any commercial or financial relationships that could be construed as a potential conflict of interest.
Generative AI statement
The author(s) declare that no Generative AI was used in the creation of this manuscript.
Publisher’s note
All claims expressed in this article are solely those of the authors and do not necessarily represent those of their affiliated organizations, or those of the publisher, the editors and the reviewers. Any product that may be evaluated in this article, or claim that may be made by its manufacturer, is not guaranteed or endorsed by the publisher.
Supplementary material
The Supplementary Material for this article can be found online at: https://www.frontiersin.org/articles/10.3389/fendo.2025.1554827/full#supplementary-material
Glossary
3’-UTR: 3 ends untranslated region
5’UTR: 5 end untranslated region
AD: Alzheimer’s Disease
ADA: American Diabetes Association
ADP: Adenosine diphosphate
AKT: Serine/threonine kinase
AM: Arithmetic mean
ATP: Adenosine triphosphate
cDNA: Complementary DNA
Cq: Quantitative cycles
CV: Coefficient of variance
DLBCL: Diffuse Large B-cell lymphoma
DM: Diabetes mellitus
FOXO1: Forkhead box protein 1
G6Pase: Glucose-6-phosphatase
GLUT2: Glucose transporter 2
GLUT4: Glucose transporter 4
GM: Geometric mean
HbA1c: Glycated hemoglobin 1c
HF: Heart failure
hsa-: Homo sapiens
IDT: Integrated DNA Technologies
IFCC: International Federation of Clinical Chemistry
INSR: Insulin signaling receptor
IRS-1: Insulin receptor substrate
IS: Insulin signaling
LTBI: Latent Tuberculosis infection
MCI: Mild Cognitive Impairment
MCT-1: Monocarboxylate transporter-1
miRNA: microRNA
mRNA: messenger RNA
NC-RNA: Non-coding RNA
NCLC: Non-small cell lung carcinoma
NGSP: National Glycohemoglobin Program
NHSL: National Hospital of Sri Lanka
PD: Pyruvate dehydrogenase kinase 1
PEPCK: Phosphoenolpyruvate carboxykinase
PI3K: Phosphoinositide 3-kinase
PIP2: Phosphatidylinositol bisphosphate
PIP3: Phosphatidylinositol triphosphate
PPAR: Peroxisome proliferator-activated receptor δ
PGC-1ὰ: Peroxisome proliferator receptor δ coactivator-1α
RG: Reference gene
RM: Reference microRNA
RT-qPCR: Real-time quantitative polymerase chain reaction
SD: Standard deviation
Syntaxin 1a: t-SNARE protein syntaxin-1A
TB: Tuberculosis
VC: Vulvar squamous carcinoma
VINL: Vulvar intraepithelial neoplasia lesions
WHO: World Health Organization
References
1. Ye J, Wu Y, Yang S, Zhu D, Chen F, Chen J, et al. The global, regional and national burden of type 2 diabetes mellitus in the past, present and future: a systematic analysis of the Global Burden of Disease Study 2019. Front Endocrinol. (2023) 14:1192629. doi: 10.3389/fendo.2023.1192629
3. Akhtar S, Ali A, Asghar M, Hussain I, and Sarwar A. Prevalence of type 2 diabetes and pre-diabetes in Sri Lanka: A systematic review and meta-analysis. BMJ Open. (2023) 13:1–8. doi: 10.1136/bmjopen-2022-068445
4. O'Brien J, Hayder H, Zayed Y, and Peng C. Overview of microRNA biogenesis, mechanisms of actions, and circulation. Front Endocrinol. (2018) 9:402. doi: 10.3389/fendo.2018.00402
5. Bartel DP. MicroRNAs: genomics, biogenesis, mechanism, and function. Cell. (2004) 116:281–97. doi: 10.1016/S0092-8674(04)00045-5
6. Ozougwu O. The pathogenesis and pathophysiology of type 1 and type 2 diabetes mellitus. J Physiol Pathophysiology. (2013) 4:46–57. doi: 10.5897/jpap2013.0001
7. Zhang Y, Sun X, Icli B, and Feinberg MW. Emerging roles for microRNAs in diabetic microvascular disease: Novel targets for therapy. Endocrine Rev. (2017) 38:145–68. doi: 10.1210/er.2016-1122
8. Saliminejad K, Khorram Khorshid HR, Soleymani Fard S, and Ghaffari SH. An overview of microRNAs: Biology, functions, therapeutics, and analysis methods. J Cell Physiol. (2019) 234(5):5451–65.
9. Zhu H and Leung SW. Identification of microRNA biomarkers in type 2 diabetes : a meta-analysis of controlled profiling studies. Diabetologia. (2015) 58:900–11. doi: 10.1007/s00125-015-3510-2
10. Kozera B and Rapacz M. Reference genes in real-time PCR. J Appl Genet. (2013) 54:391–406. doi: 10.1007/s13353-013-0173-x
11. Schwarzenbach H, Da Silva AM, Calin G, and Pantel K. Data normalization strategies for microRNA quantification. Clin Chem. (2015) 61:1333–42. doi: 10.1373/clinchem.2015.239459
12. Silver N, Best S, Jiang J, and Thein SL. Selection of housekeeping genes for gene expression studies in human reticulocytes using real-time PCR. BMC Mol Biol. (2006) 7:1–9. doi: 10.1186/1471-2199-7-33
13. Chervoneva I, Li Y, Schulz S, Croker S, Wilson C, Waldman SA, et al. Selection of optimal reference genes for normalization in quantitative RT-PCR. BMC Bioinf. (2010) 11:1–15. doi: 10.1186/1471-2105-11-253
14. Dakterzada F, Targa A, Benı́tez ID, Romero-ElKhayat L, de Gonzalo-Calvo D, Torres G, et al. Identification and validation of endogenous control miRNAs in plasma samples for normalization of qPCR data for Alzheimer’s disease. Alzheimer’s Res Ther. (2020) 12:1–8. doi: 10.1186/s13195-020-00735-x
15. Hu Z, Dong J, Wang LE, Ma H, de Liu J, Zhao Y, et al. Serum microRNA profiling and breast cancer risk: The use of miR-484/191 as endogenous controls. Carcinogenesis. (2012) 33:828–34. doi: 10.1093/carcin/bgs030
16. Faraldi M, Gomarasca M, Banfi G, and Lombardi G. Free circulating miRNAs measurement in clinical settings: the still unsolved issue of the normalization. Adv Clin Chem. (2018) 87:113–39. doi: 10.1016/bs.acc.2018.07.003
17. Edirithilake T, Nanayakkara N, Lin XX, Biggs PJ, Chandrajith R, Lokugalappatti S, et al. Urinary microRNA analysis indicates an epigenetic regulation of chronic kidney disease of unknown etiology in Sri Lanka. MicroRNA. (2023) 12:156–63. doi: 10.2174/2211536612666230202152932
18. Ubhayawardana DLNL, Nisansala GGT, Arachchi PS, Rajakaruna K, and Wanigasekera DK. Circulating micro RNA 21 levels in gastric cancer patients in Sri Lanka and role of helicobacter pylori as a risk for development of gastric cancer. Diagn Tech Biomed Anal. (2020) 9(1):1–4.
19. WHO Guidelines Approved by the Guidelines Review Committee. Use of glycated haemoglobin (HbA1c) in the diagnosis of diabetes mellitus: abbreviated report of a WHO consultation. Geneva: World Health Organization (2011).
20. American Diabetes Association Professional Practice Committee. Introduction and methodology: Standards of Care in Diabetes—2024. Diabetes Care. (2024) 47(Suppl. 1):S1–4.
21. Glinge C, Clauss S, Boddum K, Jabbari R, Jabbari J, Risgaard B, Tomsits P, et al. Stability of circulating blood-based microRNAs-Pre-Analytic methodological considerations. PloS One. (2017) 12:1–16. doi: 10.1371/journal.pone.0167969
22. Kirschner MB, Kao SC, Edelman JJ, Armstrong NJ, Vallely MP, van Zandwijk N, et al. Haemolysis during sample preparation alters microRNA content of plasma. Sci RepPloS One. (2011) 6(9):e24145.
23. Oliveira SP. Novel Excipient Candidates for RNA Stabilization. Portugal: Universidade da Beira Interior (2021).
24. Poy MN, Hausser J, Trajkovski M, Braun M, Collins S, Rorsman P, et al. miR-375 maintains normal pancreatic α- and β-cell mass. Proc Natl Acad Sci United States America. (2009) 106:5813–8. doi: 10.1073/pnas.0810550106
25. Wang X, Chang X, Li J, Yin L, and Sun K. DNA methylation of microRNA-375 in impaired glucose tolerance. Exp Ther Med. (2014) 8:775–80. doi: 10.3892/etm.2014.1816
26. Busk PK. A tool for design of primers for microRNA-specific quantitative RT-qPCR. BMC Bioinf. (2014) 15:1–9. doi: 10.1186/1471-2105-15-29
27. Kozomara A, Birgaoanu M, and Griffiths-Jones S. MiRBase: From microRNA sequences to function. Nucleic Acids Res. (2019) 47:D155–62. doi: 10.1093/nar/gky1141
28. Bustin SA, Benes V, Garson JA, Hellemans J, Huggett J, Kubista M, et al. The MIQE guidelines: Minimum information for publication of quantitative real-time PCR experiments. Clin Chem. (2009) 55:611–22. doi: 10.1373/clinchem.2008.112797
29. Pfaffl MW, Tichopad A, Prgomet C, and Neuvians TP. Determination of stable housekeeping genes, differentially regulated target genes and sample integrity: BestKeeper–Excel-based tool using pair-wise correlations. Biotechnol Lett. (2004) 26:509–15. doi: 10.1023/b:bile.0000019559.84305.47
30. Derveaux S, Vandesompele J, and Hellemans J. How to do successful gene expression analysis using real-time PCR. Methods. (2010) 50(4):227–30.
31. Prado MSG, de Goes TC, de Jesus ML, Mendonça LSO, Nascimento J, and Kaneto CM. Identification of miR-328-3p as an endogenous reference gene for the normalization of miRNA expression data from patients with Diabetic Retinopathy. Sci Rep. (2019) 9:1–8. doi: 10.1038/s41598-019-56172-w
32. Ramanjaneya M, Bettahi I, Pawar K, Halabi NM, Moin ASM, Sathyapalan T, et al. MicroRNA Changes Up to 24 h following Induced Hypoglycemia in Type 2 Diabetes. Int J Mol Sci. (2022) 23:1–17. doi: 10.3390/ijms232314696
33. Li W, Wu L, Sun Q, Yang Q, Xue J, Shi M, et al. MicroRNA-191 blocking the translocation of GLUT4 is involved in arsenite-induced hepatic insulin resistance through inhibiting the IRS1/AKT pathway. Ecotoxicol Environ Saf. (2021) 1:112130. doi: 10.1016/j.ecoenv.2021.112130
34. Sambashivaiah S, Priyanka A, Nimbalkar V, Snijesh VP, and Prabhu J. Detection of differentially expressed circulating micro-RNA among Indians with Type 2 Diabetes using a global expression profile and systematic analysis. Biomedicine (India). (2023) 43:1302–8. doi: 10.51248/.v43i4.3029
35. Greco M, Mirabelli M, Salatino A, Accattato F, Aiello V, Brunetti FS, et al. From Euglycemia to Recent Onset of Type 2 Diabetes Mellitus: A Proof-of-Concept Study on Circulating microRNA Profiling Reveals Distinct and Early microRNA Signatures. Diagnostics. (2023) 13:1–17. doi: 10.3390/diagnostics13142443
36. Alamro H, Bajic V, Macvanin MT, Isenovic ER, Gojobori T, Essack M, et al. Type 2 Diabetes Mellitus and its comorbidity, Alzheimer’s disease: Identifying critical microRNA using machine learning. Front Endocrinol. (2023) 13:1084656. doi: 10.3389/fendo.2022.1084656
37. Korma W, Mihret A, Tarekegn A, Chang Y, Hwang D, Tessema TS, et al. Identification of circulating miR-22-3p and miR-93-5p as stable endogenous control in tuberculosis study. Diagnostics. (2020) 10(11):p.868. doi: 10.3390/diagnostics10110868
38. Vandesompele J, De Preter K, Pattyn F, Poppe B, Van Roy N, De Paepe A, et al. Accurate normalization of real-time quantitative RT-PCR data by geometric averaging of multiple internal control genes. Genome Biol. (2002) 3:1–12. doi: 10.1186/gb-2002-3-7-research0034
39. Liu X, Zhou Y, Liu Y, Wang Q, and Pan L. MicroRNA-425-5p is involved in the development of diabetic retinopathy and regulates the proliferation and migration of retinal microvascular endothelial cells. Opthalmology. (2022) 65:60–7. doi: 10.1159/000516906
40. Villard A, Marchand L, Thivolet C, and Rome S. Diagnostic value of cell-free circulating microRNAs for obesity and type 2 diabetes: a meta-analysis. J Mol Biomark Diagn. (2015) 6(6):251. doi: 10.4172/2155-9929.1000251.Diagnostic
41. Udesen PB, Glintborg D, Sørensen AE, Svendsen R, Nielsen NLS, Wissing MLM, et al. Metformin decreases miR-122, miR-223, and miR-29a in women with polycystic ovary syndrome. Endocr Connect. (2020) 9:1075–84. doi: 10.1530/EC-20-0195
42. Liu Q, Wang M, Xu T, Liang W, and Yang F. Significance of serum miR-29a in the occurrence and progression of diabetic nephropathy: A cross-sectional study. J Clin Lab Anal. (2022) 36:1–8. doi: 10.1002/jcla.24210
43. Sørensen AE, van Poppel MN, Desoye G, Damm P, Simmons D, Jensen DM, et al. The predictive value of mir-16,-29a and-134 for early identification of gestational diabetes: A nested analysis of the dali cohort. Cells. (2021) 10:1–16. doi: 10.3390/cells10010170
44. Massart J, Sjögren RJ, Lundell LS, Mudry JM, Franck N, O’Gorman DJ, et al. Altered miR-29 expression in type 2 diabetes influences glucose and lipid metabolism in skeletal muscle. Diabetes. (2017) 66:1807–18. doi: 10.2337/db17-0141
45. Zhou Y, Gu P, Shi W, Li J, Hao Q, Cao X, et al. MicroRNA-29a induces insulin resistance by targeting PPARδ in skeletal muscle cells. Int J Mol Med. (2016) 37(4):931–8.
46. Yang WM, Jeong HJ, Park SY, and Lee W. Induction of miR-29a by saturated fatty acids impairs insulin signaling and glucose uptake through translational repression of IRS-1 in myocytes. FEBS Lett. (2014) 588(13):2170–6.
47. Liang J, Liu C, Qiao A, Cui Y, Zhang H, Cui A, et al. MicroRNA-29a-c decrease fasting blood glucose levels by negatively regulating hepatic gluconeogenesis. J Hepatol. (2013) 58(3):535–42.
48. Sun Y, Zhou Y, Shi Y, Zhang Y, Liu K, Liang R, et al. Expression of miRNA-29 in pancreatic β cells promotes inflammation and diabetes via TRAF3. Cell Rep. (2021) 34(1).
49. Ying W, Riopel M, Bandyopadhyay G, Dong Y, Birmingham A, Seo JB, et al. Adipose tissue macrophage-derived exosomal miRNAs can modulate in vivo and in vitro insulin sensitivity. Cell. (2017) 171(2):372–84.
50. Higuchi C, Nakatsuka A, Eguchi J, Teshigawara S, Kanzaki M, Katayama A, et al. Identification of Circulating miR-101, miR-375 and miR-802 as Biomarkers for Type 2 Diabetes. Metabolism. (2014) 64(4):489–97. doi: 10.1016/j.metabol.2014.12.003
51. Kong L, Zhu J, Han W, Jiang X, Xu M, Zhao Y, et al. Significance of serum microRNAs in pre-diabetes and newly diagnosed type 2 diabetes: A clinical study. Acta Diabetologica. (2011) 48:61–9. doi: 10.1007/s00592-010-0226-0
52. Raza ST, Rizvi S, Afreen S, Srivastava S, Siddiqui Z, Fatima N, et al. Association of the circulating micro-RNAs with susceptible and newly diagnosed type 2 diabetes mellitus cases. Adv Biomarker Sci Technol. (2023) 5:57–67. doi: 10.1016/j.abst.2023.05.001
53. Dludla P, Mabhida SE, Ziqubu K, Nkambule BB, Mazibuko-Mbeje SE, Hanser S, et al. Pancreatic β-cell dysfunction in type 2 diabetes: Implications of inflammation and oxidative stress’. World J Diabetes. (2023) 14:130–46. doi: 10.4239/wjd.v14.i3.130
54. Weir GC, Laybutt DR, Kaneto H, Bonner-Weir S, and Sharma A. Beta-cell adaptation and decompensation during the progression of diabetes. Diabetes. (2001) 50:154–9. doi: 10.2337/diabetes.50.2007.S154
55. Joglekar MV, Joglekar VM, and Hardikar AA. Expression of islet-specific microRNAs during human pancreatic development. Gene Expression Patterns. (2009) 9(2):109–13.
56. Herath S, Dai H, Erlich J, Au AY, Taylor K, Succar L, et al. Selection and validation of reference genes for normalization of gene expression in ischaemic and toxicological studies in kidney disease. PloS One. (2020) 15:1–27. doi: 10.1371/journal.pone.0233109
57. Lippi G, Von Meyer A, Cadamuro J, and Simundic AM. Blood sample quality. Diagnosis. (2019) 6(1):25–31.
58. Giavarina D and Lippi G. Blood venous sample collection: Recommendations overview and a checklist to improve quality. Clin Biochem. (2017) 50(10-11):568–73.
59. Vasu MM, Koshy L, Ganapathi S, Jeemon P, Urulangodi M, Gopala S, et al. Identification of novel endogenous control miRNAs in heart failure for normalization of qPCR data. Int J Biol Macromolecules. (2024) 261:129714.
60. Sandau US, Wiedrick JT, McFarland TJ, Galasko DR, Fanning Z, Quinn JF, et al. Analysis of the longitudinal stability of human plasma miRNAs and implications for disease biomarkers. Sci Rep. (2024) 14(1):2148.
61. Qiagen. miRNeasy Serum/Plasma Advanced kit Handbook. (2021). Available online at: https://www.qiagen.com/us/resources/resourcedetail?id=20e0ddd1-ad97-43ef-9edf-eef6a6d02a1d&lang=en (Accessed December 15, 2023).
Keywords: type 2 diabetes mellitus, hsa-miR-425-5p, hsa-miR-22-5p, hsa-miR-29a-3p, hsa-miR-375-3p, microRNA expression, reference, stability
Citation: Palihaderu PADS, Mendis BILM, Premarathne JMKJK, Dias WKR, Yeap SK, Ho WY, Dissanayake AS, Rajapakse IH, Karunanayake P, Senarath U and Satharasinghe DA (2025) Identification of stable reference genes and differential miRNA expression in Sri Lankan type 2 diabetes mellitus patients: a cross-sectional study. Front. Endocrinol. 16:1554827. doi: 10.3389/fendo.2025.1554827
Received: 03 January 2025; Accepted: 29 April 2025;
Published: 12 June 2025.
Edited by:
Carsten Grötzinger, Charité University Medicine Berlin, GermanyReviewed by:
Zhongshan Cheng, St. Jude Children’s Research Hospital, United StatesJaycob Dalton Warfel, University of Tennessee at Martin, United States
Copyright © 2025 Palihaderu, Mendis, Premarathne, Dias, Yeap, Ho, Dissanayake, Rajapakse, Karunanayake, Senarath and Satharasinghe. This is an open-access article distributed under the terms of the Creative Commons Attribution License (CC BY). The use, distribution or reproduction in other forums is permitted, provided the original author(s) and the copyright owner(s) are credited and that the original publication in this journal is cited, in accordance with accepted academic practice. No use, distribution or reproduction is permitted which does not comply with these terms.
*Correspondence: Dilan Amila Satharasinghe, ZGlsYW5zYXRoYXJhc2luZ2hlQHZldC5wZG4uYWMubGs=
†Present address: Balapuwaduge Isuru Layan Madusanka Mendis, Department of Biological Psychology, Faculty of Behavioural and Movement Sciences, Vrije Universiteit Amsterdam, Amsterdam, Netherlands