 Hui Huang
 Yingmin Wu1*
 Hejiang Ye
- 1School of Management, Chengdu University of Traditional Chinese Medicine, Wenjiang, Chengdu, Sichuan, China
- 2Department of Ophthalmology, Hospital of Chengdu University of Traditional Chinese Medicine, Jinniu, Chengdu, Sichuan, China
Background: Diabetic retinopathy, a prevalent complication of diabetes mellitus, is a growing public health concern. The use of robust predictive models can aid healthcare professionals in identifying high-risk patients, enabling them to implement early intervention and treatment strategies.
Objective: To systematically evaluate published prediction models for diabetic retinopathy, select better prediction models for healthcare professionals, and provide a valuable reference for model optimization.
Methods: A comprehensive search was conducted across the PubMed, Web of Science, Embase, and the Cochrane Library databases for relevant literature on predictive models for diabetic retinopathy. The search period was set from the time of library construction to November 14, 2023. Furthermore, risk of bias and applicability assessment of the included study models were performed using the PROBAST risk assessment tool.
Results: A total of 2030 studies were retrieved, including 15 studies. The range of the working characteristic curve of the subjects for the 15 models varied from 0.700 to 0.960. All 15 included studies were recognized as high risk of bias. However, five studies had better applicability. The 15 models had Common risk factors for the 15 models included diabetes duration, age, glycosylated hemoglobin, serum creatinine and urinary albumin creatinine ratio.
Conclusions: While the performance of the 15 models had certain predictive performance, the high risk of bias is a concern. Hopefully, future studies will ensure transparency and science in the model-building process by conducting large-sample integrated machine learning, reinforcing multicenter external validation.
This study was registered with PROSPERO, an international prospective systematic evaluation registry platform, and the title was approved with registration number CRD42023483749.
Systematic review registration: https://www.crd.york.ac.uk/PROSPERO/, identifier CRD42024559392.
1 Introduction
Diabetic retinopathy (DR) is a prevalent microvascular complication of both type 1 and type 2 diabetes and one of the leading causes of blindness in working adults (1, 2). Global surveys indicated that the number of individuals diagnosed with diabetic retinopathy was 103 million in 2020, which is expected to reach 161 million by 2045 (3). In China, there are about 140 million individuals diagnosed with diabetes (4), among which the prevalence of diabetic retinopathy in patients with type 2 diabetes mellitus is 25% (5). Due to the rising incidence of diabetes and the expanding population of individuals with diabetic retinopathy (2), this condition has emerged as a significant public health concern. During the initial stages, diabetic retinopathy does not exhibit any symptoms; however, as the condition advances, it can result in permanent vision loss and eventually complete blindness (6). Early intervention can successfully delay or alter the progression of diabetic retinopathy (7), making it a particularly significant condition.
Using quantitative research methods, predictive disease modeling can help healthcare professionals assess the patient’s condition and take appropriate interventions and treatments to minimize the harm to the patient suffering from the disease. Diabetic retinopathy prediction models can help clinicians in early screening, diagnosis and treatment planning and limited screening of high-risk patients in resource-constrained settings to mitigate disease progression and protect vision (8). The diabetic retinopathy prediction model also helps clinicians to estimate the risk of diabetic retinopathy in diabetic patients, and to personalize the screening and follow-up of patients (9).There are many studies on clinical prediction models for diabetic retinopathy, but diabetic retinopathy risk prediction models incorporate different risk factors with different predictive performances, and it is not clear whether the models can be generalized. Therefore, this review aims to analyze and evaluate diabetic retinopathy prediction models systematically, and the results of the study provide valuable references for future specification of prediction models.
2 Methods
2.1 Literature inclusion and exclusion criteria
Literature inclusion criteria were as follows: (1) Study population: studies in which patients with type 2 diabetes mellitus were diagnosed; (2) Study content: studies in which a predictive model for type 2 diabetic retinopathy was used (except for models of diabetic retinopathy progression, recurrence, and prognosis) and the process of model establishment, validation, and evaluation was described; (3) Study type: cross-sectional studies, case-control studies, cohort studies; (4) Outcome indicators: studies in which the occurrence of type 2 diabetic retinopathy was used as an outcome indicator (10).
Literature exclusion criteria were as follows: (1) studies that only discussed the risk factors of type 2 diabetic retinopathy without constructing models; (2) informal literature such as conference abstracts, reviews, and gray literature; (3) studies based on systematic evaluations to build a model; (4) cellular level studies; (5) duplicated literature and studies that could not be accessed in the original text; (6) articles are in languages other than English for research.
2.2 Literature search strategy
A comprehensive literature search was performed using PubMed, Web of Science, Embase, and the Cochrane Library on predictive models for diabetic retinopathy. The search period was set from the time of library construction to November 14, 2023, with English language search and manual searches also performed. The search terms used were a combination of subject terms and free terms, specifically “Diabetic Retinopathy/Diabetic Retinopathies/Retinopathies, Diabetic/Retinopathy, Diabetic/Diabetes Mellitus Retinopathy/Predictive Models/Risk Assessment/Risk Prediction/Risk Score” as the English search term. PubMed served as an exemplar for conducting a detailed search.
#1 Search: “Diabetic Retinopathy”[Mesh] Sort By: Most Recent
#2 Search: ((Diabetic Retinopathies[Title/Abstract]) OR (Retinopathies, Diabetic[Title/Abstract])) OR (Retinopathy, Diabetic[Title/Abstract])
#3 #1 OR #2
#4 Search: (((Predictive Models[Title/Abstract]) OR (Risk Assessment[Title/Abstract])) OR (Risk Prediction[Title/Abstract])) OR (Risk Score[Title/Abstract])
#5 #3 AND #4
P (Population): Patients with type 2 diabetes.
I (Intervention model): Prediction model of retinopathy in type 2 diabetes that were developed and published (predictors ≥ 2).
C (Comparator): No competing model.
O(Outcome): The outcome focused on the occurrence of diabetic retinopathy.
T (Timing): The outcome was predicted after evaluating the personal basic information and laboratory indicators of patients with type 2 diabetes.
S (Setting): The role of the risk prediction model is to predict the probability of developing diabetic retinopathy based on the individual circumstances of patients with type 2 diabetes to prevent adverse events.
2.3 Literature screening and information extraction
This review used EndNote 21 literature manager to remove duplicates. Two researchers independently assessed the title and abstract of the literature based on inclusion and exclusion criteria. The full text was examined meticulously to find relevant inclusion of literature in this study, and data was retrieved and verified through cross-checking. In the event of any disagreements, they were resolved through discussion or negotiation with the involvement of a neutral third party. The process of extracting data for systematic reviews of prediction modeling studies, as outlined in the CHARMS checklist (11), involves gathering information on the fundamental characteristics of the literature being reviewed, such as the first author, publication year, country, study type, case collection time, data source, study model type, and sample size. Additionally, details about the predictive model are collected, including how missing values are handled, feature extraction methods, model development techniques, calibration methods, model validation approaches, model performance, and predictors.
2.4 Assessment of risk of bias and applicability of prediction models for included studies
Two researchers independently assessed the risk of bias and applicability of the included literature based on the prediction model research risk of bias assessment tool PROBAST (prediction model risk of bias assessment tool) (12, 13). If there is a dispute, it is resolved through discussion or negotiation with a third party. The tool is suitable for researching various diagnostic or prognostic models. PROBAST contains four domains: study population, predictor variables, outcomes, and analysis, with 20 entries in the four domains. Each domain is answered with “low,” “high,” or “unclear.” The four domains of study object, predictor variable, outcome, and analysis were used to assess the risk of bias in the prediction model. The three domains of the study population, predictor variables, and outcomes were used for the assessment of the applicability of the predictive model. Based on the results of each field, the overall risk of bias and applicability of the prediction model were determined, which were reported using the terms “low risk of bias or high applicability,” “high risk of bias or low applicability,” and “unclear risk of bias or unclear applicability.”
2.5 Data synthesis and statistical analysis
Meta-analysis of the AUC values of the model was performed using MedCalc software. Heterogeneity was tested using the I² index. I² value of ≤25% indicated low heterogeneity, 25%<I²≤50% indicated moderate heterogeneity, and I²>50% indicated high heterogeneity. Heterogeneity was analyzed according to the results using either a fixed-effects model or a random-effects model, and publication bias was identified using the Egger test, with p > 0.05 indicating a low likelihood of publication bias.
3 Results
3.1 Literature screening process and results
A total of 2030 articles were obtained from the literature search using the specified search terms, including 108 articles from PubMed, 101 articles from Embase, 1470 articles from Web of Science, and 351 articles from the Cochrane Library. After removing 212 duplicate articles, the titles and abstracts of 1818 articles were reviewed. Following the screening procedure, 63 articles were selected for additional assessment, and 15 documents (11–25) were included. Figure 1 depicts detailed results.
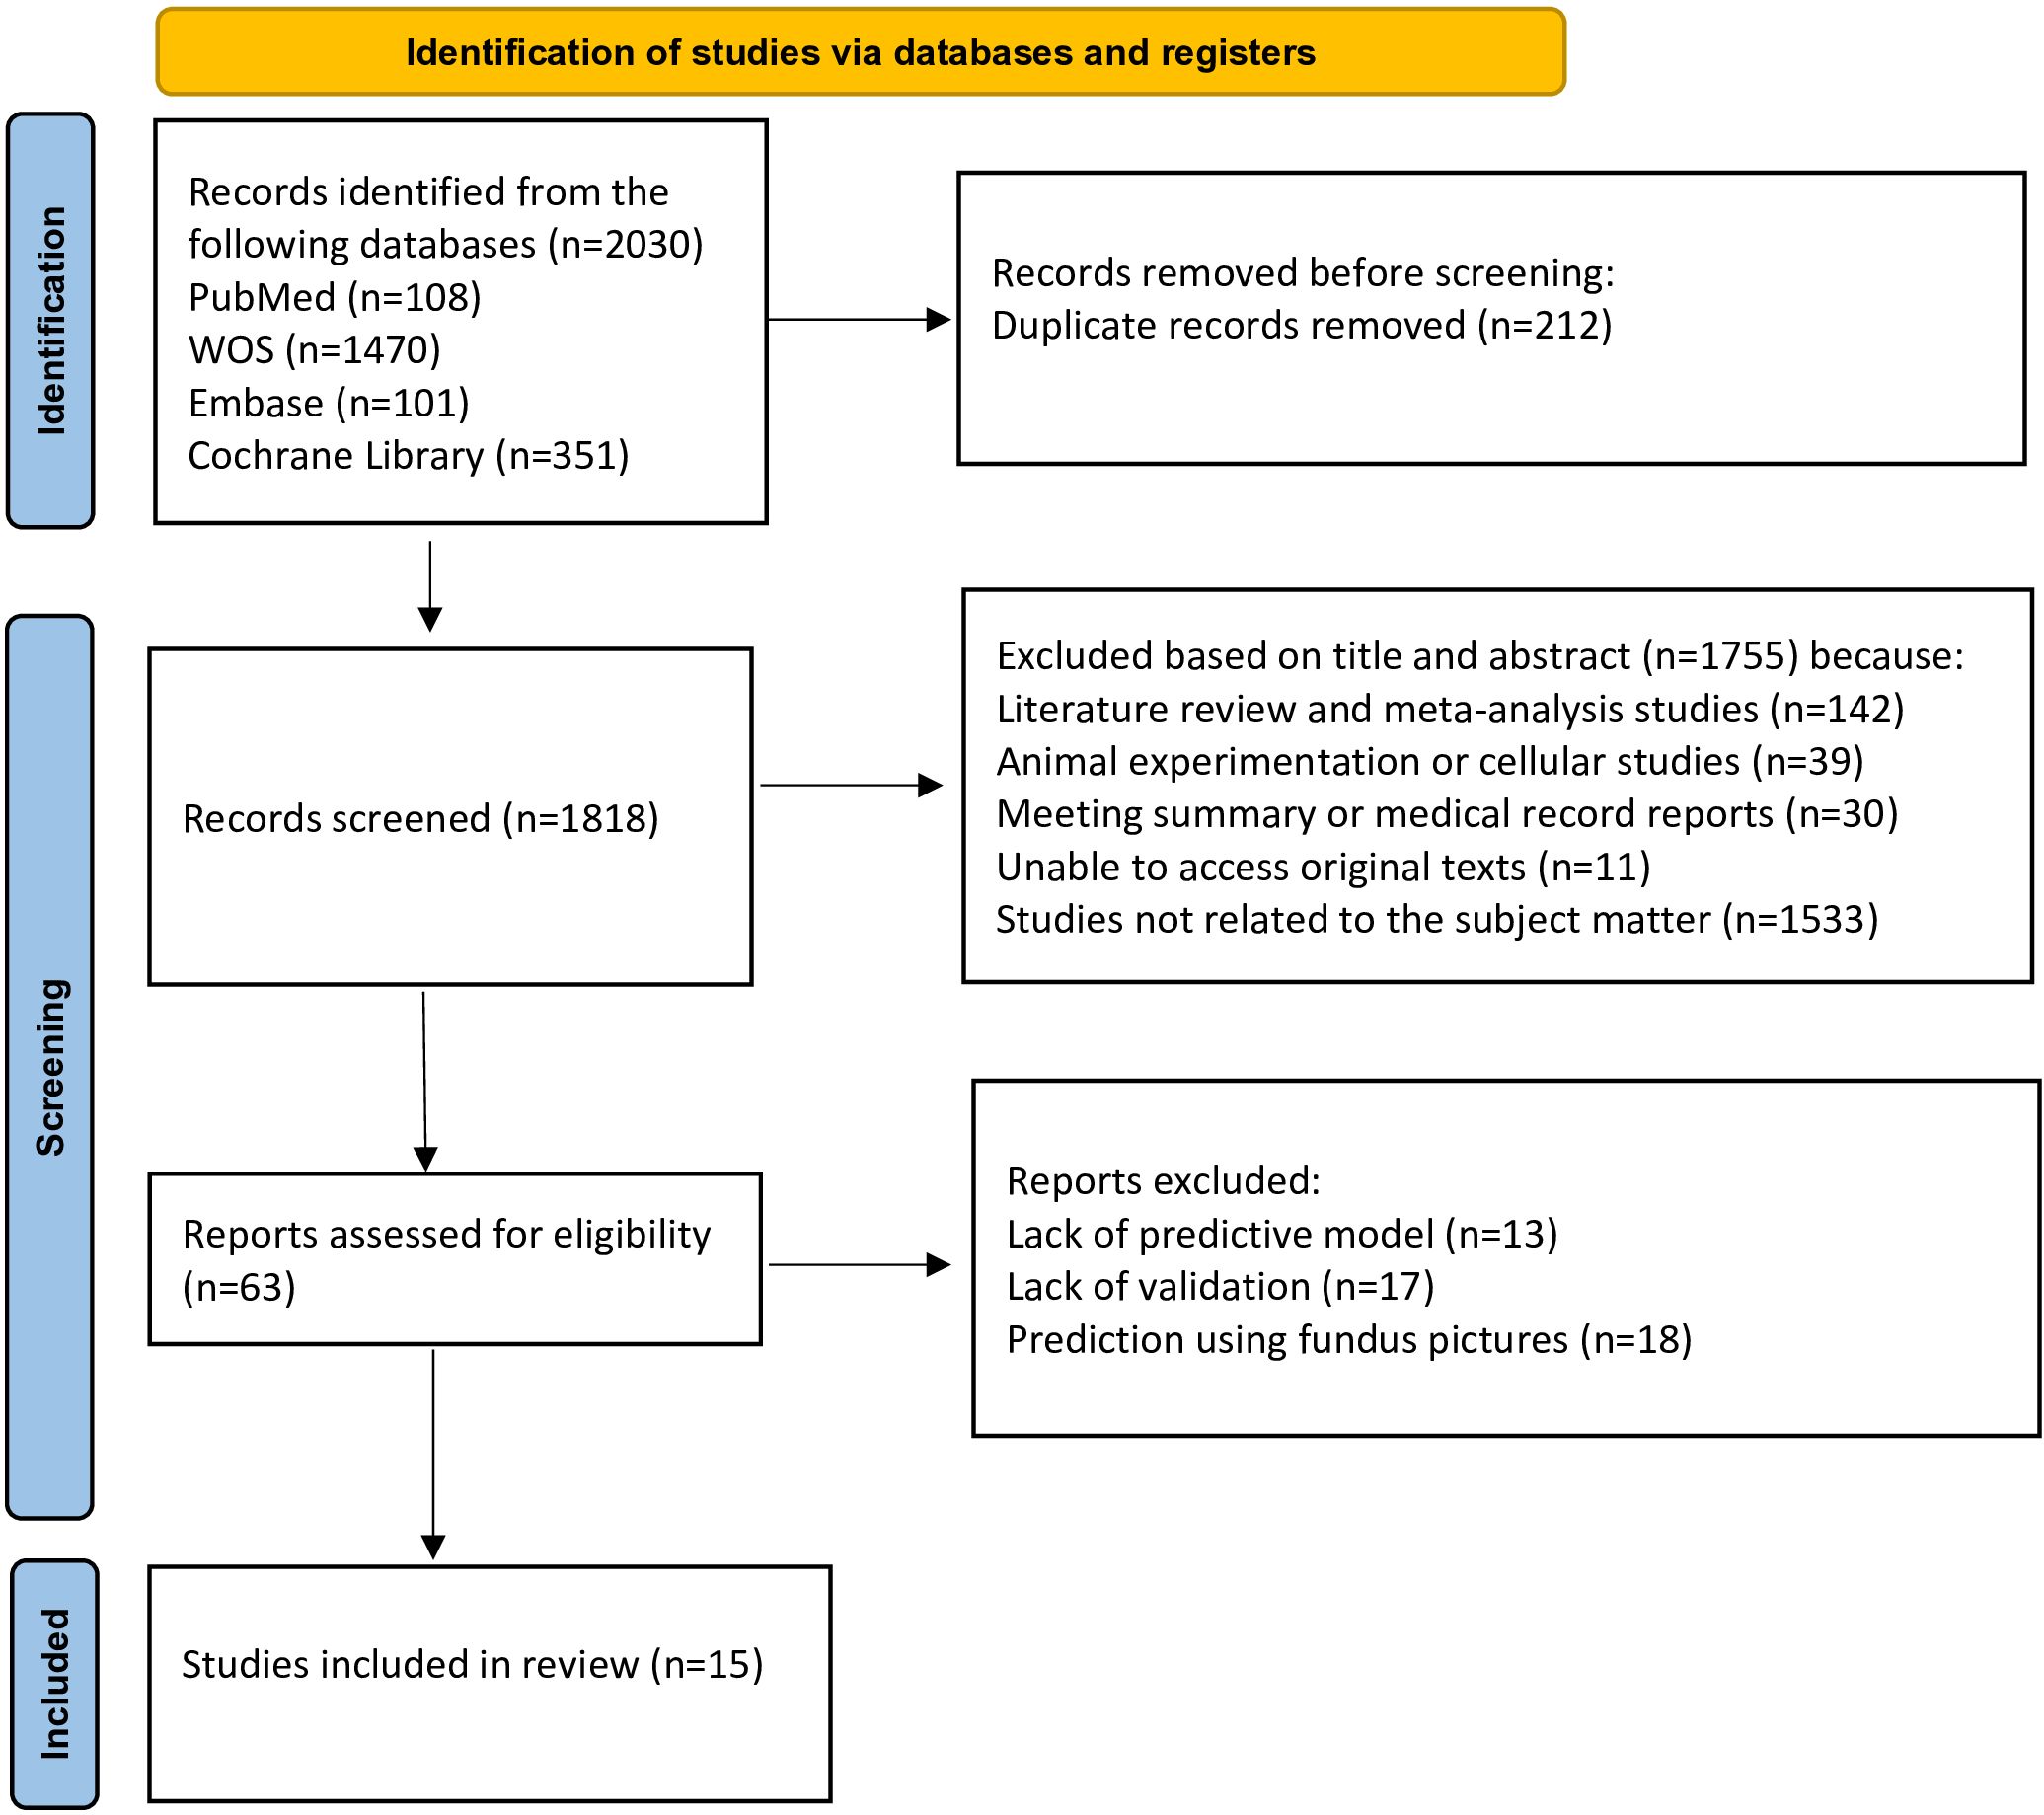
Figure 1. Literature screening process.
3.2 Basic characteristics of the included literature
Fifteen studies (14–28) were included, published between 2013–2023, with thirteen studies (14–26) published in the last three years. There were twelve (14–20, 22, 24–27) studies in China, one (21) in the UK and India, and two (23, 28) in South Korea. Of the included studies, eleven (15–17, 19–24, 26, 27) were retrospective cohort studies, and four (14, 18, 25, 28) were cross-sectional studies. Six studies (16, 21, 23–25, 27) were multicenter studies, and nine (14, 15, 17–20, 22, 26, 28) were single-center studies. Table 1 depicts the detailed results of the analysis.
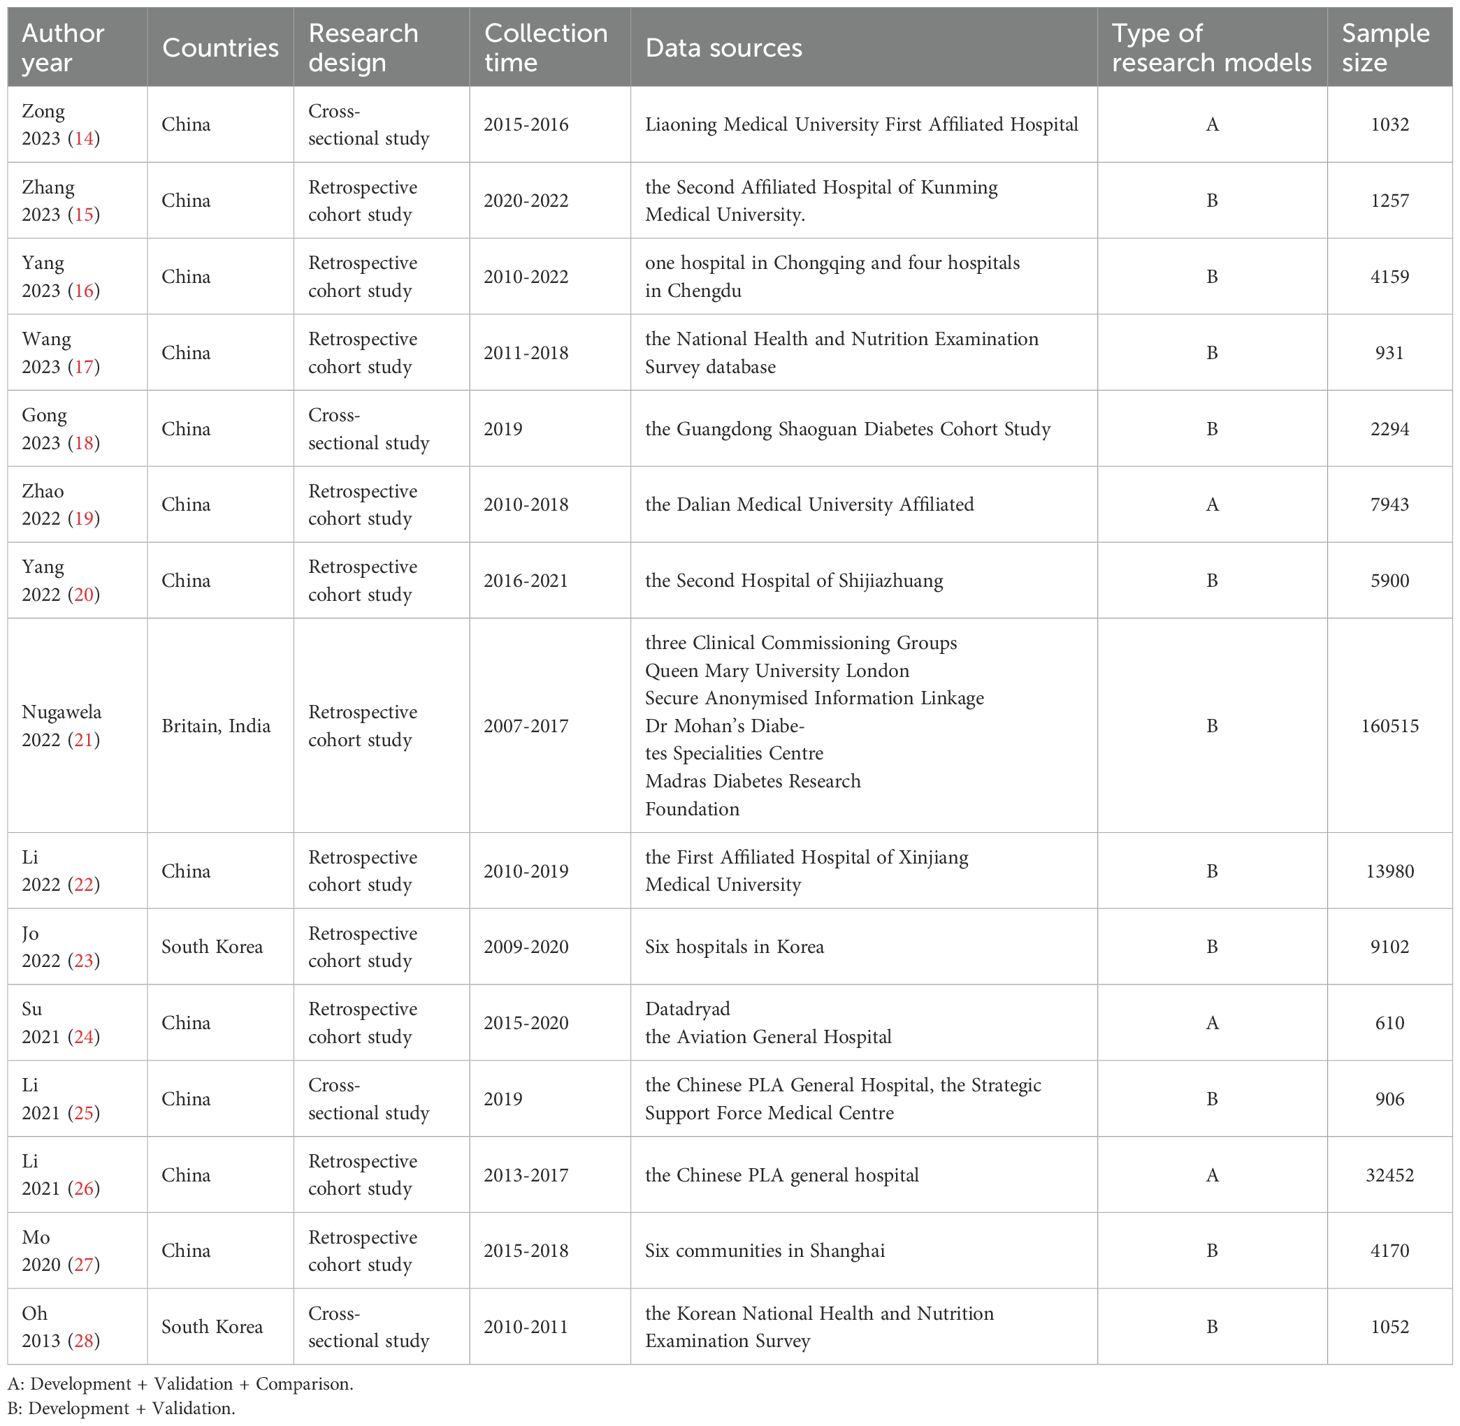
Table 1. Basic characteristics of included studies.
3.3 Basics of the model
For variable selection among the included studies, four studies (18, 19, 23, 24) screened variables using only a one-way analysis of variance, followed by seven studies (14, 17, 20, 22, 25, 27, 28) that screened predictors directly using LASSO. For model construction, seven studies (14, 19, 23, 24, 26, 28) used multiple modeling methods and determined the final model by comparing the AUC. Regarding missing data, seven studies (15, 18–20, 25, 27, 28) did not report how they treated missing values. Only three studies (14, 16, 22) dealt with missing values using multiple interpolations, missing-then-excluded (17), coding as a separate category (21), regression with supervised machine learning (23), K-nearest-neighbor interpolation (26), and maximum likelihood estimation (24) for one study each. Among the models included in the 15 studies, the main predictors of diabetic retinopathy prediction models were diabetes duration, glycosylated hemoglobin, age, serum creatinine and urinary albumin creatinine ratio. The AUC values of the models ranged from 0.700 to 0.960, indicating that the models had some predictive performance. Table 2 depicts the detailed results.
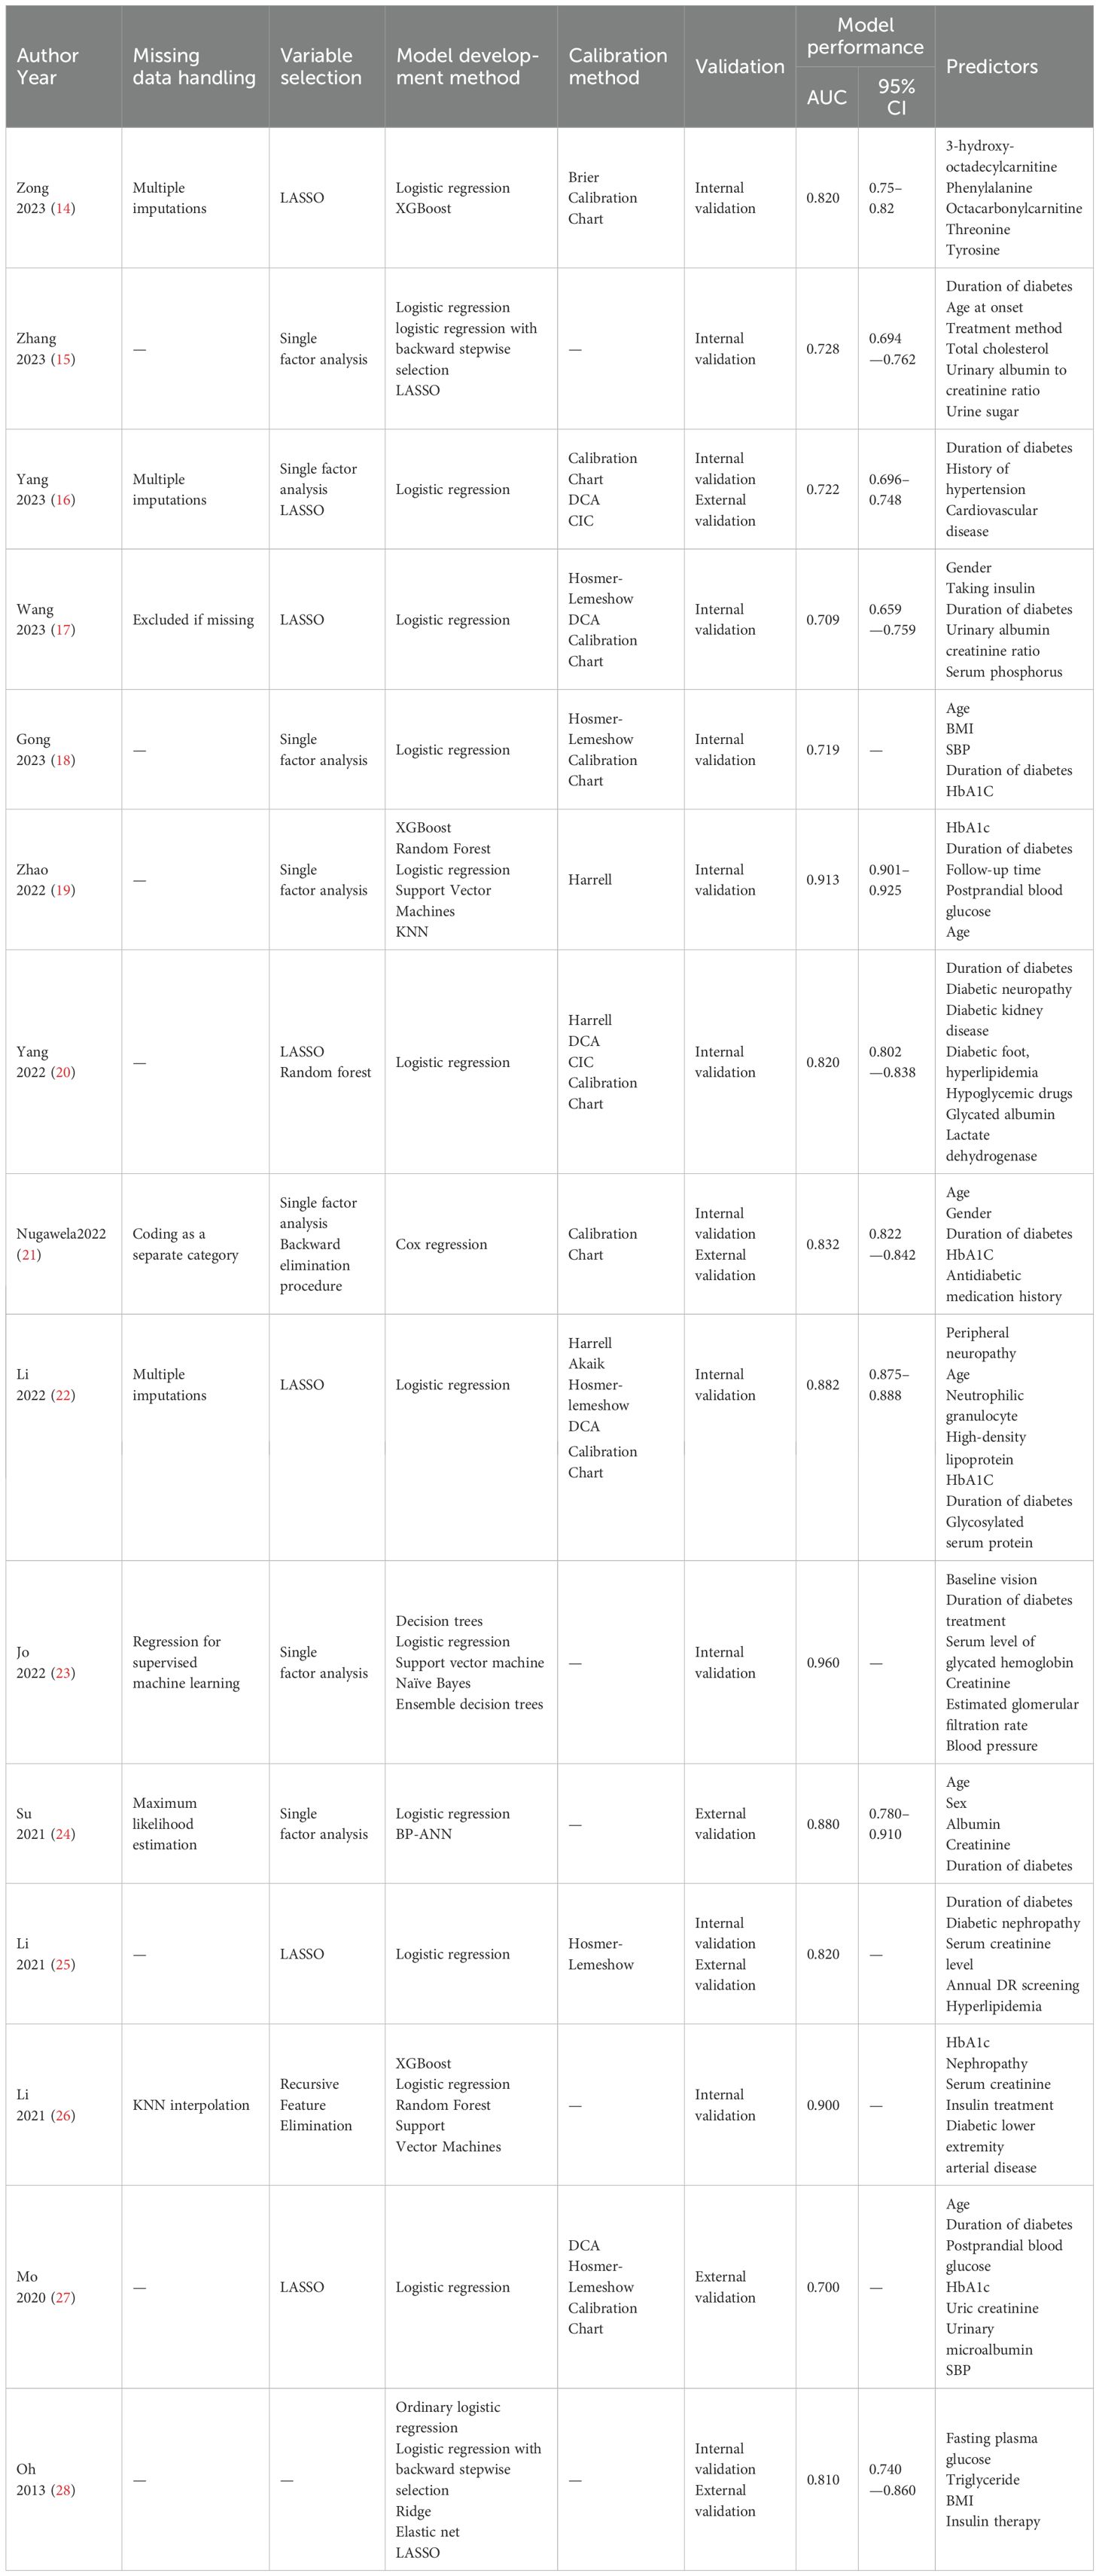
Table 2. Overview of information on the predictive models included in the study.
3.4 Validation of the model
All fifteen studies validated the model, in which nine studies (14, 15, 17–20, 22, 23, 26) used internal validation, four studies (16, 21, 25, 28) used a combination of internal and external validation and two studies (24, 27) used external validation. The model was mainly calibrated using Hosmer–Lemeshow, calibration graphs, and DCA to calibrate the model, and five studies (16, 23, 24, 26, 28) did not calibrate the model, and the detailed results are shown in Table 2.
3.5 Risk of bias and applicability results
3.5.1 Risk of bias evaluation
Based on the PROBAST evaluation criteria, all 15 included literature had a high overall risk of bias. The main reasons are reflected in the research object field, outcome field, and analysis field. Subject area: A total of eleven studies (15–17, 19–24, 26, 27) were identified to have a high risk of bias. This was mostly because the retrospective studies used data sources not initially created for modeling and validation purposes. The remaining four studies (14, 18, 25, 28) exhibited a low risk of bias.
Predictor variable domain: Two studies (27, 28) were identified to have a low risk of bias, and thirteen studies (14–26) were identified to have an unclear risk of bias. The main reason was that these studies did not explicitly answer the question “whether the assessment of predictors was made without knowledge of clinical outcome data” and did not report this information.
Outcome areas: Two studies (21, 23) were identified to have a high risk of bias. Nugawela (21) and Jo (23) conducted multi-center retrospective studies with unclear descriptions of clinical outcome assessment and a significant potential for bias. Thirteen studies (14–20, 22, 24–28) were found to have an uncertain level of bias, primarily due to insufficient information regarding the method of predictor assessment and the time of predictor measurement.
Analytic domain: All fifteen studies identified a high risk of bias in the analytic domain. For continuous variable treatment, six studies (14–16, 18, 21, 22) transformed some continuous variables into categorical variables, which may lead to a decrease in the predictive power of the model. Regarding missing data, seven studies (15, 18–20, 25, 27, 28) did not report information on how missing data were handled. Regarding selecting predictive factors, four studies (18, 19, 23, 24) used one-way analysis and did not use appropriate methods to select predictors. Regarding model validation, nine studies (14, 15, 17–20, 22, 23, 26) partitioned a certain amount of data for internal validation and did not conduct external validation to determine the general applicability of the model. Table 3 presents a detailed data for the analysis.
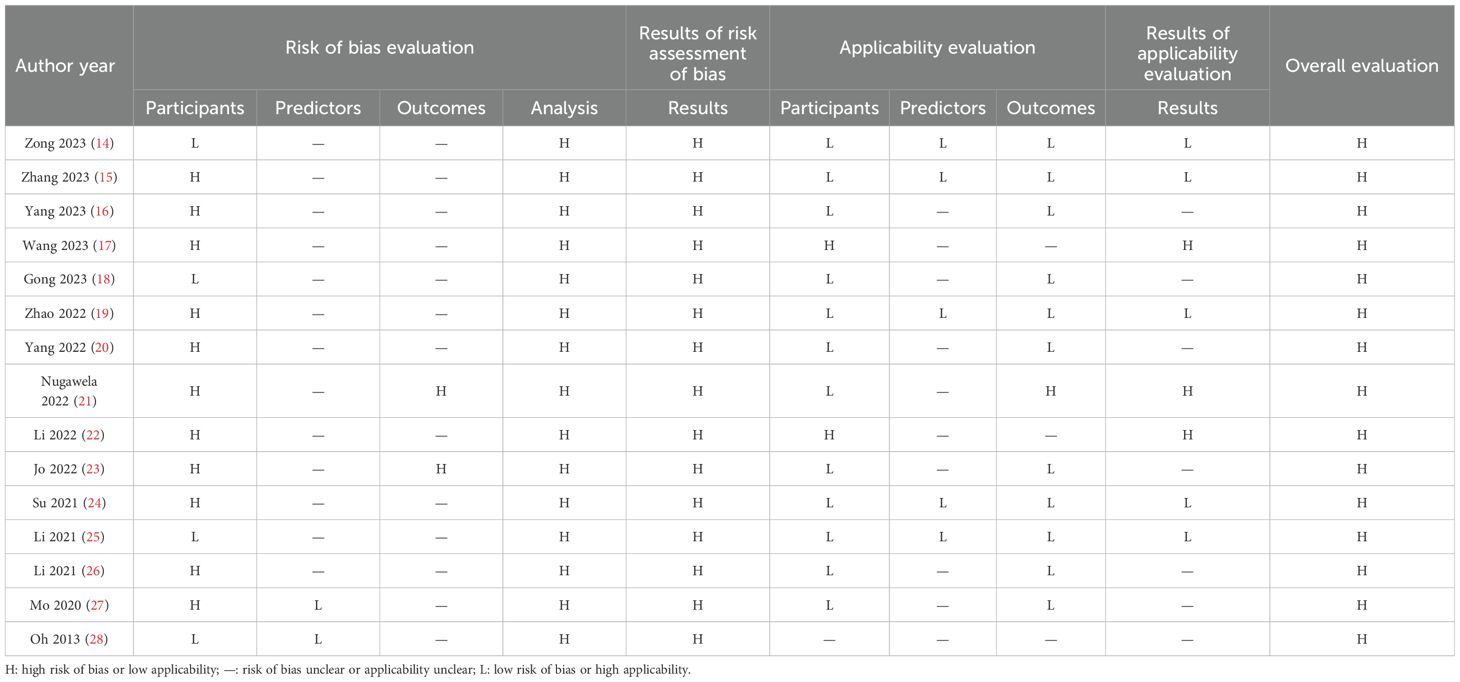
Table 3. Risk of bias and applicability assessment results.
3.5.2 Evaluation of applicability
Three studies (17, 21, 22) were identified as having a high risk of bias for applicability evaluation, seven studies (16, 18, 20, 23, 26–28) were identified as unclear risk of bias, and five studies (14, 15, 19, 24, 25) were identified as having a low risk of bias.
In the area of the study population, one study (21) lacked information about the study subjects. In the area of predictor variables, ten studies (16–18, 20–23, 26–28) lacked information about the definition of predictors. One study (21) was at high risk of bias for the outcome domain, and Nugawela (21) defined severe nonproliferative diabetic retinopathy as diabetic retinopathy. The definition of diabetic retinopathy in this review referred to the International Clinical Diabetic Retinopathy Severity Scale (10), which included mild nonproliferative diabetic retinopathy, and the different definitions resulted in a high risk of bias. Three studies (17, 22, 28) lacked information about the definition of diabetic retinopathy. Table 3 depicts a detail.
3.6 Meta-analysis results
Nine studies were eligible for pooling due to underreporting of model development details in the included studies. A random effects model was used to calculate the combined AUC, and the analysis resulted in a combined AUC value of 0.812 (95% CI: 0.766-0.859). Figure 2 depicts detailed results. I2 value of 97.89% (p < 0.001) indicated a high degree of consistency between the studies, and an Egger’s value of -6.963 (p=0.06), suggesting that there was no significant publication bias but close to the level of significance, the potential possibility of bias needs to be considered with caution. The funnel plot is shown in Figure 3.
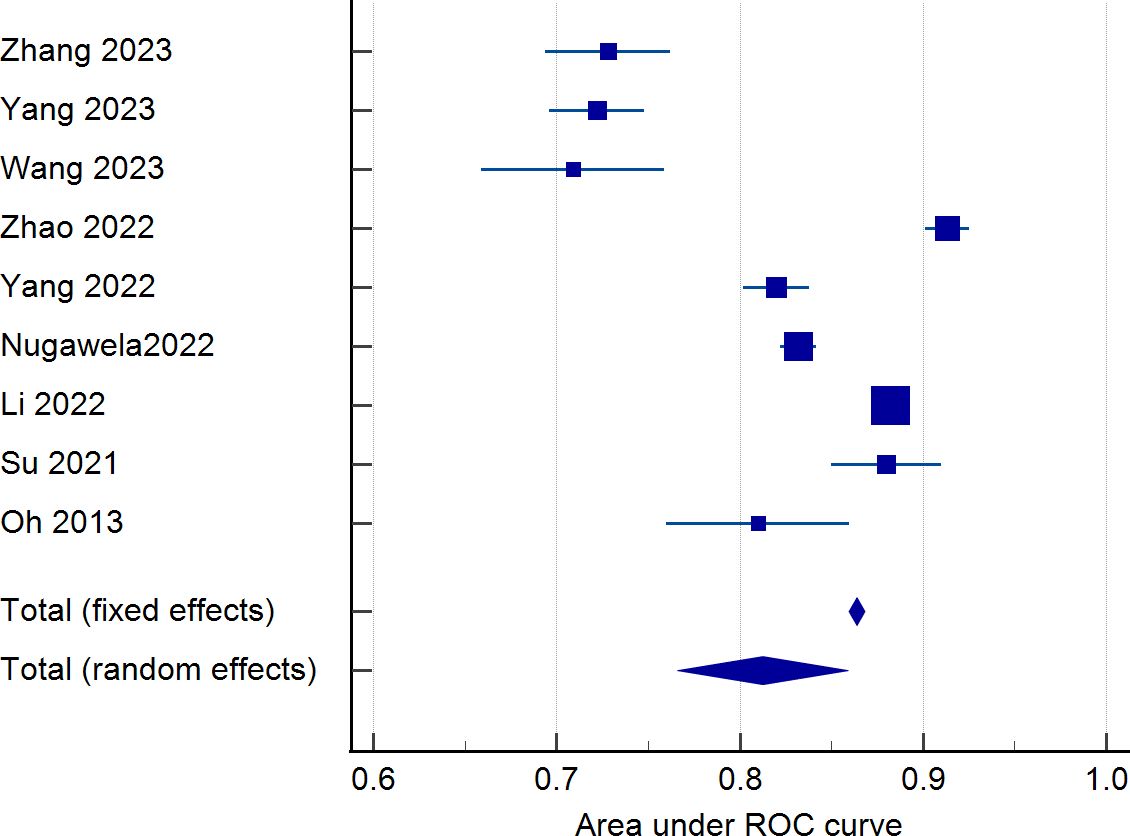
Figure 2. Forest plot of the area under the receiver operating characteristic curve for the risk prediction model.
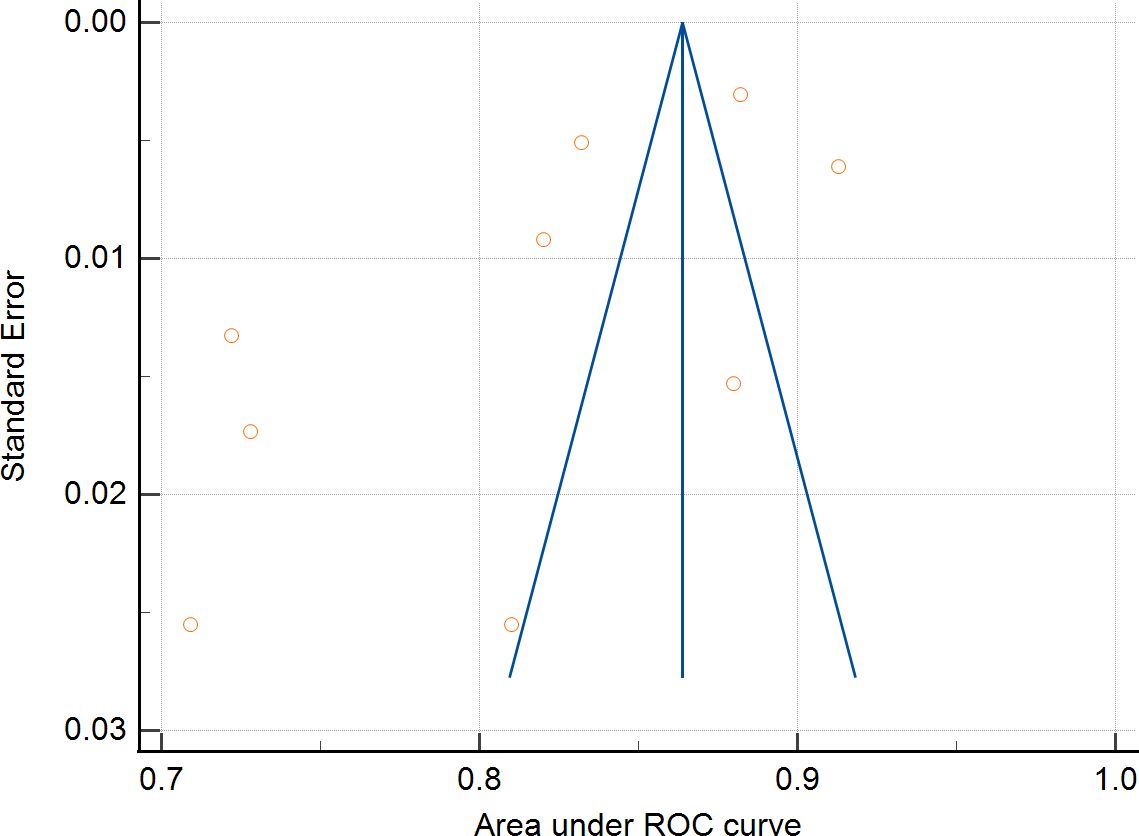
Figure 3. Funnel plot examination.
4 Discussion
A total of fifteen diabetic retinopathy prediction models were included in this study after screening, and the AUC values of the included models ranged from 0.700 to 0.960, which had a certain predictive performance. According to the AUC value, Jo’s model has the strongest predictive performance, which is not only due to the use of ensemble algorithms in the model construction process but also supported by rich multicenter data. However, fifteen studies were evaluated using the risk of bias assessment tool PROBAST, and all were recognized as high risk of bias. Model performance varies widely and model heterogeneity is high. The reasons for this were mainly cases of inappropriate selection of study subjects, inappropriate treatment of continuous variables, inappropriate methods of screening predictor variables, treatment of unreported missing values, and lack of external validation.
Firstly, regarding object of study. The predictive models included in this study were predominantly retrospective studies. Although the sample size is large, predictors in retrospective studies may not be comprehensive, and there are missing data, leading to biased results. Conversely, prospective studies ensure that the measurement of predictors occurs before the outcome and that the predictors are assessed uniformly, enhancing the reliability of the model results. Regarding missing value treatment, only three studies used multiple interpolations to deal with missing data, whereas multiple interpolations can reduce the impact of missing data on statistical analysis and model accuracy (29). When missing data are handled inappropriately, valuable information hidden in the excluded objects may be ignored or lost, leading to model bias; thus, choosing appropriate missing data handling methods in future studies is crucial. Then, regarding predictive variable. Seven studies (14, 17, 20, 22, 25, 27, 28) in this review used LASSO to select predictors. Four studies (18, 19, 23, 24) used only one-way analyses to include statistically significant predictors in the model analyses, which may have omitted significant predictors. Other studies have shown that using LASSO leads to better identification of predictors and improves the predictive performance of the model (30, 31); thus, future studies should use the right approach while selecting predictors. Notably, the included studies used logistic regression and integrated algorithms such as decision trees, random forests to construct predictive models. The predictive performance of constructing models using integrated algorithms was stronger than that of logistic regression, consistent with the results obtained in studies conducted in other areas of medicine (32, 33). However, the issue of overfitting in the process of building models using integrated algorithms still needs to be taken seriously. Internal validation of predictive models aims to test the repeatability of the model and effectively prevent overfitting (34), while external validation is regarded as the “gold standard” for testing the generalizability of the model. While all the research included in this study conducted model validation, many studies focused on internal validation. Only four studies (16, 21, 25, 28) conducted internal and external validation, but the external validation aspect of these studies may be improved. Before clinical implementation, multiple external validations are crucial to assess the model’s stability and overall applicability. This is necessary due to significant variations in baseline characteristics and other factors among different target populations (35). Therefore, future researchers should focus on the external validation of the model to ensure its reliability in practical application.
The final predictors in the fifteen models included in this study ranged from three to seven. Despite differences in the type of study and study area, predictors of each model varied, but there were some commonalities. The most common predictors include duration of diabetes, age, glycosylated hemoglobin, serum creatinine and urinary albumin creatinine ratio. The prevalence of diabetes retinopathy increases with the increase of the course of diabetes. The prevalence of diabetic retinopathy was 9.44% when the duration of diabetes was less than 5 years, and 76.47% when the duration of diabetes was 20–25 years (36). Therefore, patients with a long duration of diabetes are a priority for diabetic retinopathy prevention. The older the patients with diabetes, The risk of diabetic retinopathy is influenced by dual age factors: the patient’s current age and the age of diagnosis of diabetes. Among them, the younger the age of diagnosis, the higher the risk of retinal lesions (37, 38). Therefore, middle-aged people are also the focus of screening for diabetes retinopathy. For this reason, some scholars had established a risk prediction model for diabetes retinopathy in middle-aged patients with type 2 diabetes (17) to predict the risk of diabetes retinopathy in middle-aged people and intervene in advance. Glycated hemoglobin was significantly associated with diabetic retinopathy. According to research, the optimal HbA1c threshold for detecting any diabetic retinopathy was 49 mmol/mol (6.6%) and 52 mmol/mol (6.9%) for moderate or severe retinopathy (39). A meta-study showed that glycosylated hemoglobin has good diagnostic value and validity for diabetic retinopathy because it has the advantages of being more stable than blood glucose and independent of dietary influences (40). Therefore, it is important for people with diabetes to control their blood sugar levels in their daily lives to reduce the likelihood of developing diabetic retinopathy. A multicenter cohort study with 8 years of follow-up found that patients with diabetic retinopathy had higher serum creatinine levels and higher urinary microalbumin/urinary creatinine than patients without diabetic retinopathy (41). Given that most models’ data originate from China, the inferred predictive factors may be more suitable for application in developing countries. In these countries, predictive indicators such as HbA1c, duration of diabetes, and the urinary albumin-to-creatinine ratio (UACR) are not only easily accessible but also relatively low in cost, making them an ideal choice in resource-limited settings. Moreover, these factors have also shown good accuracy in predicting diabetic retinopathy.
Although early intervention is an effective measure to prevent diabetic retinopathy, the performance of the diabetic retinopathy risk prediction model constructed using the above predictors needs to be further validated. Meanwhile, several studies (42, 43) have successfully combined fundus images with machine learning to recognize key features of diabetic retinopathy. Acquiring fundus images provides another important feature for diabetic retinopathy prediction models, which may further enrich the predictive ability and accuracy of the models.
5 Limitations
This review has certain limitations. First, most of the research subjects included in this review are from China, and the generalizability of the findings to Western populations may be limited. Second, the current PROBAST assessment has many discomforts for the risk of bias in machine learning-related studies. PROBAST-AI is required (44, 45), but this assessment tool is still under development. Furthermore, considering the heterogeneity of the included studies regarding the type of design, data sources, and modeling methods, no quantitative analysis of the included studies was performed. Finally, this study only included English literature, and research results in other languages were not included.
6 Conclusions
To summarize, all 15 prediction models included in this systematic review were thoroughly evaluated and showed robust predictive capabilities. The assessment results of the PROBAST tool indicated that all the predictive models examined in the research were identified as having a significant risk of bias. Future researchers are advised to adhere rigorously to PROBAST guidelines to ensure transparency and scientific accuracy in developing models and to enhance the quality of future studies. In the future, as medical record databases are established and the era of artificial intelligence begins, we will use large-sample integrated machine learning algorithms and deep learning algorithms to train models. This will help us strengthen the external validation of multi-center data and develop prediction models with good predictive performance and applicability.
Data availability statement
The original contributions presented in the study are included in the article/Supplementary Material. Further inquiries can be directed to the corresponding author/s.
Author contributions
HH: Data curation, Writing – original draft, Writing – review & editing. YW: Funding acquisition, Supervision, Writing – review & editing. HY: Project administration, Writing – review & editing. JL: Data curation, Methodology, Software, Writing – review & editing. LC: Validation, Visualization, Writing – review & editing. XH: Validation, Visualization, Writing – review & editing.
Funding
The author(s) declare that financial support was received for the research and/or publication of this article. This research project was supported by National Natural Science Foundation of China (Project Number:71804017),”XingLin Scholars” Youth Base Talent Program (Project Number: QJRC2021020).
Conflict of interest
The authors declare that the research was conducted in the absence of any commercial or financial relationships that could be construed as a potential conflict of interest.
Generative AI statement
The author(s) declare that no Generative AI was used in the creation of this manuscript.
Publisher’s note
All claims expressed in this article are solely those of the authors and do not necessarily represent those of their affiliated organizations, or those of the publisher, the editors and the reviewers. Any product that may be evaluated in this article, or claim that may be made by its manufacturer, is not guaranteed or endorsed by the publisher.
Supplementary material
The Supplementary Material for this article can be found online at: https://www.frontiersin.org/articles/10.3389/fendo.2025.1556049/full#supplementary-material
References
1. Lin KY, Hsih WH, Lin YB, Wen CY, and Chang TJ. Update in the epidemiology, risk factors, screening, and treatment of diabetic retinopathy. J Diabetes Invest. (2021) 12:1322–5. doi: 10.1111/jdi.13480
2. Yau JWY, Rogers SL, Kawasaki R, Lamoureux EL, Kowalski JW, Bek T, et al. Global prevalence and major risk factors of diabetic retinopathy. Diabetes Care. (2012) 35:556–64. doi: 10.2337/dc11-1909
3. Teo ZL, Tham Y-C, Yu M, Chee ML, Rim TH, Cheung N, et al. Global prevalence of diabetic retinopathy and projection of burden through 2045. Ophthalmology. (2021) 128:1580–91. doi: 10.1016/j.ophtha.2021.04.027
4. Magliano DJ, Boyko EJ, and IDF Diabetes Atlas 10th edition scientific committee. IDF DIABETES ATLAS [Internet]. 10th edition. Brussels: International Diabetes Federation (2021) Chapter 3, Global picture. Available at: https://www.ncbi.nlm.nih.gov/books/NBK581940/.
5. Yang Q-H, Zhang Y, Zhang X-M, and Li X-R. Prevalence of diabetic retinopathy, proliferative diabetic retinopathy and non-proliferative diabetic retinopathy in Asian T2DM patients: a systematic review and Meta-analysis. Int J Ophthalmol. (2019) 12(2):302–11. doi: 10.18240/ijo.2019.02.19
6. Abramoff MD, Fort PE, Han IC, Jayasundera KT, Sohn EH, and Gardner TW. Approach for a clinically useful comprehensive classification of vascular and neural aspects of diabetic retinal disease. Invest Ophthalmol Vis Sci. (2018) 59:519–27. doi: 10.1167/iovs.17-21873
7. Elkjaer AS, Lynge SK, and Grauslund J. Evidence and indications for systemic treatment in diabetic retinopathy: a systematic review. Acta Ophthalmol (Copenh). (2020) 98:329–36. doi: 10.1111/aos.14377
8. Gao J-J, Liu H, Zhang T-Y, and Wang Y-W. A simple and accessible diabetic retinopathy risk prediction model: Establishment and validation in a hospital-based cohort of type 2 diabetes patients. Diabetes Res Clin Pract. (2025) 224:112211. doi: 10.1016/j.diabres.2025.112211
9. Romero-Aroca P, Valls A, Moreno A, Sagarra-Alamo R, Basora-Gallisa J, Saleh E, et al. A clinical decision support system for diabetic retinopathy screening: creating a clinical support application. Telemedicine e-Health. (2019) 25:31–40. doi: 10.1089/tmj.2017.0282
10. Wilkinson CP, Ferris FL, Klein RE, Lee PP, Agardh CD, Davis M, et al. Proposed international clinical diabetic retinopathy and diabetic macular edema disease severity scales. Ophthalmology. (2003) 110:1677–82. doi: 10.1016/S0161-6420(03)00475-5
11. Moons KGM, De Groot JAH, Bouwmeester W, Vergouwe Y, Mallett S, Altman DG, et al. Critical appraisal and data extraction for systematic reviews of prediction modelling studies: the CHARMS checklist. PloS Med. (2014) 11:e1001744. doi: 10.1371/journal.pmed.1001744
12. Moons KGM, Wolff RF, Riley RD, Whiting PF, Westwood M, Collins GS, et al. PROBAST: A tool to assess risk of bias and applicability of prediction model studies: explanation and elaboration. Ann Intern Med. (2019) 170:W1. doi: 10.7326/M18-1377
13. Wolff RF, Moons KGM, Riley RD, Whiting PF, Westwood M, Collins GS, et al. PROBAST: A tool to assess the risk of bias and applicability of prediction model studies. Ann Intern Med. (2019) 170:51. doi: 10.7326/M18-1376
14. Zong G-W, Wang W-Y, Zheng J, Zhang W, Luo W-M, Fang Z-Z, et al. A metabolism-based interpretable machine learning prediction model for diabetic retinopathy risk: A cross-sectional study in chinese patients with type 2 diabetes. J Diabetes Res. (2023) 2023:1–12. doi: 10.1155/2023/3990035
15. Zhang C, Zhou L, Ma M, Yang Y, Zhang Y, and Zha X. Dynamic nomogram prediction model for diabetic retinopathy in patients with type 2 diabetes mellitus. BMC Ophthalmol. (2023) 23:186. doi: 10.1186/s12886-023-02925-1
16. Yang Y, Tan J, He Y, Huang H, Wang T, Gong J, et al. Predictive model for diabetic retinopathy under limited medical resources: A multicenter diagnostic study. Front Endocrinol (Lausanne). (2023) 13:1099302. doi: 10.3389/fendo.2022.1099302
17. Wang G-X, Hu X-Y, Zhao H-X, Li H-L, Chu S-F, and Liu D-L. Development and validation of a diabetic retinopathy risk prediction model for middle-aged patients with type 2 diabetes mellitus. Front Endocrinol (Lausanne). (2023) 14:1132036. doi: 10.3389/fendo.2023.1132036
18. Gong D, Fang L, Cai Y, Chong I, Guo J, Yan Z, et al. Development and evaluation of a risk prediction model for diabetes mellitus type 2 patients with vision-threatening diabetic retinopathy. Front Endocrinol (Lausanne). (2023) 14:1244601. doi: 10.3389/fendo.2023.1244601
19. Zhao Y, Li X, Li S, Dong M, Yu H, Zhang M, et al. Using machine learning techniques to develop risk prediction models for the risk of incident diabetic retinopathy among patients with type 2 diabetes mellitus: A cohort study. Front Endocrinol (Lausanne). (2022) 13:876559. doi: 10.3389/fendo.2022.876559
20. Yang H, Xia M, Liu Z, Xing Y, Zhao W, Li Y, et al. Nomogram for prediction of diabetic retinopathy in patients with type 2 diabetes mellitus: A retrospective study. J Diabetes Complications. (2022) 36:108313. doi: 10.1016/j.jdiacomp.2022.108313
21. Nugawela MD, Gurudas S, Prevost AT, Mathur R, Robson J, Sathish T, et al. Development and validation of predictive risk models for sight threatening diabetic retinopathy in patients with type 2 diabetes to be applied as triage tools in resource limited settings. eClinicalMedicine. (2022) 51:101578. doi: 10.1016/j.eclinm.2022.101578
22. Li Y, Li C, Zhao S, Yin Y, Zhang X, and Wang K. Nomogram for prediction of diabetic retinopathy among type 2 diabetes population in Xinjiang, China. Diabetes Metab Syndrome Obesity: Targets Ther. (2022) 15:1077–89. doi: 10.2147/DMSO.S354611
23. Jo K, Chang DJ, Min JW, Yoo Y-S, Lyu B, Kwon JW, et al. Long-term prediction models for vision-threatening diabetic retinopathy using medical features from data warehouse. Sci Rep. (2022) 12:8476. doi: 10.1038/s41598-022-12369-0
24. Su B. Using metabolic and biochemical indicators to predict diabetic retinopathy by back-propagation artificial neural network. Diabetes Metab Syndrome Obesity: Targets Ther. (2021) 14:4031–41. doi: 10.2147/DMSO.S322224
25. Li W-Y, Luo L, Nie C, and Zhang M-N. An online diabetic retinopathy screening tool for patients with type 2 diabetes. Int J Ophthalmology. (2021) 14:1748–55. doi: 10.18240/ijo.2021.11.15
26. Li W, Song Y, Chen K, Ying J, Zheng Z, Qiao S, et al. Predictive model and risk analysis for diabetic retinopathy using machine learning: a retrospective cohort study in China. BMJ Open. (2021) 11:e050989. doi: 10.1136/bmjopen-2021-050989
27. Mo R, Shi R, Hu Y, and Hu F. Nomogram-based prediction of the risk of diabetic retinopathy: A retrospective study. J Diabetes Res. (2020) 2020:1–9. doi: 10.1155/2020/7261047
28. Oh E, Yoo TK, and Park E-C. Diabetic retinopathy risk prediction for fundus examination using sparse learning: a cross-sectional study. BMC Med Inform Decis Mak. (2013) 13:106. doi: 10.1186/1472-6947-13-106
29. Gu K-M, Min SH, and Cho J. Sleep duration and mortality in patients with diabetes: Results from the 2007–2015 Korea national health and nutrition examination survey. Diabetes Metab. (2022) 48:101312. doi: 10.1016/j.diabet.2021.101312
30. Mueller-Using S, Feldt T, Sarfo FS, and Eberhardt KA. Factors associated with performing tuberculosis screening of HIV-positive patients in Ghana: LASSO-based predictor selection in a large public health data set. BMC Public Health. (2016) 16:563. doi: 10.1186/s12889-016-3239-y
31. Lee H, Lee DS, Kang H, Kim B-N, and Chung MK. Sparse brain network recovery under compressed sensing. IEEE Trans Med Imaging. (2011) 30:1154–65. doi: 10.1109/TMI.2011.2140380
32. Liew BXW, Kovacs FM, Rügamer D, and Royuela A. Machine learning versus logistic regression for prognostic modelling in individuals with non-specific neck pain. Eur Spine J. (2022) 31:2082–91. doi: 10.1007/s00586-022-07188-w
33. Park S and Byun J. A study of predictive models for early outcomes of post-prostatectomy incontinence: machine learning approach vs. Logistic regression analysis approach. Appl Sci. (2021) 11:6225. doi: 10.3390/app11136225
34. Paulose-Ram R, Graber JE, Woodwell D, and Ahluwalia N. The national health and nutrition examination survey (NHANES), 2021–2022: adapting data collection in a COVID-19 environment. Am J Public Health. (2021) 111:2149–56. doi: 10.2105/AJPH.2021.306517
35. Riley RD, Ensor J, Snell KIE, Debray TPA, Altman DG, Moons KGM, et al. External validation of clinical prediction models using big datasets from e-health records or IPD meta-analysis: opportunities and challenges. BMJ. (2016) 353:i3140. doi: 10.1136/bmj.i3140
36. Gupta R, Kotecha M, and Bansal P. Frequency of diabetic retinopathy in patients with diabetes mellitus and its correlation with duration of diabetes mellitus. Med J Dr DY Patil University. (2013) 6:366. doi: 10.4103/0975-2870.118267
37. Liu Y, Yang J, Tao L, Lv H, Jiang X, Zhang M, et al. Risk factors of diabetic retinopathy and sight-threatening diabetic retinopathy: a cross-sectional study of 13–473 patients with type 2 diabetes mellitus in mainland China. BMJ Open. (2017) 7:e016280. doi: 10.1136/bmjopen-2017-016280
38. Middleton TL, Constantino MI, Molyneaux L, D'Souza M, Twigg SM, Wu T, et al. Young-onset type 2 diabetes and younger current age: increased susceptibility to retinopathy in contrast to other complications. Diabetes Med. (2020) 37:991–9. doi: 10.1111/dme.14238
39. Cho NH, Kim TH, Woo SJ, Park KH, Lim S, Cho YM, et al. Optimal HbA1c cutoff for detecting diabetic retinopathy. Acta Diabetol. (2013) 50:837–42. doi: 10.1007/s00592-013-0452-3
40. Zhang B, Zhang B, Zhou Z, Guo Y, and Wang D. The value of glycosylated hemoglobin in the diagnosis of diabetic retinopathy: a systematic review and Meta-analysis. BMC Endocr Disord. (2021) 21:82. doi: 10.1186/s12902-021-00737-2
41. Hsieh Y-T, Tsai M-J, Tu S-T, and Hsieh M-C. Association of abnormal renal profiles and proliferative diabetic retinopathy and diabetic macular edema in an asian population with type 2 diabetes. JAMA Ophthalmology. (2018) 136:68. doi: 10.1001/jamaophthalmol.2017.5202
42. Dai L, Wu L, Li H, Cai C, Wu Q, Kong H, et al. A deep learning system for detecting diabetic retinopathy across the disease spectrum. Nat Commun. (2021) 12:3242. doi: 10.1038/s41467-021-23458-5
43. Bora A, Balasubramanian S, Babenko B, Virmani S, Venugopalan S, Mitani A, et al. Predicting the risk of developing diabetic retinopathy using deep learning. Lancet Digital Health. (2021) 3:e10–e9. doi: 10.1016/S2589-7500(20)30250-8
44. Collins GS, Dhiman P, Andaur Navarro CL, Ma J, Hooft L, Reitsma JB, et al. Protocol for development of a reporting guideline (TRIPOD-AI) and risk of bias tool (PROBAST-AI) for diagnostic and prognostic prediction model studies based on artificial intelligence. BMJ Open. (2021) 11:e048008. doi: 10.1136/bmjopen-2020-048008
Keywords: diabetes, diabetic retinopathy (DR), predictive modeling, risk factors, systematic review
Citation: Huang H, Wu Y, Ye H, Li J, Chen L and Huang X (2025) Risk prediction models for diabetic retinopathy: a systematic review. Front. Endocrinol. 16:1556049. doi: 10.3389/fendo.2025.1556049
Received: 06 January 2025; Accepted: 25 June 2025;
Published: 11 July 2025.
Edited by:
Tomislav Bulum, Medical School University of Zagreb, CroatiaReviewed by:
Rachel Basques Caligiorne, Grupo Santa Casa BH, BrazilJohn Vincent Forrester, University of Aberdeen, United Kingdom
Copyright © 2025 Huang, Wu, Ye, Li, Chen and Huang. This is an open-access article distributed under the terms of the Creative Commons Attribution License (CC BY). The use, distribution or reproduction in other forums is permitted, provided the original author(s) and the copyright owner(s) are credited and that the original publication in this journal is cited, in accordance with accepted academic practice. No use, distribution or reproduction is permitted which does not comply with these terms.
*Correspondence: Yingmin Wu, d3V5aW5nbWluQGNkdXRjbS5lZHUuY24=