 Bo Zhao1†
 Fengyan Tang
 Zhaoxiang Wang
- 1Department of Cardiology, Affiliated Kunshan Hospital of Jiangsu University, Kunshan, Jiangsu, China
- 2Department of Endocrinology, Affiliated Kunshan Hospital of Jiangsu University, Kunshan, Jiangsu, China
Purpose: The estimated glucose disposal rate (eGDR) serves as a straightforward and noninvasive indicator of insulin resistance (IR). This study aims to explore the association between eGDR and the risk of abdominal aortic calcification (AAC).
Methods: We utilized data from adult participants (≥40 years old, n=3006) from the 2013–2014 National Health and Nutrition Examination Survey (NHANES) database. AAC was measured by dual-energy X-ray absorptiometry and quantified using the Kauppila score. Severe AAC (SAAC) was defined as an AAC score > 6. Logistic regression, restricted cubic spline (RCS), and subgroup analysis were used to analyze the relationship between eGDR and SAAC risk.
Results: In fully adjusted models, eGDR was found to be negatively associated with SAAC (OR=0.86, 95%CI:0.79–0.94, P<0.001). Compared to participants in the lowest eGDR quantile, those in the highest quantile exhibited a lower risk of SAAC (OR=0.47, 95%CI:0.25–0.91, P=0.026). The RCS analysis indicates a nonlinear relationship between eGDR and SAAC risk, with a turning point at 7.05 mg/kg/min. Subgroup analysis showed that the association between eGDR and SAAC risk was more significant in women.
Conclusions: The degree of IR assessed by eGDR is associated with SAAC risk. The eGDR shows promise as an epidemiological tool for evaluating the influence of IR on AAC.
1 Introduction
Abdominal aortic calcification (AAC) is a common vascular lesion characterized by the deposition of calcium salts on the abdominal aorta walls, leading to stiffening and reduced elasticity of the aortic walls (1). AAC is commonly detected through imaging techniques such as X-ray and computed tomography (CT) (2, 3). Numerous studies have demonstrated that its degree of calcification is closely associated with the risk of cardiovascular diseases (4). AAC is prevalent in the general population and is closely associated with a variety of factors (5). Metabolic conditions such as hyperlipidemia, diabetes, hypertension, and metabolic syndrome significantly contribute to its progression (4, 6–8).
As an early warning signal of disease, identifying the risk factors for AAC is especially important for preventing its progression. Insulin resistance (IR), a key feature of metabolic dysfunction, refers to a clinical condition characterized by reduced sensitivity and responsiveness to insulin (9). The presence of IR accelerates the progression of AAC, the severity of AAC could also reflect the cumulative effects of metabolic disturbances associated with IR (10, 11). While the hyperinsulinemic-euglycemic clamp remains the gold standard for detecting IR, its use in large-scale epidemiological studies is limited due to its demanding and time-intensive process (12). Recently, estimated glucose disposal rate (eGDR) has emerged as a simpler and reliable surrogate marker for IR (13). Calculated using hemoglobin A1c (HbA1c), waist circumference (WC), and hypertension status, the eGDR demonstrates an inverse association with the severity of IR (14). Prior research has also demonstrated a link between eGDR levels and the risk of cardiovascular events and mortality (15–18).
However, it remains unclear whether eGDR can effectively identify individuals at higher risk of AAC. Therefore, we aim to investigate this association in the U.S. general population using data from the National Health and Nutrition Examination Survey (NHANES) database. We hypothesize that higher eGDR levels are negatively associated with the severity of AAC.
Recent studies on IR and vascular calcification have predominantly relied on traditional markers such as the Homeostasis Model Assessment of Insulin Resistance (HOMA-IR) and the Triglyceride-Glucose (TyG) index (10, 19, 20). However, these metrics may not adequately capture the full metabolic complexity of IR. Evidence from prior research has demonstrated that the eGDR exhibits superior predictive capabilities when compared to HOMA-IR and the TyG index (21–23). Therefore, this study leverages eGDR, a comprehensive metric that integrates key components of metabolic syndrome, including glycemic control, central obesity, and hypertension. Utilizing data from the nationally representative National Health and Nutrition Examination Survey (NHANES) cohort, this investigation seeks to establish eGDR as a valuable tool for AAC risk stratification, thereby informing more effective and targeted prevention strategies.
2 Materials and methods
2.1 Study population
Data for this study were drawn from NHANES, a survey conducted by the National Center for Health Statistics at the Centers for Disease Control and Prevention. The survey used a stratified, randomized, multi-stage sampling approach to ensure a nationally representative sample. Participants underwent physical examinations, completed health and nutrition surveys, and participated in laboratory tests. The NHANES protocol was reviewed and approved by the Ethics Review Board of the National Center for Health Statistics (NCHS), and written informed consent was collected from all participants (https://www.cdc.gov/nchs/nhanes/irba98.htm). Detailed methodologies and datasets are available at https://www.cdc.gov/nchs/nhanes/. This study focused on NHANES 2013–2014 data, selecting 3006 participants aged 40 or older with complete eGDR and AAC data.
2.2 Definition of eGDR and SAAC
The eGDR (mg/kg/min) serves as an indicator of IR and is determined using the following formula: eGDR = 21.158 − (0.09 × WC) − (3.407 × HTN) − (0.551 × HbA1c), where WC represents waist circumference (cm), HTN indicates hypertension status (yes = 1, no = 0), and HbA1c refers to glycated hemoglobin (%) (16). The AAC severity was assessed using the AAC score system, which was exclusively derived from the NHANES 2013–2014 dataset. This score, based on the Kauppila scoring method and measured through dual-energy X-ray absorptiometry (DXA, Densitometer Discovery A, Hologic, Marlborough, MA, USA), ranged from 0 to 24, with higher values indicating more severe calcification. An AAC score exceeding 6 was classified as severe AAC (SAAC) (24). Both the AAC scores, and SAAC were utilized as outcome variables in this research.
2.3 Assessment of covariates
The covariates considered in this study included demographic factors (age, gender, race), socio-economic variables (marital status, income, education), smoking history, health conditions (hypertension, diabetes, cardiovascular disease), body mass index (BMI), WC, HbA1c, bone metabolism (serum calcium, phosphorus, total 25-hydroxyvitamin D), serum creatinine (Scr), and estimated glomerular filtration rate (eGFR). The eGFR was estimated using the Chronic Kidney Disease Epidemiology Collaboration (CKD-EPI) equation, which incorporates age, gender, race, and Scr levels (25). Diabetes was determined through self-reported physician diagnoses, fasting plasma glucose (FPG) levels of ≥7.0 mmol/L, HbA1c levels of ≥6.5%, or the use of antidiabetic drugs. Hypertension was defined based on self-reported physician diagnosis, systolic blood pressure (SBP) ≥140 mmHg, diastolic blood pressure (DBP) ≥90 mmHg, or the use of antihypertensive medications. Cardiovascular diseases were identified based on participants’ self-reported histories of heart attacks, strokes, heart failure, coronary artery disease, or angina.
2.4 Statistical analysis
Statistical analyses adhered to the Centers for Disease Control and Prevention guidelines (CDC) (https://wwwn.cdc.gov/nchs/nhanes/analyticguidelines.aspx), utilizing a complex multistage cluster survey design, and incorporating weights. Continuous variables were presented as mean and 95% confidence interval (CI), while categorical variables were expressed as percentages and 95% CI. Group differences in continuous and categorical variables were evaluated using the weighted Student’s t-test and chi-squared test, respectively. Logistic and linear regression models were employed to examine the association between eGDR and SAAC and AAC scores. Nonlinear relationship between eGDR and SAAC was explored using restricted cubic spline (RCS) analysis. A two-piecewise regression model was employed to identify intervals, and the Log-likelihood ratio test was utilized to assess the existence of a threshold. Subgroup analyses were conducted based on age, gender, race, marital status, smoking, annual household income, education level, BMI, diabetes, and cardiovascular disease, with adjustments for other covariates. Receiver Operating Characteristic (ROC) analysis was conducted to evaluate and compare the performance of eGDR and other insulin resistance (IR) indices, including Metabolic Score for Insulin Resistance (METS-IR), TyG, HOMA-IR, and Triglyceride-to-High-Density Lipoprotein Cholesterol Ratio (TG/HDL-c) in assessing SAAC risk. All statistical analyses in this research were performed using Empower software (http://www.empowerstats.com) and R software (http://www.R-project.org), with a two-sided P value < 0.05 considered statistically significant.
3 Results
3.1 Baseline characteristics of study population
The study included 3006 participants, with a mean age of 57.43 years. The racial composition was 6.92% Mexican Americans, 9.93% Non-Hispanic Blacks, 71.32% Non-Hispanic Whites, 4.68% Other Hispanics, and 7.15% from other racial groups. Of these, 270 participants were diagnosed with SAAC. A weighted analysis was performed to compare the general and clinical characteristics of participants with and without SAAC (Table 1). Results demonstrated that participants with SAAC tended to be older, unmarried, smokers, and had higher rates of diabetes, hypertension, cardiovascular disease, HbA1c, Scr, total 25-hydroxyvitamin D, and AAC scores (P<0.01). In contrast, they showed reduced levels of BMI, eGFR, educational attainment, and annual household income (P<0.01). The differences in racial distribution were also statistically significant (P<0.001). Notably, eGDR levels were reduced in the SAAC group compared to the non-SAAC group (P<0.001).
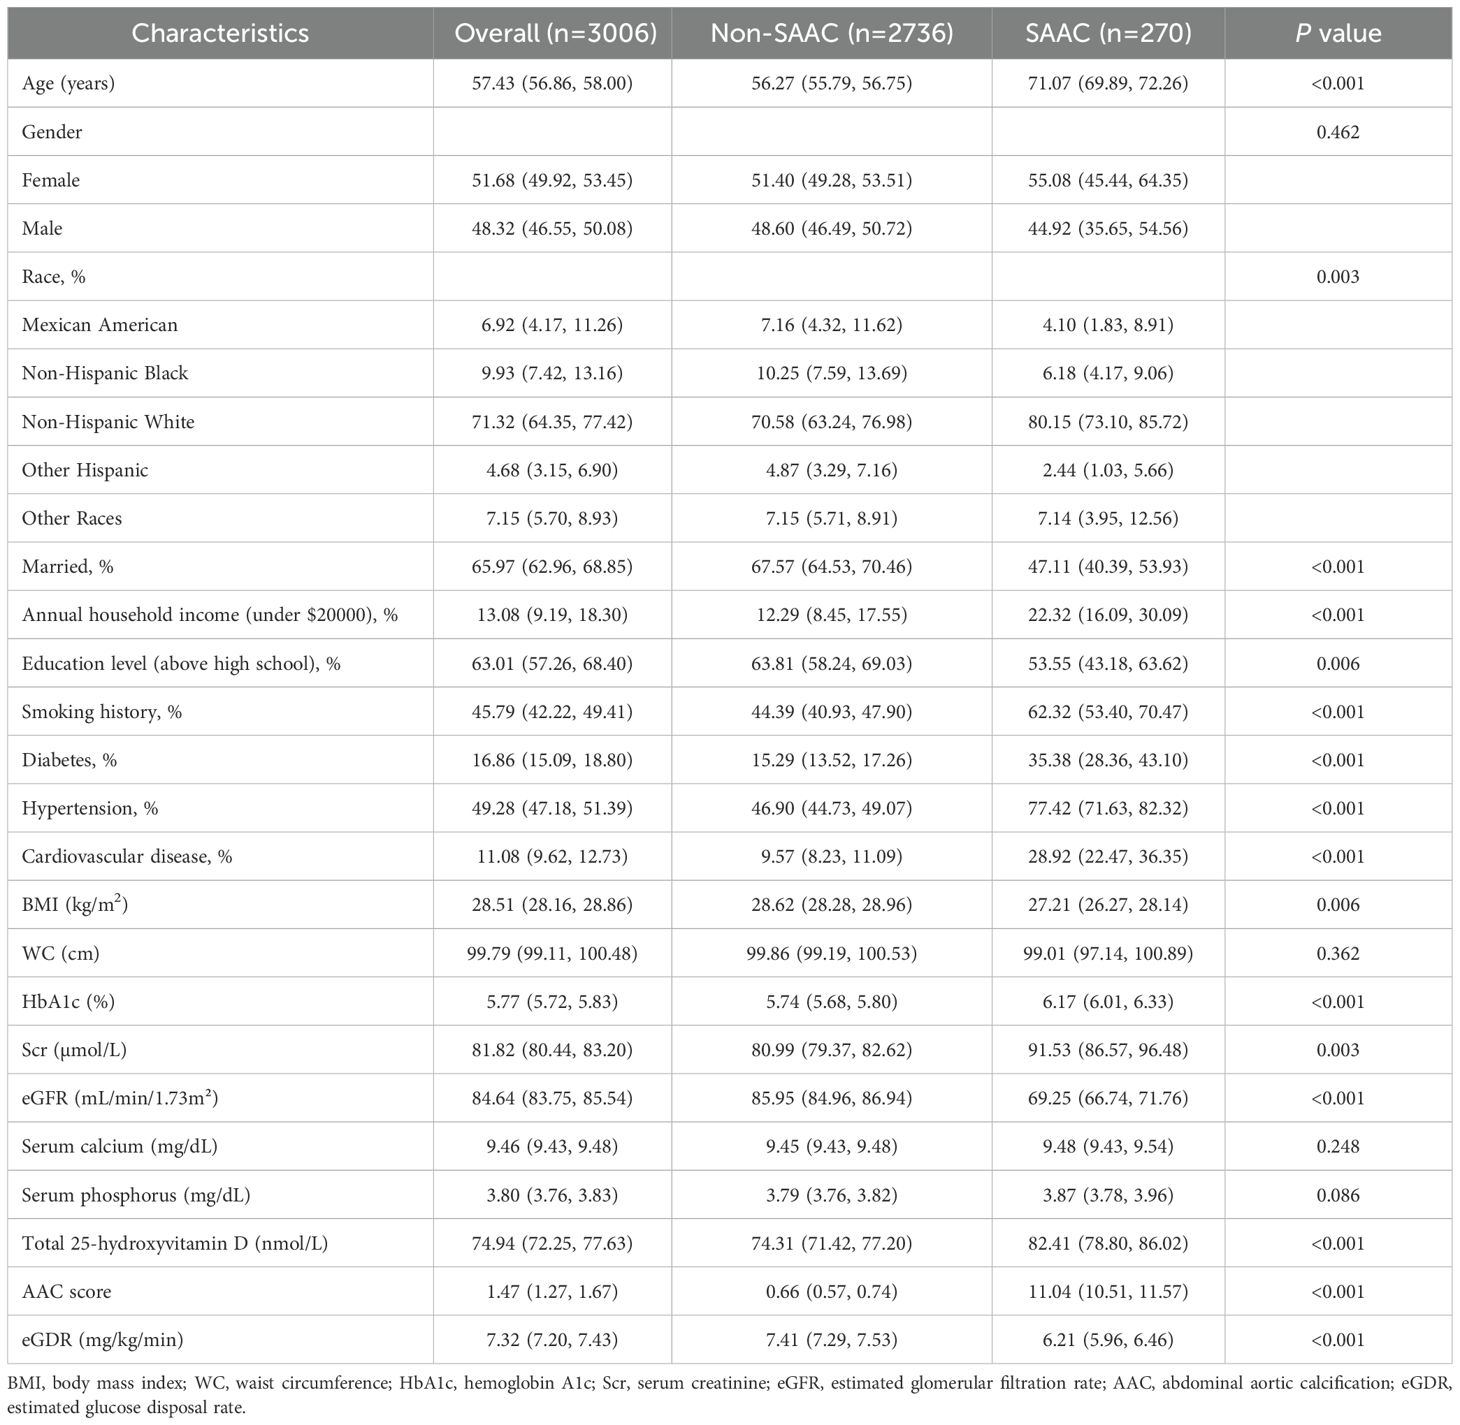
Table 1. Baseline characteristics of the study population.
3.2 The relationship between eGDR and AAC risk
A significant negative association between eGDR and SAAC risk was identified through logistic regression analysis (Table 2) (P<0.05). Without adjusting for covariates, higher eGDR levels were linked to a decreased likelihood of SAAC (OR=0.84, 95%CI:0.80–0.89, P<0.001). This association persisted after covariate adjustments in Model 2 and Model 3, with ORs of 0.94 and 0.86, respectively (P<0.05). After fully adjusting for confounders and stratifying eGDR into quartiles (Q1 to Q4), the risk of SAAC showed a progressive increase of 48% in Q2, while it decreased by 15% and 53% in Q3 and Q4, respectively (P for trend<0.01). Linear regression analysis also showed a correlation between eGDR levels and AAC scores (β=-0.14, 95%CI: -0.21–0.07, P<0.001) (Table 3).
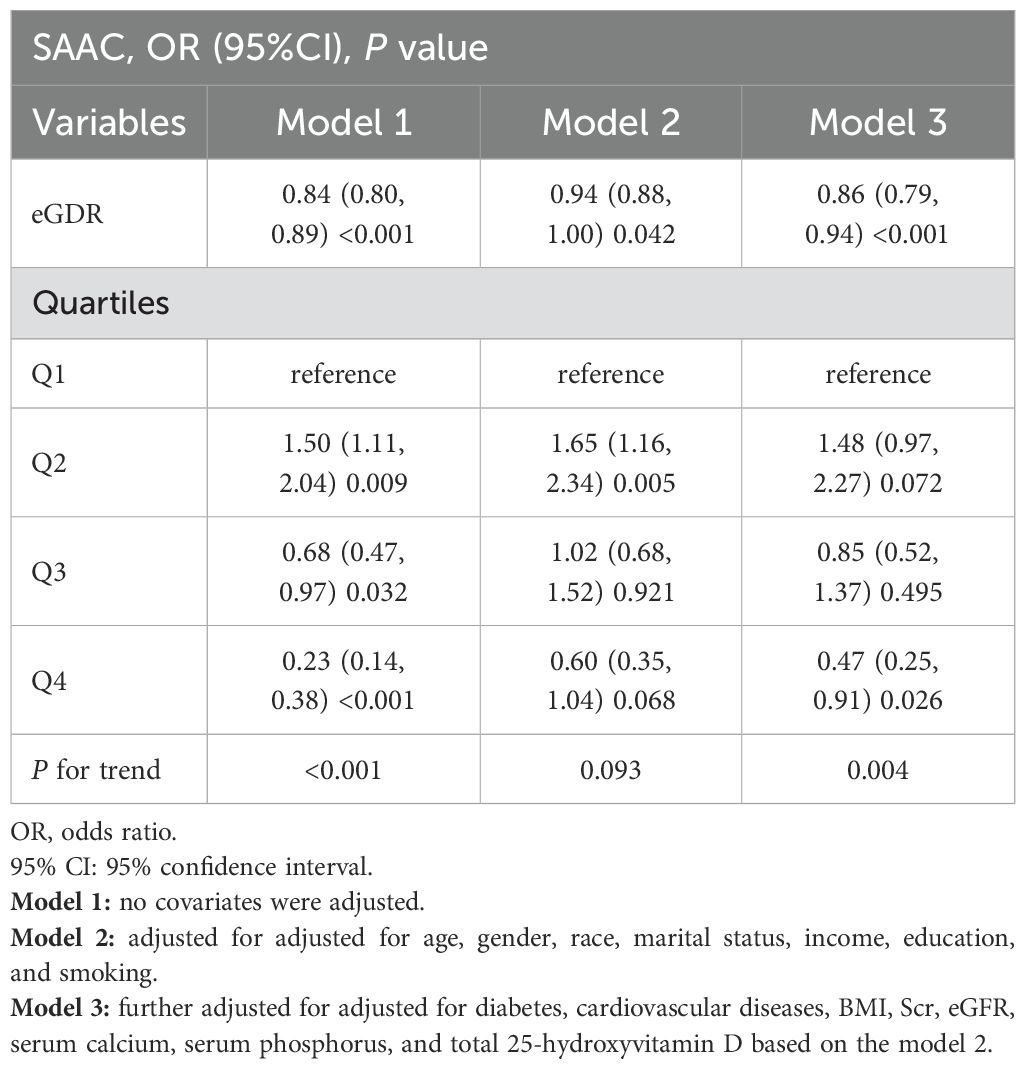
Table 2. Logistic regression analysis results of eGDR and SAAC.
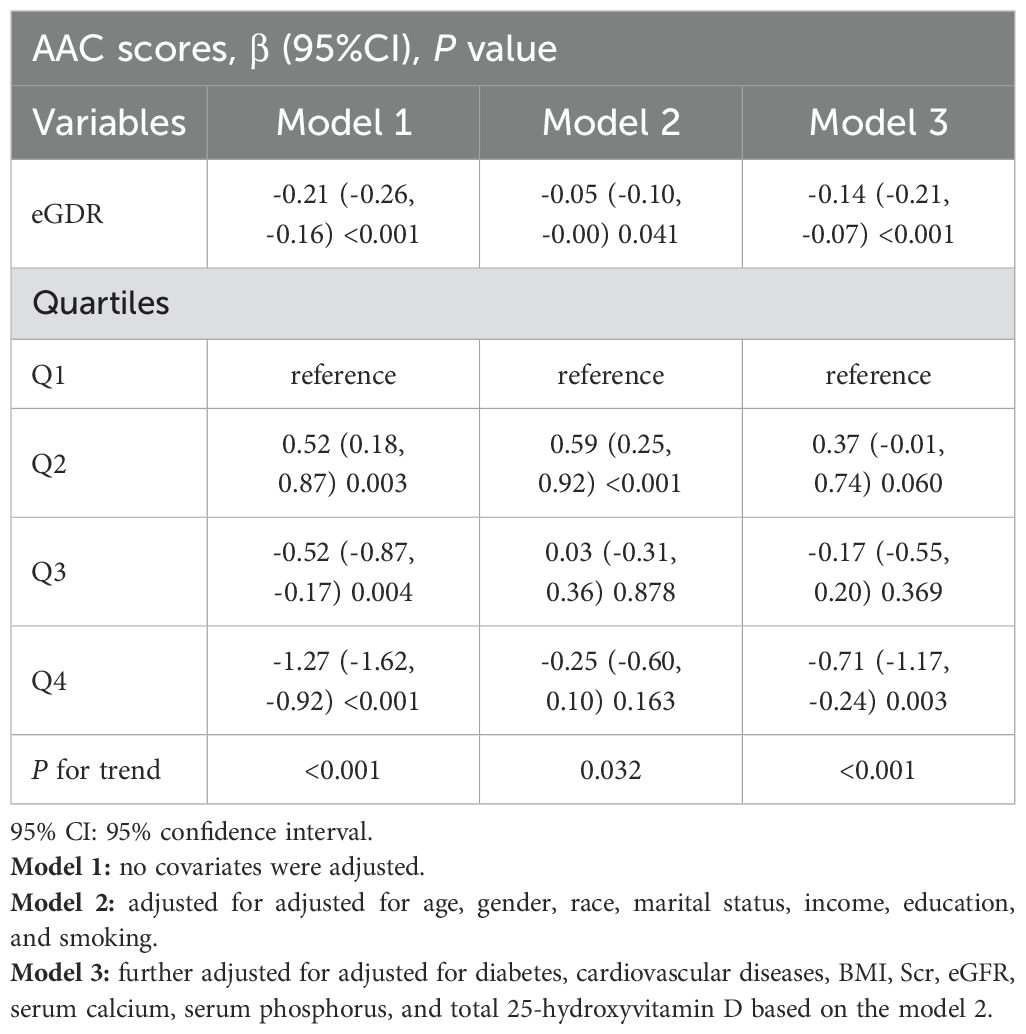
Table 3. Linear regression analysis results of eGDR and AAC scores.
3.3 RCS analysis
Multivariate logistic regression analysis indicated there is a potential nonlinear relationship between eGDR and SAAC risk. To further explore this association, we conducted an RCS analysis, which revealed an inverted U-shaped relationship (Figure 1) (P for nonlinear=0.043). We also employed segmented regression analyses to investigate the association between eGDR and SAAC risk, identifying a threshold value of 7.05 mg/kg/min for eGDR (Table 4). When the eGDR exceeded 7.05 mg/kg/min, each 1-unit increase in eGDR was associated with a 28% reduction in the risk of SAAC (OR=0.72, 95%CI:0.61–0.85, P<0.001). When the eGDR was below 7.05 mg/kg/min, no notable correlation with SAAC risk could be identified (P=0.771).
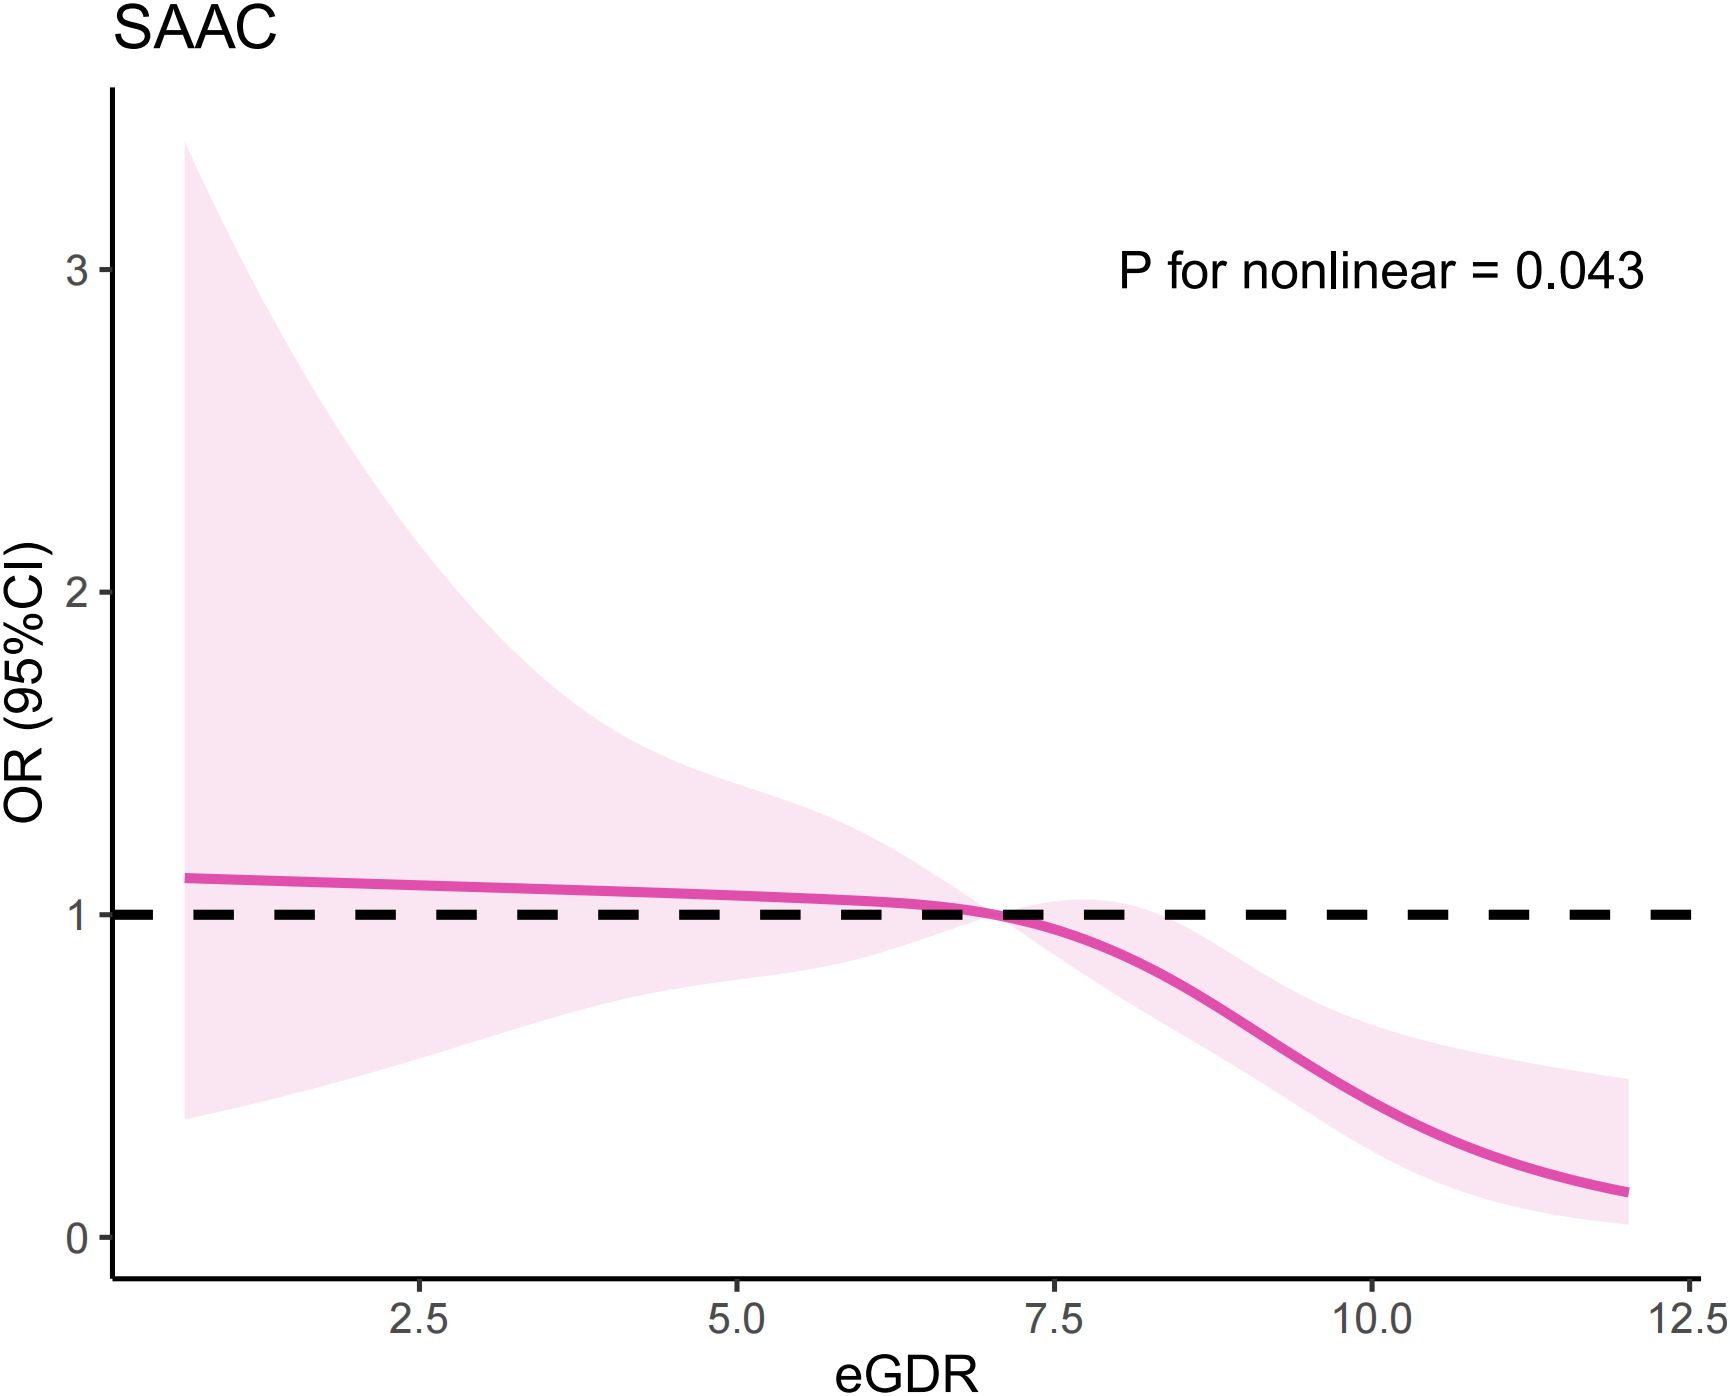
Figure 1. The results of RCS analysis.
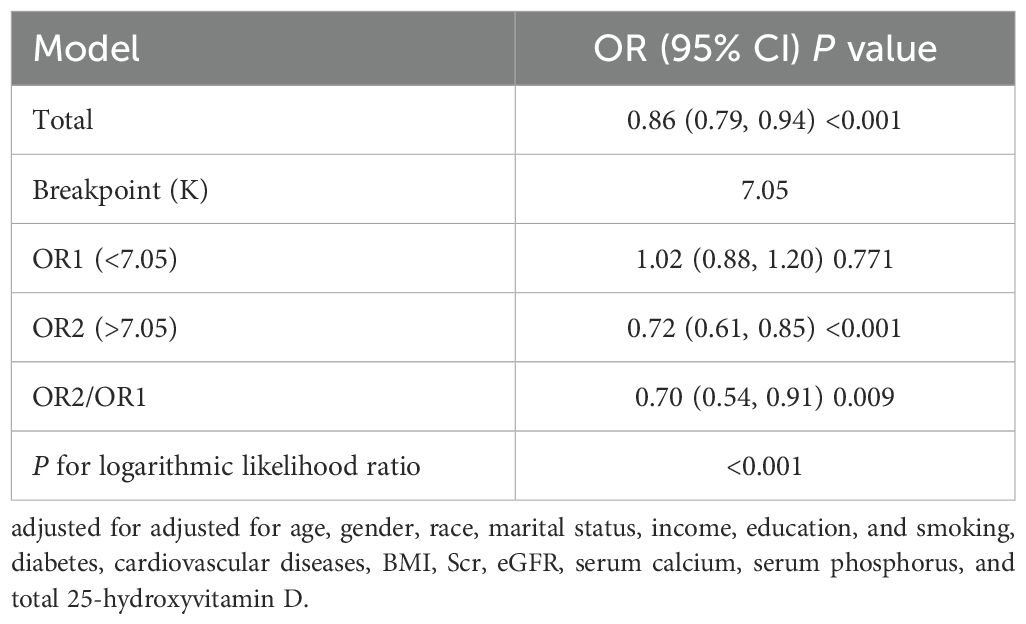
Table 4. Threshold effect analysis of eGDR on SAAC risk.
3.4 Subgroup analyses
In subgroup analyses stratified by age, gender, race, marital status, smoking, annual household income, education level, BMI, diabetes, and cardiovascular disease, the relationship between eGDR on SAAC risk appeared to be more pronounced in females than in males (P for interaction=0.042) (Figure 2). Additionally, the relationship remained consistent across other subgroups defined by the other variables (P for interaction>0.05).
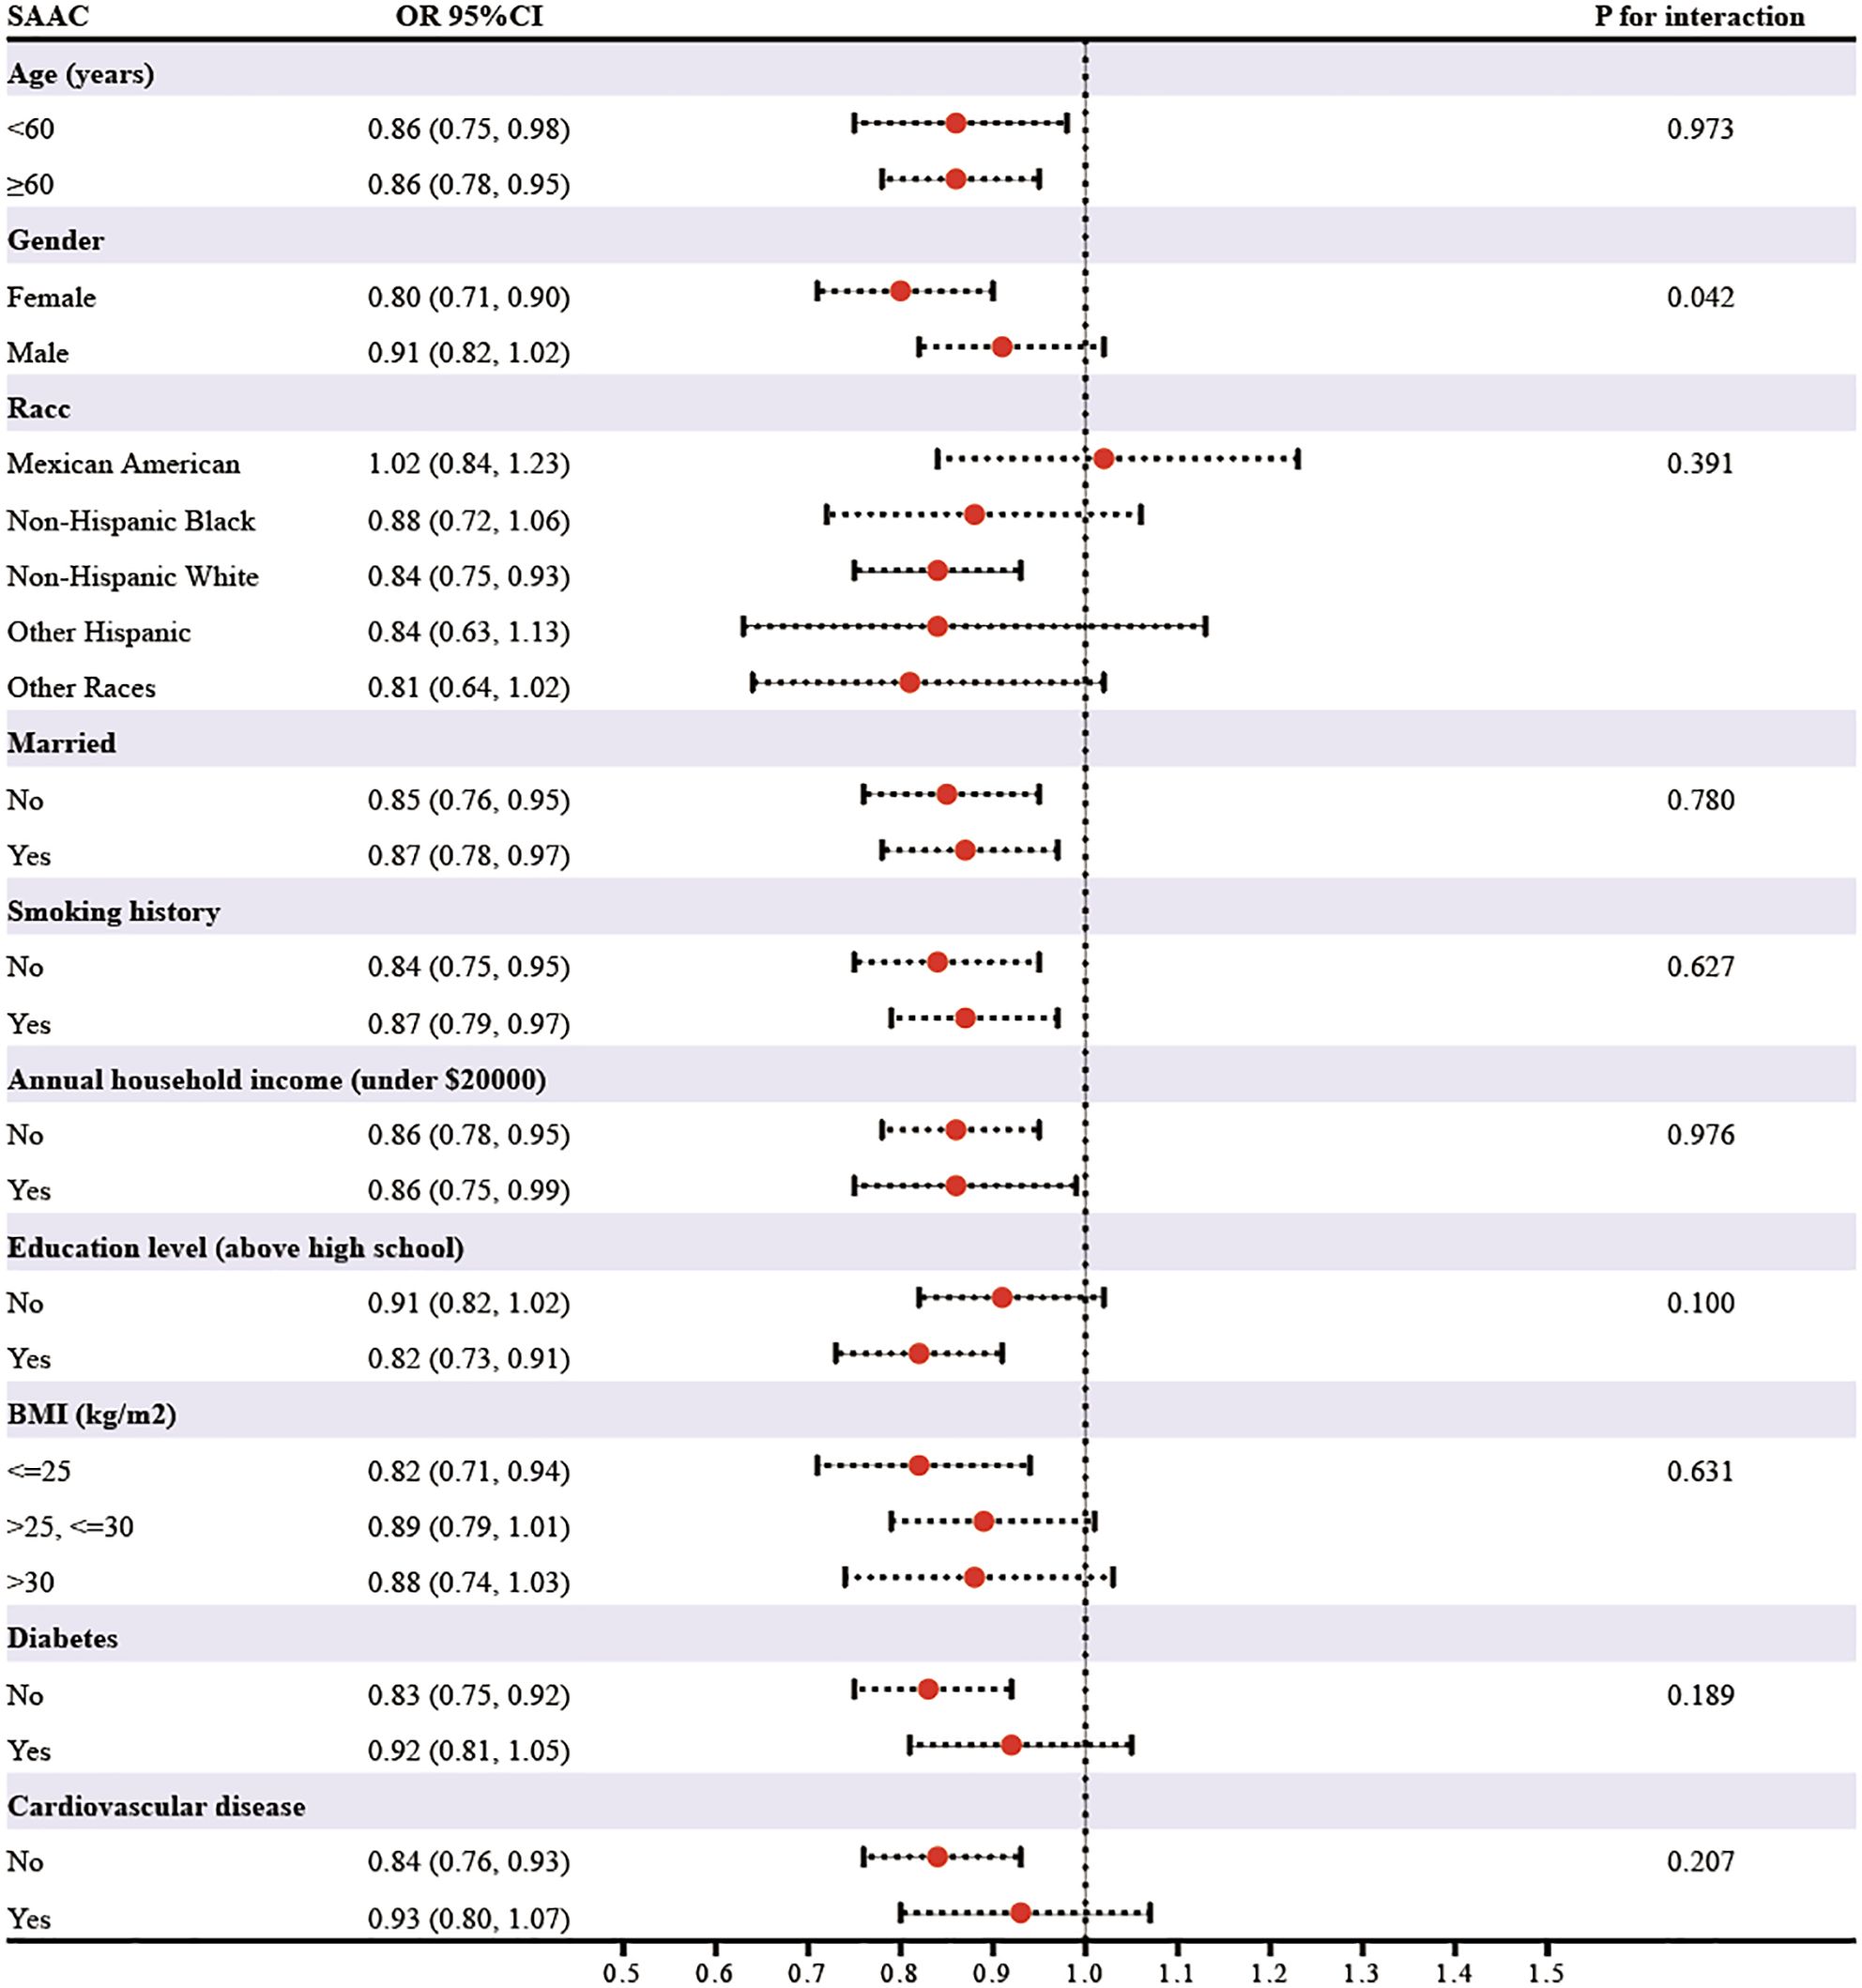
Figure 2. The results of subgroup analysis.
3.5 ROC analysis
The predictive accuracy of eGDR and other IR indices (METS-IR, TyG, HOMA-IR, and TG/HDL-c) for SAAC risk was evaluated using ROC curve analyses, as shown in Figure 3. METS-IR was calculated as Ln [(2× fasting plasma glucose × triglycerides × BMI)/high density lipoprotein-cholesterol] (26), and the TyG index as Ln [triglycerides × fasting plasma glucose/2] (20). HOMA-IR was computed as fasting plasma glucose × fasting insulin/22.5 (27). The TG/HDL-c was calculated by dividing triglycerides by high density lipoprotein-cholesterol (28). Compared to other IR indices, eGDR showed higher performance power for SAAC risk. The area under the curve (AUC) values were: eGDR, 62.5%; METS-IR, 56.7%; TyG, 54.5%; HOMA-IR, 52.1%; and TG/HDL-c, 49.1%.
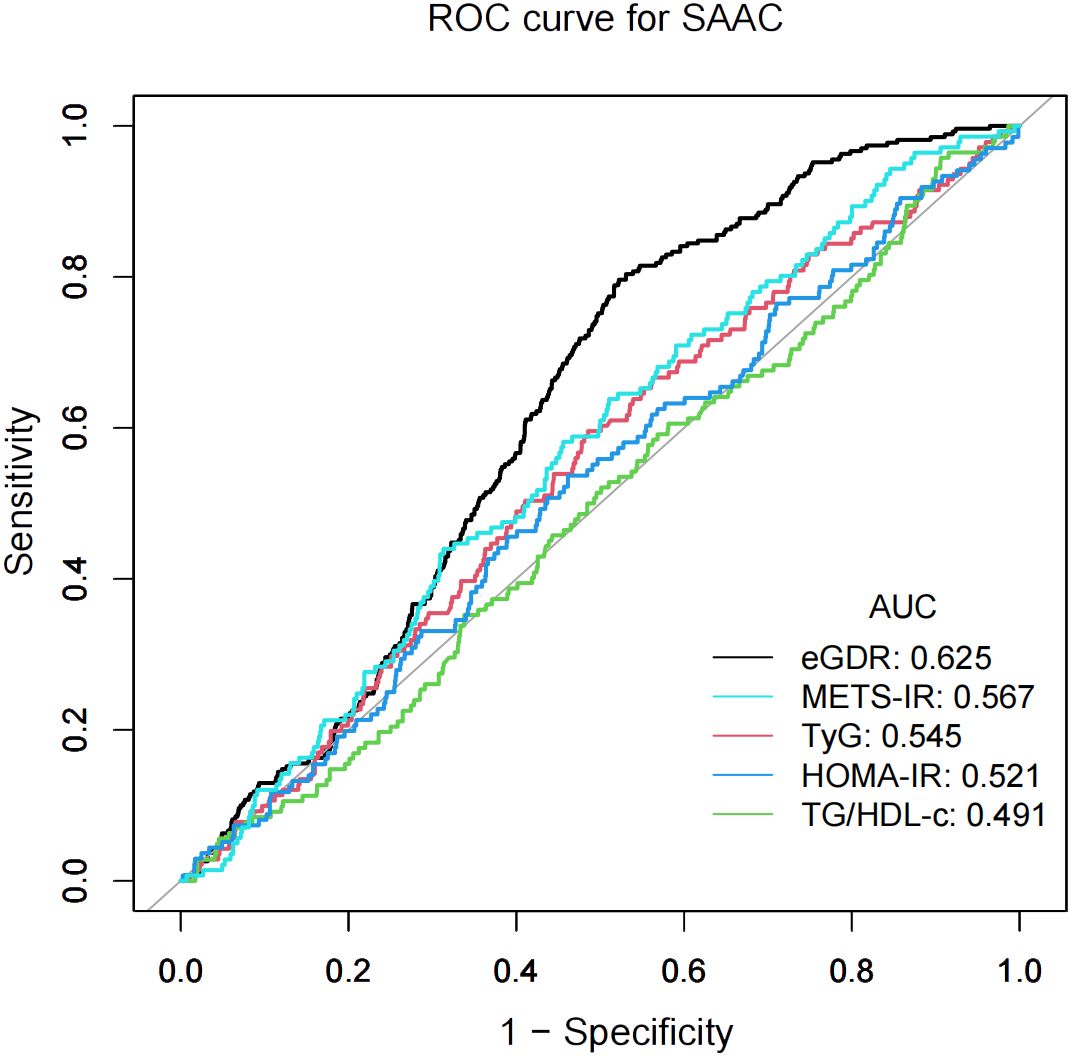
Figure 3. The results of ROC analysis.
4 Discussion
In this cross-sectional study, we found that higher eGDR levels were associated with a reduced risk of SAAC in the general population of the United States. A nonlinear relationship was observed between the two, with a turning point at 7.05 mg/kg/min. Improving IR might help mitigate the risk of AAC.
The eGDR is a marker of insulin sensitivity, strongly linked to metabolic syndrome, diabetes, and related complications (29). Lower eGDR values suggest IR (17). Our study highlights the association between eGDR and AAC, offering new insights into the connection between IR and atherosclerosis (30). Previous studies have also highlighted the nonlinear association between eGDR and the risk of cardiovascular disease mortality (14). Song et al. also further reported a significant negative relationship between eGDR and arterial stiffness, whereas the TyG index and HOMA-IR did not exhibit any meaningful correlation with arterial stiffness (21). According to the results of our ROC analysis, eGDR was more effective in predicting the risk of SAAC compared with other IR indices. The nonlinear relationship may reflect the complexity of the impact of IR on vascular calcification. Within a defined range, an increase in eGDR, which indicates improved insulin sensitivity, does not substantially decrease the risk of SAAC. However, a critical threshold appears to exist, beyond which increases in eGDR are associated with a marked reduction in SAAC risk. This threshold effect highlights the potential protective role of improved insulin sensitivity against vascular calcification, particularly in individuals transitioning from moderate to high eGDR levels. On the other hand, the more pronounced association in women may reflect sex-specific variations in hormonal and metabolic responses. Estrogen, particularly in premenopausal women, is recognized for its protective role in vascular health, potentially enhancing the beneficial effects of improved insulin sensitivity on vascular calcification (31, 32). This could explain the greater reduction in SAAC risk observed in women. Moreover, women may have heightened sensitivity to changes in insulin resistance-related pathways, which could magnify the influence of eGDR on AAC risk (33, 34). On the other hand, men may display a weaker association due to differences in hormonal regulation and vascular remodeling dynamics (31). In summary, our study establishes eGDR as the first IR marker to show both threshold-dependent and sex-specific associations with AAC risk. Unlike traditional IR metrics focused only on glycemic parameters, eGDR integrates central obesity and hypertension, offering a multidimensional measure of metabolic dysfunction and improving its utility in vascular calcification risk stratification. The identification of a specific eGDR threshold provides a clear target for intervention, while the stronger association in women challenges unisex approaches to cardiovascular prevention. These findings advance our understanding of IR-related vascular pathology, linking metabolic dysfunction to subclinical arterial disease, and position eGDR as a valuable tool for both epidemiology and clinical decision-making in precision medicine.
The relationship between IR, assessed via eGDR, and AAC, potentially mediated by various mechanisms. Both IR and AAC are strongly tied to chronic low-grade inflammation (35). In the context of IR, adipose tissue produces increased levels of pro-inflammatory mediators like TNF-α and IL-6, which can worsen endothelial dysfunction and accelerate vascular calcification (36, 37). IR can induce oxidative stress through lipotoxicity and glucotoxicity, and oxidative stress further promotes the expression of genes related to vascular calcification (35, 38). On the other hand, hyperglycemia, hyperinsulinemia, and lipid metabolism disturbances, which often accompany IR, may promote vascular calcification through pathways such as the formation of advanced glycation end products (AGEs) and lipid accumulation (39, 40). Insulin’s protective anti-inflammatory and anti-apoptotic effects are also reduced in IR, indirectly facilitating vascular calcification (41).
This study has some certain limitations. The cross-sectional design prevents the establishment of a causal relationship between eGDR and AAC. Furthermore, the reliance on the U.S. NHANES database and the inclusion of only adult participants reduce the external validity of the findings. Additionally, the omission of potential confounders, such as metabolic syndrome, metabolic-associated fatty liver disease (MAFLD), and the lack of diabetes classification might have introduced bias. Future research should aim to overcome these limitations by refining confounder control and conducting multicenter prospective studies to better understand this relationship.
5 Conclusion
In a study representative of the national adult population aged 40 and older, the eGDR was found to be linked to AAC risk. The eGDR holds potential as an epidemiological tool for assessing the impact of IR on AAC.
Data availability statement
Publicly available datasets were analyzed in this study. This data can be found here: https://www.cdc.gov/nchs/nhanes/.
Ethics statement
The studies involving humans were approved by the Ethics Review Board of the National Center for Health Statistics (https://www.cdc.gov/nchs/nhanes/irba98.htm). The studies were conducted in accordance with the local legislation and institutional requirements. Written informed consent for participation was not required from the participants or the participants’ legal guardians/next of kin in accordance with the national legislation and institutional requirements.
Author contributions
BZ: Writing – original draft, Writing – review & editing. ZY: Writing – original draft, Writing – review & editing. FT: Writing – original draft, Writing – review & editing. ZF: Writing – original draft, Writing – review & editing. JW: Writing – original draft, Writing – review & editing. ZW: Writing – review & editing.
Funding
The author(s) declare that financial support was received for the research and/or publication of this article. This study was supported by the Clinical Science and Technology Development Foundation of Jiangsu University (JLY20180109), the Suzhou Municipal Science and Technology Development Program (SKY2023028), and the Healthcare Technology Innovation Special Project of Kunshan First People's Hospital (KETDCX202406).
Acknowledgments
We extend our deepest appreciation to the NHANES participants and staff for their essential contributions, along with all team members who supported this work.
Conflict of interest
The authors declare that the research was conducted in the absence of any commercial or financial relationships that could be construed as a potential conflict of interest.
Generative AI statement
The author(s) declare that no Generative AI was used in the creation of this manuscript.
Publisher’s note
All claims expressed in this article are solely those of the authors and do not necessarily represent those of their affiliated organizations, or those of the publisher, the editors and the reviewers. Any product that may be evaluated in this article, or claim that may be made by its manufacturer, is not guaranteed or endorsed by the publisher.
References
1. Bartstra JW, Mali W, Spiering W, de Jong PA. Abdominal aortic calcification: from ancient friend to modern foe. Eur J Prev Cardiol. (2021) 28:1386–91. doi: 10.1177/2047487320919895
2. Mansouri M, Therasse E, Montagnon E, Zhan YO, Lessard S, Roy A, et al. CT analysis of aortic calcifications to predict abdominal aortic aneurysm rupture. Eur Radiol. (2024) 34:3903–11. doi: 10.1007/s00330-023-10429-1
3. Schousboe JT, Lewis JR, Kiel DP. Abdominal aortic calcification on dual-energy X-ray absorptiometry: Methods of assessment and clinical significance. Bone. (2017), 10491–100. doi: 10.1016/j.bone.2017.01.025
4. Bendix EF, Johansen E, Ringgaard T, Wolder M, Starup-Linde J. Diabetes and abdominal aortic calcification-a systematic review. Curr Osteoporos Rep. (2018) 16:42–57. doi: 10.1007/s11914-018-0418-z
5. Szulc P. Abdominal aortic calcification: A reappraisal of epidemiological and pathophysiological data. Bone. (2016), 8425–37. doi: 10.1016/j.bone.2015.12.004
6. Yang SW, Yang HF, Chen YY, Chen WL. Unraveling the link between metabolic syndrome and abdominal aortic calcification. Nutr Metab Cardiovasc Dis. (2021) 31:464–71. doi: 10.1016/j.numecd.2020.10.003
7. Biyik Z, Selcuk NY, Tonbul HZ, Anil M, Uyar M. Assessment of abdominal aortic calcification at different stages of chronic kidney disease. Int Urol Nephrol. (2016) 48:2061–8. doi: 10.1007/s11255-016-1413-x
8. Golledge J. Abdominal aortic calcification: clinical significance, mechanisms and therapies. Curr Pharm Des. (2014) 20:5834–8. doi: 10.2174/1381612820666140212195309
9. Hill MA, Yang Y, Zhang L, Sun Z, Jia G, Parrish AR, et al. Insulin resistance, cardiovascular stiffening and cardiovascular disease. Metabolism. (2021), 119154766. doi: 10.1016/j.metabol.2021.154766
10. Ong KL, McClelland RL, Rye KA, Cheung BM, Post WS, Vaidya D, et al. The relationship between insulin resistance and vascular calcification in coronary arteries, and the thoracic and abdominal aorta: the Multi-Ethnic Study of Atherosclerosis. Atherosclerosis. (2014) 236:257–62. doi: 10.1016/j.atherosclerosis.2014.07.015
11. Chen Y, Chang Z, Zhao Y, Liu Y, Fu J, Zhang Y, et al. Association between the triglyceride-glucose index and abdominal aortic calcification in adults: A cross-sectional study. Nutr Metab Cardiovasc Dis. (2021) 31:2068–76. doi: 10.1016/j.numecd.2021.04.010
12. Park SE, Park CY, Sweeney G. Biomarkers of insulin sensitivity and insulin resistance: Past, present and future. Crit Rev Clin Lab Sci. (2015) 52:180–90. doi: 10.3109/10408363.2015.1023429
13. Bonora E, Targher G, Alberiche M, Bonadonna RC, Saggiani F, Zenere MB, et al. Homeostasis model assessment closely mirrors the glucose clamp technique in the assessment of insulin sensitivity: studies in subjects with various degrees of glucose tolerance and insulin sensitivity. Diabetes Care. (2000) 23:57–63. doi: 10.2337/diacare.23.1.57
14. Guo R, Tong J, Cao Y, Zhao W. Association between estimated glucose disposal rate and cardiovascular mortality across the spectrum of glucose tolerance in the US population. Diabetes Obes Metab. (2024) 26:5827–35. doi: 10.1111/dom.15954
15. Peng J, Zhang Y, Zhu Y, Chen W, Chen L, Ma F, et al. Estimated glucose disposal rate for predicting cardiovascular events and mortality in patients with non-diabetic chronic kidney disease: a prospective cohort study. BMC Med. (2024) 22:411. doi: 10.1186/s12916-024-03582-x
16. Lu Z, Xiong Y, Feng X, Yang K, Gu H, Zhao X, et al. Insulin resistance estimated by estimated glucose disposal rate predicts outcomes in acute ischemic stroke patients. Cardiovasc Diabetol. (2023) 22:225. doi: 10.1186/s12933-023-01925-1
17. Zhang Z, Zhao L, Lu Y, Xiao Y, Zhou X. Insulin resistance assessed by estimated glucose disposal rate and risk of incident cardiovascular diseases among individuals without diabetes: findings from a nationwide, population based, prospective cohort study. Cardiovasc Diabetol. (2024) 23:194. doi: 10.1186/s12933-024-02256-5
18. He HM, Xie YY, Chen Q, Li YK, Li XX, Mu YK, et al. The additive effect of the triglyceride-glucose index and estimated glucose disposal rate on long-term mortality among individuals with and without diabetes: a population-based study. Cardiovasc Diabetol. (2024) 23:307. doi: 10.1186/s12933-024-02396-8
19. Liu F, Ling Q, Xie S, Xu Y, Liu M, Hu Q, et al. Association between triglyceride glucose index and arterial stiffness and coronary artery calcification: a systematic review and exposure-effect meta-analysis. Cardiovasc Diabetol. (2023) 22:111. doi: 10.1186/s12933-023-01819-2
20. Park K, Ahn CW, Lee SB, Kang S, Nam JS, Lee BK, et al. Elevated TyG index predicts progression of coronary artery calcification. Diabetes Care. (2019) 42:1569–73. doi: 10.2337/dc18-1920
21. Song J, Ma R, Yin L. Associations between estimated glucose disposal rate and arterial stiffness and mortality among US adults with non-alcoholic fatty liver disease. Front Endocrinol (Lausanne). (2024), 151398265. doi: 10.3389/fendo.2024.1398265
22. Liao J, Wang L, Duan L, Gong F, Zhu H, Pan H, et al. Association between estimated glucose disposal rate and cardiovascular diseases in patients with diabetes or prediabetes: a cross-sectional study. Cardiovasc Diabetol. (2025) 24:13. doi: 10.1186/s12933-024-02570-y
23. Chen X, Li A, Ma Q. Association of estimated glucose disposal rate with metabolic syndrome prevalence and mortality risks: a population-based study. Cardiovasc Diabetol. (2025) 24:38. doi: 10.1186/s12933-025-02599-7
24. Cai Z, Liu Z, Zhang Y, Ma H, Li R, Guo S, et al. Associations between life’s essential 8 and abdominal aortic calcification among middle-aged and elderly populations. J Am Heart Assoc. (2023) 12:e031146. doi: 10.1161/jaha.123.031146
25. Levey AS, Stevens LA, Schmid CH, Zhang YL, Castro AF 3rd, Feldman HI, et al. A new equation to estimate glomerular filtration rate. Ann Intern Med. (2009) 150:604–12. doi: 10.7326/0003-4819-150-9-200905050-00006
26. Bello-Chavolla OY, Almeda-Valdes P, Gomez-Velasco D, Viveros-Ruiz T, Cruz-Bautista I, Romo-Romo A, et al. METS-IR, a novel score to evaluate insulin sensitivity, is predictive of visceral adiposity and incident type 2 diabetes. Eur J Endocrinol. (2018) 178:533–44. doi: 10.1530/eje-17-0883
27. González-González JG, Violante-Cumpa JR, Zambrano-Lucio M, Burciaga-Jimenez E, Castillo-Morales PL, Garcia-Campa M, et al. HOMA-IR as a predictor of health outcomes in patients with metabolic risk factors: A systematic review and meta-analysis. High Blood Press Cardiovasc Prev. (2022) 29:547–64. doi: 10.1007/s40292-022-00542-5
28. Nur Zati Iwani AK, Jalaludin MY, Yahya A, Mansor F, Md Zain F, Hong JYH, et al. TG: HDL-C ratio as insulin resistance marker for metabolic syndrome in children with obesity. Front Endocrinol (Lausanne). (2022), 13852290. doi: 10.3389/fendo.2022.852290
29. Kilpatrick ES, Rigby AS, Atkin SL. Insulin resistance, the metabolic syndrome, and complication risk in type 1 diabetes: “double diabetes” in the Diabetes Control and Complications Trial. Diabetes Care. (2007) 30:707–12. doi: 10.2337/dc06-1982
30. Di Pino A, DeFronzo RA. Insulin resistance and atherosclerosis: implications for insulin-sensitizing agents. Endocr Rev. (2019) 40:1447–67. doi: 10.1210/er.2018-00141
31. Woodward HJ, Zhu D, Hadoke PWF, MacRae VE. Regulatory role of sex hormones in cardiovascular calcification. Int J Mol Sci. (2021) 22. doi: 10.3390/ijms22094620
32. Reslan OM, Khalil RA. Vascular effects of estrogenic menopausal hormone therapy. Rev Recent Clin Trials. (2012) 7:47–70. doi: 10.2174/157488712799363253
33. Zanolin ME, Tosi F, Zoppini G, Castello R, Spiazzi G, Dorizzi R, et al. Clustering of cardiovascular risk factors associated with the insulin resistance syndrome: assessment by principal component analysis in young hyperandrogenic women. Diabetes Care. (2006) 29:372–8. doi: 10.2337/diacare.29.02.06.dc05-1478
34. Ormazabal V, Nair S, Elfeky O, Aguayo C, Salomon C, Zuñiga FA. Association between insulin resistance and the development of cardiovascular disease. Cardiovasc Diabetol. (2018) 17:122. doi: 10.1186/s12933-018-0762-4
35. Li Y, Liu Y, Liu S, Gao M, Wang W, Chen K, et al. Diabetic vascular diseases: molecular mechanisms and therapeutic strategies. Signal Transduct Target Ther. (2023) 8:152. doi: 10.1038/s41392-023-01400-z
36. Kern PA, Ranganathan S, Li C, Wood L, Ranganathan G. Adipose tissue tumor necrosis factor and interleukin-6 expression in human obesity and insulin resistance. Am J Physiol Endocrinol Metab. (2001) 280:E745–51. doi: 10.1152/ajpendo.2001.280.5.E745
37. Yuen DY, Dwyer RM, Matthews VB, Zhang L, Drew BG, Neill B, et al. Interleukin-6 attenuates insulin-mediated increases in endothelial cell signaling but augments skeletal muscle insulin action via differential effects on tumor necrosis factor-alpha expression. Diabetes. (2009) 58:1086–95. doi: 10.2337/db08-0775
38. Vilas-Boas EA, Almeida DC, Roma LP, Ortis F, Carpinelli AR. Lipotoxicity and β-cell failure in type 2 diabetes: oxidative stress linked to NADPH oxidase and ER stress. Cells. (2021) 10. doi: 10.3390/cells10123328
39. Khalid M, Petroianu G, Adem A. Advanced glycation end products and diabetes mellitus: mechanisms and perspectives. Biomolecules. (2022) 12. doi: 10.3390/biom12040542
40. Mao L, Yin R, Yang L, Zhao D. Role of advanced glycation end products on vascular smooth muscle cells under diabetic atherosclerosis. Front Endocrinol (Lausanne). (2022), 13983723. doi: 10.3389/fendo.2022.983723
Keywords: ABDOMINAL AORTIC CALCIFICATION, insulin resistance, estimated glucose disposal rate, NHANES, cross-sectional study
Citation: Zhao B, Yu Z, Tang F, Feng Z, Wang J and Wang Z (2025) Insulin resistance assessed by estimated glucose disposal rate and the risk of abdominal aortic calcification: findings from a nationwide cohort study. Front. Endocrinol. 16:1560577. doi: 10.3389/fendo.2025.1560577
Received: 14 January 2025; Accepted: 21 April 2025;
Published: 12 May 2025.
Edited by:
Biao Yan, Fudan University, ChinaReviewed by:
Barbara Ciastek, University of Opole, PolandNathan Cantley, North Bristol NHS Trust, United Kingdom
Copyright © 2025 Zhao, Yu, Tang, Feng, Wang and Wang. This is an open-access article distributed under the terms of the Creative Commons Attribution License (CC BY). The use, distribution or reproduction in other forums is permitted, provided the original author(s) and the copyright owner(s) are credited and that the original publication in this journal is cited, in accordance with accepted academic practice. No use, distribution or reproduction is permitted which does not comply with these terms.
*Correspondence: Zhaoxiang Wang, d2FuZ3poYW94aWFuZzFAa3NybXl5Lm9yZw==
†These authors have contributed equally to this work