 Jing Du
 Xiumei Xu
 Xiaomei Zhang
- Department of Endocrinology and Metabolism, Peking University International Hospital, Beijing, China
Objective: The aim of this study was to investigate the predictive effects of the serum uric acid-to-albumin ratio (sUAR) on the onset of diabetic kidney disease (DKD) in patients with type 2 diabetes mellitus (T2DM).
Methods: A case-control study was conducted involving 1809 patients with T2DM, including 486 cases with DKD and 1323 cases without DKD. Logistic regression and restricted cubic spline (RCS) analyses were used to analyze the relationship between the serum uric acid-to-albumin ratio (sUAR) and DKD. Receiver operating characteristic (ROC) curve was utilized to evaluate the predictive ability of the models for DKD. Decision curve analysis was performed to assess the clinical net benefit of the predictive models.
Results: Multivariable logistic regression analysis revealed that sUAR was an independent risk factor for DKD (adjusted OR: 1.23, 95% CI: 1.16-1.30, P < 0.05). RCS analysis indicated a non-linear relationship between sUAR and DKD (P non-linear < 0.05). When sUAR exceeded 8.30, the risk of DKD gradually increased with higher sUAR. Additionally, combining sUAR with age, T2DM duration, glycated hemoglobin, systolic blood pressure, triglycerides, and high-density lipoprotein cholesterol significantly improved the predictive accuracy for DKD and the clinical net benefit.
Conclusion: High sUAR levels were the independent risk factor of DKD. Moreover, incorporating sUAR with traditional influencing factors enhanced the predictive value for DKD.
1 Introduction
Diabetes mellitus (DM) has emerged as a critical global public health concern, with escalating prevalence rates. According to the latest data from the International Diabetes Federation (IDF), as of 2021, approximately 537 million people worldwide have been diagnosed with DM, and the number of patients will reach 783 million by 2045 (1). Among them, over 90% are classified as type 2 DM (T2DM) (2). Diabetic kidney disease (DKD) is one of the most serious microvascular complications of DM, affecting almost half of the individuals with T2DM (3–5). With the growing diabetic population, the burden of DKD also escalates. Currently, DKD has become the primary cause of chronic kidney disease (CKD) and end-stage renal disease (ESRD) (6). It substantially heightens the risk of cardiovascular events and all-cause mortality (7), leading to severe repercussions for individuals, families, and society. Moreover, it imposes a huge financial burden. Consequently, the proactive identification and management of risk factors linked to DKD are essential to prevent its onset and slow down its progression.
The pathogenesis of DKD involves a complex interplay of various mechanisms, including metabolic disturbances, hemodynamic alterations, and inflammatory response (3, 6). Serum uric acid (sUA) serves as a reliable biomarker for systemic inflammation and nutritional status (8). Elevated levels of sUA are associated with oxidative stress, inflammation, and endothelial dysfunction (9). sUA has been identified as an independent risk factor for CKD (10, 11). A recent Mendelian randomization analysis has further demonstrated a causal association between elevated sUA and the development of CKD (12). In patients with T2DM, previous studies have reported that sUA is closely related to the onset and progression of DKD (5, 13). Albumin (Alb), acting as a negative acute phase reactant, possesses anti-inflammatory and antioxidant properties (14). Studies have demonstrated that Alb is a protective factor in DKD (15) and that lower serum Alb concentration is associated with higher risk of ESRD (16). serum uric acid-to-albumin ratio (sUAR) is a novel composite biomarker with higher predictive value for inflammation and oxidative stress than sUA and Alb alone (17). However, there is a lack of data regarding the association between sUAR and DKD. Therefore, we conducted this study to explore the correlation between sUAR and DKD, and to evaluate its predictive value for DKD.
2 Material and methods
2.1 Ethics statement
The study received approval from the Ethics Committee of Peking University International Hospital [2022-KY-0030-03] and was conducted in adherence with the principles of Helsinki Declaration. In this study, due to its observational and retrospective nature and the absence of any potential harm or involvement of individual identifiable information, the requirement for written informed consent from the subjects was waived.
2.2 Study population
This was a case-control study. Patients admitted to the Department of Endocrinology at Peking University International Hospital from January 2017 to August 2021 were retrospectively reviewed. The inclusion criteria for the study were as follows: 1) adults aged 18 years or older; 2) patients diagnosed with T2DM according to the 1999 World Health Organization criteria; 3) patients with complete medical records. The exclusions criteria were as follows: 1) patients with gestational DM (GDM), type 1 DM (T1DM) or special types of DM; 2) patients with hematuria (including menstrual bleeding), other kidney diseases, or ESRD requiring dialysis; 3) patients with acute diabetic complications (such as ketoacidosis, hyperglycemic hyperosmolar state), acute infectious diseases, heart failure, liver diseases, autoimmune diseases, hematological diseases, and malignant tumors; 4) patients taking medications that could affect sUA and Alb levels. Ultimately, a total of 1,809 patients were included in this study.
2.3 Data collection
Demographic and clinical data, including age, sex, duration of type 2 diabetes mellitus (T2DM), medical history, and medication history, were collected. Blood pressure, weight, and height were measured and recorded by uniformly trained nurses. BMI (body mass index) was calculated as weight (kg)/height squared (m2).
Fasting peripheral venous blood samples were collected from all study subjects to detect the following indicators: glycated hemoglobin (HbA1c), fasting plasma glucose (FBG), high-density lipoprotein cholesterol (HDL-C), low-density lipoprotein cholesterol (LDL-C), total cholesterol (TC), triglycerides (TG), Alb, sUA and serum creatinine (sCr). The estimated glomerular filtration rate (eGFR) was calculated using the CKD-EPI equation (18). sUA and sCr were detected using the rate method. Serum Alb was detected using the bromocresol green method.
Morning urine samples were collected on three separate days to measure the urinary albumin/creatinine ratio (UACR), and the mean UACR (mUACR) was calculated. UACR was measured using the immune turbidimetry method.
2.4 Definitions and classification
The diagnosis of DKD required the presence of at least one of the following criteria, while excluding other causes of CKD: 1) In the absence of interfering factors, at least two out of three tests within 3–6 months showing UACR ≥ 30 mg/g. 2) eGFR < 60 ml/min/1.73 m² persisting for more than 3 months. 3) kidney biopsy demonstrating pathological changes consistent with DKD (19). According to the above diagnostic criteria, participants were divided into DKD and non-DKD group.
All patients were divided into 3 groups based on the tertiles of sUAR. The division criteria were as follows: tertile 1: sUAR < 7.41, tertile 2: 7.41≤ sUAR<9.40, tertile 3: sUAR ≥ 9.40.
2.5 Statistical analysis
Data analysis was performed using SPSS 24.0 and R 4.3.1 software. The normality of continuous data was assessed using the Shapiro-Wilk test. Continuous variables with normal distribution were presented as mean ± standard deviation, t-test was used for comparison between two groups, one-way analysis of variance was used for comparison among multiple groups, followed by post-hoc comparisons using the Bonferroni method (assuming homogeneous variance) or the Welch test (assuming heterogeneous variance); Continuous data with non-normal distribution were expressed as median and interquartile intervals, Mann-Whitney U test was used for comparison between two groups, Kruskal-Wallis H test was employed for comparisons among multiple groups, followed by pairwise comparisons using a rank test. Counting data were presented as frequency and percentage, chi-square test was used to compare between groups and linear-by-linear association chi-square test was used for trend test.
Univariate logistic regression and multivariate logistic regression were used to analyze the traditional risk factors of DKD. Logistic regression and restricted cubic spline (RCS) were used to analyze the correlation between sUAR and DKD. The Cochran-Armitage trend test was performed to analyze the effects of different degrees of sUAR on DKD.
A baseline model for DKD based on traditional risk factors was established. Furthermore, a nomogram model was developed by integrating sUAR with these traditional risk factors. This model was internally validated in cohorts using the bootstrap validation method by 1000 re-samplings. The predictive accuracy of the models was assessed using the receiver operating characteristic (ROC) curve and the area under the ROC curve (AUC). Net Reclassification Improvement (NRI) and Integrated Discrimination Improvement (IDI) were calculated to compare the incremental predictive performance of different models. The clinical utility of the models was evaluated using decision curve analysis (DCA). P < 0.05 was considered statistically significant.
3 Results
3.1 Comparison of characteristics between non-DKD group and DKD group
Among 1,809 patients with T2DM, 486 patients were complicated with DKD, yielding a prevalence of 26.9%. Compared with the non-DKD group, patients in the DKD group were older, and had a longer duration of diabetes. They also exhibited significantly higher levels of BMI, SBP, DBP, HbA1c, FPG, TG, mUACR, sUA and sUAR (P < 0.05). Conversely, levels of HDL-C, eGFR and Alb in patients with DKD were lower than those in patients with non-DKD (P < 0.05). There were no significant differences in the proportion of females and the levels of TC, and LDL-C between the two groups (P >0.05) (Table 1).
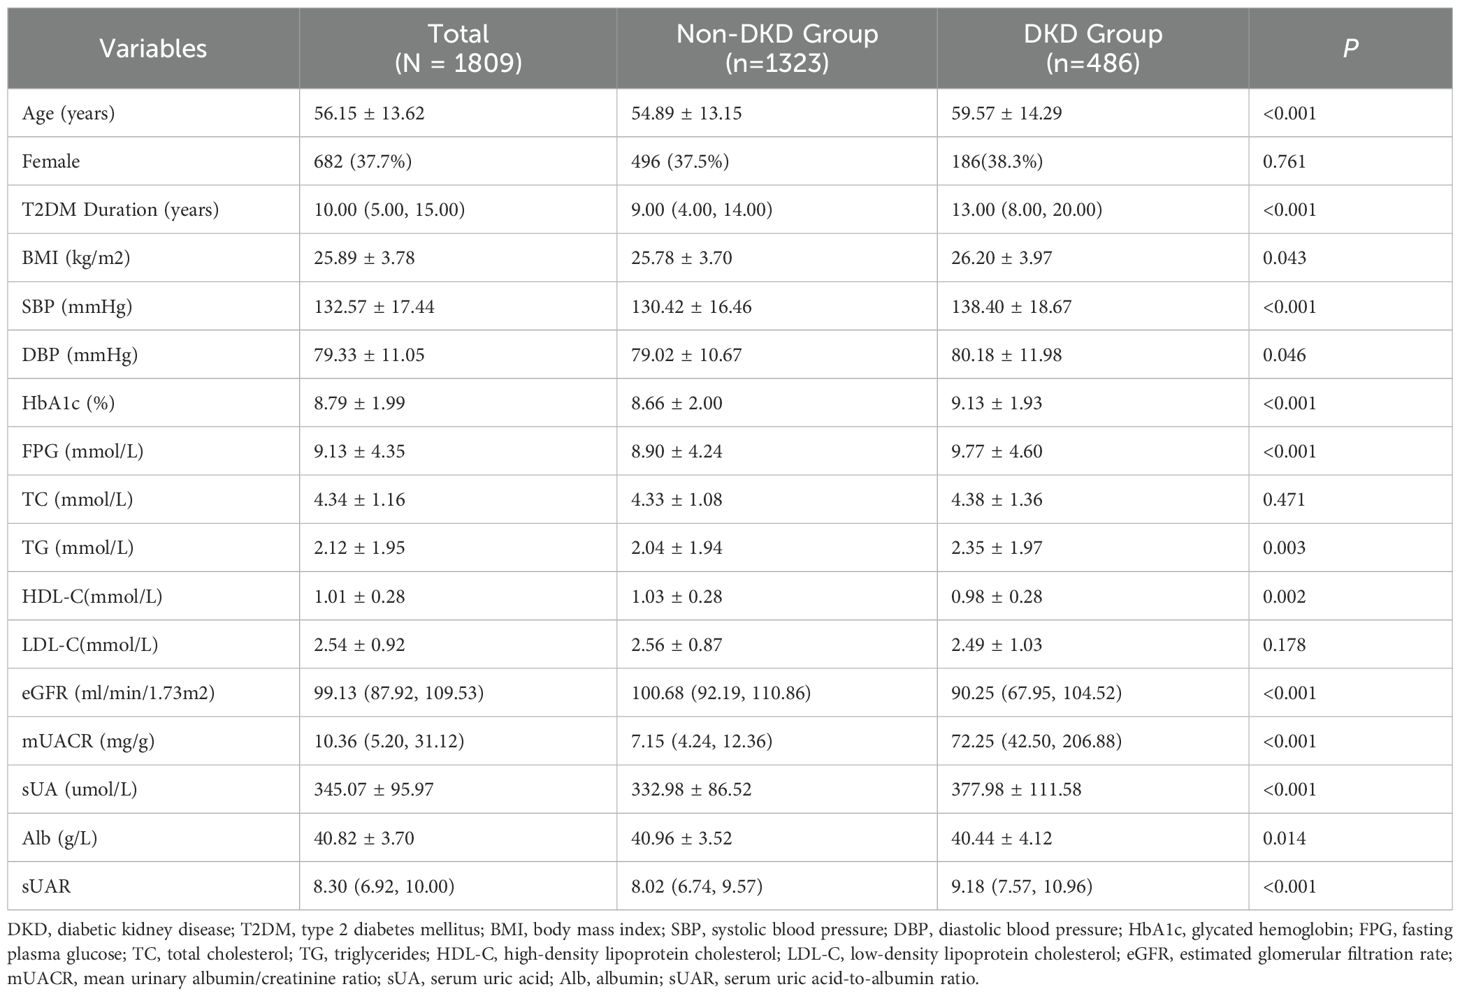
Table 1. Comparison of characteristics between non-DKD group and DKD group.
3.2 Comparison of characteristics across sUAR tertiles
Based on sUAR levels, we divided the patients with T2DM into 3 groups. The prevalence of DKD in tertile 1, tertile 2, and tertile 3 groups was 17.6%, 24.6%, and 38.4%, respectively. The result of linear-by-linear association chi-square test indicated that the incidence of DKD increased significantly with higher sUAR levels (Ptrend < 0.05) (Figure 1). As shown in Table 2, compared to the other two groups, patients in tertile 1 group had the highest mean age and HbA1c, and the lowest levels of TG and mUACR (P < 0.05). Patients in tertile 3 group had the highest levels of BMI, DBP and sUA and the lowest levels of HDL-C, eGFR and Alb (P < 0.05). Additionally, the proportion of male patients was the highest in tertile 3 group (P < 0.05). Comparison with the tertile 1 group, patients in tertile 3 group had higher SBP levels and lower FPG levels (P < 0.05). Significant difference was not found in diabetic duration, TC and LDL-C among the three groups (P > 0.05).
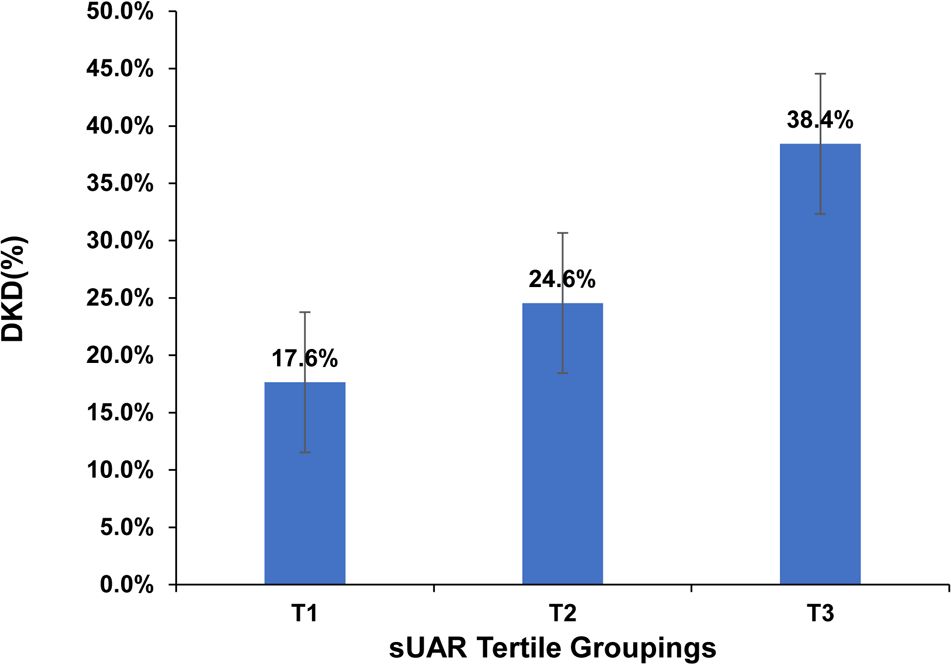
Figure 1. Prevalence of DKD across sUAR tertile groupings. DKD, diabetic kidney disease; sUAR, serum uric acid-to-albumin ratio.
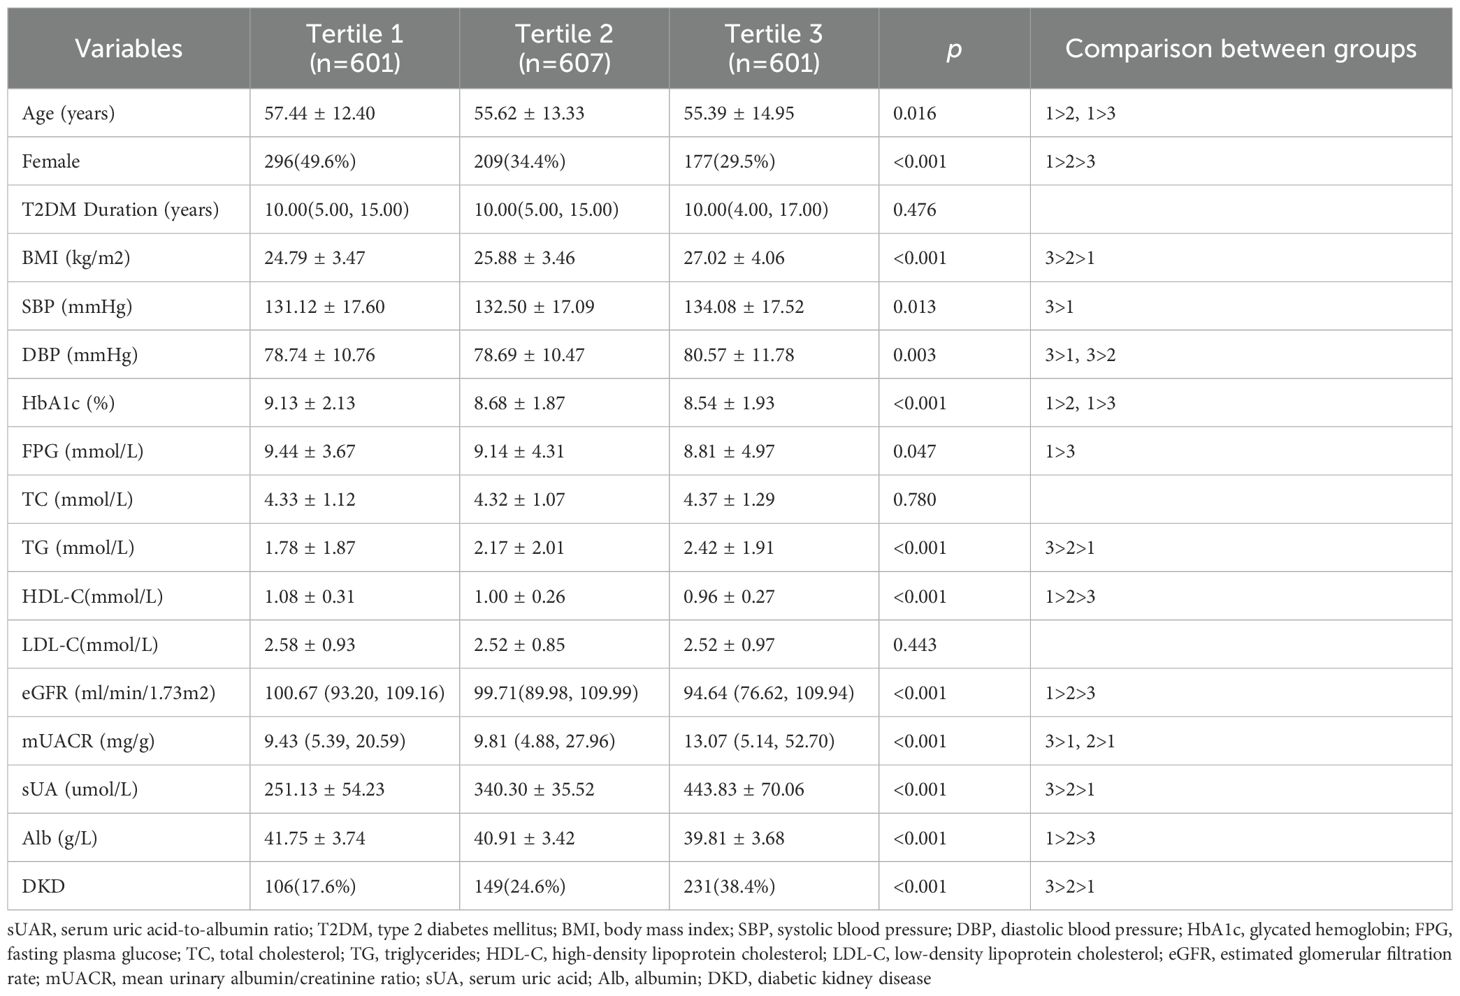
Table 2. Comparison of characteristics across sUAR tertile groupings.
3.3 Traditional influencing factors of DKD
Figure 2 constructed a multivariate logistic regression model with DKD as the dependent variable and with statistically significant variables from univariate regression analysis including age, T2DM duration, BMI, HbA1c, SBP, TG and HDL-C (excluding sUA, Alb, and sUAR) as independent variables. The results showed that DKD was independently associated with age (OR: 1.02, 95% CI: 1.01-1.03), T2DM duration (OR: 1.06, 95% CI: 1.04-1.08), SBP (OR: 1.02, 95% CI: 1.02-1.03), HbA1c (OR: 1.19, 95% CI: 1.11-1.27), TG (OR: 1.15, 95% CI: 1.08-1.23) and HDL-C (OR: 0.42, 95% CI: 0.25-0.69).
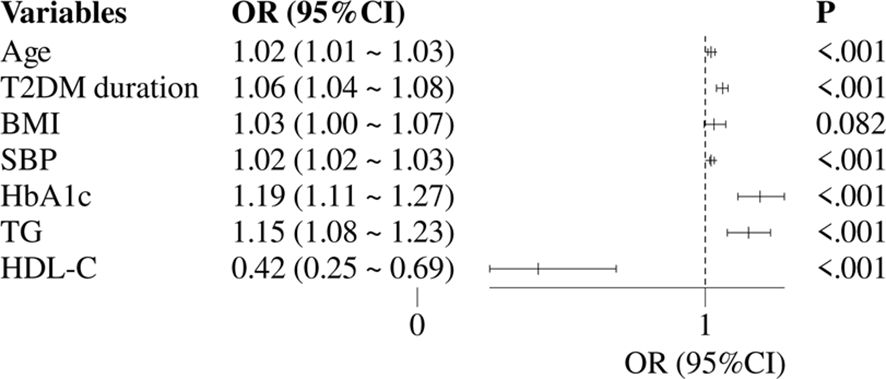
Figure 2. Multivariate logistic regression analysis of traditional risk factors for DKD. DKD, diabetic kidney disease; T2DM, type 2 diabetes mellitus; HbA1c, glycated hemoglobin; SBP, systolic blood pressure; HDL-C, high-density lipoprotein cholesterol; TG, triglycerides; OR, odds ratio; CI, confidence interval.
3.4 Association between sUAR and DKD
With DKD as the dependent variable and sUAR as the independent variable, univariate logistics regression analysis suggested that a high level of sUAR increased the risk of DKD (crude OR: 1.23, 95% CI: 1.18-1.29, P < 0.001). After adjusting for age, T2DM duration, HbA1c, SBP, TG and HDL-C, multivariate logistic regression analysis showed that sUAR was an independent risk factor for DKD (adjusted OR: 1.23, 95% CI: 1.16-1.30, P < 0.001). Specifically, the risk of DKD in tertile 2 and tertile 3 groups was 1.60 and 3.09 times higher, respectively, compared to the tertile 1 group. Additionally, the Cochran-Armitage trend test revealed an increasing trend in the risk of DKD with rising sUAR levels (P trend < 0.05) (Table 3).
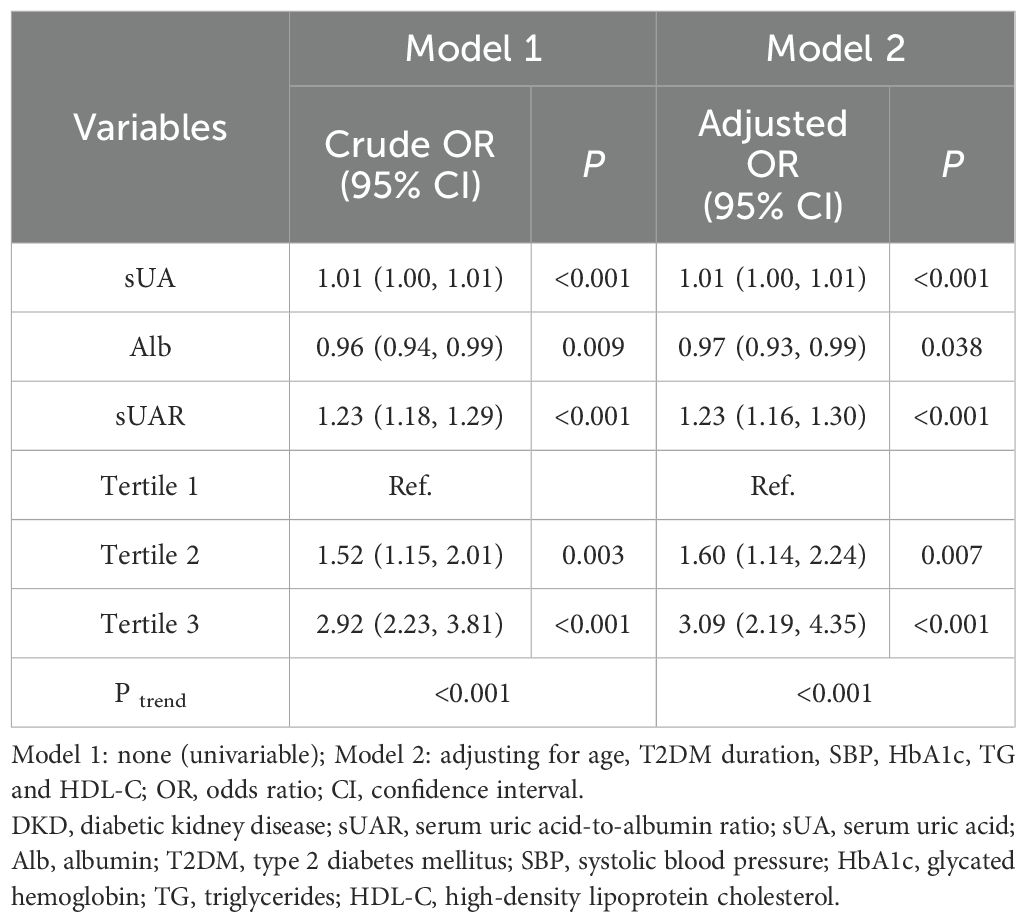
Table 3. Logistic regression analysis of sUAR and DKD.
The RCS analysis results revealed a significant non-linear relationship between sUAR and the occurrence of DKD (P non-linear < 0.05). Figure 3A showed the unadjusted relationship, while Figure 3B was adjusted for age, T2DM duration, HbA1c, SBP, TG and HDL-C. Below a sUAR threshold of 8.30, the risk of DKD remained relatively constant. Nevertheless, exceeding this threshold led to a gradual escalation in the risk of DKD with increasing sUAR values.
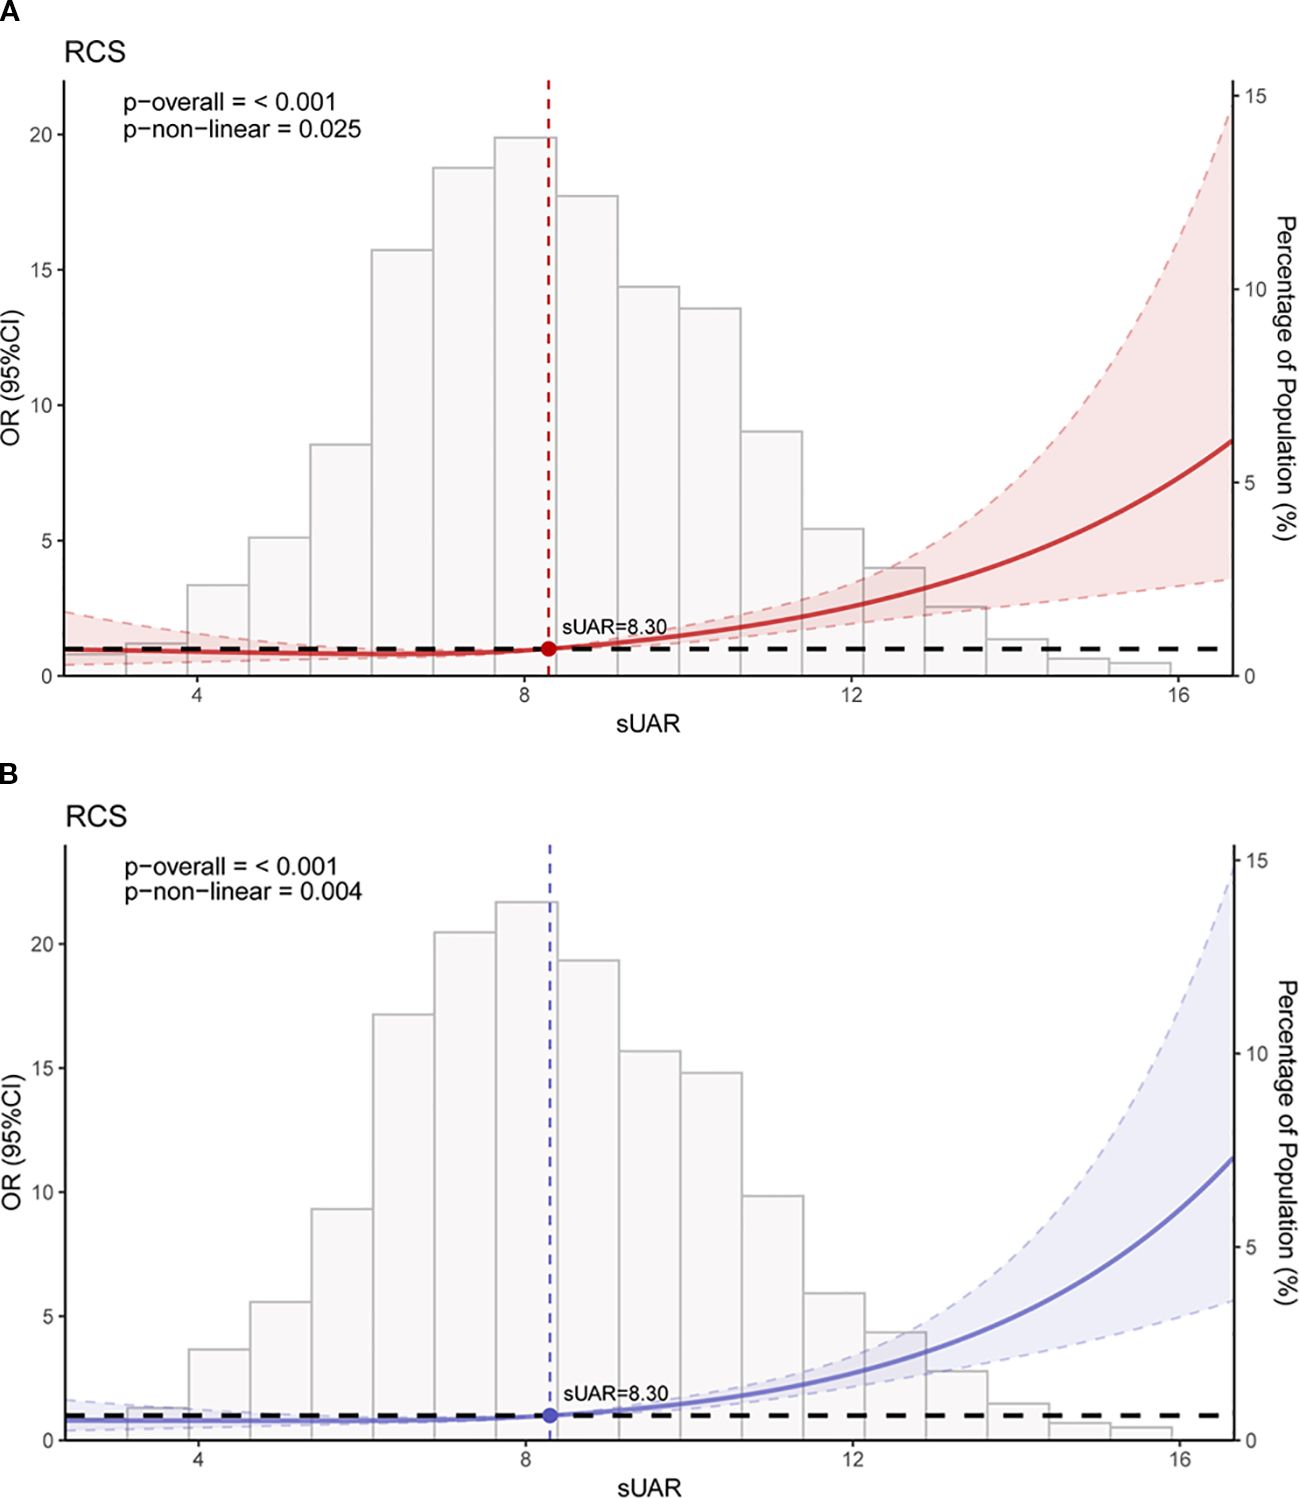
Figure 3. RCS curves of the association between sUAR and DKD. (A) unadjusted for any variables; (B) adjusted for age, T2DM duration, HbA1c, SBP, HDL-C, and TG. RCS, restricted cubic spline; sUAR, serum uric acid-to-albumin ratio; DKD, diabetic kidney disease; T2DM, type 2 diabetes mellitus; HbA1c, glycated hemoglobin; SBP, systolic blood pressure; HDL-C, high-density lipoprotein cholesterol; TG, triglycerides.
3.5 Predictive model for the risk of DKD
To evaluate the predictive performance of sUAR for DKD, a ROC curve analysis was performed, which yielded an AUC of 0.63 (95% CI: 0.60-0.66). The optimal threshold was 9.32, with the sensitivity and specificity of 67% and 54%, respectively. By integrating traditional influencing factors including age, T2DM duration, HbA1c, SBP, HDL-C, and TG, a baseline risk prediction model for DKD was constructed. This model demonstrated an AUC of 0.72 (95% CI: 0.69-0.75), with a sensitivity of 62% and a specificity of 72%. Furthermore, by combining sUAR with these traditional factors, an enhanced prediction model for DKD was developed based on nomogram (Figure 4). Internal validation revealed an improvement in prediction accuracy, with the AUC increasing to 0.75 (95% CI: 0.72-0.78). Sensitivity improved from 62% to 76%, and specificity increased from 72% to 87% (Figure 5A, Table 4). In Table 4, we also assessed these enhancements using continuous NRI and IDI. The continuous NRI was 0.37 (95% CI: 0.25-0.49, P < 0.001), and the IDI was 0.04 (95% CI: 0.03-0.05, P < 0.001).
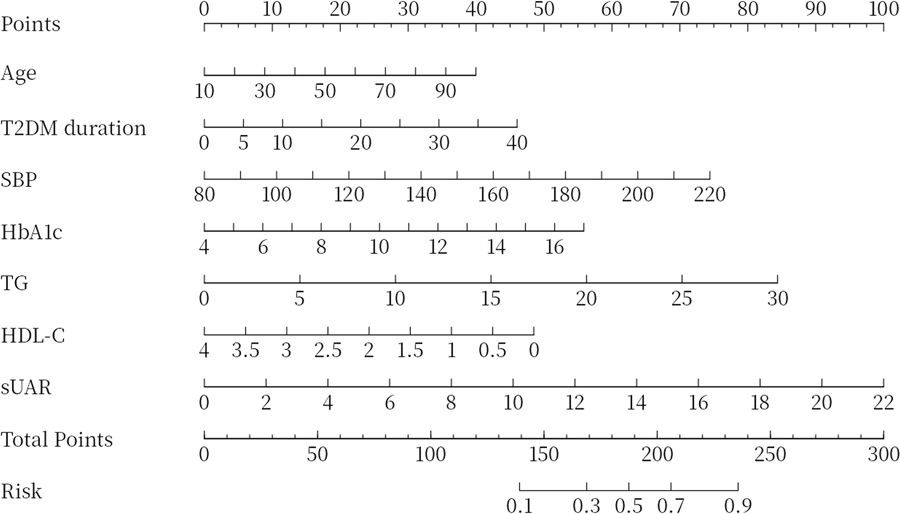
Figure 4. Nomogram for predicting DKD. DKD, diabetic kidney disease; T2DM, type 2 diabetes mellitus; HbA1c, glycated hemoglobin; SBP, systolic blood pressure; HDL-C, high-density lipoprotein cholesterol; TG, triglycerides; sUAR, serum uric acid-to-albumin ratio.
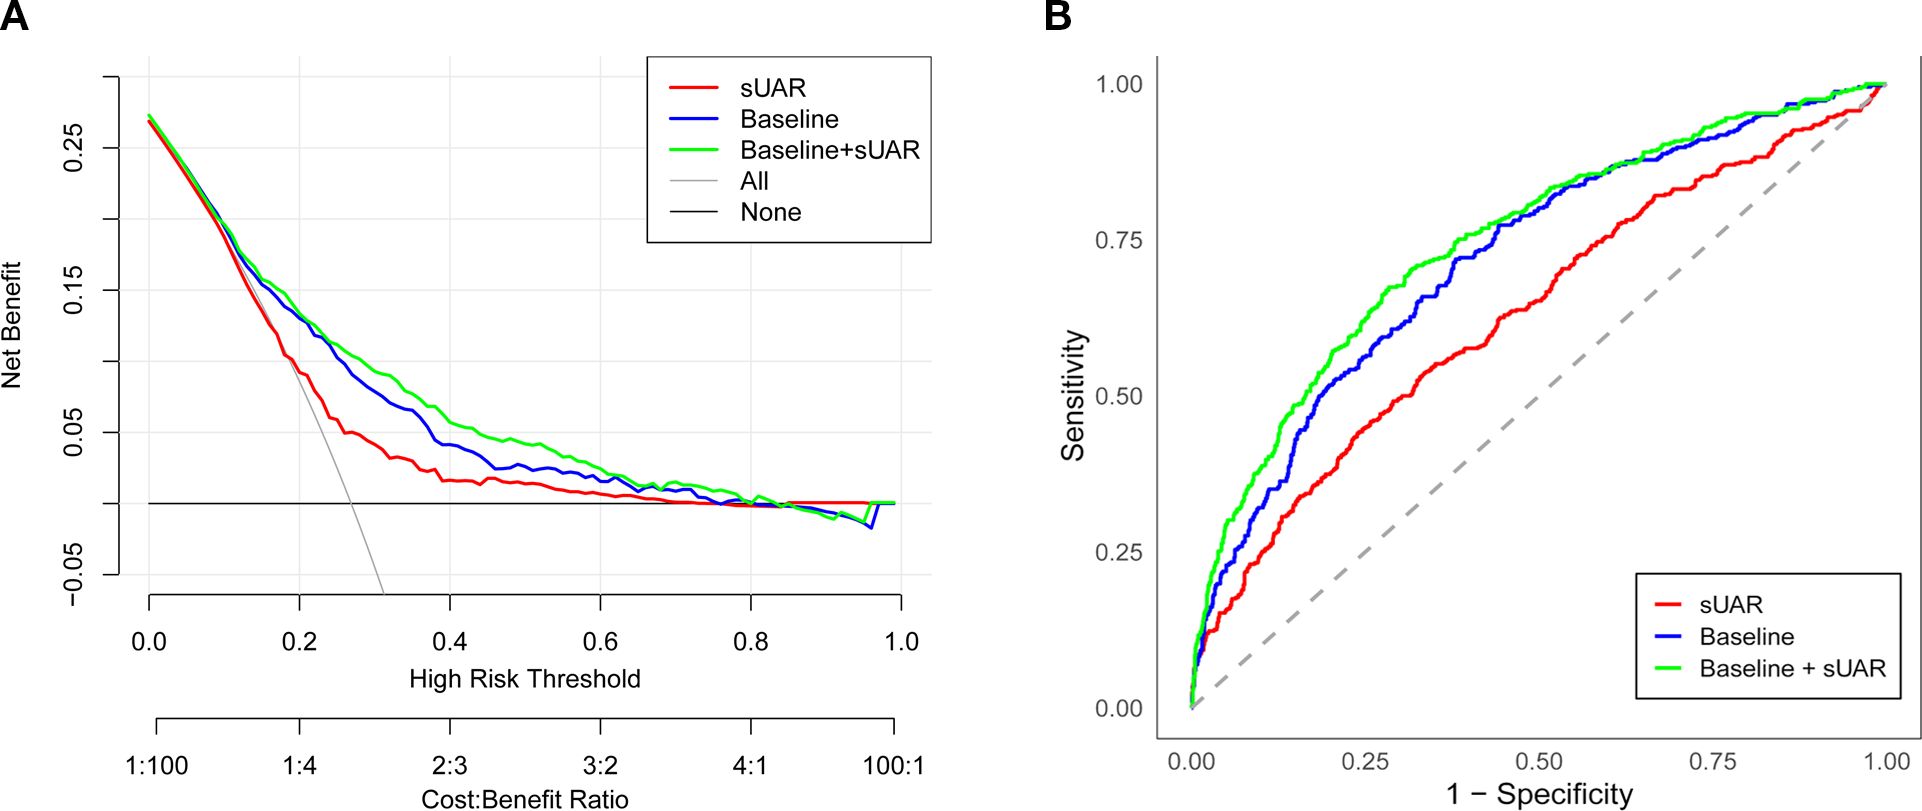
Figure 5. Evaluation of the prediction models for the risk of DKD. (A) ROC curve; (B) DCA curve. sUAR, serum uric acid-to-albumin ratio; DKD, diabetic kidney disease; ROC, receiver operating characteristic; DCA, decision curve analysis.
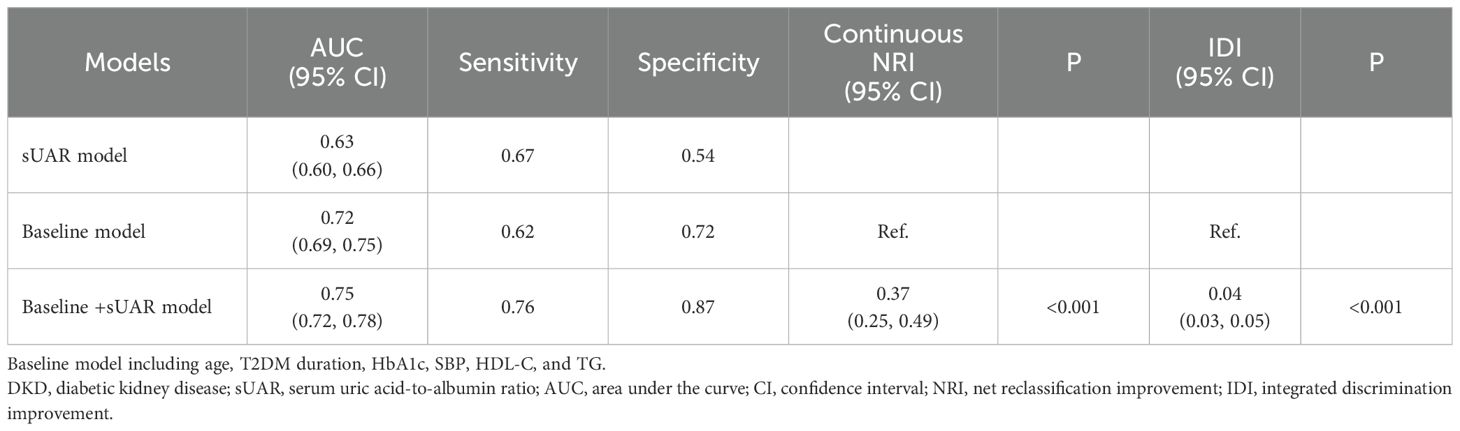
Table 4. Discriminatory ability of the predictive models for DKD.
In addition, the results of DCA found that when the threshold probability was between 0.16 and 0.52, the clinical net benefit was ranked as baseline + sUAR model > baseline model > sUAR model (Figure 5B).
4 Discussion
DKD is a form of CKD that develops as a complication of DM. It is characterized by persistent increased urinary albumin excretion and/or decreased eGFR. Previous studies have reported that DKD affects 20%-50% of diabetic patients (20), with 30%-50% of cases attributed to T2DM (13). DKD has become a significant global public health issue due to its high prevalence, poor prognosis, and heavy economic burden. Given these challenges, it is crucial to identify and intervene in the risk factors associated with DKD at an early stage.
sUA is a metabolite of purine produced by xanthine oxidase (21, 22). Several studies have demonstrated that hyperuricemia is an independent risk of DKD (5, 13, 23). A meta-analysis involving 27,425 T2DM patients revealed that for every 1 mg/dL increase in sUA levels, the risk for DKD increased by 11% (RR = 1. 11, 95% CI: 1.05-1.17, P < 0.0001); and the result of subgroup analysis further demonstrated a linear relationship between sUA levels and the presence of albuminuria (P = 0.052) as well as eGFR decline (P < 0.0001) (13). Kim WJ, et al. found that sUA > 327 μ mol/L was significantly associated with an eGFR below 60 ml/min/1.73 m 2 in T2DM patients with renal function-preserving (HR = 2. 97, 95% CI: 1.15-7.71, P = 0.025). Furthermore, their study suggested that even when sUA levels were within the normal range, higher sUA levels were still associated with a decline of renal function (23). Another cross-sectional study indicated that T2DM patients with higher sUA levels have a higher risk of DKD progression (5). Previous studies have suggested that sUA-lowering therapy can reduce proteinuria (24, 25) and slow the progression of renal function deterioration (26). The mechanism of sUA affecting DKD has not been fully elucidated. High sUA level can activate the NOD-like receptor thermal protein domain-associated protein 3 (NLRP3) inflammasome, leading to cell damage and even death through endoplasmic reticulum stress, lysosome destruction, mitochondrial dysfunction, and the interaction between the Golgi apparatus and extracellular vesicles (27). In addition, hyperuricemia can stimulate the renin-angiotensin system, damaging vascular smooth muscle cells, causing renal artery lesions, and increasing intrarenal pressure, ultimately leading to microvascular injury (28). Another possible mechanism is that elevated sUA induces the production of inflammatory cytokines, including tumor necrosis factor-α, interleukin (IL)-1β, IL-6, and IL-17, which promote renal damage (29, 30). In our study, we found that sUA levels in DKD group were higher than those in non-DKD group (377.98 ± 111.58 vs. 332.98 ± 86.52, P < 0.05). High levels of sUA were associated with an increased risk of DKD (adjusted OR: 1.01, 95% CI: 1.00-1.01, P < 0.05).
Apart from being a major determinant of intravascular osmotic pressure, Alb also plays a crucial role in anti-inflammatory, anti-apoptotic, and antioxidant functions (14, 31, 32). A prospective study based on the UK Biobank has indicated that serum Alb levels were inversely associated with the incidences of diabetes and DKD (15). A study involving 188 T2DM patients with biopsy-proven DKD demonstrated a significant relationship between serum Alb and proteinuria, renal dysfunction, and glomerular lesions (31). Furthermore, lower serum Alb levels were associated with a higher risk of developing ESRD (16, 31). Moreover, some studies have found that decreased Alb levels increase the risk of all-cause mortality in patients with DKD (33). Our research findings indicated that the levels of Alb in the DKD group are lower than those in the non-DKD group (40.44 ± 4.12 vs. 40.96 ± 3.52, P < 0.05). Additionally, a decrease in Alb was associated with an increased risk of DKD (adjusted OR: 0.97, 95% CI: 0.93-0.99, P < 0.05).
Previous studies have shown that inflammation plays an important role in the occurrence and progression of DKD. As a novel inflammatory biomarker, sUAR combines the pro-oxidative effects of sUA with the antioxidant properties of Alb, potentially providing a more comprehensive reflection of the body’s inflammatory and oxidative stress status. Consequently, sUAR has garnered increasing attention in recent research. Yeter Hh, et al. reported a significant association between sUAR levels above 1.7 and the development of acute kidney injury (AKI) (34). Liao Y, et al. also demonstrated that elevated sUAR was significantly associated with an increased risk of AKI in patients undergoing isolated tricuspid valve surgery (35). Furthermore, Özgür Y, et al. identified that higher sUAR levels were linked to increased higher 30-day mortality rates in patients with AKI (31). Şaylık F, et al. and Zhang Y, et al. found that sUAR was an independent risk factor for post-angiographic kidney injury in patients with ST-segment elevation myocardial infarction who underwent percutaneous coronary intervention (36, 37). This study, for the first time, identified a correlation between sUAR and DKD. With increasing sUAR levels, a rising trend in the incidence rate of DKD was observed (P trend < 0.05). After adjusting for age, T2DM duration, HbA1c, SBP, TG and HDL-C, multivariable logistic regression analysis showed that sUAR was an independent risk factor for DKD (adjusted OR: 1.23, 95% CI: 1.16-1.30, P < 0.001). RCS analysis indicated a non-linear relationship between sUAR and the occurrence of DKD (P non-linear < 0.05). Specifically, when sUAR exceeded 8.30, the risk of DKD occurrence gradually increased with higher sUAR values.
The results of this study also found that older age, longer T2DM duration, low HDL-C levels, and high levels of HbA1c, SBP, and TG were risk factors for DKD, consistent with previous studies (38, 39). Furthermore, we found that incorporating both sUAR and the traditional influencing factors of DKD into a multivariable prediction model can improve the predictive accuracy and clinical net benefit. In addition, we developed a visual nomogram that allowed both doctors and patients to more intuitively understand the prediction results for DKD. This model is especially beneficial for primary care hospitals that lack the capability to measure UACR or perform renal biopsies, as it enhances early screening for DKD.
There are several limitations to this study. First, this is a single-center study involving hospitalized patients, which may lead to some biases. Second, potential effects of antidiabetic drugs (e.g., insulin, sodium-glucose cotransporter-2 inhibitors) on sUA and Alb were not considered. Third, the diagnosis of DKD predominantly relied on elevated UACR and reduced eGFR, with renal biopsy performed in only a minor subset of cases.
5 Conclusion
In summary, this study revealed that high levels of sUAR were independent risk factors of DKD, and sUAR combined with traditional risk factors had a higher predictive value for DKD.
Data availability statement
The raw data supporting the conclusions of this article will be made available by the authors, without undue reservation.
Ethics statement
The studies involving humans were approved by the Ethics Committee of Peking University International Hospital. The studies were conducted in accordance with the local legislation and institutional requirements. The ethics committee/institutional review board waived the requirement of written informed consent for participation from the participants or the participants’ legal guardians/next of kin. The study was observational and retrospective and did not involve any potentially harmful or personally identifiable information.
Author contributions
JD: Conceptualization, Investigation, Methodology, Software, Visualization, Writing – original draft. XX: Investigation, Writing – review & editing. NY: Investigation, Writing – review & editing. XZ: Conceptualization, Project administration, Resources, Writing – review & editing.
Funding
The author(s) declare that no financial support was received for the research and/or publication of this article.
Acknowledgments
We thank the colleagues at the Endocrinology Department of Peking University International Hospital.
Conflict of interest
The authors declare that the research was conducted in the absence of any commercial or financial relationships that could be construed as a potential conflict of interest.
Generative AI statement
The author(s) declare that no Generative AI was used in the creation of this manuscript.
Any alternative text (alt text) provided alongside figures in this article has been generated by Frontiers with the support of artificial intelligence and reasonable efforts have been made to ensure accuracy, including review by the authors wherever possible. If you identify any issues, please contact us.
Publisher’s note
All claims expressed in this article are solely those of the authors and do not necessarily represent those of their affiliated organizations, or those of the publisher, the editors and the reviewers. Any product that may be evaluated in this article, or claim that may be made by its manufacturer, is not guaranteed or endorsed by the publisher.
References
1. Sun H, Saeedi P, Karuranga S, Pinkepank M, Ogurtsova K, Duncan BB, et al. IDF Diabetes Atlas: Global, regional and country-level diabetes prevalence estimates for 2021 and projections for 2045. Diabetes Res Clin Pract. (2022) 183:109119. doi: 10.1016/j.diabres.2021.109119
2. Zhang H, Liu N, and Dang H. Association of the Controlling Nutritional Status (CONUT) score with all-cause and cause-specific mortality in patients with diabetic kidney disease: evidence from the NHANES 2009-2018. BMJ Open. (2024) 14:e079992. doi: 10.1136/bmjopen-2023-079992
3. Piko N, Bevc S, Hojs R, and Ekart R. Finerenone: from the mechanism of action to clinical use in kidney disease. Pharm (Basel). (2024) 17:481. doi: 10.3390/ph17040418
4. Nugnes M, Baldassarre M, Ribichini D, Tedesco D, Capelli I, Vetrano D, et al. Association between albumin alterations and renal function in patients with type 2 diabetes mellitus. Int J Mol Sci. (2024) 25:3168. doi: 10.3390/ijms25063168
5. Zhu L, Wang X, Sun J, Qian Q, Yu J, and An X. Hyperuricemia predicts the progression of type 2 diabetic kidney disease in Chinese patients. Diabetes Ther. (2023) 14:581–91. doi: 10.1007/s13300-023-01374-9
6. Gupta S, Dominguez M, and Golestaneh L. Diabetic kidney disease: an update. Med Clin North Am. (2023) 107:689–705. doi: 10.1016/j.mcna.2023.03.004
7. Jin Q, Lau ESH, Luk AO, Tam CHT, Ozaki R, Lim CKP, et al. Circulating metabolomic markers linking diabetic kidney disease and incident cardiovascular disease in type 2 diabetes: analyses from the Hong Kong Diabetes Biobank. Diabetologia. (2024) 67:837–49. doi: 10.1007/s00125-024-06108-5
8. Yuan Y, Liang X, He M, Wu Y, and Jiang X. Haemoglobin, albumin, lymphocyte, and platelet score as an independent predictor for renal prognosis in IgA nephropathy. Front Endocrinol (Lausanne). (2024) 15:1339921. doi: 10.3389/fendo.2024.1339921
9. Gherghina ME, Peride I, Tiglis M, Neagu TP, Niculae A, and Checherita IA. Uric acid and oxidative stress-relationship with cardiovascular, metabolic, and renal impairment. Int J Mol Sci. (2022) 23:3188. doi: 10.3390/ijms23063188
10. Zhu P, Liu Y, Han L, Xu G, and Ran JM. Serum uric acid is associated with incident chronic kidney disease in middle-aged populations: a meta-analysis of 15 cohort studies. PloS One. (2014) 9:e100801. doi: 10.1371/journal.pone.0100801
11. Russo E, Viazzi F, Pontremoli R, Barbagallo CM, Bombelli M, Casiglia E, et al. Association of uric acid with kidney function and albuminuria: the Uric Acid Right for heArt Health (URRAH) Project. J Nephrol. (2022) 35:211–21. doi: 10.1007/s40620-021-00985-4
12. Han Y, Yao M, Zhao H, Han X, Di H, Xie T, et al. Exploration of the interrelationship between serum uric acid, gout, and cardiac, renal, and metabolic conditions in middle aged and older people. J Am Heart Assoc. (2025) 14:e038723. doi: 10.1161/JAHA.124.038723
13. Guo J, Liu C, Wang Y, Shao B, Fong TL, Lau NC, et al. Dose-response association of diabetic kidney disease with routine clinical parameters in patients with type 2 diabetes mellitus: a systematic review and meta-analysis. EClinicalMedicine. (2024) 69:102482. doi: 10.1016/j.eclinm.2024.102482
14. Şaylık F, Çınar T, Selçuk M, and Tanboğa İH. The relationship between uric acid/albumin ratio and carotid intima-media thickness in patients with hypertension. Arq Bras Cardiol. (2023) 120:e20220819. doi: 10.36660/abc.20220819
15. Cai YW, Zhang HF, Gao JW, Cai ZX, Cai JW, Gao QY, et al. Serum albumin and risk of incident diabetes and diabetic microvascular complications in the UK Biobank cohort. Diabetes Metab. (2023) 49:101472. doi: 10.1016/j.diabet.2023.101472
16. Walther CP, Gutiérrez OM, Cushman M, Judd SE, Lang J, McClellan W, et al. Serum albumin concentration and risk of end-stage renal disease: the REGARDS study. Nephrol Dial Transpl. (2018) 33:1770–7. doi: 10.1093/ndt/gfx331
17. Yin R, Ye Z, You H, Wu Y, Chen W, and Jiang T. Elevated uric acid/albumin ratio as a predictor of poor coronary collateral circulation development in patients with non-ST segment elevation myocardial infarction. Clin Cardiol. (2024) 47:e24215. doi: 10.1002/clc.24215
18. Levey AS, Stevens LA, Schmid CH, Zhang YL, Castro AF 3rd, Feldman HI, et al. A new equation to estimate glomerular filtration rate. Ann Intern Med. (2009) 150:604–12. doi: 10.7326/0003-4819-150-9-200905050-00006
19. Society M. Clinical guideline for the prevention and treatment of diabetic kidney disease in China (2021 edition). Chin J Diabetes Mellitus. (2021) 13:762–84. doi: 10.3760/cma.j.cn115791-20210706-00369
20. Selby NM and Taal MW. An updated overview of diabetic nephropathy: Diagnosis, prognosis, treatment goals and latest guidelines. Diabetes Obes Metab. (2020) 22 Suppl 1:3–15. doi: 10.1111/dom.14007
21. Xiong Q, Liu J, and Xu Y. Effects of uric acid on diabetes mellitus and its chronic complications. Int J Endocrinol. (2019) 2019:9691345. doi: 10.1155/2019/9691345
22. Zeb S, Babar B, Bibi S, and Shah MA. Correlation of uric acid with microalbuminuria in Type-2 diabetic patients with normal creatinine. Pak J Med Sci. (2024) 40:951–5. doi: 10.12669/pjms.40.5.8208
23. Kim WJ, Kim SS, Bae MJ, Yi YS, Jeon YK, Kim BH, et al. High-normal serum uric acid predicts the development of chronic kidney disease in patients with type 2 diabetes mellitus and preserved kidney function. J Diabetes Complicat. (2014) 28:130–4. doi: 10.1016/j.jdiacomp.2013.11.006
24. Stack AG, Dronamraju N, Parkinson J, Johansson S, Johnsson E, Erlandsson F, et al. Effect of intensive urate lowering with combined verinurad and febuxostat on albuminuria in patients with type 2 diabetes: A randomized trial. Am J Kidney Dis. (2021) 77:481–9. doi: 10.1053/j.ajkd.2020.09.009
25. Kohagura K, Kojima S, Uchiyama K, Yokota N, Tokutake E, Wakasa Y, et al. Febuxostat and renal outcomes: post-hoc analysis of a randomized trial. Hypertens Res. (2023) 46:1417–22. doi: 10.1038/s41440-023-01198-x
26. Tsukamoto S, Okami N, Yamada T, Azushima K, Yamaji T, Kinguchi S, et al. Prevention of kidney function decline using uric acid-lowering therapy in chronic kidney disease patients: a systematic review and network meta-analysis. Clin Rheumatol. (2022) 41:911–9. doi: 10.1007/s10067-021-05956-5
27. Wang M, Lin X, Yang X, and Yang Y. Research progress on related mechanisms of uric acid activating NLRP3 inflammasome in chronic kidney disease. Ren Fail. (2022) 44:615–24. doi: 10.1080/0886022X.2022.2036620
28. Tsukamoto SI, Wakui H, and Tamura K. Effects of uric acid-lowering therapy on the kidney (HTR-2023-0096.R2). Hypertens Res. (2023) 46:1447–9. doi: 10.1038/s41440-023-01252-8
29. Yang L, He T, and Yu Y. Uric acid promotes interleukin-17 expression to cause kidney injury. J Biochem Mol Toxicol. (2024) 38:e23550. doi: 10.1002/jbt.23550
30. Donate-Correa J, Ferri CM, Sánchez-Quintana F, Pérez-Castro A, González-Luis A, Martín-Núñez E, et al. Inflammatory cytokines in diabetic kidney disease: pathophysiologic and therapeutic implications. Front Med (Lausanne). (2020) 7:628289. doi: 10.3389/fmed.2020.628289
31. Özgür Y, Akın S, Yılmaz NG, Gücün M, and Keskin Ö. Uric acid albumin ratio as a predictive marker of short-term mortality in patients with acute kidney injury. Clin Exp Emerg Med. (2021) 8:82–8. doi: 10.15441/ceem.20.024
32. Zhang J, Zhang R, Wang Y, Li H, Han Q, Wu Y, et al. The level of serum albumin is associated with renal prognosis in patients with diabetic nephropathy. J Diabetes Res. (2019) 2019:7825804. doi: 10.1155/2019/7825804
33. Wu S, Wang H, Pan D, Guo J, Zhang F, Ning Y, et al. Navigating the future of diabetes: innovative nomogram models for predicting all-cause mortality risk in diabetic nephropathy. BMC Nephrol. (2024) 25:127. doi: 10.1186/s12882-024-03563-5
34. Yeter HH, Eyupoglu DN, Paşayev T, Çetik S, Akcay OF, Yıldırım T, et al. Role of uric acid albumin ratio in predicting development of acute kidney injury and mortality in intensive care unit patients. Turkish J Nephrol. (2019) 28:160–7. doi: 10.5152/turkjnephrol.2019.3416
35. Liao Y, Li L, Li J, Zhao F, and Zhang C. Uric acid to albumin ratio: A predictive marker for acute kidney injury in isolated tricuspid valve surgery. Rev Cardiovasc Med. (2025) 26:26391. doi: 10.31083/RCM26391
36. Zhang Y, Xu Z, He W, Lin Z, Liu Y, Dai Y, et al. Elevated serum uric acid/albumin ratio as a predictor of post-contrast acute kidney injury after percutaneous coronary intervention in patients with ST-segment elevation myocardial infarction. J Inflammation Res. (2022) 15:5361–71. doi: 10.2147/JIR.S377767
37. Şaylık F, Çınar T, Akbulut T, and Selçuk M. Serum uric acid to albumin ratio can predict contrast-induced nephropathy in ST-elevation myocardial infarction patients undergoing primary percutaneous coronary intervention. Angiology. (2023) 74:70–8. doi: 10.1177/00033197221091605
38. Radcliffe NJ, Seah JM, Clarke M, MacIsaac RJ, Jerums G, and Ekinci EI. Clinical predictive factors in diabetic kidney disease progression. J Diabetes Investig. (2017) 8:6–18. doi: 10.1111/jdi.12533
39. Pan J, Li C, Zhang J, Sun Z, Yu X, Wan Q, et al. Association between non-high-density lipoprotein cholesterol to high-density lipoprotein cholesterol ratio (NHHR) and diabetic kidney disease in patients with diabetes in the United States: a cross-sectional study. Lipids Health Dis. (2024) 23:317. doi: 10.1186/s12944-024-02308-5
Keywords: type 2 diabetes mellitus, diabetic kidney disease, uric acid, albumin, inflammation
Citation: Du J, Xu X, Yuan N and Zhang X (2025) Predictive value of serum uric acid-to-albumin ratio for diabetic kidney disease in patients with type 2 diabetes mellitus: a case-control study. Front. Endocrinol. 16:1577950. doi: 10.3389/fendo.2025.1577950
Received: 17 February 2025; Accepted: 16 September 2025;
Published: 07 October 2025.
Edited by:
Carmine Izzo, University of Salerno, ItalyReviewed by:
Harish Rangareddy, Haveri Institute of Medical Sciences, IndiaAhmed Ezzat, Benha University, Egypt
Copyright © 2025 Du, Xu, Yuan and Zhang. This is an open-access article distributed under the terms of the Creative Commons Attribution License (CC BY). The use, distribution or reproduction in other forums is permitted, provided the original author(s) and the copyright owner(s) are credited and that the original publication in this journal is cited, in accordance with accepted academic practice. No use, distribution or reproduction is permitted which does not comply with these terms.
*Correspondence: Xiaomei Zhang, ZW1haWxAdW5pLmVkdQ==; ei54Lm1laUAxNjMuY29t