 Yue-Yang Zhang1,2,3,4,5†‡
 Qin Wan
- 1Department of Endocrinology and Metabolism, Affiliated Hospital of Southwest Medical University, Luzhou, China
- 2Metabolic Vascular Disease Key Laboratory of Sichuan Province, Luzhou, China
- 3Sichuan Clinical Research Center for Diabetes and Metabolism, Luzhou, China
- 4Sichuan Clinical Research Center for Nephropathy, Luzhou, China
- 5Cardiovascular and Metabolic Diseases Key Laboratory of Luzhou, Luzhou, China
- 6Department of Endocrinology and Metabolism, The First People's Hospital of Zigong, Zigong, China
Background: The hemoglobin glycation index (HGI), an indicator of individual differences in glucose metabolism. This study undertakes a detailed 10-year cohort analysis to investigate the potential association between HGI and all-cause mortality in a Chinese adult population.
Methods: Baseline data encompassing lifestyle and metabolic parameters were collected from 10,008 participants, with a subsequent 10-year follow-up. Following exclusions based on predefined criteria, 9,084 individuals were included in the final analysis. Participants were categorized into quartiles based on their HGI values. A suite of statistical tools, including Kaplan-Meier survival analysis, Cox proportional hazards models, restricted cubic splines (RCS), threshold effect models, and subgroup analyses, was employed to investigate the association between HGI and all-cause mortality.
Results: During the 10-year follow-up period, a total of 514 all-cause mortality cases were recorded. Kaplan-Meier survival analysis identified the Q2 group as having the lowest mortality rate. Fully adjusted Cox proportional hazards models demonstrated significant associations, indicating higher all-cause mortality risks in participants with both extremely low and high HGI levels compared to the Q2 group. RCS analysis further illustrated a U-shaped relationship between HGI and all-cause mortality.
Conclusions: In the Chinese population, both markedly elevated and significantly reduced HGI levels are associated with adverse impacts on long-term survival.
Core tip: The aim of this study was to assess the association of Hemoglobin Glycation Index(HGI) with all-cause mortality in non-type 2 diabetic patients based on a 10-year cohort study from China. After COX regression, restricted cubic spline analysis, and subgroup analyses, it was found that a significant increase or decrease in HGI adversely affected long-term survival.
Introduction
Diabetes is one of the most prevalent and severe endocrine and metabolic disorders, primarily characterized by elevated blood glucose levels resulting from absolute or relative insulin deficiency, leading to multi-organ damage and, ultimately, death (1, 2). The 2021 Global Burden of Disease, Injuries, and Risk Factors Report identified diabetes as the eighth leading risk factor for both mortality and disability (3). According to the 10th edition of the Diabetes Atlas by the International Diabetes Federation (IDF), approximately 537 million individuals worldwide are currently living with diabetes, with the number projected to increase to 653 million by 2030 and a staggering 783 million by 2045 (4). Furthermore, global healthcare expenditures related to diabetes are anticipated to exceed 1.05 trillion USD (5). These statistics highlight the profound impact of diabetes on global public health and emphasize the urgent need for more effective diabetes prevention and management strategies in the general population.
According to the 2024 diabetes guidelines published by the American Diabetes Association (ADA), glycated haemoglobin(HbA1c) measurement remains the gold standard for diagnosing diabetes, reflecting an individual’s average blood glucose over the preceding three months and serving as a key indicator for assessing the effectiveness of glycemic interventions (6, 7). However, studies have shown that only 60-80% of the variations in average blood glucose levels can be explained by changes in HbA1c levels (8). The metabolism of red blood cells, the glucose gradient across the red blood cell membrane, and genetic factors all influence HbA1c levels, independent of average blood glucose levels (9–11). Therefore, HbA1c does not fully capture the body’s glucose metabolism state.
The Hemoglobin Glycation Index (HGI), proposed by Hempe et al. (12) quantifies the association between HbA1c and average blood glucose levels. It is defined as the difference between the measured HbA1c and the predicted HbA1c, derived from a linear regression based on fasting blood glucose levels. Initially, HGI proved useful in evaluating HbA1c differences in children with type 1 diabetes (13). More recent studies suggest that HGI is a strong predictor of cardiovascular disease outcomes, with patients with high HGI showing significantly higher mortality from acute coronary syndrome and vascular dysfunction (14). Additionally, higher HGI is associated with an elevated risk of diabetes complications, including mortality and both macrovascular and microvascular issues (15). However, recent studies indicate that patients with low HGI levels may also experience more cardiovascular events than those with moderate HGI levels (16, 17). A study utilizing the MIMIC-IV database also found a strong association between HGI and all-cause mortality in critically ill coronary artery disease patients, particularly in those with low HGI (18). However, the relationship between HGI and all-cause mortality in the general population, particularly in the Chinese population, remains unclear. Therefore, this study aims to explore the potential association between HGI and all-cause mortality through a 10-year follow-up cohort from the China Cardiometabolic Disease and Cancer Cohort Study(4C Study).
Method
Study design and population
The 4C Study is a nationwide, multicenter, population-based prospective cohort study aimed at exploring potential associations between various metabolic factors and specific clinical outcomes, particularly diabetes and cardiovascular diseases. The study protocol and informed consent were approved by the Human Research Ethics Committee at Ruijin Hospital, Shanghai Jiao Tong University, ensuring ethical compliance. All participants provided written informed consent before participating in the study (19).
The 4C Study encompasses 20 community research sites across 16 provinces, autonomous regions, and municipalities in mainland China. Initially, eligible men and women aged 40 years and older were identified through the resident registration systems at each research site. Trained community health workers then conducted home visits to invite eligible individuals to participate in the study and follow-up. Baseline assessments for 10,008 participants were conducted between 2010 and 2011, including face-to-face interviews, baseline questionnaires, physical exams, standard oral glucose tolerance tests (OGTT), and blood sample collection. Follow-up surveys were conducted in 2014, 2016, and 2021, with 9,126 participants retained, resulting in a follow-up rate of 91.19%.
Supplementary Figure 1 presents the flowchart outlining the inclusion and exclusion criteria for study participants. Initially, 13 participants were excluded due to missing baseline data in more than 10% of cases. Subsequently, 12 participants were excluded due to a prior diagnosis of type 2 diabetes, and 17 participants were lost to follow-up in 2021. Ultimately, the final analysis included 9,084 participants.
Data collection
Baseline data were collected at community health stations, with standardized collection times scheduled in the morning. Participants were instructed to fast for at least 10 hours prior to their appointments. Trained health workers administered standardized questionnaires to gather detailed data on demographics, dietary habits, lifestyle factors, current and past medical histories, and medication use. Nurses, adhering to standardized protocols, measured participants’ weight, height, blood pressure, and waist circumference. Participants were instructed to rest quietly for at least 30 minutes before the measurements and to avoid alcohol, smoking, tea consumption, and vigorous exercise. Blood pressure was recorded using a standardized electronic sphygmomanometer (HEM-752 FUZZY; Omron, Dalian, China), with three readings taken and the average value calculated for accuracy. Blood samples were then collected and sent to a central laboratory for analysis of HbA1c levels and circulating metabolites, including blood lipids. HbA1c levels were quantified using high-performance liquid chromatography (VARIANT II system; Bio-Rad, Hercules, California), and blood lipids were measured using an automated analyzer (Abbott Laboratories, Abbott Park, Illinois). Smoking status was categorized as current smokers (defined as smoking at least 7 cigarettes per week for at least 6 months) and non-smokers. Alcohol use was classified into current drinkers (defined as consuming alcohol at least once a week for at least 6 months) and former drinkers (20).
Ascertainment of covariates
Consistent with previous studies, we included a range of potential confounding variables in the baseline statistical analysis (21). The variables included demographic factors such as age and gender (classified as “male” and “female”), educational level (categorized as “below high school” and “high school and above”), and lifestyle factors such as smoking status (“yes” or “no”) and alcohol consumption status (“yes” or “no”). Furthermore, we adjusted for several clinical indicators, including systolic blood pressure (SBP), diastolic blood pressure (DBP), body mass index (BMI), fasting blood glucose (FBG), triglycerides (TG), serum creatinine (Cr), total cholesterol (TC), high-density lipoprotein cholesterol (HDL-C), low-density lipoprotein cholesterol (LDL-C), and HbA1c.
Assessment of all-cause mortality
To confirm the outcome events for participants, we integrated data from hospital databases, national insurance system medical records, and resident records, ensuring comprehensive collection of the necessary information. All-cause mortality was defined as death from any cause, verified by cross-checking relevant documents with two independent healthcare workers.
HGI calculation
A linear regression model was developed to examine the relationship between FBG and HbA1c using data from all participants in this study (Supplementary Figure 2). The X-axis represents FBG levels, while the Y-axis represents HbA1c levels. The regression equation used to predict HbA1c levels is HbA1c = 0.03 × FBG (mg/dL) + 2.95 (r2 = 0.68; P < 0.001). Subsequently, the observed HbA1c level was subtracted from the predicted HbA1c level to calculate each participant’s HGI(HGI = observed HbA1c - predicted HbA1c).
Statistical analysis
The study population was categorized into four groups based on HGI quartiles: Q1 (n = 2260, HGI < -0.31), Q2 (n = 2281, -0.31 ≤ HGI < -0.01), Q3 (n = 2270, -0.01 ≤ HGI < 0.29), and Q4 (n = 2273, HGI ≥ 0.29). Baseline characteristics of participants were systematically summarized using appropriate statistical methods according to the data type. Continuous variables were expressed as mean ± standard deviation, while categorical variables were reported as counts (percentages). For normally distributed variables, analysis of variance (ANOVA) was applied; for skewed variables, the Kruskal-Wallis test was employed; and for categorical variables, the chi-square test was used. Kaplan-Meier survival analysis and log-rank tests, stratified by HGI quartiles, were performed to assess group differences. Cox proportional hazards regression was utilized to examine the potential association between HGI and all-cause mortality. Hazard ratios (HR) and 95% confidence intervals (CI) were computed using four distinct adjustment models. Model 1 was the unadjusted model; Model 2 adjusted for age and sex; Model 3 adjusted for age, sex, DBP, SBP, LDL-C, TC, Cr, FBG, and HbA1c; and Model 4 was fully adjusted for age, sex, DBP, SBP, LDL-C, TC, Cr, FBG, HbA1c, smoking status, alcohol consumption, and education level. The trend p-value was computed by treating HGI quartiles as an ordinal variable. Additionally, restricted cubic splines (RCS) with four nodes were used in Model 4 to examine the nonlinear relationship between HGI and all-cause mortality, and a threshold effect model was applied to identify the inflection point of HGI (22). Finally, subgroup analyses were conducted based on age (<60, ≥60), sex (male, female), and BMI (<25, ≥25), and interaction effects were evaluated. Non-significant interaction p-values were considered to indicate consistency across subgroups.
All statistical analyses were performed using SPSS version 26.0 and R version 4.3.3, with forest plots generated using GraphPad Prism version 10.0. Two-sided P-values < 0.05 were considered statistically significant.
Result
Baseline characteristics
This study included 9084 participants, with a mean age of 58.49 ± 10.01 years, consisting of 3085 men (34.0%) and 5999 women (66%). Baseline data stratified by HGI quartiles are presented in Table 1. The high HGI group exhibited higher age, LDL, TG, and HbA1c levels, along with lower HDL compared to the low HGI group. Participants in the Q1 and Q4 groups demonstrated significantly higher SBP, TC, and FBG levels compared to those in the Q2 and Q3 groups. Additionally, a higher proportion of participants in the Q2 group had completed high school education or higher.
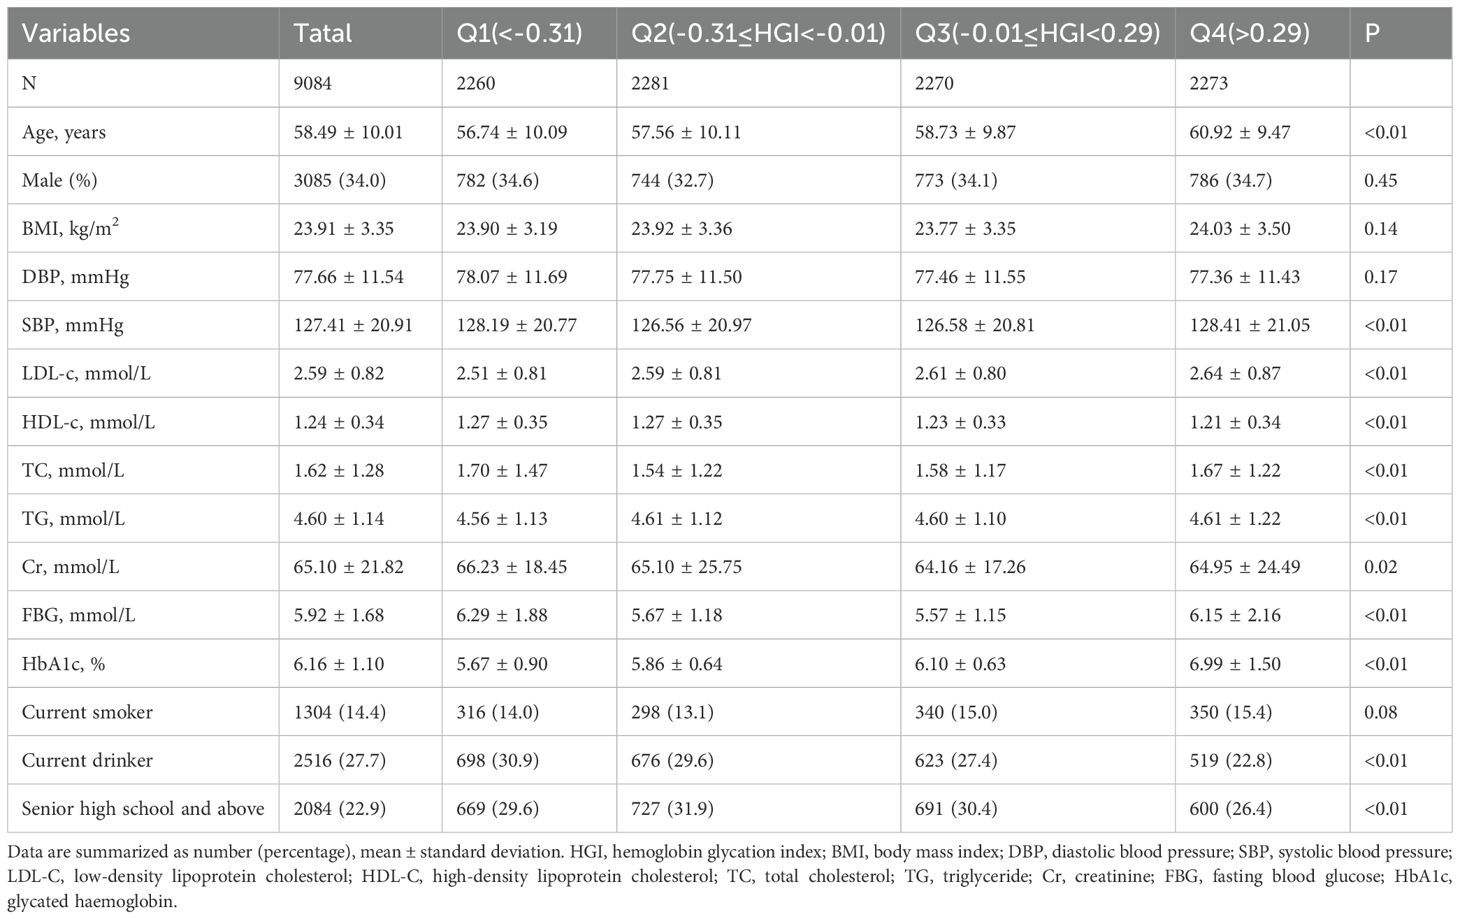
Table 1. Baseline characteristics of participants by HGI quartile.
Survival analysis
Kaplan-Meier survival curves stratified by HGI quartiles were utilized to compare the incidence of all-cause mortality across the HGI groups (Figure 1A). The Q2 group exhibited significantly lower all-cause mortality compared to the other groups, while the Q4 group demonstrated the highest all-cause mortality (Log-rank test p < 0.01). This suggests that both high and low HGI levels may negatively impact long-term survival, with particularly detrimental effects associated with high HGI.
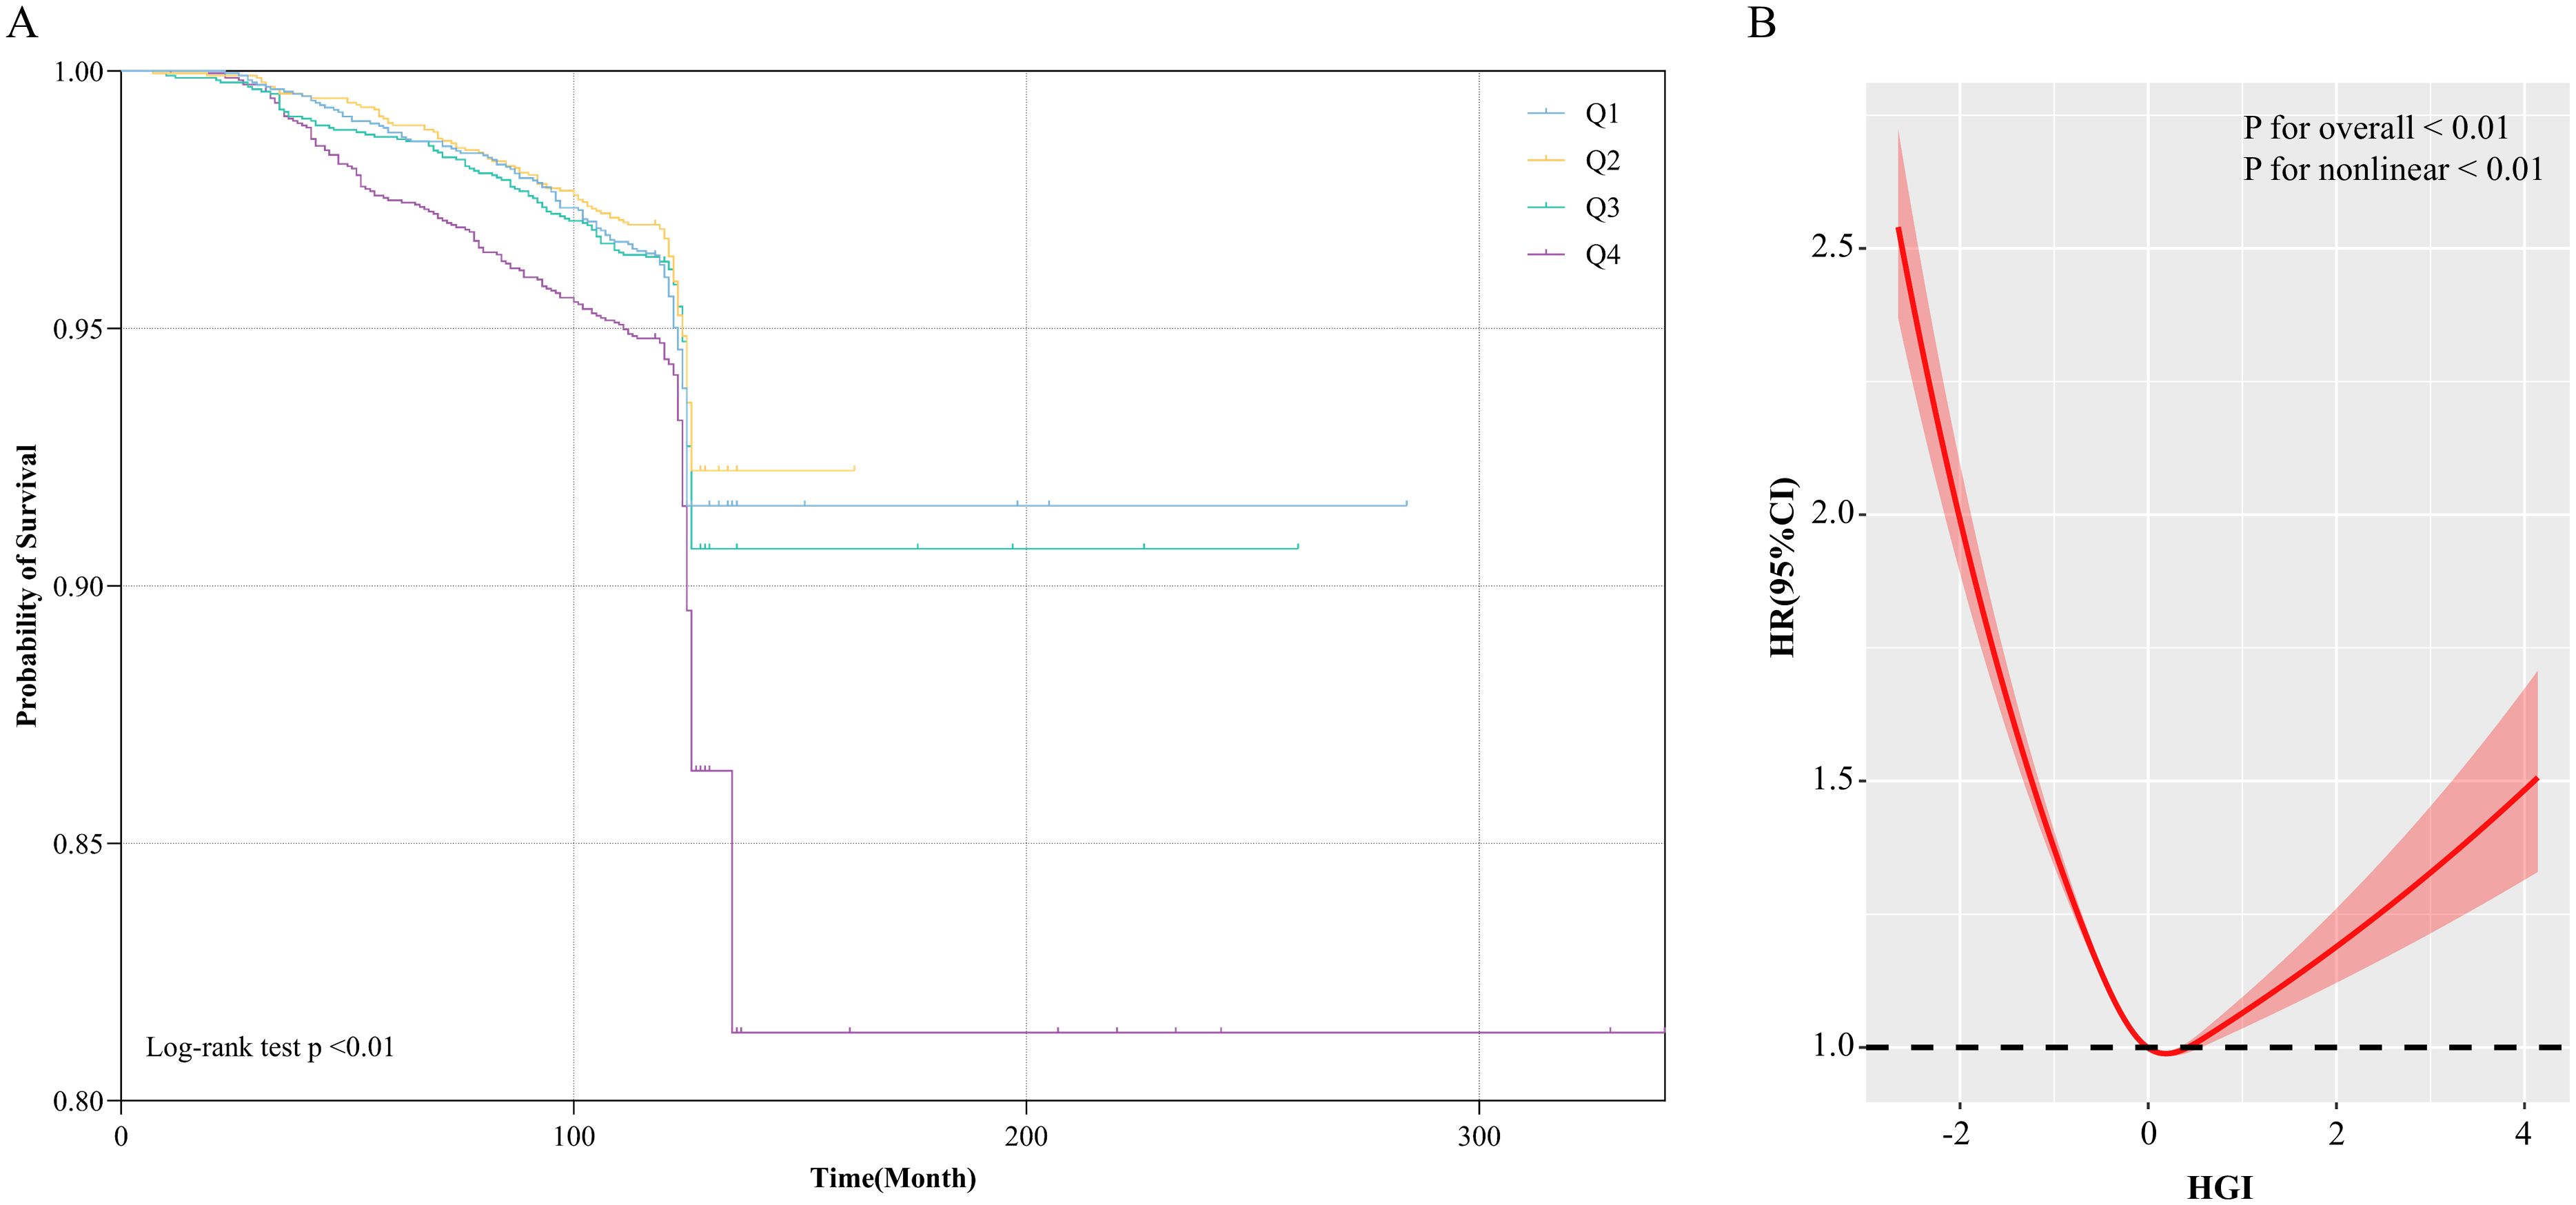
Figure 1. (A) Kaplan-Meier all-cause mortality survival analysis curve; (B) Results of RCS analysis of the association between HGI and all-cause mortality. Adjusted for age, sex, DBP, SBP, LDL-c, HDL-c, TG, TC, Cr, FBG, HbA1c, smoking status, alcohol consumption, and education level.
Association of HGI with all-cause mortality
The survival analysis revealed that the Q2 group exhibited the lowest all-cause mortality in comparison to the other groups. Building upon these findings, the Q2 group was used as the reference to construct a Cox proportional hazards model for assessing the potential association between HGI and all-cause mortality. The results indicated that, during the 10-year follow-up, a total of 514 all-cause deaths were recorded, corresponding to an overall mortality rate of 5.66%. The Q4 group exhibited the highest all-cause mortality rate (7.74%), followed by the Q1 group (5.22%). In the fully adjusted model (Model 4), both low and high HGI levels were significantly associated with all-cause mortality compared to the Q2 group (Q1 vs Q2: HR, 1.32 [1.04, 1.73], p < 0.05; Q4 vs Q2: HR, 1.32 [1.12, 1.53], p < 0.05). Therefore, we conclude that both high and low HGI levels represent significant risk factors for all-cause mortality (Table 2). Subsequently, we employed RCS modeling, which revealed a “U”-shaped relationship between HGI and all-cause mortality risk (p for nonlinear < 0.01, Figure 1B). The threshold effect analysis identified an HGI threshold of 0.07 for all-cause mortality (Table 3).
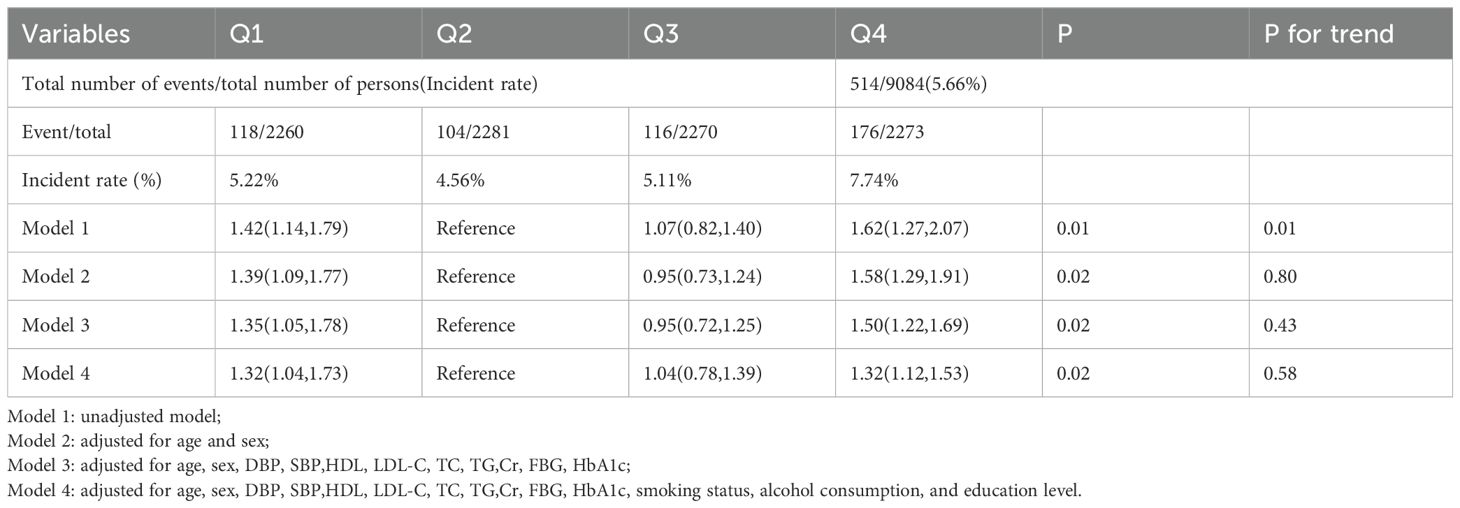
Table 2. Hazard ratios and 95% CIs for the association of HGI with all-cause mortality.
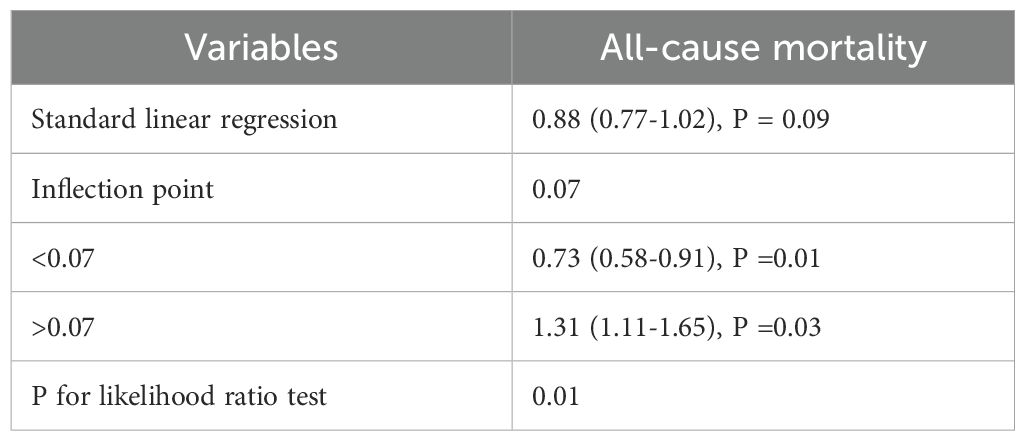
Table 3. Threshold effect analysis.
Subgroup analyses
Finally, a risk subgroup analysis was performed based on age, gender, and BMI (Figure 2). The results indicated that both low (Q1) and high (Q4) HGI levels were significantly associated with all-cause mortality in the subgroups of individuals aged ≥ 60 years, males, and females. Additionally, high HGI (Q4) was strongly associated with all-cause mortality across all BMI subgroups. Furthermore, no significant interactions were observed between HGI levels and subgroup variables (p for interaction > 0.05).
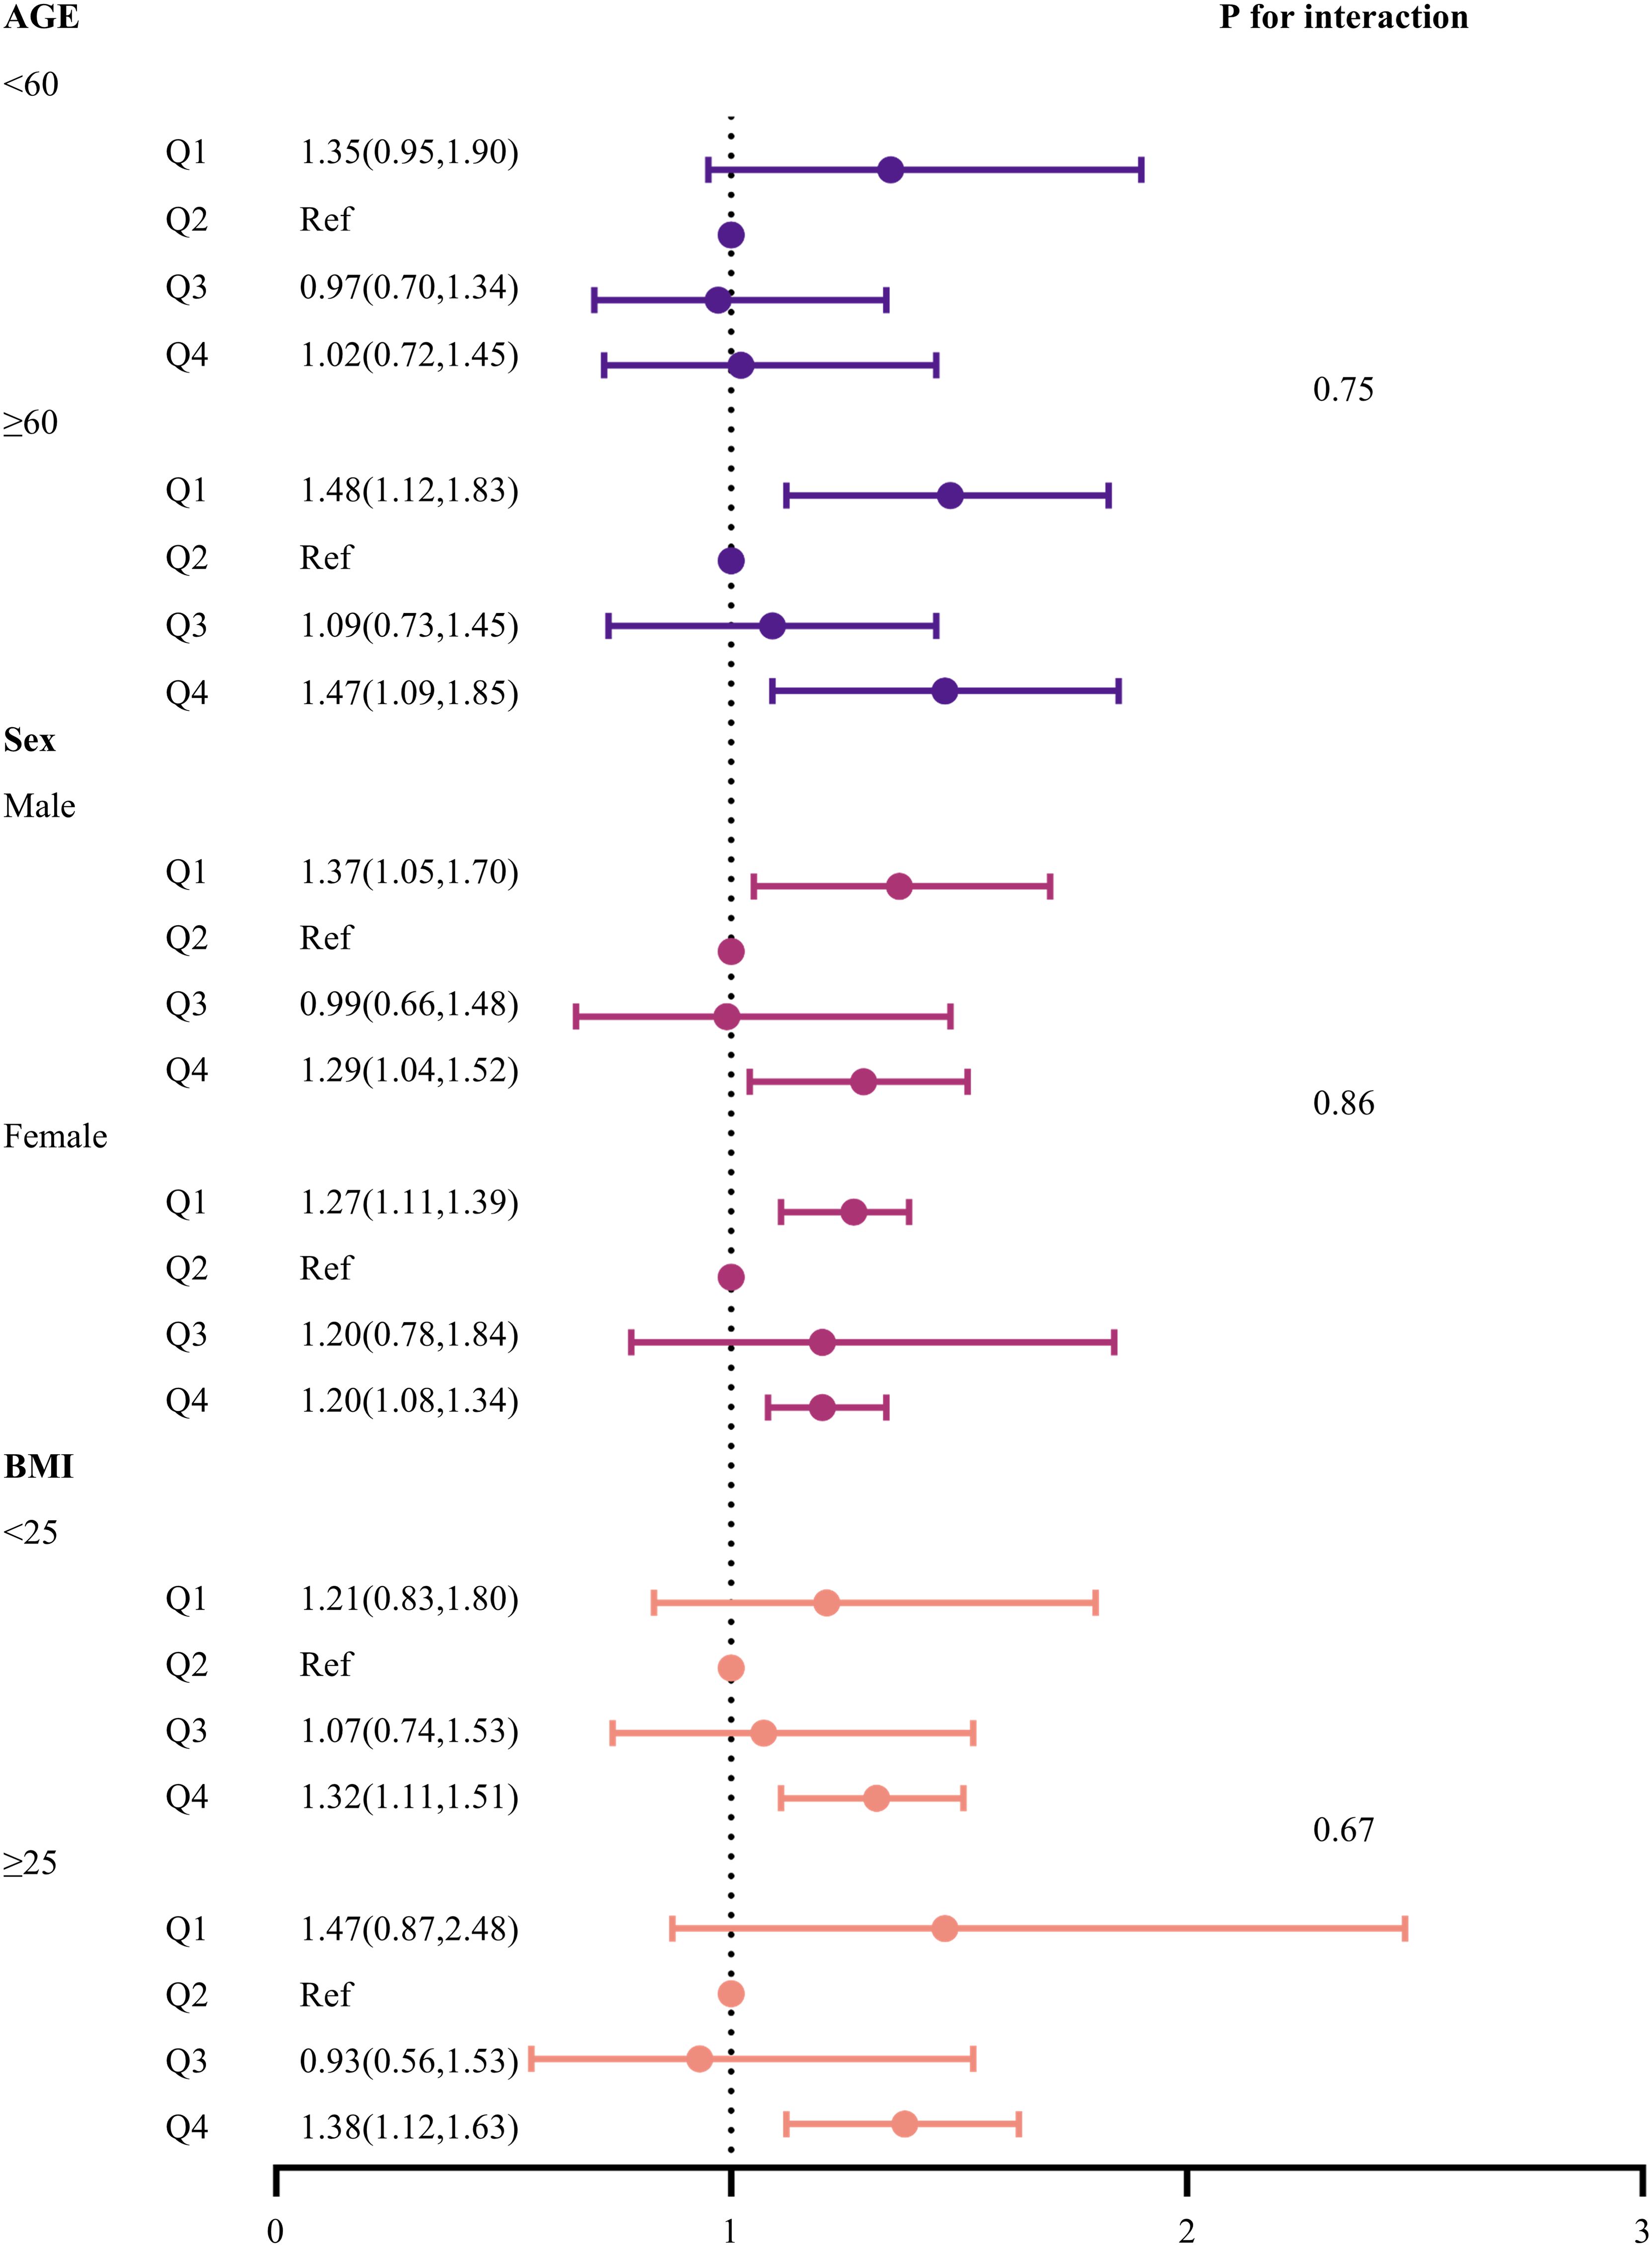
Figure 2. Forest plot of subgroup analyses of the relationship between HGI and all-cause mortality. Adjusted for age, sex, DBP, SBP, LDL-c, HDL-c, TG, TC, Cr, FBG, HbA1c, smoking status, alcohol consumption, and education level.
Discussion
In this retrospective cohort study of 9,084 Chinese adults, we found that both high and low HGI levels were significantly associated with all-cause mortality when compared to individuals with moderate HGI levels. The RCS-based analysis revealed a distinct U-shaped relationship between HGI and the risk of all-cause mortality, with a threshold value of 0.07, suggesting that both high and low HGI levels may impact long-term survival to varying degrees, consistent with the findings from the Cox proportional hazards model. Therefore, these findings suggest that HGI could serve as an independent risk factor for all-cause mortality and has the potential to function as an early biomarker for monitoring an individual’s survival status.
HbA1c is formed through a non-enzymatic reaction between intracellular HbA1 and glucose, leading to discrepancies between actual and predicted HbA1c levels, particularly among different individuals, though the underlying mechanism remains poorly understood (23). Since the introduction of HGI as a tool to quantify blood glucose variability across diverse populations, numerous studies have sought to explore its potential clinical utility. For example, HGI has been strongly associated with contrast-induced acute kidney injury, non-alcoholic fatty liver disease, and cardiovascular mortality (24, 25). In populations with glucose intolerance, elevated HGI levels have been associated with telomere attrition, suggesting an underlying state of inflammation and oxidative stress (26). These studies suggest that HGI may serve as an effective biomarker for monitoring an individual’s disease status.
In the Diabetes Control and Complications Trial, researchers initially found that increasing HGI was associated with a threefold and sixfold increase in the risk of retinal and kidney complications, respectively, in diabetic patients (27). However, this does not suggest that low HGI acts as a protective factor against disease, particularly concerning cardiovascular disease and mortality risk (28). FBG, a primary indicator of glucose metabolism, is similarly strongly associated with individual mortality. A bidirectional cohort study demonstrated that elevated FBG is a risk factor for 1-year all-cause mortality in COVID-19 hospitalized patients (29). In patients with type 2 diabetes, elevated FBG levels are also considered an independent risk factor for accelerating premature mortality (30). However, the relationship between FBG, HbA1c, and disease outcomes appears to be variable. This highlights the importance of detecting HGI. A study using the MIMIC-IV database, however, found that HGI exhibited a U-shaped relationship with mortality in critically ill CAD patients, where both low and high HGI were identified as risk factors for death in this population (18). In recent years, low HGI has garnered increasing attention in research. Østergaard et al. (31) suggested that low HGI may serve as a risk factor for myocardial infarction in diabetic patients. Wang et al. (32) identified a U-shaped relationship between HGI and 5-year major cardiovascular events. We hypothesize that HGI may influence individual mortality risk through the following mechanisms: First, a study employing skin endogenous fluorescence technology found that skin advanced glycation end-products are associated with HGI (33). Advanced glycation end-products are a class of heterogeneous compounds that promote low-density lipoprotein modification, induce oxidative stress, activate Toll-like receptor 4-mediated pro-inflammatory signaling, and drive fibrosis and endothelial dysfunction, all of which are implicated in the pathophysiology of diabetic complications, aging, and Alzheimer’s disease (34–36). Second, advanced glycation end-products contribute to insulin resistance and β-cell dysfunction, leading to glucose metabolism disorders (37). This study found that both low and high HGI are associated with metabolic disorders, including lipid, glucose, and protein metabolism, all of which negatively affect long-term survival.
Strengths and limitations
This study offers several notable advantages. First, the study involved a representative Chinese population with a substantial sample size. Secondly, this cohort study benefits from an extended follow-up period and high response rates, providing a robust framework that mitigates the inherent biases of cross-sectional studies and enhances the reliability of the findings. Third, the 4C study was carried out by trained healthcare professionals adhering to standardized protocols for data collection and disease diagnosis, significantly reducing potential bias due to human factors. Finally, the use of RCS, threshold effect models, and subgroup analyses bolstered statistical power and affirmed the robustness of the results.
Despite its strengths, this study has several limitations. First, unaccounted variables, such as dietary patterns, racial differences, and lifestyle factors, may also affect the results. Secondly, as the study primarily involved participants from China, caution is warranted when generalizing the findings to other populations. Third, the calculation of HGI relies on data from a specific population, requiring the construction of a new regression equation for each study. Fourth, the inherent limitations of observational studies preclude establishing clear causal relationships. Fifth, the lack of data on the specific causes of death limited our ability to conduct a more nuanced analysis of the association between HGI and mortality. Future follow-up studies are planned to address this gap and provide deeper insights.
Conclusions
In conclusion, within the Chinese population, HGI is U-shapedly associated with the risk of all-cause mortality, with both elevated and reduced HGI levels serving as risk factors influencing long-term survival.
Data availability statement
The raw data supporting the conclusions of this article will be made available by the authors, without undue reservation.
Ethics statement
The studies involving humans were approved by the ethics committee of the Affiliated Hospital of Southwest Medical University (ethical approval code: 2018017). The patients/participants provided their written informed consent to participate in this study. The studies were conducted in accordance with the local legislation and institutional requirements. Written informed consent for participation was not required from the participants or the participants’ legal guardians/next of kin in accordance with the national legislation and institutional requirements.
Author contributions
Y-YZ: Conceptualization, Formal Analysis, Methodology, Writing – original draft. W-YL: Project administration, Software, Supervision, Visualization, Writing – original draft. QW: Funding acquisition, Validation, Writing – review & editing.
Funding
The author(s) declare that financial support was received for the research and/or publication of this article. The Ministry of Science and Technology of China and Southwest Medical University provided funding for this study through grants 2016YFC0901200 and 2024LCYXZX17.
Acknowledgments
Thanks to Ying Miao, Jie Lin, Xue Bai and others for their contributions to the data collection.
Conflict of interest
The authors declare that the research was conducted in the absence of any commercial or financial relationships that could be construed as a potential conflict of interest.
Generative AI statement
The author(s) declare that no Generative AI was used in the creation of this manuscript.
Publisher’s note
All claims expressed in this article are solely those of the authors and do not necessarily represent those of their affiliated organizations, or those of the publisher, the editors and the reviewers. Any product that may be evaluated in this article, or claim that may be made by its manufacturer, is not guaranteed or endorsed by the publisher.
Supplementary material
The Supplementary Material for this article can be found online at: https://www.frontiersin.org/articles/10.3389/fendo.2025.1586309/full#supplementary-material
Supplementary Figure 1 | Flowchart for the Selection of the Analyzed Study Sample From the 4C study’s database
Supplementary Figure 2 | Linear correlation between the FBG and HbA1c levels. Predicted HbA1c level = 0.03 × FBG (mg/dL) + 2.95 as revealed by linear regression (black solid line). FBG, Fasting blood glucose; HbA1c, Glycosylated hemoglobin.
References
1. Lee SC and Chan JC. Evidence for DNA damage as a biological link between diabetes and cancer. Chin Med J (Engl). (2015) 128(11). doi: 10.4103/0366-6999.157693
2. Chan JCN, Lim LL, Wareham NJ, Shaw JE, Orchard TJ, Zhang P, et al. The Lancet Commission on diabetes: using data to transform diabetes care and patient lives. Lancet Lond Engl. (2021) 396(10267). doi: 10.1016/S0140-6736(20)32374-6
3. Global, regional, and national burden of diabetes from 1990 to 2021, with projections of prevalence to 2050: a systematic analysis for the Global Burden of Disease Study 2021. Lancet Lond Engl. (2023) 402(10397). doi: 10.1016/S0140-6736(23)01301-6
4. Yan Y, Wu T, Zhang M, Li C, Liu Q, and Li F. Prevalence, awareness and control of type 2 diabetes mellitus and risk factors in Chinese elderly population. BMC Public Health. (2022) 22(1). doi: 10.1186/s12889-022-13759-9
5. Tinajero MG and Malik VS. An update on the epidemiology of type 2 diabetes: A global perspective. Endocrinol Metab Clin North Am. (2021) 50(3). doi: 10.1016/j.ecl.2021.05.013
6. 2. Diagnosis and classification of diabetes: standards of care in diabetes-2024. Diabetes Care. (2024) 47(Suppl 1). doi: 10.2337/dc24-S002
7. van Steen SC, Woodward M, Chalmers J, Li Q, Marre M, Cooper Me, et al. Haemoglobin glycation index and risk for diabetes-related complications in the Action in Diabetes and Vascular Disease: Preterax and Diamicron Modified Release Controlled Evaluation (ADVANCE) trial. Diabetologia. (2018) 61(4). doi: 10.1007/s00125-017-4539-1
8. Nathan DM, Kuenen J, Borg R, Zheng H, Schoenfeld D, and Heine RJ. Translating the A1C assay into estimated average glucose values. Diabetes Care. (2008) 31(8). doi: 10.2337/dc08-0545
9. Khera PK, Joiner CH, Carruthers A, Lindsell CJ, Smith EP, Franco RS, et al. Evidence for interindividual heterogeneity in the glucose gradient across the human red blood cell membrane and its relationship to hemoglobin glycation. Diabetes. (2008) 57(9). doi: 10.2337/db07-1820
10. Vural Keskinler M, Takir M, Caklili OT, and Oguz A. The frequency and determinants of hbA1c variability in type 2 diabetic patients. Metab Syndr Relat Disord. (2021) 19(7). doi: 10.1089/met.2020.0131
11. Delpierre G, Veige-da-Cunha M, Vertommen D, Buysschaert M, and Van Schaftingen E. Variability in erythrocyte fructosamine 3-kinase activity in humans correlates with polymorphisms in the FN3K gene and impacts on haemoglobin glycation at specific sites. Diabetes Metab. (2006) 32(1). doi: 10.1016/s1262-3636(07)70244-6
12. Hempe JM, Gomez R, McCarter RJ, and Chalew SA. High and low hemoglobin glycation phenotypes in type 1 diabetes: a challenge for interpretation of glycemic control. J Diabetes Complications. (2002) 16(5). doi: 10.1016/s1056-8727(01)00227-6
13. Soros AA, Chalew SA, McCarter RJ, Shepard R, and Hempe JM. Hemoglobin glycation index: a robust measure of hemoglobin A1c bias in pediatric type 1 diabetes patients. Pediatr Diabetes. (2010) 11(7). doi: 10.1111/j.1399-5448.2009.00630.x
14. Jin JL, Sun D, Cao YX, Guo YL, Wu NQ, Zhu CG, et al. Triglyceride glucose and haemoglobin glycation index for predicting outcomes in diabetes patients with new-onset, stable coronary artery disease: a nested case-control study. Ann Med. (2018) 50(7). doi: 10.1080/07853890.2018.1523549
15. Klein KR, Franek E, Marso S, Pieber TR, Pratley RE, Gowda A, et al. Hemoglobin glycation index, calculated from a single fasting glucose value, as a prediction tool for severe hypoglycemia and major adverse cardiovascular events in DEVOTE. BMJ Open Diabetes Res Care. (2021) 9(2). doi: 10.1136/bmjdrc-2021-002339
16. Hempe JM, Liu S, Myers L, McCarter RJ, Buse JB, and Fonseca V. The hemoglobin glycation index identifies subpopulations with harms or benefits from intensive treatment in the ACCORD trial. Diabetes Care. (2015) 38(6). doi: 10.2337/dc14-1844
17. Pan Y, Jing J, Wang Y, Liu L, Wang Y, and He Y. Association of hemoglobin glycation index with outcomes of acute ischemic stroke in type 2 diabetic patients. Neurol Res. (2018) 40(7). doi: 10.1080/01616412.2018.1453991
18. Wei X, Chen X, Zhang Z, Wei J, Hu B, Long NV, et al. Risk analysis of the association between different hemoglobin glycation index and poor prognosis in critical patients with coronary heart disease-A study based on the MIMIC-IV database. Cardiovasc Diabetol. (2024) 23:113. doi: 10.1186/s12933-024-02206-1
19. Lu J, He J, Li M, Tang X, Hu R, Shi L, et al. Predictive value of fasting glucose, postload glucose, and hemoglobin A1c on risk of diabetes and complications in chinese adults. Diabetes Care. (2019) 42(8). doi: 10.2337/dc18-1390
20. Wang T, Lu J, Su Q, Chen Y, Bi Y, Mu Y, et al. Ideal cardiovascular health metrics and major cardiovascular events in patients with prediabetes and diabetes. JAMA Cardiol. (2019) 4(9). doi: 10.1001/jamacardio.2019.2499
21. Warren B, Pankow JS, Matsushita K, Punjabi NM, Daya NR, Grams M, et al. Comparative prognostic performance of definitions of prediabetes: a prospective cohort analysis of the Atherosclerosis Risk in Communities (ARIC) study. Lancet Diabetes Endocrinol. (2017) 5(1). doi: 10.1016/S2213-8587(16)30321-7
22. Dou J, Guo C, Wang Y, Peng Z, Wu R, Li Q, et al. Association between triglyceride glucose-body mass and one-year all-cause mortality of patients with heart failure: a retrospective study utilizing the MIMIC-IV database. Cardiovasc Diabetol. (2023) 22(1). doi: 10.1186/s12933-023-02047-4
23. Bookchin RM and Gallop PM. Structure of hemoglobin AIc: nature of the N-terminal beta chain blocking group. Biochem Biophys Res Commun. (1968) 32(1). doi: 10.1016/0006-291x(68)90430-0
24. Xing Y, Zhen Y, Yang L, Huo L, and Ma H. Association between hemoglobin glycation index and non-alcoholic fatty liver disease. Front Endocrinol. (2023) 14:1094101. doi: 10.3389/fendo.2023.1094101
25. Chen Z, Li D, Lin M, Jiang H, Xu T, Shan Y, et al. Association of hemoglobin glycation index with contrast-induced acute kidney injury in patients undergoing coronary angiography: A retrospective study. Front Physiol. (2022) 13:870694. doi: 10.3389/fphys.2022.870694
26. Lyu L, Yu J, Liu Y, He S, Zhao Y, Qi M, et al. High hemoglobin glycation index is associated with telomere attrition independent of hbA1c, mediated by TNFα. J Clin Endocrinol Metab. (2022) 107(2). doi: 10.1210/clinem/dgab703
27. McCarter RJ, Hempe JM, Gomez R, and Chalew SA. Biological variation in HbA1c predicts risk of retinopathy and nephropathy in type 1 diabetes. Diabetes Care. (2004) 27(6). doi: 10.2337/diacare.27.6.1259
28. Carette C and Czernichow S. Harms and benefits of the haemoglobin glycation index (HGI). Eur J Prev Cardiol. (2017) 24(13). doi: 10.1177/2047487317717821
29. Chai C, Chen K, Li S, Cheng G, Wang W, Wang H, et al. Effect of elevated fasting blood glucose level on the 1-year mortality and sequelae in hospitalized COVID-19 patients: A bidirectional cohort study. J Med Virol. (2022) 94(7). doi: 10.1002/jmv.27737
30. Liu Y, Xu H, Li J, Yang Y, Zhang J, Liu X, et al. Separate and combined effect of visit-to-visit glycaemic variability and mean fasting blood glucose level on all-cause mortality in patients with type 2 diabetes: A population-based cohort study. Diabetes Obes Metab. (2022) 24(12). doi: 10.1111/dom.14826
31. Østergaard HB, Mandrup-Poulsen T, Berkelmans GFN, van der Graaf Y, Visseren FLJ, and Westerink J. Limited benefit of haemoglobin glycation index as risk factor for cardiovascular disease in type 2 diabetes patients. Diabetes Metab. (2019) 45(3). doi: 10.1016/j.diabet.2018.04.006
32. Wang Y, Liu H, Hu X, Wang AP, Wang AN, Kang S, et al. Association between hemoglobin glycation index and 5-year major adverse cardiovascular events: the REACTION cohort study. Chin Med J (Engl). (2023) 136:2468. doi: 10.1097/CM9.0000000000002717
33. Felipe DL, Hempe JM, Liu S, Matter N, Maynard J, Linares C, et al. Skin intrinsic fluorescence is associated with hemoglobin A(1c)and hemoglobin glycation index but not mean blood glucose in children with type 1 diabetes. Diabetes Care. (2011) 34(8). doi: 10.2337/dc11-0049
34. King GL and Brownlee M. The cellular and molecular mechanisms of diabetic complications. Endocrinol Metab Clin North Am. (1996) 25(2). doi: 10.1016/s0889-8529(05)70324-8
35. Wendt T, Tanji N, Guo J, Hudson BI, Bierhaus A, Ramasamy R, et al. Glucose, glycation, and RAGE: implications for amplification of cellular dysfunction in diabetic nephropathy. J Am Soc Nephrol JASN. (2003) 14(5). doi: 10.1097/01.asn.0000065100.17349.ca
36. Hodgkinson CP, Laxton RC, Patel K, and Ye S. Advanced glycation end-product of low density lipoprotein activates the toll-like 4 receptor pathway implications for diabetic atherosclerosis. Arterioscler Thromb Vasc Biol. (2008) 28(12). doi: 10.1161/ATVBAHA.108.175992
Keywords: hemoglobin glycation index, all-cause mortality, prospective cohort study, U-shaped correlation, risk fcator
Citation: Zhang Y-Y, Li W-Y and Wan Q (2025) Hemoglobin glycation index and all-cause mortality in adults: insights from a decade-long prospective cohort study. Front. Endocrinol. 16:1586309. doi: 10.3389/fendo.2025.1586309
Received: 02 March 2025; Accepted: 12 May 2025;
Published: 29 May 2025.
Edited by:
Eduardo Hertel Ribeiro, Escola Superior de Ciências da Santa Casa de Misericórdia de Vitória (EMESCAM), BrazilReviewed by:
Shifeng Qiu, Southern Medical University, ChinaGuangda He, Chinese Academy of Medical Sciences and Peking Union Medical College, China
Copyright © 2025 Zhang, Li and Wan. This is an open-access article distributed under the terms of the Creative Commons Attribution License (CC BY). The use, distribution or reproduction in other forums is permitted, provided the original author(s) and the copyright owner(s) are credited and that the original publication in this journal is cited, in accordance with accepted academic practice. No use, distribution or reproduction is permitted which does not comply with these terms.
*Correspondence: Qin Wan, d2FucWluMzYwQHN3bXUuZWR1LmNu
†These authors have contributed equally to this work and share first authorship
‡ORCID: Qin Wan, orcid.org/0000-0001-7765-1416
Yue-Yang Zhang, orcid.org/0009-0006-7751-4888