 Shihab Kochumon1†
 Fatemah Bahman1†
 Shaima Albeloushi1
 Ashraf Al Madhoun2
 Fawaz Alzaid3,4
 Jaakko Tuomilehto5,6
 Fahd Al-Mulla2
 Rasheed Ahmad1*
- 1Department of Immunology and Microbiology, Dasman Diabetes Institute, Kuwait City, Kuwait
- 2Translational Research Department, Dasman Diabetes Institute, Kuwait City, Kuwait
- 3Department of Bioenergetics and Neurometabolism, Dasman Diabetes Institute, Kuwait City, Kuwait
- 4Institut Necker Enfants Malades (INEM), French Institute of Health and Medic Research (INSERM), Immunity and Metabolism of Diabetes (IMMEDIAB), Université de Paris Cité, Paris, France
- 5Department of Public Health and Welfare, Finnish Institute for Health and Welfare, Helsinki, Finland
- 6Department of Public Health, University of Helsinki, Helsinki, Finland
IL-23, a proinflammatory cytokine, plays a role in the development of inflammatory diseases. However, the association between IL-23 expression in adipose tissue (AT) and glycemic changes in obesity remains unclear. This cross-sectional study aimed to examine the relationship of adipose tissue IL-23 (AT-IL-23) expression with other inflammatory mediators within the same compartment and insulin resistance markers fasting blood glucose (FBG) and glycated hemoglobin (HbA1c) in overweight/obese individuals. Fat biopsies were collected from 10 individuals with a body mass index (BMI) < 25kg/m2 and 51 individuals with a BMI > 25kg/m2 and were analyzed for IL-23 and other inflammatory markers using qRT-PCR. Inflammatory markers, including CD16, CD11c, CCR2, CCR5, TNF-α, IL-1β, IL-2, IL-12, CCL8, CCL19, and CXCL9, were positively correlated with IL-23 in the AT-compartment in the obesity context. Notably, AT-IL-23 was correlated positively with FBG, HbA1c, and homeostasis model assessment of insulin resistance (HOMA-IR), while negatively correlating with adiponectin. These findings suggest that AT-IL-23 is associated with metabolic inflammation and insulin resistance in obesity, suggesting it may be of interest for future biomarker studies.
1 Introduction
Interleukin-23 (IL-23) is a heterodimeric cytokine with pro-inflammatory properties, crucial in the development and progression of several inflammatory diseases. The cytokine is predominantly secreted by activated immune cells such as monocytes, macrophages, and dendritic cells, which are present in peripheral tissues like the skin, the lining of the intestines, and the lungs (1). IL-23 can also be released by various other cells, including innate lymphoid cells, γδ T lymphocytes, and B cells (2, 3). IL-23 is composed of two subunits, p19 and p40, that work together to promote the development and proliferation of a type of T-helper cell known as Th17 cells.
(4). Th17 cells then generate inflammatory cytokines, contributing to chronic inflammation and tissue damage (5).
Elevated levels of IL-23 have been implicated in a range of autoimmune and inflammatory conditions, including colitis, gastritis, psoriasis, and arthritis (4, 6–8). Patients with rheumatoid arthritis exhibit elevated IL-23 levels in their plasma, synovial fluid, and synovial tissue within the affected joints (9, 10). Extensive evidence indicates that IL-23 is involved in regulating mucosal inflammatory responses in the gut and plays crucial roles in the pathophysiology of several diseases, including inflammatory bowel disease, ulcerative colitis, and Crohn’s disease (11–14).
IL-23, along with IL-12, functions as a critical mediator at the interface between innate and adaptive immunity by modulating antigen-presenting cells and promoting proinflammatory T cell responses (15, 16). Recent studies have shown that elevated LDL cholesterol is associated with increased IL-23 expression in adipose tissue, along with markers of inflammation, suggesting a role for IL-23 in bridging metabolic dysregulation and immune activation (17). By promoting sustained inflammation and perpetuating the immune response, IL-23 not only exacerbates several diseases, including inflammatory bowel disease, ulcerative colitis, and Crohn’s disease but also represents a promising target for therapeutic intervention aimed at modulating the immune system and alleviating autoimmune inflammatory disease symptoms (18).
Although IL-23 is recognized for its role in the progression of inflammatory diseases, the relationship between IL-23 expression in adipose tissue and glycemic changes in the context of overweight and obesity remains poorly studied. This cross-sectional study sought to explore whether IL-23 levels in adipose tissue correlate with other inflammatory mediators in the same compartment and indicators of insulin resistance, including FBG, HbA1c, and HOMA-IR, in overweight/obese individuals.
2 Materials and methods
2.1 Study population and anthropometric measurements
A total of 61 individuals without diabetes (10 individuals with BMI< 25 kg/m2 and 51 with BMI > 25 kg/m2) were recruited in this study. Among the study participants, 3 males and 2 females are taking medications (Bisoprolol, and Methyldopa) for hypertension. Among these, only two participants were using Atorvastatin, a lipid-lowering agent. All participants gave written informed consent, and the study was approved (RA# 2010–003; June 2010) by the Dasman Diabetes Institute ethics committee, which follows the updated guidelines and ethical principles for medical research involving human subjects as per World Medical Association (WMA) declaration of Helsinki. Anthropometric - measurements were determined as described earlier (19). The characteristics of the participants are summarized in Supplementary Table S1.
Power Analysis – Pearson Correlation
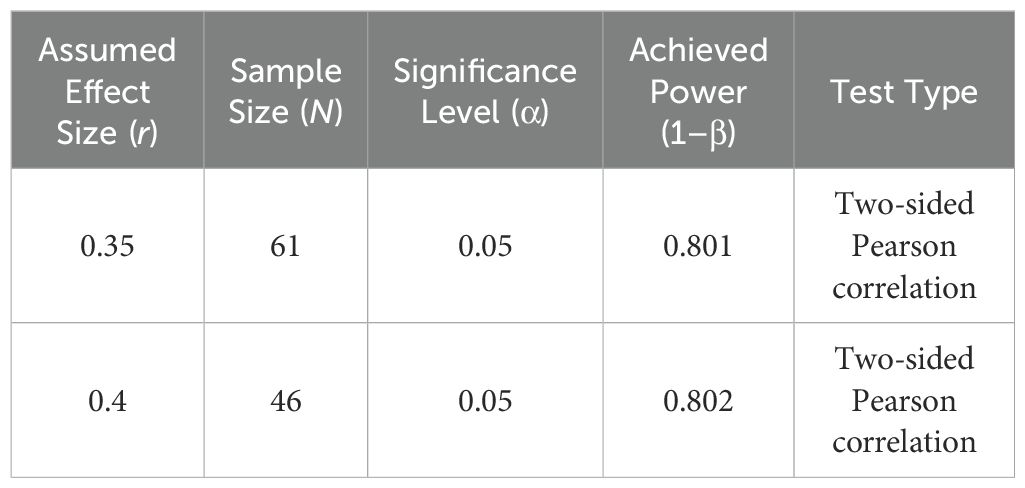
A priori power analyses for Pearson correlation were conducted using Fisher’s z-transformation and the normal approximation with bias adjustment, as implemented in SPSS. With a sample size of 61, the analysis achieved 80.1% power to detect a moderate correlation (r = 0.35), using a two-sided test at a significance level of 0.05. Likewise, with 46 participants, the analysis yielded 80.2% power to detect a correlation of r = 0.40. These power estimates demonstrate that the study is adequately powered to detect moderate-to-large effects in the relationships analyzed.
.
2.2 Collection of subcutaneous adipose tissue
Human adipose tissue samples were obtained through a biopsy of the abdominal subcutaneous fat pad located lateral to the umbilicus, and total RNA were isolated as described previously (19).
2.3 Anthropometric and metabolic measurements
Peripheral blood samples were collected from individuals who had fasted overnight and were analyzed for various metabolic parameters, including FBG, lipid profile, HbA1c, fasting insulin, and adiponectin levels. The glucose and lipid profiles, including plasma triglycerides (TG), high-density lipoprotein cholesterol (HDL-C), and total cholesterol (TC), were assessed using the Siemens Dimension RXL chemistry analyzer (Diamond Diagnostics, Holliston, MA). HbA1c was quantified with the Variant device (Bio-Rad, Hercules, CA, USA). Insulin resistance was evaluated using the HOMA-IR, calculated with the formula: HOMA-IR = (fasting insulin [μU/L] × fasting glucose [nmol/L])/22.5. In our study, serum adiponectin levels were measured using the Human Adiponectin/Acrp30 Magnetic Luminex® Performance Assay (Catalog #: LOBM1065, R&D Systems, Austin, TX, USA). This method was selected due to its high sensitivity (6.4 pg/mL) All assays were conducted following the manufacturer’s instructions.
2.4 Real‐time RT‐PCR
Total cellular RNA from adipose tissue (80 mg) was purified using RNeasy lipid tissue kit (Qiagen, Valencia, CA., USA) and following the manufacturer’s instructions. RNA samples were reverse transcribed into cDNA as instructed (High-Capacity cDNA Reverse Transcription kit; Applied Biosystems, CA, USA). To perform real‐time RT‐PCR, cDNA samples (50 ng each) were amplified (40 cycles) using TaqMan Gene Expression Master Mix (Applied Biosystems, CA, USA) and gene‐specific 20× TaqMan gene expression assays (Applied Biosystems, CA, USA) containing forward and reverse primers (Supplementary Table S2) and target‐specific TaqMan MGB probe labelled with FAM dye at the 5′ end and NFQ‐MGB at the 3′ end of the probe using 7500 Fast Real‐Time PCR System (Applied Biosystems, CA, USA). Each cycle involved denaturation (15 seconds at 95 °C), annealing/extension (1 minute at 60 °C) after uracil DNA glycosylases (UDG) activation (2 minutes at 50 °C) and AmpliTaq gold enzyme (10 minutes at 95 °C) activation. The amplified GAPDH expression was used as an internal control to normalize individual sample differences. The expression level of each gene target relative to the control (lean adipose tissue) was calculated using the 2−ΔΔCt method, and the relative mRNA expression was expressed as fold expression over the average control gene expression.
2.5 Statistical analysis
Statistical analysis was performed using GraphPad Prism software (La Jolla, CA, USA) and SPSS for Windows version 19.01 (IBM SPSS Inc., USA). Data are shown as mean ± standard deviation values, unless otherwise indicated. Unpaired Student t‐test was used to compare means between groups. Pearson Correlation analysis was performed to determine association between different variables. For all analyses, P value <0.05 was considered significant.
2.5.1 Multiple linear regression
To evaluate the independent contribution of associated markers to IL-23 expression, a multiple linear regression model was conducted using SPSS. IL-23 was entered as the dependent variable, while other independent markers were included as predictors of primary interest. Age, BMI, and Sex were included as covariates to adjust for potential confounding.
Standardized β coefficients, significance values, and Variance Inflation Factors (VIFs) were reported to assess both effect sizes and multicollinearity. The significance threshold was set at α = 0.05. Model assumptions (normality, linearity, homoscedasticity) were verified through residual diagnostics.
3 Results
3.1 IL-23 gene expression in the adipose tissue is associated with inflammatory markers in overweight/obese individuals
We asked if IL-23 gene expression in the adipose tissue was associated with inflammatory markers in the same compartment. In this regard, as shown in Table 1, IL-23 positively correlated with M1 macrophage markers CD11c (r= 0.45, P = 0.001), CD16 (r= 0.45, P = 0.001), CD127 (r= 0.38, P = 0.01), and chemokine receptors CCR2 (r= 0.42, P = 0.004) and CCR5 (r= 0.359, P = 0.011) Interestingly, IL-23 expression in adipose tissue also positively correlated with the M2 macrophage marker CLEC7A (r = 0.641, p < 0.0001). In addition, IL-23 demonstrated a positive association with several proinflammatory cytokines, including TNF-α (r = 0.31, p = 0.031), IL-1β (r = 0.32, p = 0.046), IL-2 (r = 0.40, p = 0.005), and IL-12 (r = 0.37, p = 0.018) and proinflammatory chemokines such as CCL5 (r = 0.64, p < 0.0001), CCL19 (r = 0.33, p = 0.025), and CXCL9 (r = 0.35, p = 0.01) (Table 1). It is noteworthy that these outcomes were exclusively observed in overweight/obese individuals, while no significant results were detected in the lean group.
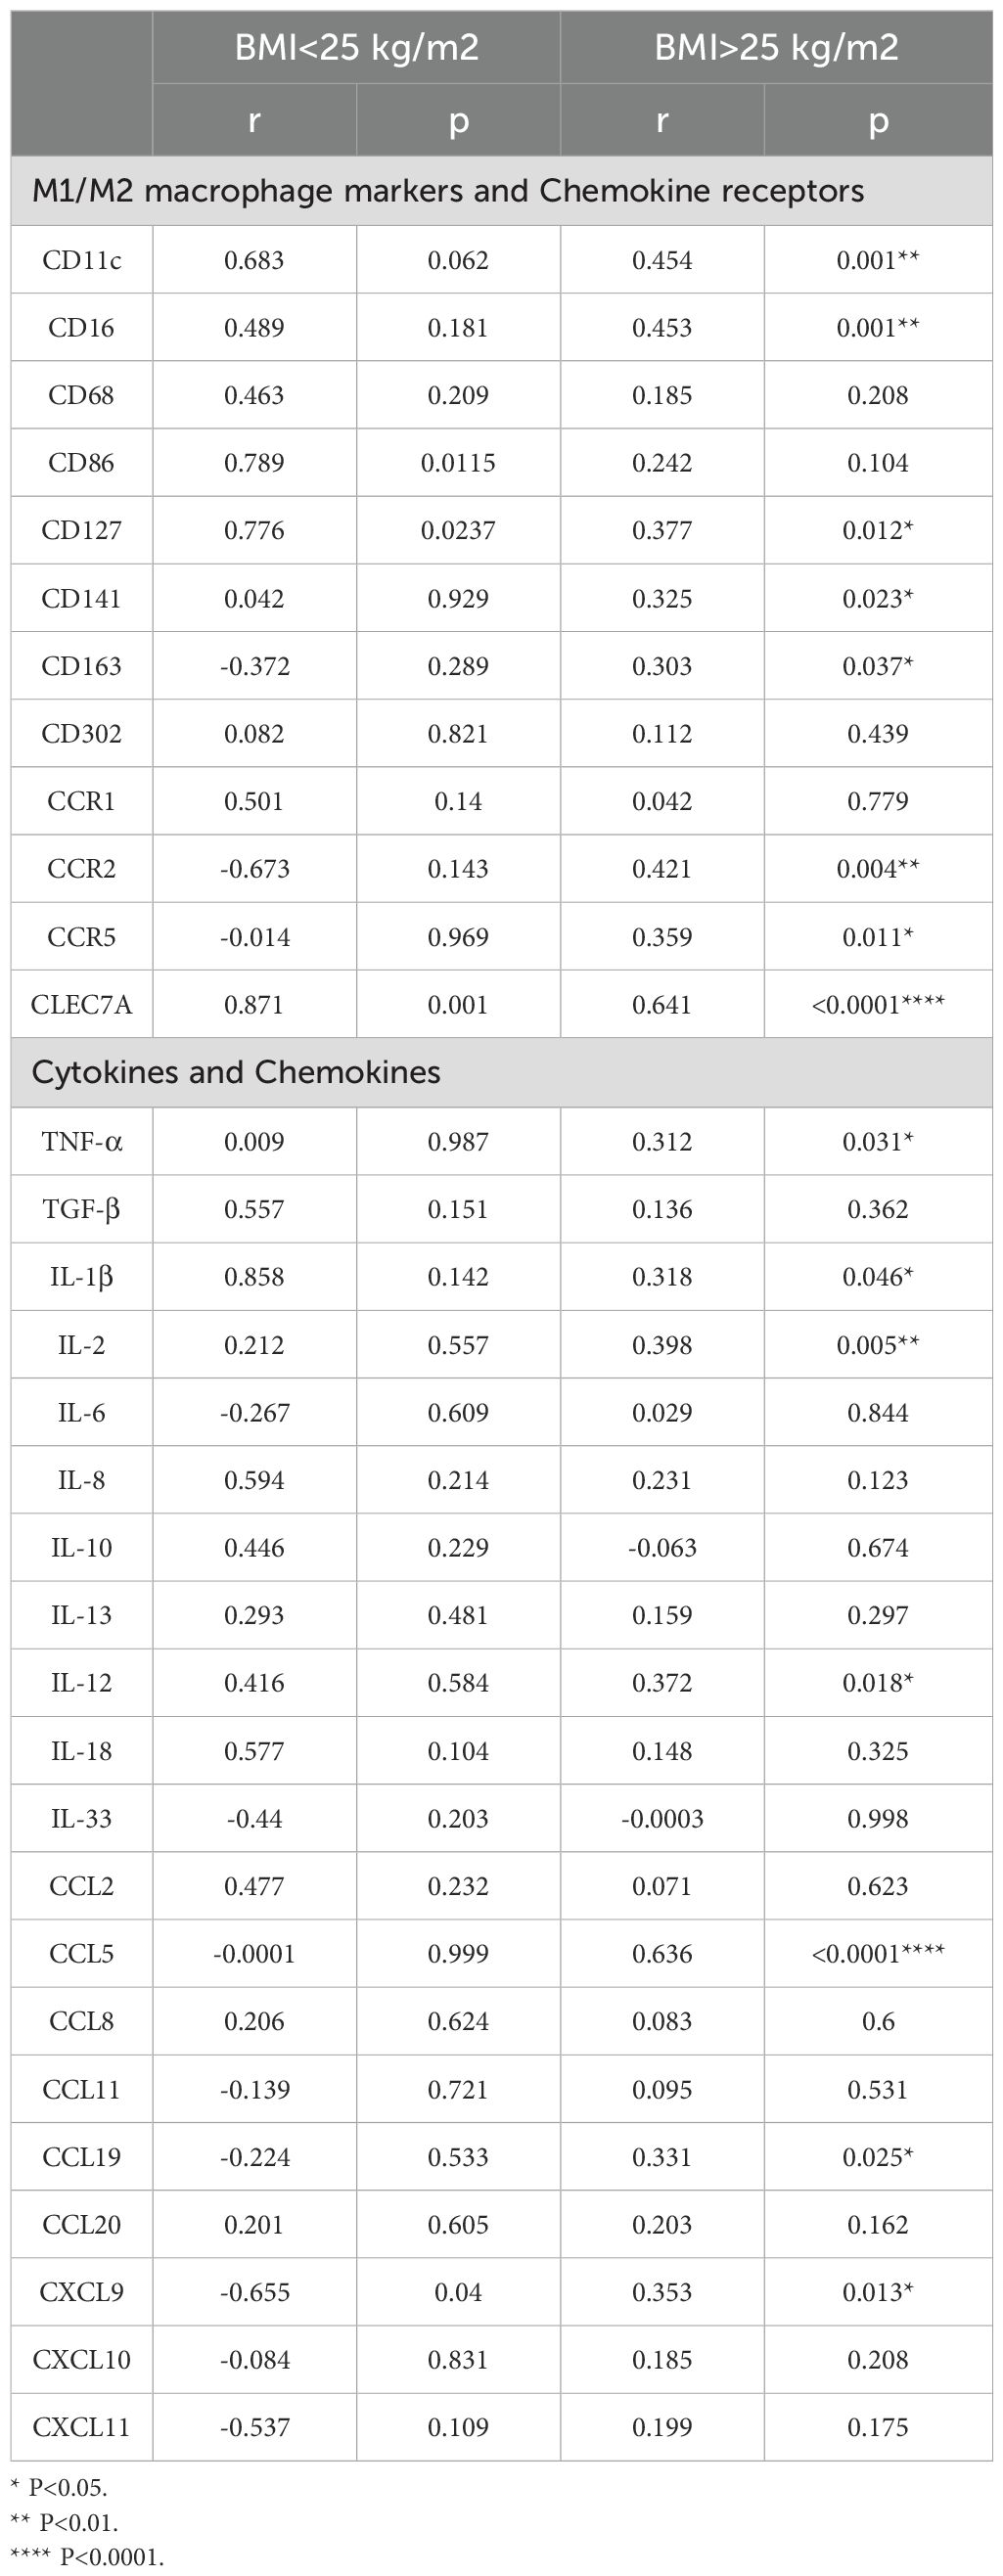
Table 1. IL-23 gene expression in the adipose tissue correlates with inflammatory markers.
Additionally, a multiple linear regression was conducted to assess the effect of associated markers on IL-23 expression, adjusting for age, BMI, and sex and we found CCL5 and CXCL9 as independent predictors of IL-23 (Table 2).
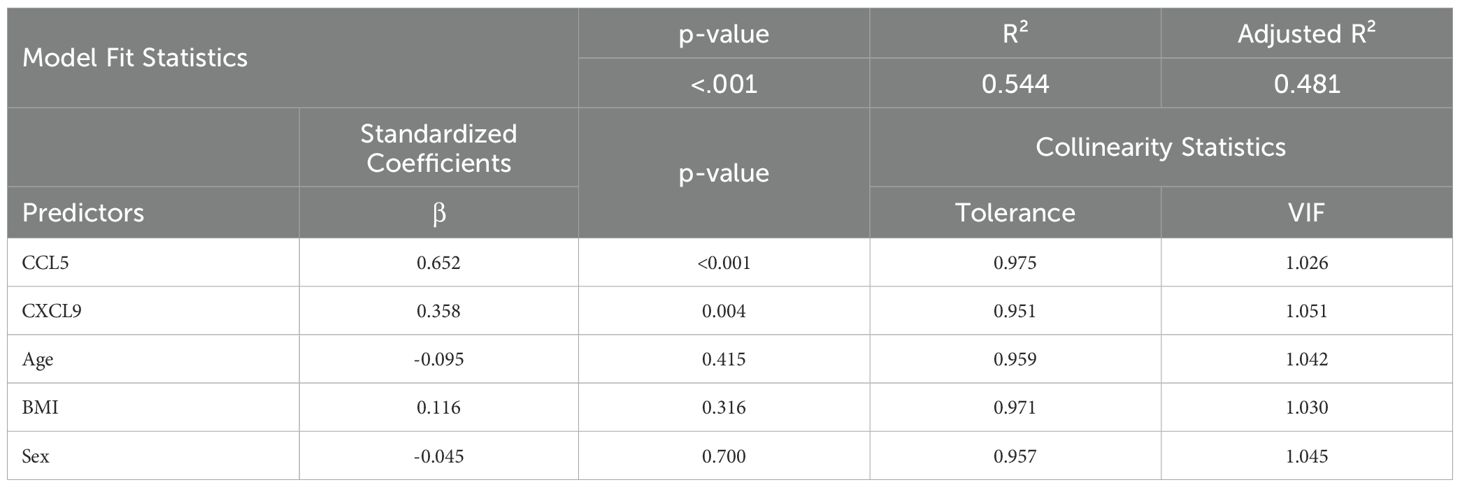
Table 2. Multiple linear regression results for IL-23 gene expression.
Multicollinearity Diagnostics
● VIFs for all predictors ranged from 1.026 to 1.051.
● Tolerance values > 0.95 for all variables.
These results confirm the independent predictive value of CCL5 and CXCL9 on IL-23 gene expression after adjusting for demographic and physiological covariates (Table 2). Additionally, collinearity diagnostics showed no substantial overlap in variance proportions, even at higher condition indices.
3.2 IL-23 gene expression in adipose tissue is related to both fasting blood glucose and glycated hemoglobin in overweight/obese individuals
We explored whether alterations in IL-23 gene expression within adipose tissue are linked to clinical and metabolic indicators. To this end, we measured serum levels of TG, TC, HDL-C, LDL-C, FBG, HbA1c, insulin, and adiponectin. As shown in Table 3 and Figure 1, IL-23 expression was found to be positively associated with FBG (r = 0.39, p = 0.005; Figure 1A) and HbA1c (r = 0.43, p = 0.002; Figure 1B) and negatively correlated with adiponectin (r = −0.42, P = 0.02; Figure 1C) in overweight/obese individuals but not in the lean individuals.
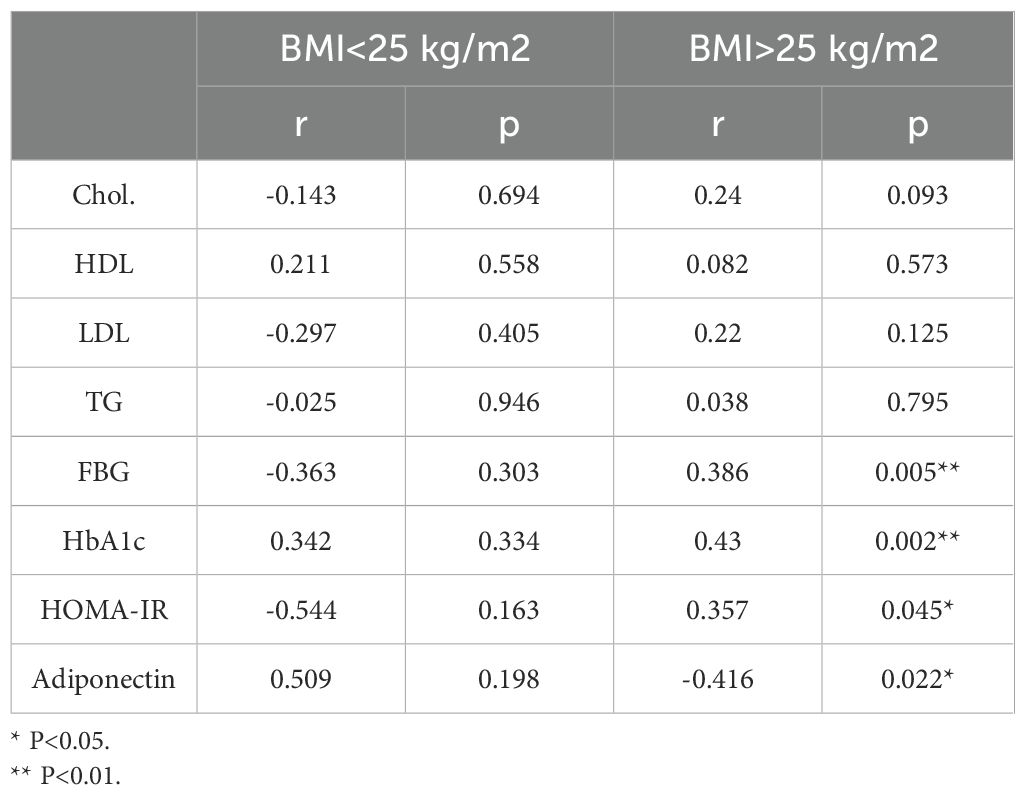
Table 3. Correlations of adipose tissue IL-23 expression with serum metabolic markers.
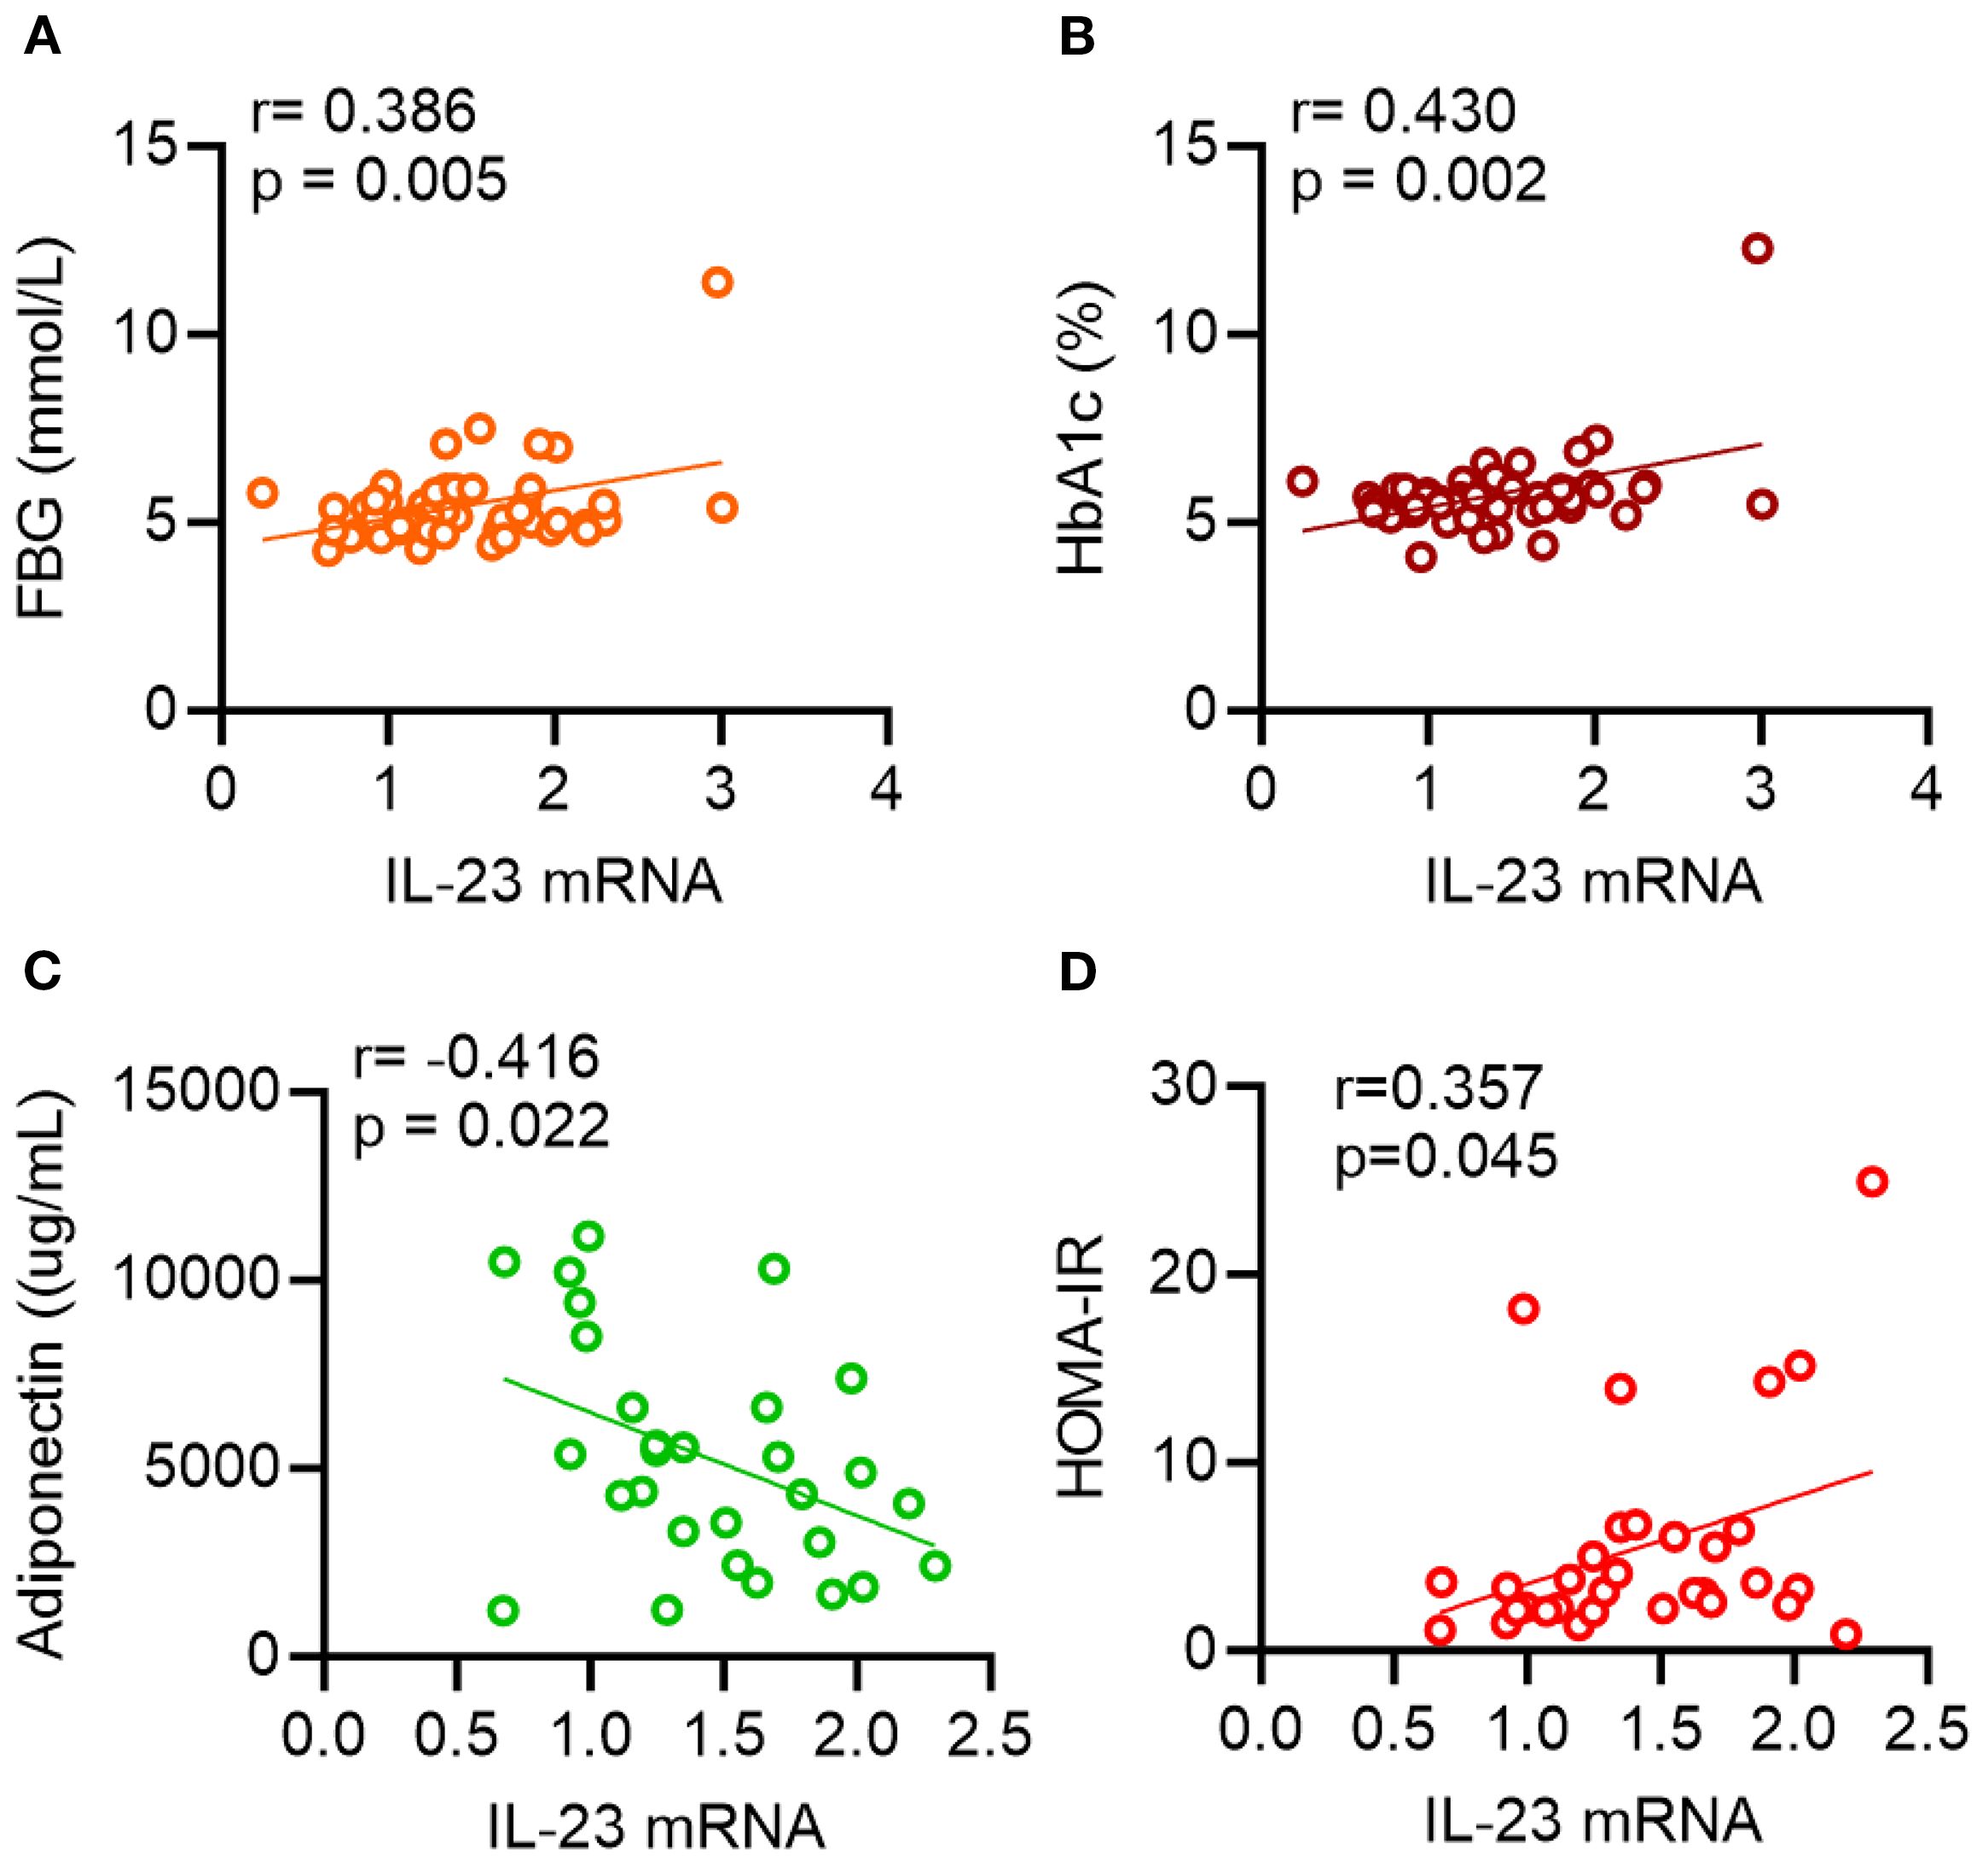
Figure 1. Scatterplots showing correlations between IL-23 and metabolic parameters. AT IL-23 mRNA levels were correlated with (A) fasting blood glucose (FBG), (B) glycated hemoglobin (HbA1c), (C) adiponectin and (D) HOMA-IR. Each data point represents each individual. Correlation coefficients (r) and p values were determined by Pearson’s correlation analysis.
Of note, IL-23 expression in the adipose tissue of individuals with a BMI > 25 kg/m2, also positively correlated with HOMA-IR (r = 0.36; P = 0.045; Figure 1D), a recognized marker of insulin resistance.
4 Discussion
Obesity is defined as a chronic low grade inflammation which leads to metabolic dysregulation (20). The results of the present study offer important insights into the IL-23 gene expression in adipose tissue and its relationship with markers of inflammation and insulin resistance, in overweight and obese individuals. Our results show a positive association between IL-23 gene expression in adipose tissue and inflammatory markers, as well as critical metabolic indicators like FBG and HbA1c. These findings suggest a potential association between adipose tissue IL-23 expression and metabolic inflammation; however, further studies are needed to determine whether IL-23 directly contributes to metabolic dysfunction.
M1 macrophages are key contributors to inflammation within adipose tissue (21) Our findings revealed significant positive correlations between IL-23 expression and various M1 macrophage-associated markers (CD11c, CD16, CCR2, and CCR5) in the adipose tissue of overweight/obese individuals -. The observed correlations support the potential involvement of IL-23 in driving proinflammatory macrophage responses. While some functional features may overlap with the M1 phenotype, IL-23 has been shown to induce a distinct macrophage subpopulation—termed M(IL-23)—that is phenotypically and functionally different from both classical M1 and M2 macrophages (22). This unique subset is characterized by the production of IL-17A, IL-22, and IFN-γ, and contributes to Th17-cytokine-driven inflammation through pathways involving STAT3, RORγT, and T-bet. Our findings support and extend this understanding, highlighting the role of IL-23 in promoting a specialized macrophage phenotype implicated in inflammatory disease settings (22). Nevertheless, a definitive link between IL-23 levels and the expression of macrophage markers in the adipose tissue of overweight/obese individuals has not yet been established. The adipose tissue compartment is a dynamic endocrine organ that secretes a diverse range of adipocytokines (23). After identifying a correlation between adipose tissue IL-23 and elevated expression of inflammatory macrophage markers in overweight/obese individuals, we proceeded to investigate whether changes in adipose tissue IL-23 levels were linked to the local expression of inflammatory cytokines and chemokines. Our analysis revealed a positive correlation between adipose IL-23 expression and the levels of TNF-α, IL-1β, IL-12, IL-2, CCL5, CCL19, and CXCL9 in overweight/obese individuals. The role of these cytokines and chemokines in inflammation and metabolic disturbance is well documented (21, 23–25). Notably, these associations were absent in the adipose tissue of lean individuals, implying that the role of IL-23 in metabolic inflammation is likely more significant in obese individuals, where chronic low-grade inflammation is generally more common (20, 26).
These cytokines/chemokines are well-established mediators of inflammation and insulin resistance, suggesting a role for adipose tissue IL-23 in the inflammatory cascade associated with metabolic dysfunction. The positive correlations between IL-23 expression and FBG, HbA1c and HOMA-IR further support that IL-23 may be involved in regulating glucose metabolism and insulin resistance in adipose tissue. Interestingly, while our findings suggest that elevated IL-23 expression in human adipose tissue is associated with metabolic inflammation and insulin resistance, previous work in mice has reported that IL-23 knockout exacerbates obesity and glucose intolerance in the context of a high-fat diet (27). In that model, IL-23 was proposed to maintain Th17 responses and neutrophil recruitment to the gut, preventing dysbiosis and offering protection against metabolic disease. These contrasting results may reflect species-specific immune mechanisms or tissue-dependent roles of IL-23, and highlight the need for further studies to dissect IL-23’s context-dependent function in metabolic regulation, particularly in humans. Our study found a negative correlation between IL-23 expression and adiponectin levels. Adiponectin is an anti-inflammatory adipokine that plays a protective role in metabolic health by improving insulin sensitivity (28). The inverse relationship between adipose tissue IL-23 and adiponectin suggests that IL-23 may contribute to insulin resistance, which is often associated with a decrease in adiponectin levels. It is important to note that there was no association between IL-23 expression and BMI, suggesting that the relationship between adipose tissue IL-23 and metabolic markers may be more closely tied to metabolic dysfunction rather than simply adiposity itself.
In conclusion, our research emphasizes the crucial role of IL-23 in promoting inflammatory and metabolic dysfunction within the adipose tissue of overweight/obese individuals. The observed positive correlations between IL-23 and inflammatory markers (CD16, CD11c, CCR2, CCR5, TNF-α, IL-1β, IL-2, IL-12, CCL8, CCL19, CXCL9), as well as metabolic markers (FBG and HbA1c), alongside its negative association with adiponectin, highlight its potential involvement in the pathogenesis of obesity-related inflammation and insulin resistance. These findings support the notion that targeting IL-23 in adipose tissue could present a therapeutic opportunity for tackling the persistent inflammation and metabolic disorders characteristic of obesity. Nonetheless, further research is necessary to fully understand the mechanisms through which adipose tissue IL-23 contributes to these conditions and to assess its viability as a therapeutic target in obesity and metabolic disorders.
5 Limitations of the study
IL-23 protein levels could not be measured due to the limited quantity of adipose tissue available. In the same way, at the time of the analysis, serum samples of study subjects were no longer available for dosing serum IL-23. In addition, although IL-23 is known to be produced by tissue-resident myeloid cells, we did not directly determine its cellular source in adipose tissue. Future studies will be necessary to confirm these findings at the protein level and to characterize the specific cell types responsible for IL-23 production in obesity.
The second limitation of our study is the unequal group sizes, with fewer lean adipose tissue samples available (n=10) compared to the obese group (n=51). This discrepancy reflects the difficulty of obtaining adipose biopsies from lean individuals, which are less frequently available for research purposes. While this smaller sample size may limit the statistical power to detect associations within the lean group, it does not diminish the robustness of the findings observed in the obese group, where the sample size was larger and correlations with IL-23 expression were consistent and biologically meaningful.
Data availability statement
The original contributions presented in the study are included in the article/Supplementary Material. Further inquiries can be directed to the corresponding author.
Ethics statement
The studies involving humans were approved by Dasman Diabetes Institute ethics committee, which follows the updated guidelines and ethical principles for medical research involving human subjects as per the WMA declaration of Helsinki. The studies were conducted in accordance with the local legislation and institutional requirements. The participants provided their written informed consent to participate in this study.
Author contributions
SK: Methodology, Data curation, Investigation, Writing – original draft, Formal Analysis. FB: Methodology, Writing – review & editing, Investigation, Formal Analysis. SA: Formal Analysis, Writing – review & editing. AA: Writing – review & editing, Formal Analysis. FA: Writing – review & editing, Formal Analysis. JT: Formal Analysis, Writing – review & editing, Conceptualization. FA-M: Writing – review & editing, Conceptualization, Resources. RA: Formal Analysis, Resources, Conceptualization, Supervision, Investigation, Validation, Writing – review & editing, Funding acquisition.
Funding
The author(s) declare financial support was received for the research and/or publication of this article. This study was supported by funds from the Kuwait Foundation for Advancement of Sciences (Grant #: RA 2010-003; RA AM 2023-021).
Acknowledgments
We thank the study participants for donating subcutaneous fat samples.
Conflict of interest
The authors declare that the research was conducted in the absence of any commercial or financial relationships that could be construed as a potential conflict of interest.
Generative AI statement
The author(s) declare that Generative AI was used in the creation of this manuscript. During the preparation of this work the author(s) used ChatGPT to improve readability and language. After using ChatGPT, the author(s) reviewed and edited the content as needed and take(s) full responsibility for the content of the publication.
Any alternative text (alt text) provided alongside figures in this article has been generated by Frontiers with the support of artificial intelligence and reasonable efforts have been made to ensure accuracy, including review by the authors wherever possible. If you identify any issues, please contact us.
Publisher’s note
All claims expressed in this article are solely those of the authors and do not necessarily represent those of their affiliated organizations, or those of the publisher, the editors and the reviewers. Any product that may be evaluated in this article, or claim that may be made by its manufacturer, is not guaranteed or endorsed by the publisher.
Supplementary material
The Supplementary Material for this article can be found online at: https://www.frontiersin.org/articles/10.3389/fendo.2025.1608846/full#supplementary-material
Supplementary Table 1 | Anthropometric, biochemical, and clinical characteristics of study participants.
Supplementary Table 2 | Primer Assay ID’s.
References
1. McKenzie BS, Kastelein RA, and Cua DJ. Understanding the IL-23-IL-17 immune pathway. Trends Immunol. (2006) 27:17–23. doi: 10.1016/j.it.2005.10.003
2. Cauli A, Piga M, Floris A, and Mathieu A. Current perspective on the role of the interleukin-23/interleukin-17 axis in inflammation and disease (chronic arthritis and psoriasis). Immunotargets Ther. (2015) 4:185–90. doi: 10.2147/ITT.S62870
3. Gagro A, Servis D, Cepika AM, Toellner KM, Grafton G, Taylor DR, et al. Type I cytokine profiles of human naive and memory B lymphocytes: a potential for memory cells to impact polarization. Immunology. (2006) 118:66–77. doi: 10.1111/j.1365-2567.2006.02342.x
4. Oppmann B, Lesley R, Blom B, Timans JC, Xu Y, Hunte B, et al. Novel p19 protein engages IL-12p40 to form a cytokine, IL-23, with biological activities similar as well as distinct from IL-12. Immunity. (2000) 13:715–25. doi: 10.1016/S1074-7613(00)00070-4
5. Maddur MS, Miossec P, Kaveri SV, and Bayry J. Th17 cells: biology, pathogenesis of autoimmune and inflammatory diseases, and therapeutic strategies. Am J Pathol. (2012) 181:8–18. doi: 10.1016/j.ajpath.2012.03.044
6. Teng MW, Bowman EP, McElwee JJ, Smyth MJ, Casanova JL, Cooper AM, et al. IL-12 and IL-23 cytokines: from discovery to targeted therapies for immune-mediated inflammatory diseases. Nat Med. (2015) 21:719–29. doi: 10.1038/nm.3895
7. Allocca M, Furfaro F, Fiorino G, Gilardi D, D’Alessio S, and Danese S. Can IL-23 be a good target for ulcerative colitis? Best Pract Res Clin Gastroenterol. (2018) 32-33:95–102.
8. Yuan N, Yu G, Liu D, Wang X, and Zhao L. An emerging role of interleukin-23 in rheumatoid arthritis. Immunopharmacol Immunotoxicol. (2019) 41:185–91. doi: 10.1080/08923973.2019.1610429
9. Brentano F, Ospelt C, Stanczyk J, Gay RE, Gay S, and Kyburz D. Abundant expression of the interleukin (IL)23 subunit p19, but low levels of bioactive IL23 in the rheumatoid synovium: differential expression and Toll-like receptor-(TLR) dependent regulation of the IL23 subunits, p19 and p40, in rheumatoid arthritis. Ann Rheum Dis. (2009) 68:143–50. doi: 10.1136/ard.2007.082081
10. Liu FL, Chen CH, Chu SJ, Chen JH, Lai JH, Sytwu HK, et al. Interleukin (IL)-23 p19 expression induced by IL-1beta in human fibroblast-like synoviocytes with rheumatoid arthritis via active nuclear factor-kappaB and AP-1 dependent pathway. Rheumatol (Oxford England). (2007) 46:1266–73. doi: 10.1093/rheumatology/kem055
11. Moschen AR, Tilg H, and Raine T. IL-12, IL-23 and IL-17 in IBD: immunobiology and therapeutic targeting. Nature reviews. Gastroenterol Hepatol. (2019) 16:185–96.
12. Sewell GW and Kaser A. Interleukin-23 in the pathogenesis of inflammatory bowel disease and implications for therapeutic intervention. J Crohn’s Colitis. (2022) 16:ii3–ii19. doi: 10.1093/ecco-jcc/jjac034
13. Noviello D, Mager R, Roda G, Borroni RG, Fiorino G, and Vetrano S. The IL23-IL17 immune axis in the treatment of ulcerative colitis: successes, defeats, and ongoing challenges. Front Immunol. (2021) 12. doi: 10.3389/fimmu.2021.611256
14. Schmitt H, Neurath MF, and Atreya R. Role of the IL23/IL17 pathway in crohn’s disease. Front Immunol. (2021) 12:622934–4. doi: 10.3389/fimmu.2021.622934
15. Puccetti P, Belladonna ML, and Grohmann U. Effects of IL-12 and IL-23 on antigen-presenting cells at the interface between innate and adaptive immunity. Crit Rev Immunol. (2002) 22:373–90. doi: 10.1615/CritRevImmunol.v22.i5-6.20
16. Langrish CL, McKenzie BS, Wilson NJ, de Waal Malefyt R, Kastelein RA, and Cua DJ. IL-12 and IL-23: master regulators of innate and adaptive immunity. Immunol Rev. (2004) 202:96–105. doi: 10.1111/j.0105-2896.2004.00214.x
17. Kochumon S, Hasan A, Al-Rashed F, Sindhu S, Thomas R, Jacob T, et al. Increased adipose tissue expression of IL-23 associates with inflammatory markers in people with high LDL cholesterol. Cells. (2022) 11. doi: 10.3390/cells11193072
18. Tang C, Chen S, Qian H, and Huang W. Interleukin-23: as a drug target for autoimmune inflammatory diseases. Immunology. (2012) 135:112–24. doi: 10.1111/j.1365-2567.2011.03522.x
19. Sindhu S, Thomas R, Shihab P, Sriraman D, Behbehani K, and Ahmad R. Obesity is a positive modulator of IL-6R and IL-6 expression in the subcutaneous adipose tissue: significance for metabolic inflammation. PloS One. (2015) 10:e0133494. doi: 10.1371/journal.pone.0133494
20. Alzaid F, Fagherazzi G, Riveline JP, Bahman F, Al-Rashed F, Al-Mulla F, et al. Immune cell-adipose tissue crosstalk in metabolic diseases with a focus on type 1 diabetes. Diabetologia. (2025) 68:1616–31. doi: 10.1007/s00125-025-06437-z
21. Rohm TV, Meier DT, Olefsky JM, and Donath MY. Inflammation in obesity, diabetes, and related disorders. Immunity. (2022) 55:31–55. doi: 10.1016/j.immuni.2021.12.013
22. Hou Y, Zhu L, Tian H, Sun HX, Wang R, Zhang L, et al. IL-23-induced macrophage polarization and its pathological roles in mice with imiquimod-induced psoriasis. Protein Cell. (2018) 9:1027–38. doi: 10.1007/s13238-018-0505-z
23. Wieser V, Moschen AR, and Tilg H. Inflammation, cytokines and insulin resistance: a clinical perspective. Arch Immunol Ther Exp (Warsz). (2013) 61:119–25. doi: 10.1007/s00005-012-0210-1
24. Kochumon S, Al-Rashed F, Abu-Farha M, Devarajan S, Tuomilehto J, and Ahmad R. Adipose tissue expression of CCL19 chemokine is positively associated with insulin resistance. Diabetes/Metabol Res Rev. (2019) 35:e3087. doi: 10.1002/dmrr.3087
25. Kochumon S, Al Madhoun A, Al-Rashed F, Thomas R, Sindhu S, Al-Ozairi E, et al. Elevated adipose tissue associated IL-2 expression in obesity correlates with metabolic inflammation and insulin resistance. Sci Rep. (2020) 10:16364. doi: 10.1038/s41598-020-73347-y
26. Khanna D, Khanna S, Khanna P, Kahar P, and Patel BM. Obesity: A chronic low-grade inflammation and its markers. Cureus. (2022) 14:e22711. doi: 10.7759/cureus.22711
27. Martins LMS, Perez MM, Pereira CA, Costa FRC, Dias MS, Tostes RC, et al. Interleukin-23 promotes intestinal T helper type17 immunity and ameliorates obesity-associated metabolic syndrome in a murine high-fat diet model. Immunology. (2018) 154:624–36. doi: 10.1111/imm.12946
Keywords: adipose tissue IL-23, FBG, HbA1c, HOMA-IR, inflammatory markers, obesity
Citation: Kochumon S, Bahman F, Albeloushi S, Al Madhoun A, Alzaid F, Tuomilehto J, Al-Mulla F and Ahmad R (2025) Adipose tissue IL-23 is associated with fasting blood glucose and HbA1c in overweight/obese individuals. Front. Endocrinol. 16:1608846. doi: 10.3389/fendo.2025.1608846
Received: 09 April 2025; Accepted: 16 September 2025;
Published: 13 October 2025.
Edited by:
Weihao Wang, Peking University, ChinaReviewed by:
Rohit Saluja, All India Institute of Medical Sciences, Bibinagar, IndiaAlice Bongrani, University Hospital of Parma, Italy
Copyright © 2025 Kochumon, Bahman, Albeloushi, Al Madhoun, Alzaid, Tuomilehto, Al-Mulla and Ahmad. This is an open-access article distributed under the terms of the Creative Commons Attribution License (CC BY). The use, distribution or reproduction in other forums is permitted, provided the original author(s) and the copyright owner(s) are credited and that the original publication in this journal is cited, in accordance with accepted academic practice. No use, distribution or reproduction is permitted which does not comply with these terms.
*Correspondence: Rasheed Ahmad, cmFzaGVlZC5haG1hZEBkYXNtYW5pbnN0aXR1dGUub3Jn
†These authors have contributed equally to this work