 Yuxian Wang1
 Zekai Chen2
 Zhen He1Hailun Qin3Kuangyi Wu1Huancong Zheng1Peng Fu1Zefeng Cai1Weiqiang Wu1
 Yulong Lan1,4
 Dan Wu1,4
 Shouling Wu5*
 Youren Chen1*
- 1Department of Cardiology, Second Affiliated Hospital of Shantou University Medical College, Shantou, Guangdong, China
- 2Department of Epidemiology, University Medical Center Groningen, University of Groningen, Groningen, Netherlands
- 3Department of Cardiology, University Medical Center Groningen, University of Groningen, Groningen, Netherlands
- 4Centre for Precision Health, Edith Cowan University School of Medical and Health Sciences, Joondalup, WA, Australia
- 5Department of Cardiology, Kailuan General Hospital, Tangshan, China
Aims/Introduction: Lipid profiles are essential for assessing type 2 diabetes (T2D) risk, but individuals who recover from dyslipidemia are often overlooked, leaving their residual risk unclear. This study aimed to evaluate T2D risk in individuals with varying lipid change patterns and investigate the associations between traditional and novel lipid parameters with T2D risk among those recovered from dyslipidemia.
Materials and Methods: In this prospective cohort study of the Kailuan Study, 39,283 non-diabetic participants were followed to evaluate T2D risk across lipid change patterns using the Cox proportional hazards models. A subset of 3,850 individuals recovered from dyslipidemia was analyzed to examine the associations between both traditional and novel lipid parameters and T2D risk using Cox models and restricted cubic splines. Predictive performance was assessed using the C-index.
Results: During follow-up, 5,223 participants developed T2D. Individuals recovered from dyslipidemia had a significantly higher T2D risk (hazard ratio [HR], 1.37; 95% CI, 1.25-1.51) compared to those with persistent normal lipid levels. In this group, high-density lipoprotein cholesterol (HDL-C) was inversely associated with T2D risk, while triglyceride (TG), lipoprotein combine index (LCI), atherogenic index of plasma (AIP), non-HDL-C, Castelli’s index-I, Castelli’s index-II and triglyceride-glucose index (TyG) were positively associated. AIP and TyG outperformed other parameters in predictive ability.
Conclusions: Individuals recovered from dyslipidemia remain at an elevated risk for T2D. Novel lipid parameters, particularly AIP and TyG, demonstrate superior predictive performance in this group, providing valuable insights for risk stratification and targeted prevention strategies.
Introduction
Diabetes is a leading global health concern, affecting 537 million adults in 2021, with this number projected to 783 million by 2045. That same year, diabetes was responsible for 6.7 million deaths and healthcare expenditures of 966 billion United States Dollars, imposing a significant strain on both public health and global economy (1).
Dyslipidemia is closely associated with type 2 diabetes (T2D). Lipid metabolism disorders play a significant role in T2D pathophysiology (2–4). Conversely, T2D patients often exhibit lipoprotein abnormalities, including elevated triglycerides (TG) and low-density lipoprotein cholesterol (LDL-C), alongside reduced high-density lipoprotein cholesterol (HDL-C) levels (5, 6). Traditional lipid parameters, as well as composite nontraditional lipids indices such as the atherogenic index of plasma (AIP) and the triglyceride-glucose index (TyG), provide valuable tools for diabetes risk assessment (7, 8). Compared with hyperinsulinemic-euglycemic clamp test, the gold standard for evaluating insulin resistance (9), lipid parameters are cost-effective, simple, and well-suited for large-scale screenings.
However, the long-term effects of lipid metabolism disorders may persist even after recovery, leading to lasting damage to pancreatic β-cells (10) and the kidneys (11). This raise concerns that individuals recovered from dyslipidemia may remain at elevated T2D. Current guidelines, however, do not address whether such individuals face continued risk. Additionally, the role of lipid parameters—both traditional and nontraditional—in predicting T2D risk in this specific group remains unclear. This study aims to investigate whether individuals who have recovered from dyslipidemia still face an elevated risk of developing T2D. Furthermore, it evaluates the association and predictive value of both traditional and nontraditional lipid parameters for T2D in this specific population.
Methods
Study population
The Kailuan Study is a prospective cohort study involving employees and retirees from the Kailuan Group in Tangshan City, China. During the baseline survey (2006-2007), over 100,000 participants were recruited, with biennial follow-ups conducted thereafter. Details of the study design and procedures have been specified elsewhere (12, 13). In this analysis, we included participants who completed health check-ups in 2006, 2008, and 2010 (n= 57,927). Exclusion criteria were as follows: participants with missing data on dyslipidemia diagnosis (TG, HDL-C, LDL-C, and total cholesterol (TC), n=9,616); those diagnosed with T2D at or before the 2010 survey (n = 6,677); and individuals who did not attend any follow-up visits (n = 2,351). Ultimately, 39,283 participants were included in the study (Figure 1). The Kailuan Study was conducted in accordance with the Declaration of Helsinki, approved by the ethics committee of Kailuan General Hospital, with written informed consent from all participants.
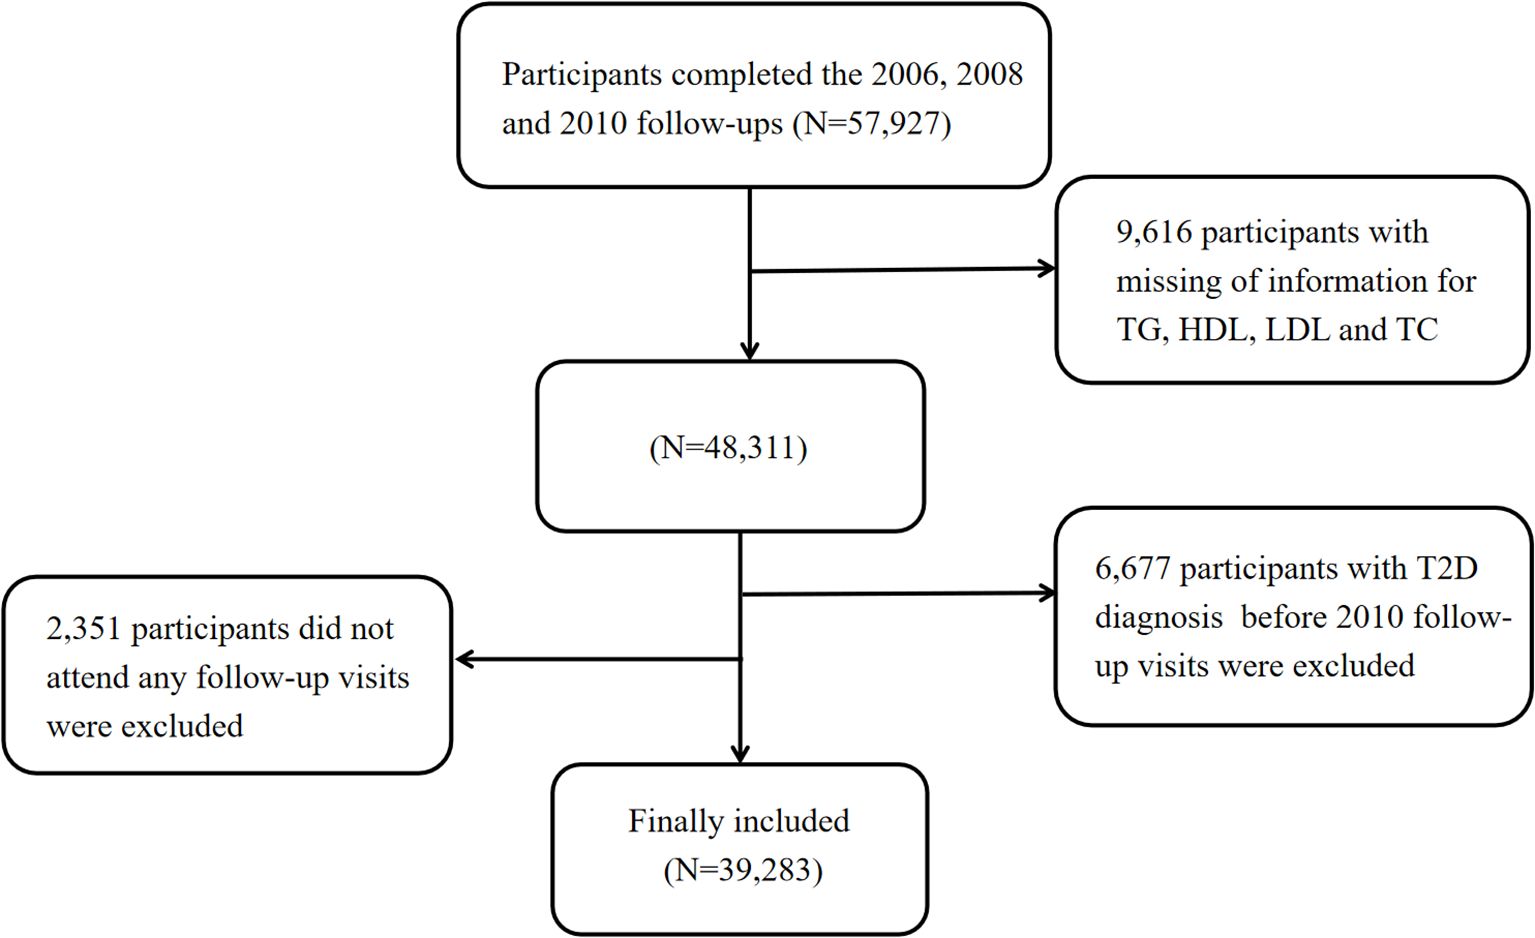
Figure 1. Flowchart. T2D, Type 2 Diabetes; HDL, High-Density Lipoprotein; LDL, Low-Density Lipoprotein; TG, Triglycerides; TC, Total Cholesterol.
Study design overview
In the first step, 39,283 non-diabetic participants were divided into four groups based on their dyslipidemia progression to assess the risk of T2D associated with different lipid change patterns using the Cox proportional hazards model. In the second step, we focused on individuals who had recovered from dyslipidemia (n=3,850), employing the Cox proportional hazards model and restricted cubic splines (RCS) to explore the association between traditional and nontraditional lipid parameters and diabetes risk. The predictive performance of these parameters was estimated using the C-index.
Definitions
Definition of dyslipidemia
Dyslipidemia was defined as having at least one of the following: increased TC (≥6.20 mmol/L), LDL-C (>4.13 mmol/L), TG (>2.25 mmol/L), decreased HDL-C (<1.03 mmol/L) (14), or current use of lipid-lowering medication.
Definition of dyslipidemia evolution groupings
1. Persistent Normal: No diagnosis and no self-reported history of dyslipidemia in 2006 physical examination, and no diagnosis in 2008 and 2010.
2. Dyslipidemia-Recovered (individuals recovered from dyslipidemia): Diagnosed or self-reported history of dyslipidemia in 2006 physical examination, but no diagnosis in 2008 and 2010.
3. Normal-Dyslipidemia: No diagnosis and no self-reported history of dyslipidemia in 2006 physical examination, but diagnosed in 2008 or 2010.
4. Persistent Dyslipidemia: Diagnosed or self-reported history of dyslipidemia in 2006 physical examination, and diagnosed in 2008 or 2010.
Definition of nontraditional lipid parameters
Lipoprotein combine index (LCI)= TC×TG×LDL-C/HDL-C (7);
AIP= lg (TG/HDL-C) (15);
Non-high density lipoprotein (NHDL) =TC−HDL-C (16);
Castelli’s index-I (CRI-I) =TC/HDL-C (17);
Castelli’s index-II (CRI-II) =LDL-C/HDL-C (17);
Remnant cholesterol (RC) =TC−HDL-C−LDL-C (18);
RC/HDL-C ratio (RHC) =RC/HDL-C (19);
TyG=ln [TG (mg/dL) × fasting blood glucose (FBG) (mg/dL)/2] (20).
Assessment of exposure and covariates
Since 2006, biennial follow-up surveys were conducted by trained staff. These included standardized face-to-face interviews to collect sociodemographic information (age, sex, education level), lifestyle factors (smoking, alcohol consumption, physical activity), and antihypertensive medication history. Height and weight were measured to calculate body mass index (BMI) as weight (kg) divided by height squared (m²). Education level was categorized into three groups: primary school or below, middle to high school, and above high school. Smoking and alcohol consumption were classified as never or ever, while physical activity was categorized as ≤3 times per week or >3 times per week, with each session lasting at least 20 minutes. Blood pressure was measured three times in an upright seated position after at least 5 minutes of rest, with the mean value recorded. Fasting blood samples were collected for the analysis of serum creatinine, TG, TC, LDL-C, and HDL-C, performing using a Hitachi 747 automated analyzer. Estimated glomerular filtration rate (eGFR) was calculated from serum creatinine levels according to the Chronic Kidney Disease Epidemiology Collaboration equation (21).
Assessment of outcomes
The assessment period began at the 2010 physical examination (baseline) and ended upon the first occurrence of T2D, death, or the study’s conclusion on December 31, 2022. New-onset T2D was defined as either FBG ≥7.0 mmol/L, self-report of a physician diagnosis, or self-report current use of antidiabetic medication (22) during the follow-up period. FBG levels were measured using Hitachi 747 automated analyzer.
Statistical analysis
Normally distributed continuous variables were described using the mean ± standard deviation and compared between groups using one-way analysis of variance. Non-normally distributed continuous variables were presented as median and interquartile range and compared between groups using the Kruskal-Wallis test. Categorical variables were expressed as numbers with percentages, with differences between groups assessed using the chi-square test, with 2-sided P values <0.05 considered statistically significant.
Step 1: lipid change patterns and T2D Risk
Using the persistent normal group as the reference, hazard ratios (HRs) and 95% confidence intervals (CIs) for the association between lipid change patterns and the risk of T2D were estimated using Cox proportional hazards models. Model 1 adjusted for age and sex, while Model 2 further adjusted for baseline systolic blood pressure (SBP), eGFR, BMI, smoking, alcohol consumption, physical activity, education level, and antihypertensive medication use.
Stratified analyses and interaction tests were conducted to evaluate potential modifications of the association between lipid change patterns and T2D across different subgroups, including age (<60 or ≥60 years), sex (men or women) and BMI (≥24 or <24 kg/m²).
A series of sensitivity analyses were performed to assess the robustness of the results. First, a lagged analysis was conducted by excluding the first two years of follow-up to reduce the possibility of reverse causation. Second, competing risk regression (Fine-Gray model) was used to address potential mortality-related confounding. In the third and fourth sensitivity analyses, participants receiving antihypertensive or lipid-lowering treatment at baseline were excluded. In the final sensitivity analysis, we adjusted for baseline FBG.
Step 2: lipid parameters and T2D risk in dyslipidemia-recovered individuals
Cox proportional hazards models assessed the association between various lipid parameters and T2D. Lipid parameters were analyzed both as quartiles and as continuous variables, with adjustment in Model 1 and Model 2 consistent with those used in Step 1. Multivariate RCS regression was used to evaluate the nonlinear relationships between the lipid parameters and T2D, with adjustments as described in Model 2 above. The RCS model included three knots located at 25th, 50th, and 75th percentile, with the median values of each parameter were set as reference points. To assess the predictive value of lipid parameters, we utilized a univariable model to calculate the C-index as an indicator of predictive performance. Stratified analysis was conducted for individuals with or without prediabetes (5.6mmol/L≤FBG<7.0mmol/L) (23) to evaluate differences in the association between lipid parameters and T2D.
In this study, the proportional hazards assumption was evaluated using Schoenfeld residuals, and results indicated that all models met the PH assumption (P > 0.05). Missing values in the covariates (Supplementary Table S1) included in the Cox regression analysis were imputed using multiple imputation by chained equations.
Results
Baseline characteristics of participants
Among the 39,283 participants, 77.7% were men, and the average age of the total population was 51.9 ± 11.7 years. Baseline characteristics are presented in Table 1. Compared to the persistent normal group and the dyslipidemia-recovered group, individuals in the normal-developed group and the persistent dyslipidemia group were more likely to be male, exhibited higher BMI, SBP and FBG levels, and had greater proportions of smokers, alcohol users, and individuals with lower education levels. In addition, compared with the persistent normal group, the dyslipidemia-recovered group exhibited higher TC, LDL-C, TG, SBP, BMI, and FBG, lower HDL-C and eGFR, as well as higher prevalence of ever smoking and ever drinking, and lower education attainment and physical activity. Neither the persistent normal group nor the dyslipidemia-recovered group reported the use of lipid-lowering medications at baseline.
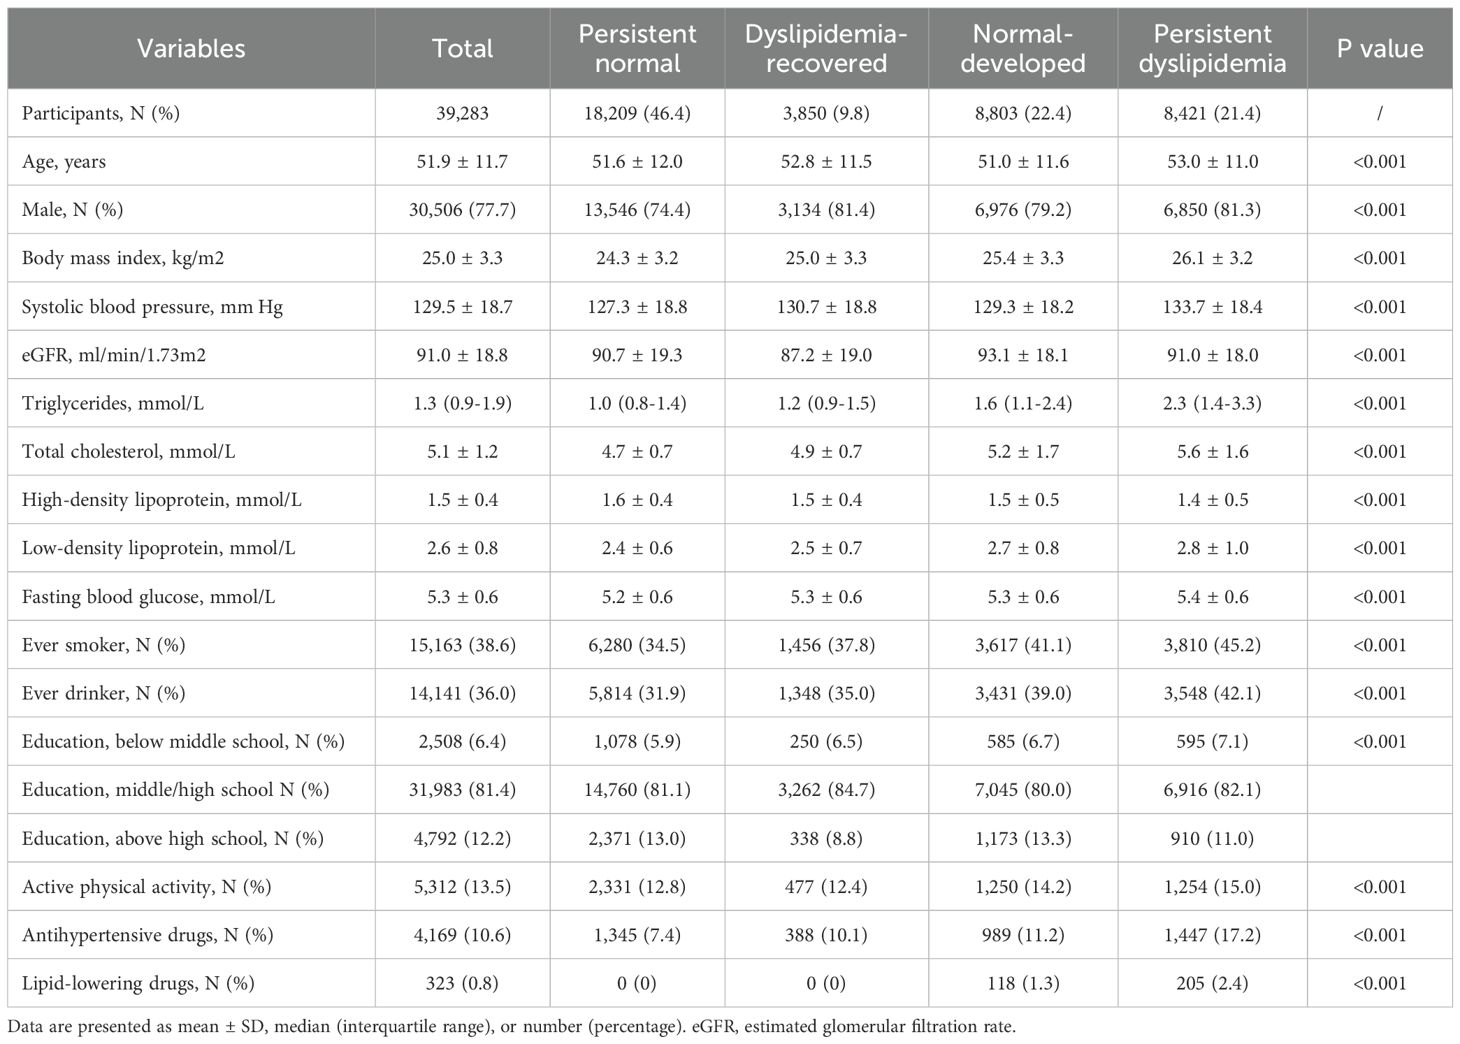
Table 1. Baseline characteristics (N = 39,283).
Relationship between dyslipidemia evolution and diabetes
After an average follow-up duration of 8.8 (interquartile range: 6.6-10.4) years, a total of 5,223 subjects developed new-onset T2D. The cumulative incidence of T2D is shown in Figure 2. In Model 1, compared with the persistent normal group, the dyslipidemia-recovered group (HR = 1.52, 95% CI: 1.38–1.67), the normal-developed group (HR = 1.47, 95% CI: 1.37–1.58), and the persistent dyslipidemia group (HR = 2.23, 95% CI: 2.08–2.38) showed 52%, 47%, and 123% higher risks of T2D, respectively. In the fully adjusted model, relative to the persistent normal group, the risk of T2D remained significantly higher in the dyslipidemia-recovered group (HR = 1.37, 95% CI: 1.25–1.51), the normal-developed group (HR = 1.32, 95% CI: 1.22–1.42), and the persistent dyslipidemia group (HR = 1.78, 95% CI: 1.66–1.91), although the effect sizes were attenuated (Table 2).
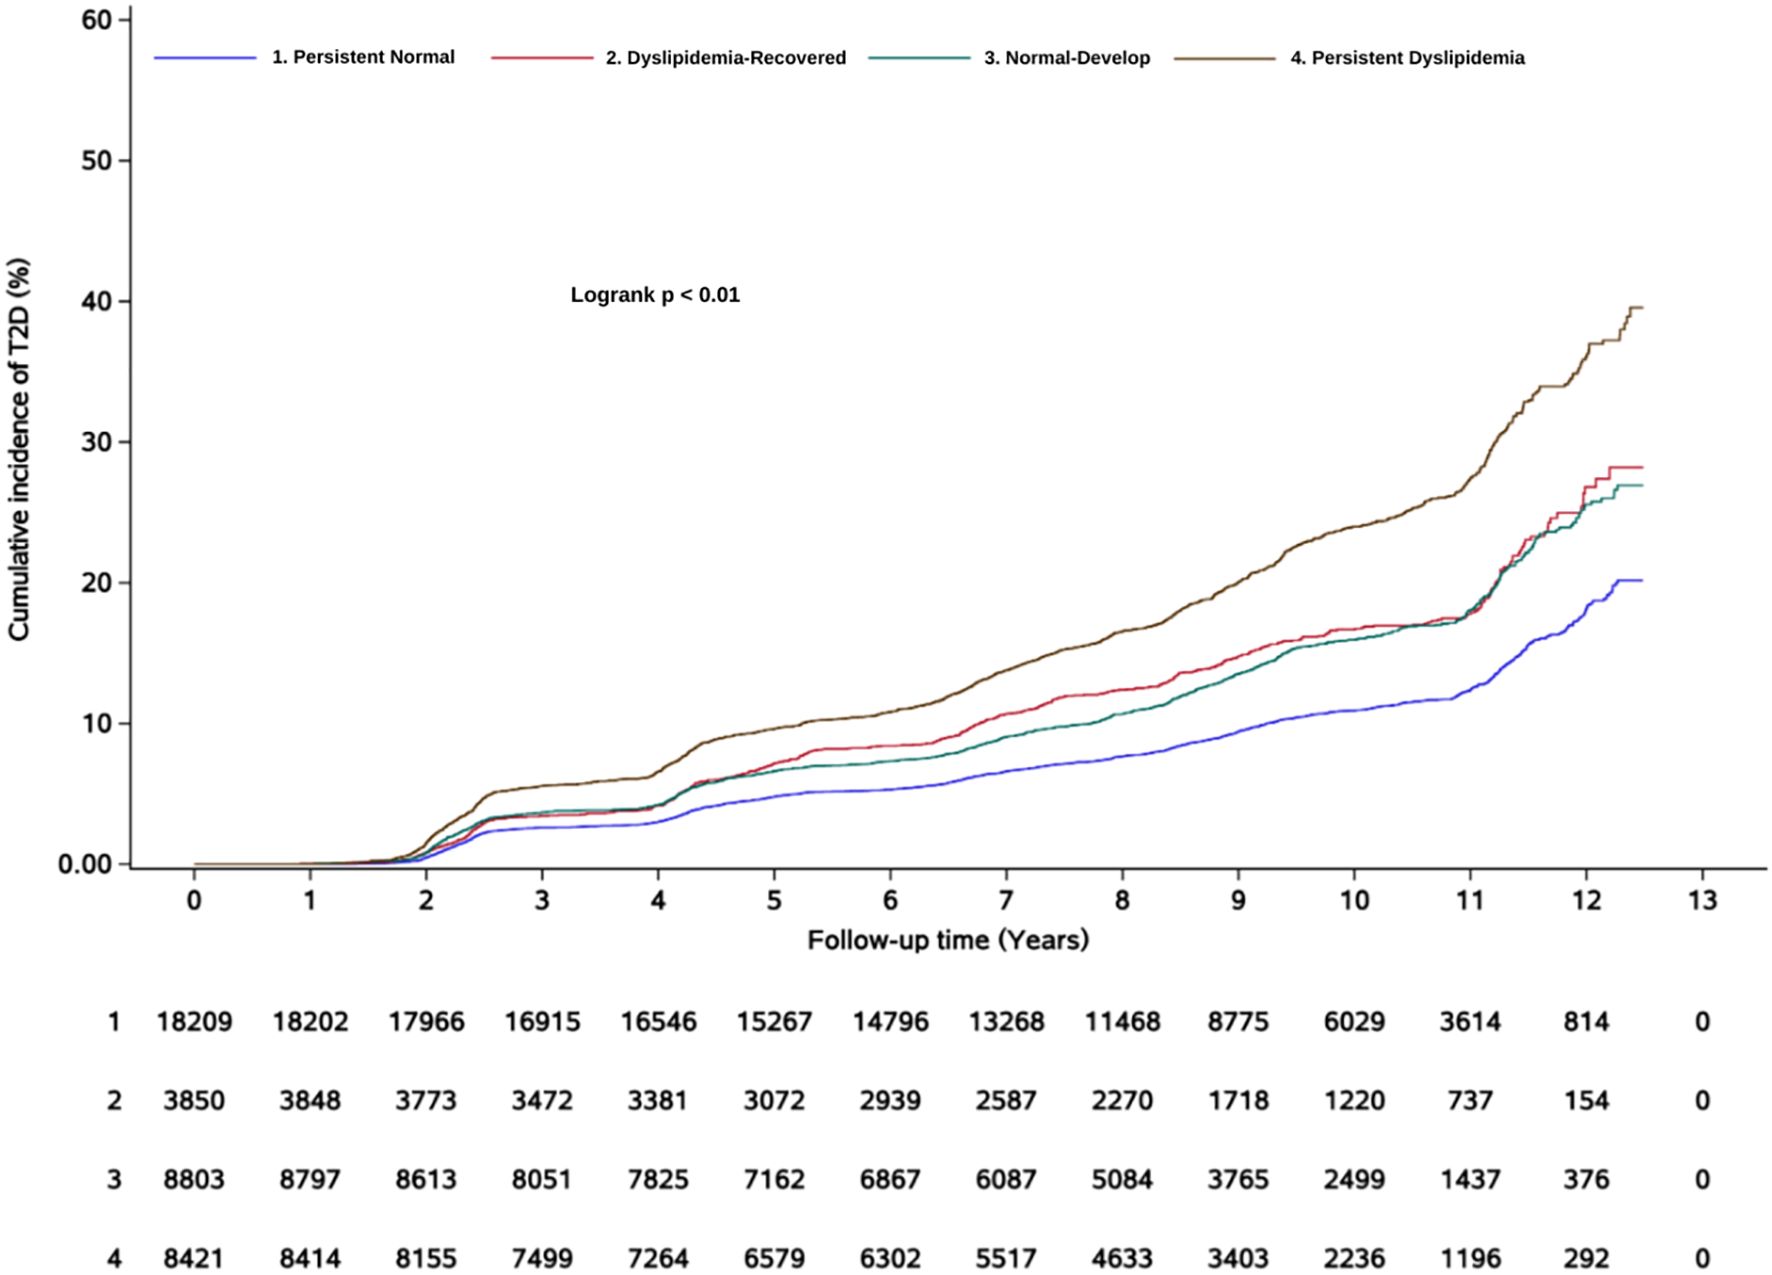
Figure 2. Kaplan–Meier incidence rate of diabetes by dyslipidemia evolution.
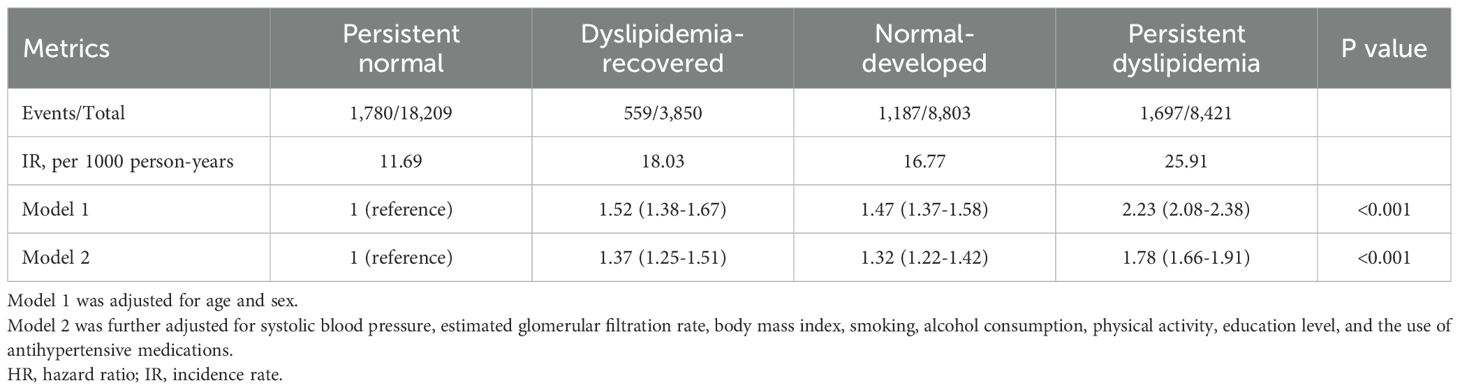
Table 2. HRs (95% CIs) for diabetes according to dyslipidemia evolution.
Stratified analyses and sensitivity analyses
The results were consistent with the primary findings across different age groups, for both men and women, and across BMI categories. In all subgroups, individuals recovered from a past dyslipidemia had a significantly increased risk of developing T2D compared to those with healthy lipid levels, and in younger individuals, males, and those who are overweight, the risk was also significantly higher than that observed in individuals with newly developed dyslipidemia (Table 3).
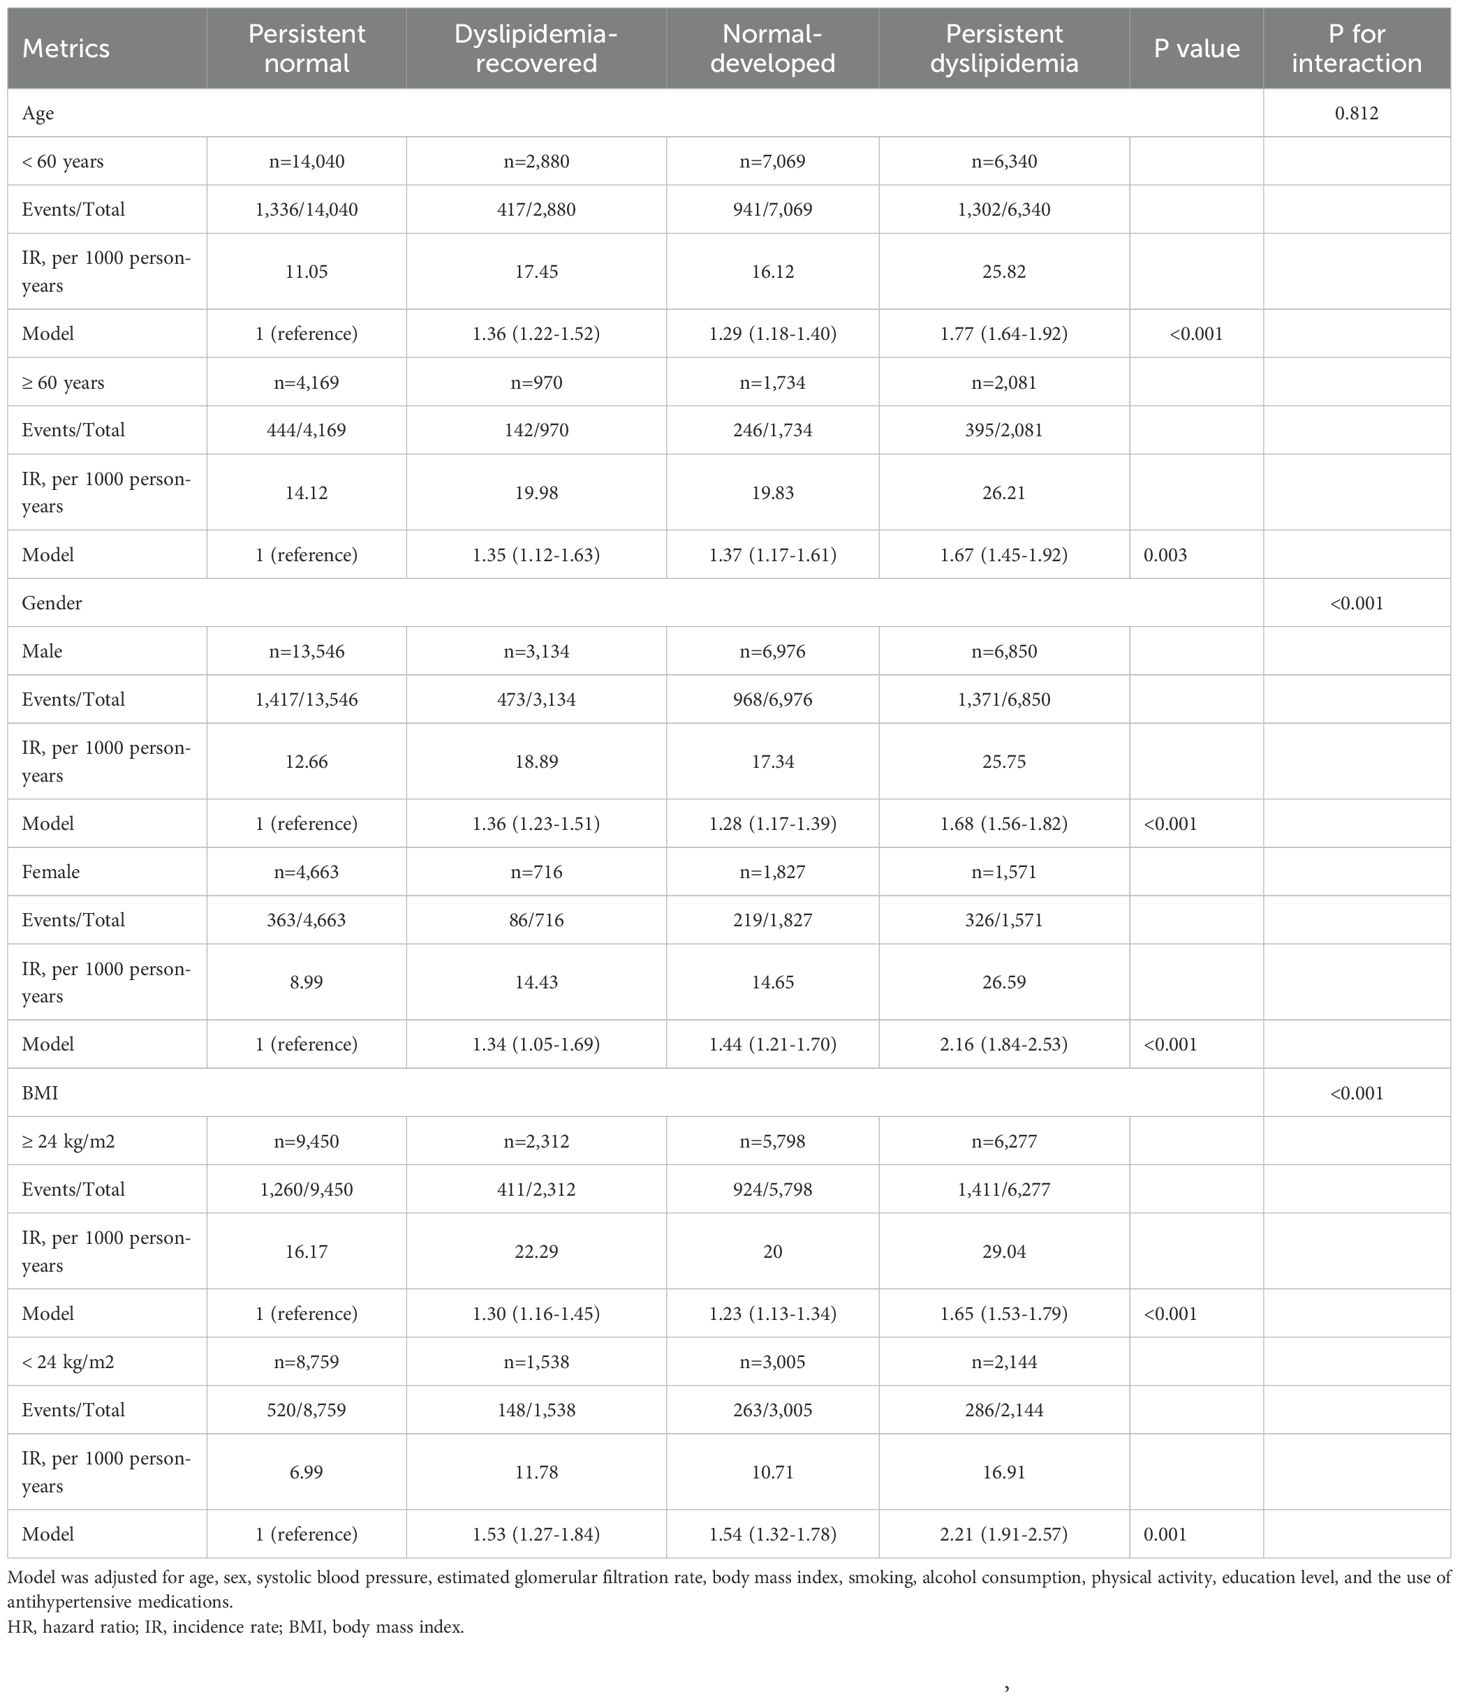
Table 3. Stratified analysis.
In the sensitivity analyses (Supplementary Tables S2-S6), the results from the 2-year lagged analysis and competing risk regression were consistent with the primary analysis. The findings remained robust after excluding participants who were taking antihypertensive or lipid-lowering medications. Similarly, the results remained robust after adjusting for baseline FBG.
Relationship between lipid parameters and T2D in individuals with a history of dyslipidemia
The second step focused on 3,850 individuals recovered from dyslipidemia and examined the association between both traditional and nontraditional lipid parameters and T2D. In continuous variable analysis, HDL-C was found to be negatively associated with T2D risk (HR = 0.68, 95% CI: 0.51, 0.91). In contrast, positive associations with T2D risk were observed for TG (HR = 1.87, 95% CI: 1.54, 2.26), LCI (HR = 1.03, 95% CI: 1.02, 1.04), AIP (HR = 1.87, 95% CI: 1.52, 2.28), NHDL (HR = 1.21, 95% CI: 1.06, 1.38), Castelli’s index-I (HR = 1.23, 95% CI: 1.09, 1.38), Castelli’s index-II (HR = 1.21, 95% CI: 1.05, 1.41), and TyG (HR = 3.70, 95% CI: 2.88, 4.75). When categorized into quartiles, LCI, AIP, NHDL, TyG, and TG remained significantly associated with increased T2D risk (Figures 3A-K). The complete results and the quartile cut-off values for lipid parameters are shown in Supplementary Tables S7, S8, respectively. Additionally, RCS analysis was used to explore potential nonlinear relationships among lipid parameters. TyG and LCI demonstrated nonlinear associations, while the other parameters showed linear associations (Figures 4A-H).
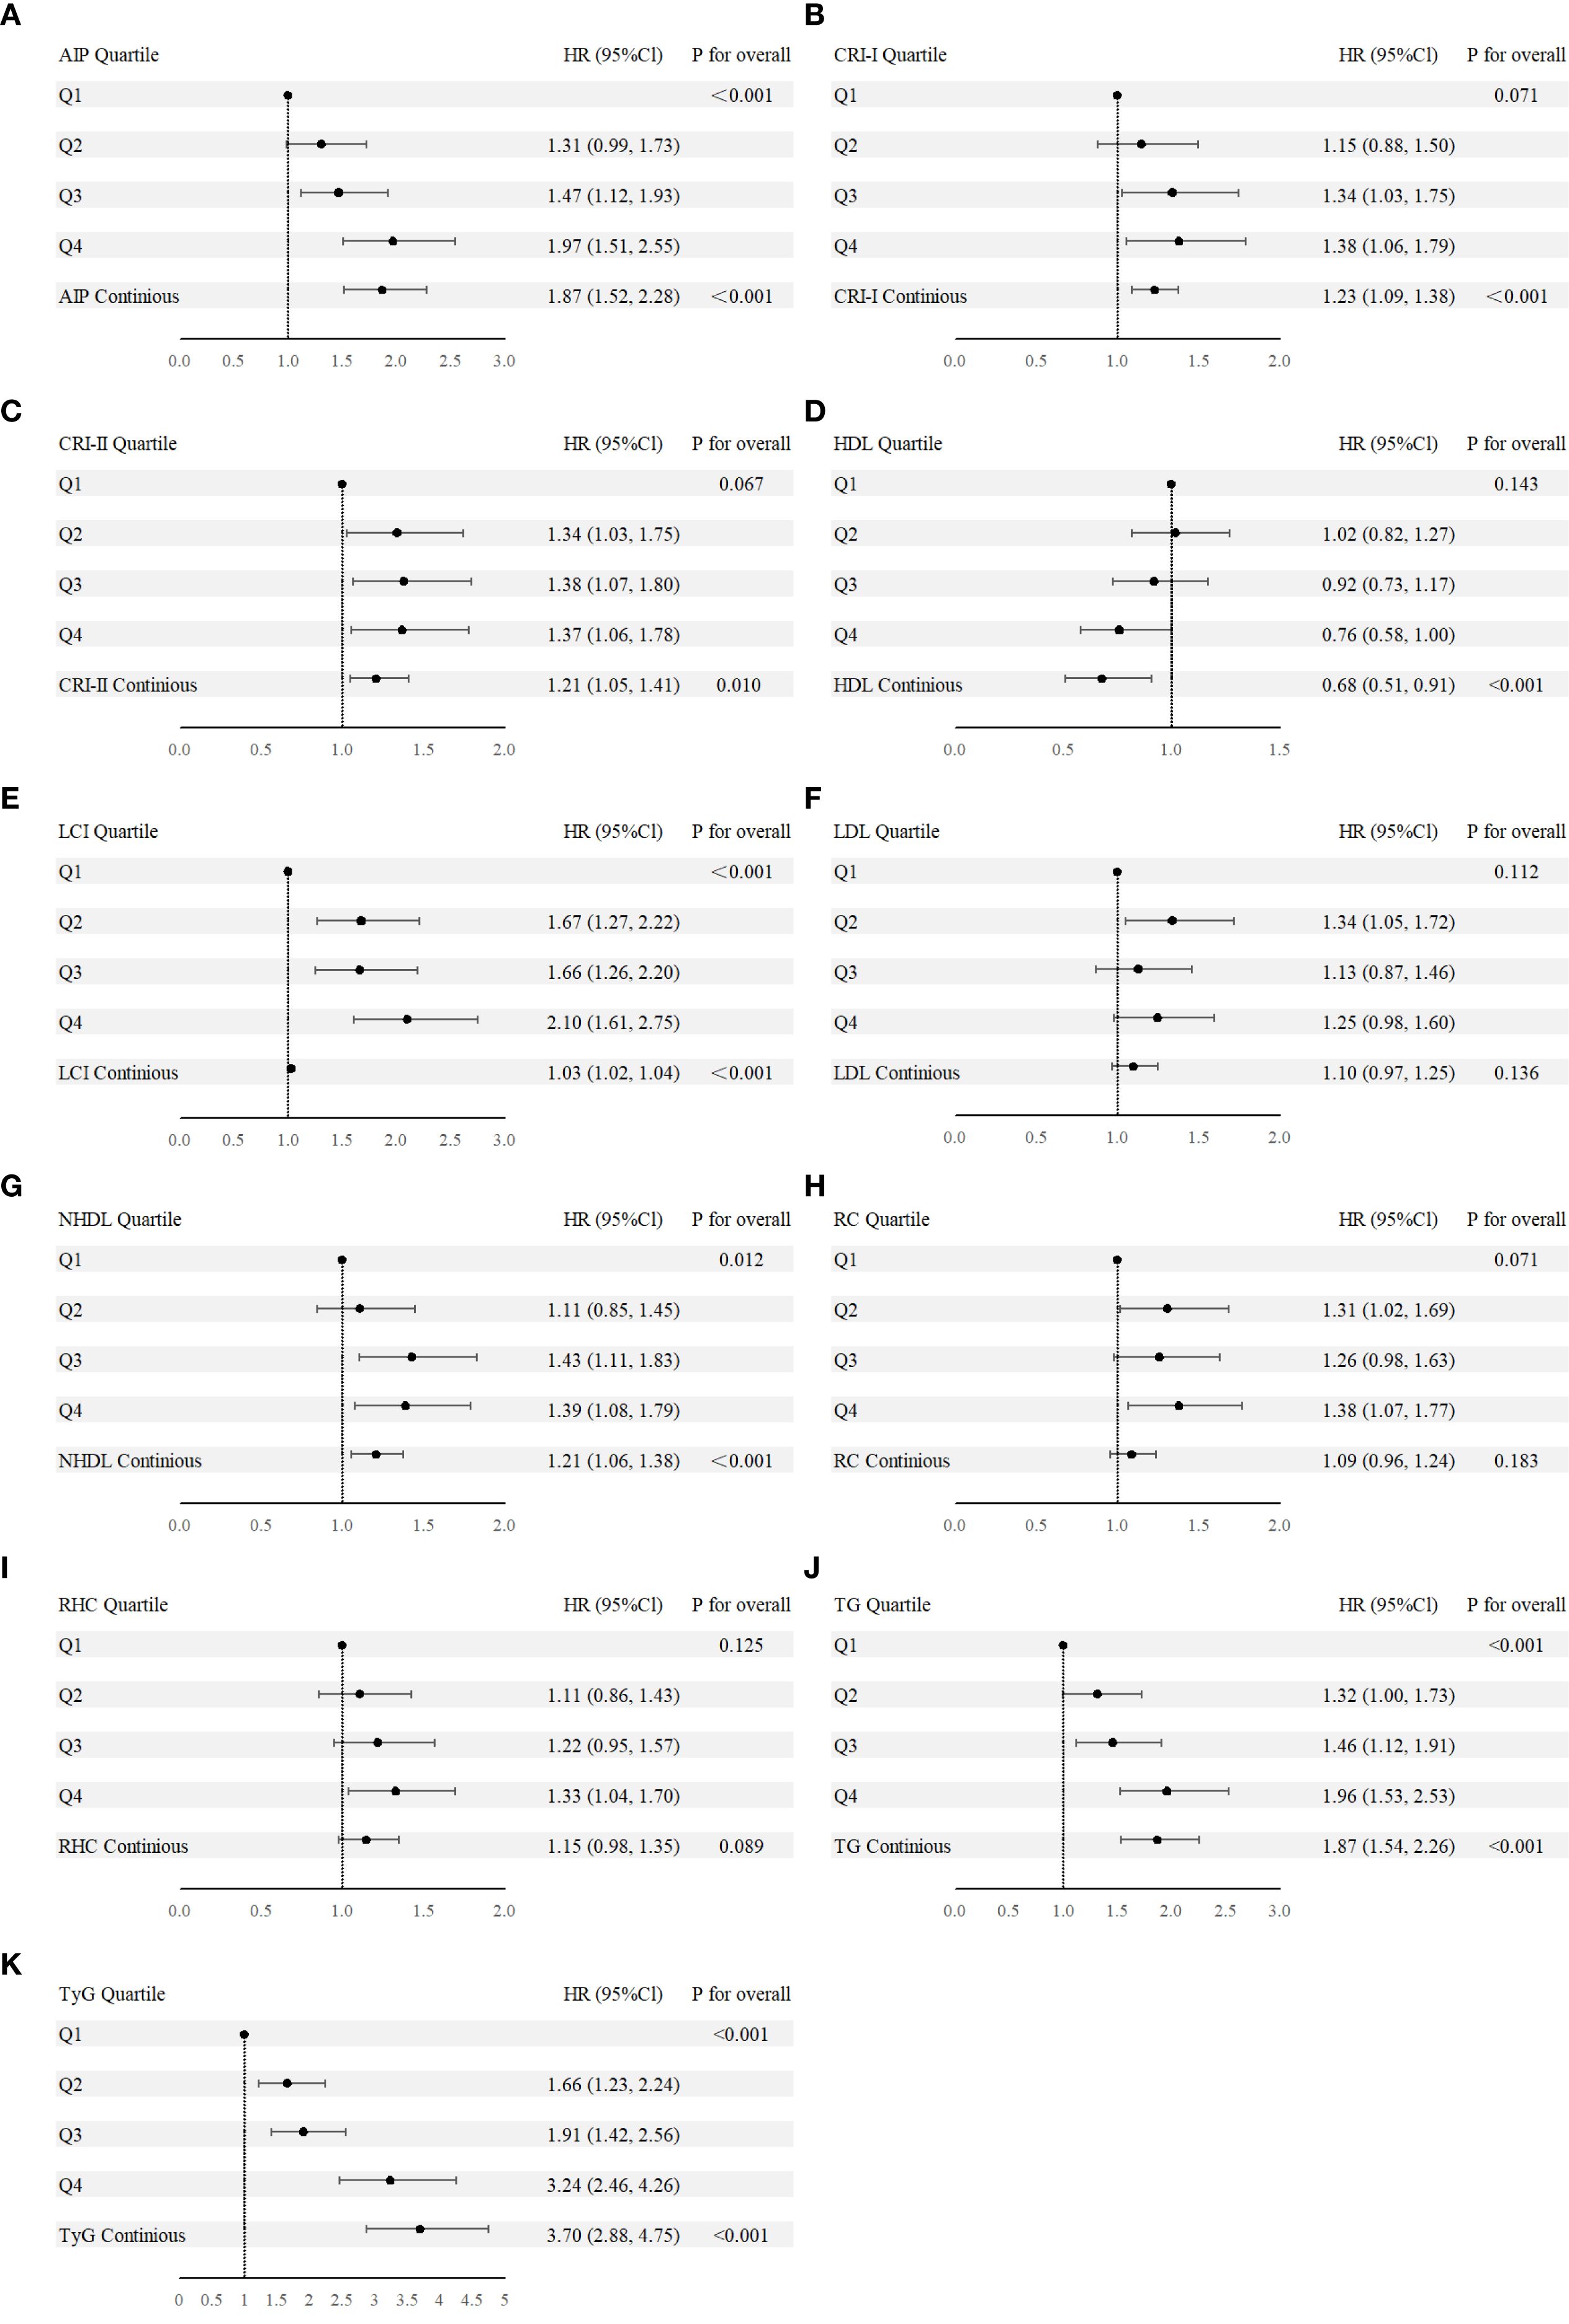
Figure 3. (A-K) Forest plot of nontraditional and traditional lipid parameters presented as continuous variables and quartile from Cox regression analysis. AIP, Atherogenic Index of Plasma; Cl, confidence interval; CRI-I, Castelli’s Index-I; CRI-II, Castelli’s Index-II; HDL, High Density Lipoprotein; HR, Hazard Ratio; LCI, Lipoprotein Combine Index; LDL, Low Density Lipoprotein; NHDL, Non-HDL; RC, Remnant Cholesterol; RHC, RC/HDL Ratio; TG, Triglyceride; TyG, Triglyceride-Glucose Index.
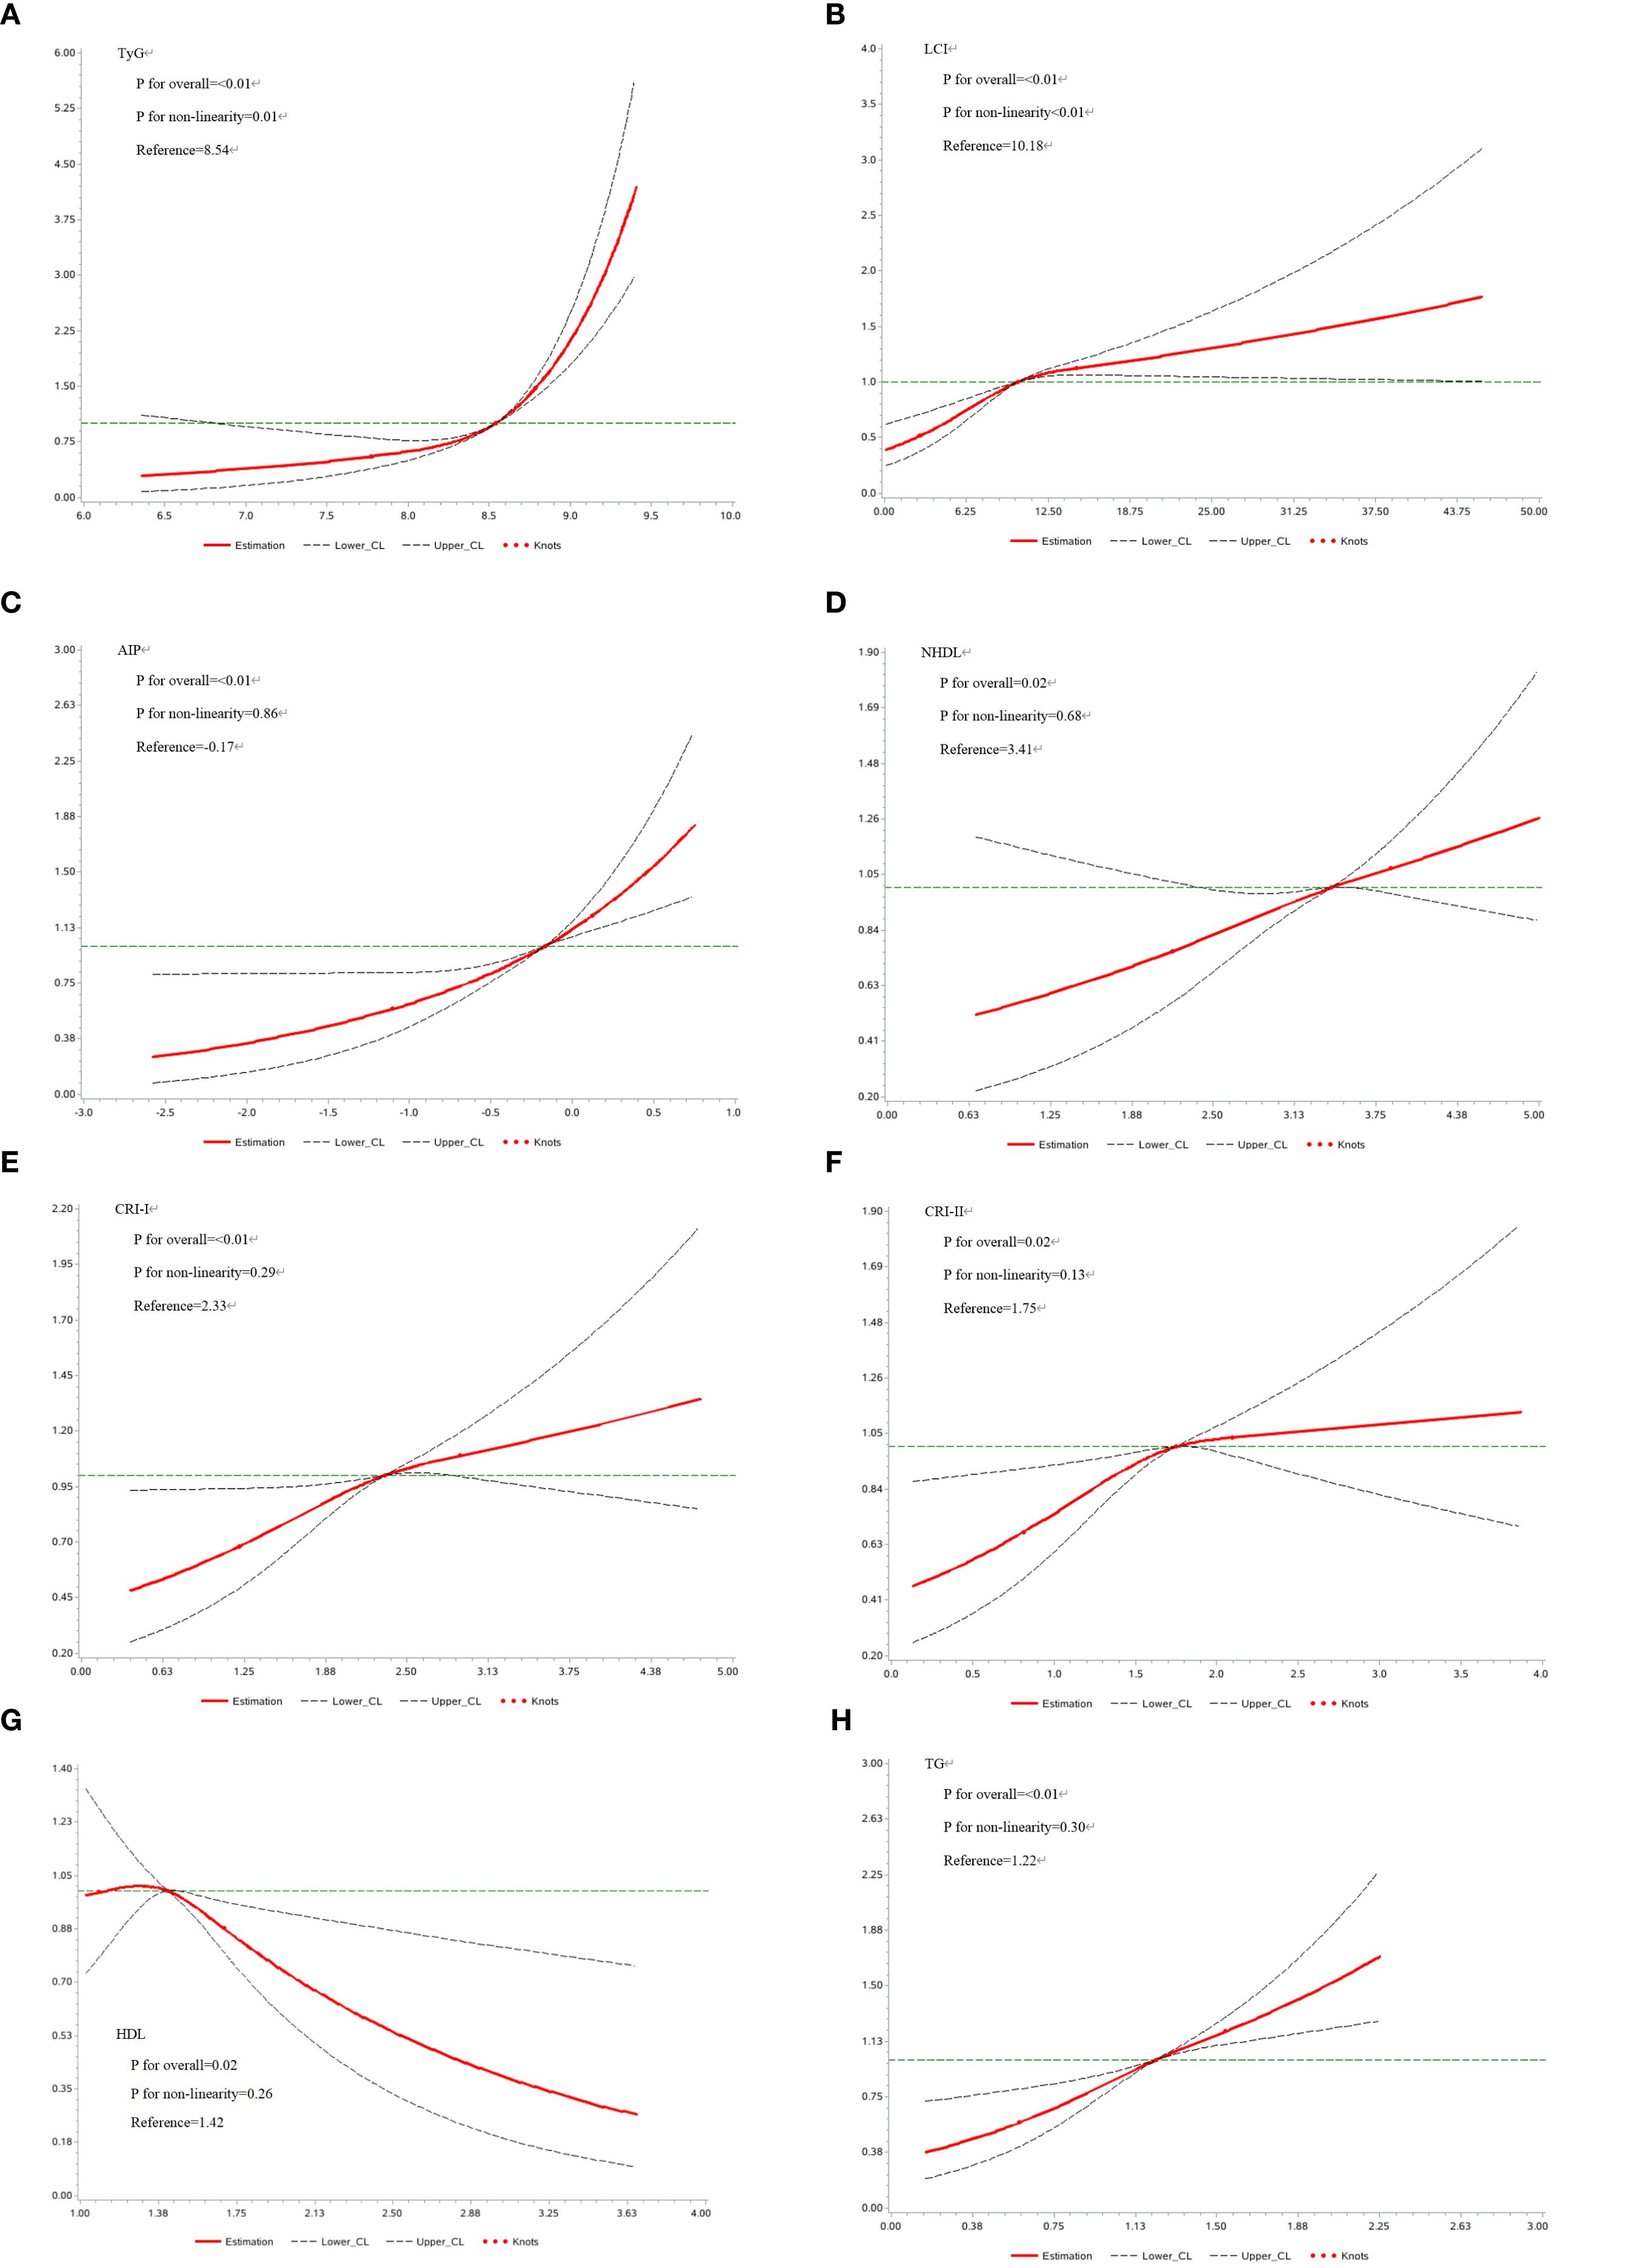
Figure 4. (A-H) Restricted Cubic Spline analysis of lipid parameters. AIP, Atherogenic Index of Plasma; CRI-I, Castelli’s Index-I; CRI-II, Castelli’s Index-II; HDL, High Density Lipoprotein; LCI, Lipoprotein Combine Index; LDL, Low Density Lipoprotein; NHDL, Non-HDL; RC, Remnant Cholesterol; RHC, RC/HDL Ratio; TG, Triglyceride; TyG, Triglyceride-Glucose Index.
We conducted a stratified analysis focusing on parameters that were significantly associated with T2D in prior analyses. In this analysis, all selected parameters demonstrated significant associations within the prediabetes group, while only LCI, AIP, TyG, and TG remained consistently associated in the non-prediabetes group (Figure 5). The results for each 1-standard deviation change in lipid parameters are presented in Supplementary Table S9.
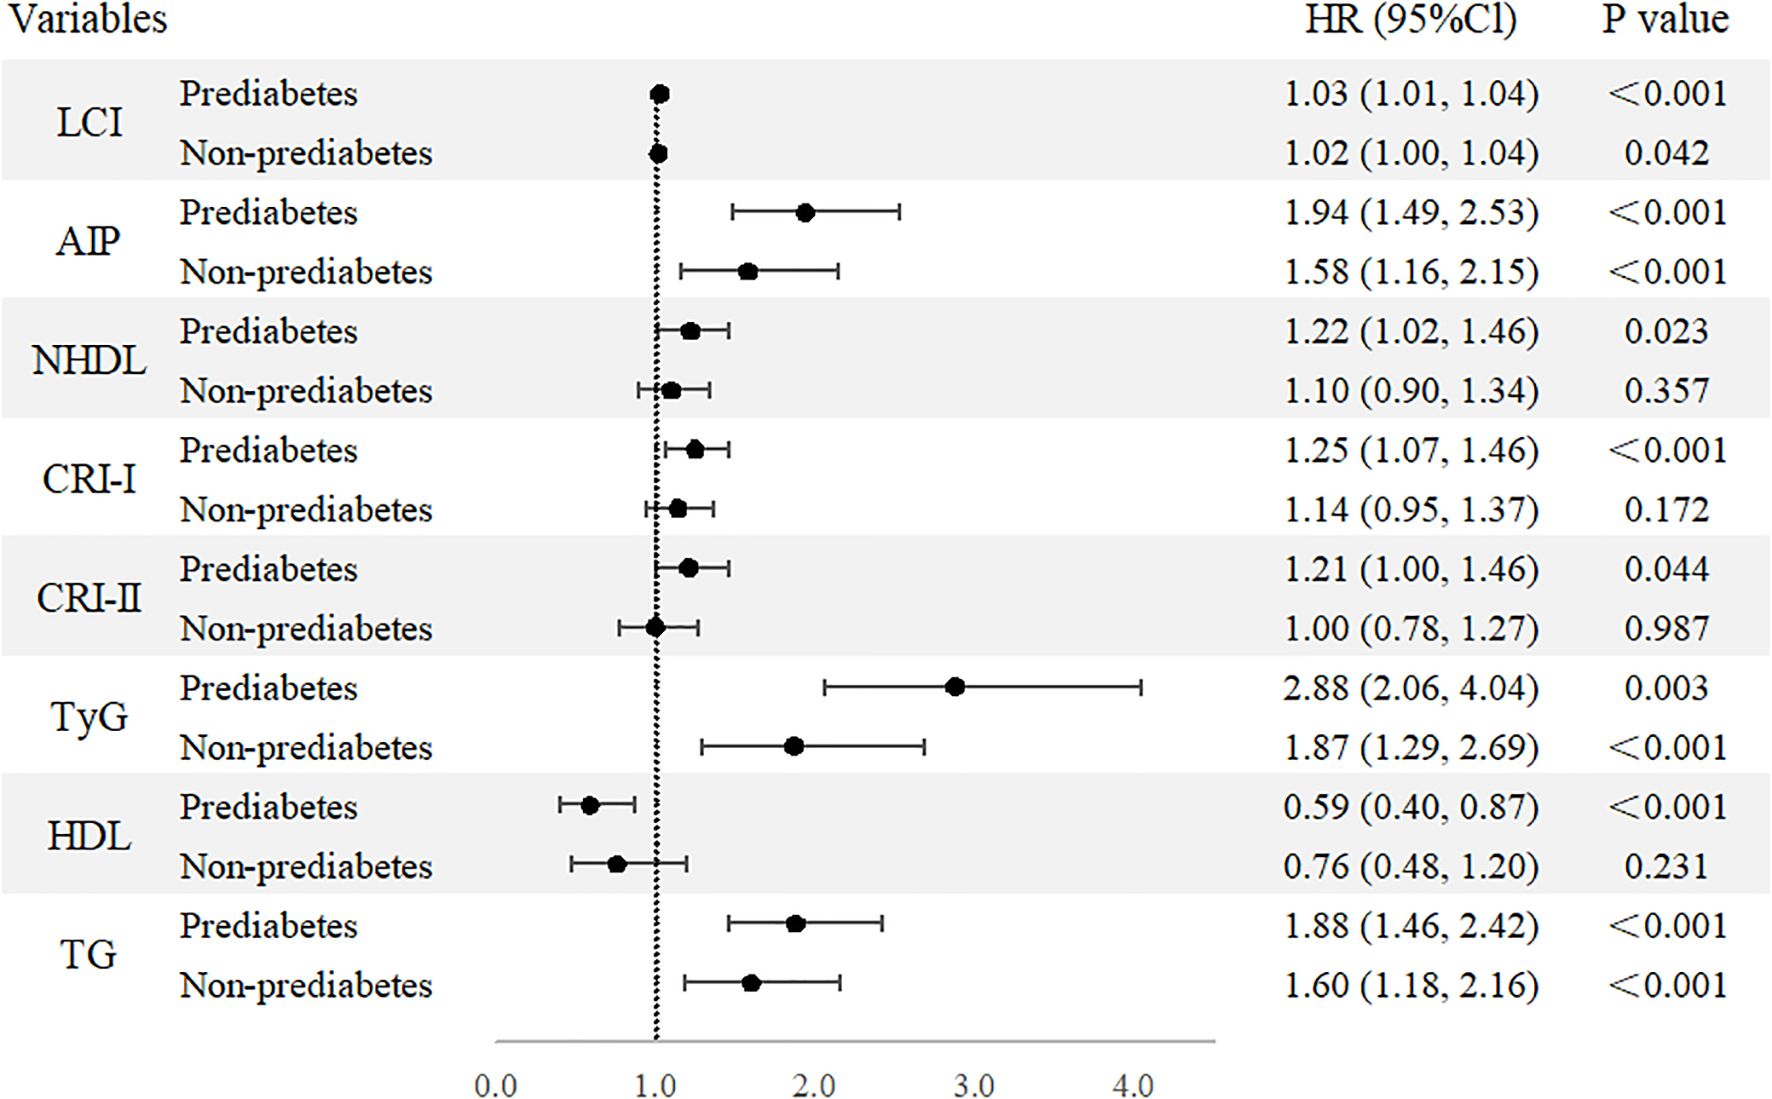
Figure 5. Forest plot of stratified analysis based on pre-diabetes status. Forest plot of nontraditional and traditional lipid parameters presented as continuous variables and quartile from Cox regression analysis. AIP, Atherogenic Index of Plasma; Cl, confidence interval; CRI-I, Castelli’s Index-I; CRI-II, Castelli’s Index-II; HDL, High Density Lipoprotein; HR, Hazard Ratio; LCI, Lipoprotein Combine Index; LDL, Low Density Lipoprotein; NHDL, Non-HDL; RC, Remnant Cholesterol; RHC, RC/HDL Ratio; TG, Triglyceride; TyG, Triglyceride-Glucose Index.
Predictive values of lipid parameters and T2D
For traditional lipid parameters and nontraditional lipid parameters which were previously found to be significantly associated with T2D, we compared their accuracy in identifying T2D using C-index of the univariable models (Supplementary Table S10). Among both traditional and nontraditional lipid parameters, TyG showed the strongest ability to identify both overall populations with a C-index of 0.65 (95% CI: 0.62, 0.67) and prediabetic populations with a C-index of 0.62 (95% CI: 0.58, 0.65), while AIP had the best C-index (0.58, 95% CI: 0.55, 0.62) for non-prediabetic.
Discussion
This cohort study yields several significant findings: (1) Participants recovered from dyslipidemia still face an elevated risk of T2D, surpassing even that of the normal-developed dyslipidemia group. (2) In this specific population, nontraditional lipid parameters such as LCI, AIP, NHDL, and TyG, along with the traditional parameter TG, exhibit strong and consistent associations with increased T2D risk across both continuous and categorical analyses. (3) In non-prediabetic individuals, LCI, AIP, TyG, and TG remain significantly associated with T2D risk, highlighting their utility in identifying latent metabolic risks. (4) Among all traditional and nontraditional lipid parameters, TyG has the strongest capacity to identify both the overall and prediabetic populations, while AIP shows the best C-index for identifying non-prediabetic individuals.
These findings underscore crucial implications for public health and clinical practice. The findings indicate that individuals who achieve normalization of lipid levels have a significantly reduced relative risk of T2D compared to those with persistent dyslipidemia, underscoring the critical role of timely intervention in lipid abnormalities for improving lipids metabolic health. However, we observed that even after lipid levels return to normal, the risk of T2D remains in this group of individuals with both blood glucose and lipid levels within the normal range. In clinical reception, it is essential not only to focus on the current glucose and lipids levels but also to give additional attention to individuals with a history of dyslipidemia. The long-term impact of prior lipid abnormalities cannot be overlooked, highlighting the urgent need for more refined and individualized monitoring and prevention of T2D risk.
Based on this, our study further demonstrates that among the nontraditional lipid parameters, the LCI, AIP and TyG index are significantly associated with an elevated T2D risk in this population. Moreover, in non-prediabetic individuals, these indices may reveal underlying metabolic disturbances before glucose abnormalities become apparent. Therefore, in clinical practice and large-scale screening, a comprehensive assessment of glucose levels and nontraditional lipid parameters may provide a more complete picture of an individual’s T2D risk, in order to shift the focus of T2D prevention earlier.
Current research has explored the impact of lipid metabolism disorders on T2D. Several plasma lipidomics studies have demonstrated that lipid levels undergo significant changes years before the onset of T2D or prediabetes, monitoring relevant lipid parameters can facilitate the early identification of high-risk individuals who may benefit from timely interventions (24, 25). However, the high cost and technical complexity of omics measurements limit their application in large-scale screening. In recent years, nontraditional lipid parameters (such as AIP, TyG, etc.…) derived from traditional lipid parameters have been recognized for their superior clinical utility in reflecting the degree of insulin resistance and assessing the risk of T2D.
However, research that comprehensively compares nontraditional indicators using large-scale longitudinal cohorts remains relatively scarce. A cohort study based on an Iranian population found that AIP and NHDL, independent of traditional risk factors, were associated with the risk of T2D, but the comparison was mainly made with traditional lipid parameters (26). Another cross-sectional study based on a Chinese population revealed associations between several nontraditional lipid parameters, including LCI, AIP, CRI-I, and NHDL, and prediabetes (7). Similarly, a cohort study involving a Japanese population without T2D identified that the TG/HDL ratio and CRI-I were also associated with an increased risk of T2D, consistent with our findings (27). Furthermore, several cross-sectional studies based on the National Health and Nutrition Examination Survey suggested that AIP (28–30) and RC (29–31) are significantly associated with diabetes, and insulin resistance may play a mediating role (29). In these studies, nontraditional lipid parameters demonstrated significant associations with T2D or prediabetes, underscoring their potential role in metabolic risk.
Our study emphasizes a group whose lipid profiles have ostensibly returned to normal, but still considered at high risk for T2D. Several parameters, particularly AIP, demonstrated a strong ability to capture subtle metabolic disturbances, which is consistent with the findings of existing studies (29, 30, 32). Building on this, our study further found that AIP can still capture the elevated risk of diabetes even after lipid levels have returned to normal. In contrast, traditional lipid parameters like HDL and LDL were no longer significantly associated with T2D risk. Although TG remained associated with T2D, the levels within the normal range could easily lead clinicians to underestimate individual’s risk. This highlights the limitations of relying solely on traditional lipid metrics (33), which may underestimate lingering metabolic dysregulation. However, our findings only suggested a potential positive effect between RC and RHC and T2D, implicating that they may not be the most effective parameters for detailed risk screening within this subgroup. Furthermore, compared to previous studies, we included TyG in our comparisons, providing additional evidence supporting its utility in T2D prevention. Besides, compared to other studies, this research conducted multiple fasting glucose measurements through regular follow-ups, which is more likely to avoid potential healthy selection bias and more accurately reflect the true incidence of T2D.
Even after dyslipidemia is restored, the risk of T2D remains elevated, possibly due to the irreversible damage caused by lipid-mediated apoptosis to pancreatic β-cells (34, 35). Prolonged exposure to elevated fatty acid metabolites enhances apoptosis (3), leading to pancreatic dysfunction and elevated T2D risk (36). Furthermore, elevated plasma TG, fatty acids, and LDL can induce renal dysfunction by promoting lipotoxicity, insulin resistance, and pro-inflammatory pathways (37), including damage to proximal tubule cells (38) and the development of glomerulosclerosis (39), which is considered as an irreversible process and will exacerbate insulin resistance through various mechanisms (40). Furthermore, lipid metabolism disorders may also cause persistent reprogramming of the innate immune system, which can endure long after metabolic abnormalities are normalized (41).
The strengths of our study include its longitudinal design, long follow-up duration, stable follow-up population, and comprehensive comparison of nontraditional and traditional lipid parameters, as well as being the first to focus on individuals recovering from dyslipidemia. However, this study also has some limitations, including the inability of observational studies to infer causality, the relatively small sample size for specific subgroups, and the fact that participants were mainly from northern China, which may limit the generalizability of the findings. Additionally, we were unable to differentiate between T2D and type 1 diabetes (T1D). However, the impact of misclassifying T1D was minimal, as T2D accounts for approximately 95% of all diabetes cases. Moreover, the average age of participants at follow-up (51.9 years) exceeds the typical age of onset for T1D. Another limitation is that, due to the lack of available genetic data in the Kailuan cohort, we were unable to evaluate potential gene–environment interactions. Future large-scale, multicenter studies with diverse populations and integrated genetic information are needed to further investigate the long-term metabolic outcomes and underlying mechanisms among individuals recovering from dyslipidemia. In addition, the associations of these nontraditional lipid parameters with diabetic complications and the potential specificity of these associations also require further investigation. In conclusion, our study expands the understanding of nontraditional lipid parameters, particularly in populations that appear normolipidemic yet remain at high risk for T2D. The research provides theoretical support for the clinical application of nontraditional lipid parameters as parameters for early intervention and precision medicine in T2D care.
Data availability statement
The data analyzed in this study is subject to the following licenses/restrictions: The original data supporting the findings of this study are available from the corresponding author upon reasonable request. Requests to access these datasets should be directed to Dr Shouling Wu, ZHJ3dXNsQDE2My5jb20=.
Ethics statement
The studies involving humans were approved by Ethics Committees of Kailuan General Hospital. The studies were conducted in accordance with the local legislation and institutional requirements. The participants provided their written informed consent to participate in this study.
Author contributions
YW: Investigation, Writing – review & editing, Writing – original draft, Visualization, Data curation, Formal Analysis, Software. ZCh: Writing – review & editing, Methodology, Writing – original draft, Conceptualization, Visualization, Supervision. ZH: Investigation, Validation, Methodology, Conceptualization, Supervision, Writing – review & editing, Writing – original draft. HQ: Conceptualization, Writing – review & editing, Data curation, Methodology, Writing – original draft, Visualization. KW: Software, Data curation, Writing – original draft, Conceptualization, Investigation. HZ: Funding acquisition, Writing – review & editing, Data curation, Conceptualization, Investigation. PF: Formal Analysis, Software, Writing – original draft, Data curation. ZCa: Writing – review & editing, Visualization, Investigation, Conceptualization. WW: Supervision, Methodology, Writing – review & editing. YL: Writing – review & editing, Investigation, Supervision. DW: Validation, Writing – review & editing, Supervision. SW: Writing – review & editing, Project administration, Resources, Writing – original draft, Supervision. YC: Writing – review & editing, Funding acquisition, Validation, Supervision.
Funding
The author(s) declare financial support was received for the research and/or publication of this article. This work was supported by the 2023 Special Fund Project for Science and Technology Innovation Strategy of Guangdong Province (NO:STKJ2023003).
Acknowledgments
The authors would like to thank all the Kailuan Study participants and staff for their contribution to the study.
Conflict of interest
The authors declare that the research was conducted in the absence of any commercial or financial relationships that could be construed as a potential conflict of interest.
Generative AI statement
The author(s) declare that no Generative AI was used in the creation of this manuscript.
Any alternative text (alt text) provided alongside figures in this article has been generated by Frontiers with the support of artificial intelligence and reasonable efforts have been made to ensure accuracy, including review by the authors wherever possible. If you identify any issues, please contact us.
Publisher’s note
All claims expressed in this article are solely those of the authors and do not necessarily represent those of their affiliated organizations, or those of the publisher, the editors and the reviewers. Any product that may be evaluated in this article, or claim that may be made by its manufacturer, is not guaranteed or endorsed by the publisher.
Supplementary material
The Supplementary Material for this article can be found online at: https://www.frontiersin.org/articles/10.3389/fendo.2025.1610091/full#supplementary-material
Abbreviations
AIP, Atherogenic Index of Plasma; Cl, confidence interval; CRI-I, Castelli’s Index-I; CRI-II, Castelli’s Index-II; eGFR, Estimated glomerular filtration rate; FBG, Fasting Blood Glucose; HDL, High Density Lipoprotein; HR, Hazard Ratio; LCI, Lipoprotein Combine Index; LDL, Low Density Lipoprotein; NHDL, Non-HDL; RC, Remnant Cholesterol; RCS, restricted cubic splines; RHC, RC/HDL Ratio; SBP, Systolic Blood Pressure; TC, Total Cholesterol; TG, Triglyceride; TyG, Triglyceride-Glucose Index; T2D, Type 2 diabetes.
References
1. Ndumele CE, Neeland IJ, Tuttle KR, Chow SL, Mathew RO, Khan SS, et al. A synopsis of the evidence for the science and clinical management of cardiovascular-kidney-metabolic (CKM) syndrome: A scientific statement from the american heart association. Circulation. (2023) 148:1636–64. doi: 10.1161/CIR.0000000000001186
2. Drew BG, Rye KA, Duffy SJ, Barter P, and Kingwell BA. The emerging role of HDL in glucose metabolism. Nat Rev Endocrinol. (2012) 8:237–45. doi: 10.1038/nrendo.2011.235
3. Eid S, Sas KM, Abcouwer SF, Feldman EL, Gardner TW, Pennathur S, et al. New insights into the mechanisms of diabetic complications: role of lipids and lipid metabolism. Diabetologia. (2019) 62:1539–49. doi: 10.1007/s00125-019-4959-1
4. Kane JP, Pullinger CR, Goldfine ID, and Malloy MJ. Dyslipidemia and diabetes mellitus: Role of lipoprotein species and interrelated pathways of lipid metabolism in diabetes mellitus. Curr Opin Pharmacol. (2021) 61:21–7. doi: 10.1016/j.coph.2021.08.013
5. Verges B. Pathophysiology of diabetic dyslipidaemia: where are we? Diabetologia. (2015) 58:886–99. doi: 10.1007/s00125-015-3525-8
6. Lorenzo C, Hartnett S, Hanley AJ, Rewers MJ, Wagenknecht LE, Karter AJ, et al. Impaired fasting glucose and impaired glucose tolerance have distinct lipoprotein and apolipoprotein changes: the insulin resistance atherosclerosis study. J Clin Endocrinol Metab. (2013) 98:1622–30. doi: 10.1210/jc.2012-3185
7. Li M, Zhang W, Zhang M, Li L, Wang D, Yan G, et al. Nonlinear relationship between untraditional lipid parameters and the risk of prediabetes: a large retrospective study based on Chinese adults. Cardiovasc Diabetol. (2024) 23:12. doi: 10.1186/s12933-023-02103-z
8. Yang T, Liu Y, Li L, Zheng Y, Wang Y, Su J, et al. Correlation between the triglyceride-to-high-density lipoprotein cholesterol ratio and other unconventional lipid parameters with the risk of prediabetes and Type 2 diabetes in patients with coronary heart disease: a RCSCD-TCM study in China. Cardiovasc Diabetol. (2022) 21:93. doi: 10.1186/s12933-022-01531-7
9. Muniyappa R, Lee S, Chen H, and Quon MJ. Current approaches for assessing insulin sensitivity and resistance in vivo: advantages, limitations, and appropriate usage. Am J Physiol Endocrinol Metab. (2008) 294:E15–26. doi: 10.1152/ajpendo.00645.2007
10. Briaud I, Harmon JS, Kelpe CL, Segu VB, and Poitout V. Lipotoxicity of the pancreatic beta-cell is associated with glucose-dependent esterification of fatty acids into neutral lipids. Diabetes. (2001) 50:315–21. doi: 10.2337/diabetes.50.2.315
11. Gai Z, Wang T, Visentin M, Kullak-Ublick GA, Fu X, and Wang Z. Lipid accumulation and chronic kidney disease. Nutrients. (2019) 11:722. doi: 10.3390/nu11040722
12. Wu S, An S, Li W, Lichtenstein AH, Gao J, Kris-Etherton PM, et al. Association of trajectory of cardiovascular health score and incident cardiovascular disease. JAMA Netw Open. (2019) 2:e194758. doi: 10.1001/jamanetworkopen.2019.4758
13. Wang C, Yuan Y, Zheng M, Pan A, Wang M, Zhao M, et al. Association of age of onset of hypertension with cardiovascular diseases and mortality. J Am Coll Cardiol. (2020) 75:2921–30. doi: 10.1016/j.jacc.2020.04.038
14. Kopin L and Lowenstein C. Dyslipidemia. Ann Intern Med. (2017) 167:ITC81–96. doi: 10.7326/AITC201712050
15. Lan Y, Chen G, Wu D, Ding X, Huang Z, Wang X, et al. Temporal relationship between atherogenic dyslipidemia and inflammation and their joint cumulative effect on type 2 diabetes onset: a longitudinal cohort study. BMC Med. (2023) 21:31. doi: 10.1186/s12916-023-02729-6
16. Seo IH, Son DH, Lee HS, and Lee YJ. Non-HDL cholesterol as a predictor for incident type 2 diabetes in community-dwelling adults: longitudinal findings over 12 years. Transl Res. (2022) 243:52–9. doi: 10.1016/j.trsl.2021.12.008
17. Sangouni AA, Alizadeh M, Jamalzehi A, Hosseinzadeh M, and Parastouei K. Garlic supplementation improves intestinal transit time, lipid accumulation product and cardiometabolic indices in subjects with metabolic syndrome: A randomized controlled trial. Phytother Res. (2023) 37:2305–14. doi: 10.1002/ptr.7741
18. Gao Y, Hu Y, and Xiang L. Remnant cholesterol, but not other cholesterol parameters, is associated with gestational diabetes mellitus in pregnant women: a prospective cohort study. J Transl Med. (2023) 21:531. doi: 10.1186/s12967-023-04322-0
19. Zou Y, Hu C, Kuang M, and Chai Y. Remnant cholesterol/high-density lipoprotein cholesterol ratio is a new powerful tool for identifying non-alcoholic fatty liver disease. BMC Gastroenterol. (2022) 22:134. doi: 10.1186/s12876-022-02216-x
20. Ramdas Nayak VK, Satheesh P, Shenoy MT, and Kalra S. Triglyceride Glucose (TyG) Index: A surrogate biomarker of insulin resistance. J Pak Med Assoc. (2022) 72:986–8. doi: 10.47391/JPMA.22-63
21. Levey AS, Stevens LA, Schmid CH, Zhang YL, Castro AF 3rd, Feldman HI, et al. A new equation to estimate glomerular filtration rate. Ann Intern Med. (2009) 150:604–12. doi: 10.7326/0003-4819-150-9-200905050-00006
22. American Diabetes A. Standards of medical care in diabetes–2010. Diabetes Care. (2010) 33 Suppl 1:S11–61. doi: 10.2337/dc10-S011
23. American Diabetes A. 2. Classification and diagnosis of diabetes: standards of medical care in diabetes-2020. Diabetes Care. (2020) 43:S14–31. doi: 10.2337/dc20-S002
24. Miao G, Zhang Y, Huo Z, Zeng W, Zhu J, Umans JG, et al. Longitudinal plasma lipidome and risk of type 2 diabetes in a large sample of american Indians with normal fasting glucose: the strong heart family study. Diabetes Care. (2021) 44:2664–72. doi: 10.2337/dc21-0451
25. Razquin C, Toledo E, Clish CB, Ruiz-Canela M, Dennis C, Corella D, et al. Plasma lipidomic profiling and risk of type 2 diabetes in the PREDIMED trial. Diabetes Care. (2018) 41:2617–24. doi: 10.2337/dc18-0840
26. Khaloo P, Hasheminia M, Tohidi M, Abdi H, Mansournia MA, Azizi F, et al. Impact of 3-year changes in lipid parameters and their ratios on incident type 2 diabetes: Tehran lipid and glucose study. Nutr Metab (Lond). (2018) 15:50. doi: 10.1186/s12986-018-0287-6
27. Sheng G, Kuang M, Yang R, Zhong Y, Zhang S, and Zou Y. Evaluation of the value of conventional and unconventional lipid parameters for predicting the risk of diabetes in a non-diabetic population. J Transl Med. (2022) 20:266. doi: 10.1186/s12967-022-03470-z
28. Yin B, Wu Z, Xia Y, Xiao S, Chen L, and Li Y. Non-linear association of atherogenic index of plasma with insulin resistance and type 2 diabetes: a cross-sectional study. Cardiovasc Diabetol. (2023) 22:157. doi: 10.1186/s12933-023-01886-5
29. Wang K, Yu G, Yan L, Lai Y, and Zhang L. Association of non-traditional lipid indices with diabetes and insulin resistance in US adults: mediating effects of HOMA-IR and evidence from a national cohort. Clin Exp Med. (2025) 25:281. doi: 10.1007/s10238-025-01819-4
30. Liu J, Fu Q, Su R, Liu R, Wu S, Li K, et al. Association between nontraditional lipid parameters and the risk of type 2 diabetes and prediabetes in patients with nonalcoholic fatty liver disease: from the national health and nutrition examination survey 2017-2020. Front Endocrinol (Lausanne). (2024) 15:1460280. doi: 10.3389/fendo.2024.1460280
31. Li Y, Zeng Q, Peng D, Hu P, Luo J, Zheng K, et al. Association of remnant cholesterol with insulin resistance and type 2 diabetes: mediation analyses from NHANES 1999-2020. Lipids Health Dis. (2024) 23:404. doi: 10.1186/s12944-024-02393-6
32. Tao Y, Wang T, Zhou W, Zhu L, Yu C, Li J, et al. Association between nontraditional lipid profiles and the risk of type 2 diabetes mellitus in chinese adults with hypertension: findings from the China hypertension registry study. J Clin Hypertens (Greenwich). (2025) 27:e14927. doi: 10.1111/jch.14927
33. Li N, Fu J, Koonen DP, Kuivenhoven JA, Snieder H, and Hofker MH. Are hypertriglyceridemia and low HDL causal factors in the development of insulin resistance? Atherosclerosis. (2014) 233:130–8. doi: 10.1016/j.atherosclerosis.2013.12.013
34. Rahier J, Guiot Y, Goebbels RM, Sempoux C, and Henquin JC. Pancreatic beta-cell mass in European subjects with type 2 diabetes. Diabetes Obes Metab. (2008) 10 Suppl 4:32–42. doi: 10.1111/j.1463-1326.2008.00969.x
35. Taylor R. Type 2 diabetes: etiology and reversibility. Diabetes Care. (2013) 36:1047–55. doi: 10.2337/dc12-1805
36. Cnop M. Fatty acids and glucolipotoxicity in the pathogenesis of Type 2 diabetes. Biochem Soc Trans. (2008) 36:348–52. doi: 10.1042/BST0360348
37. Brennan E, Kantharidis P, Cooper ME, and Godson C. Pro-resolving lipid mediators: regulators of inflammation, metabolism and kidney function. Nat Rev Nephrol. (2021) 17:725–39. doi: 10.1038/s41581-021-00454-y
38. Adeosun SO, Gordon DM, Weeks MF, Moore KH, Hall JE, Hinds TD Jr., et al. Loss of biliverdin reductase-A promotes lipid accumulation and lipotoxicity in mouse proximal tubule cells. Am J Physiol Renal Physiol. (2018) 315:F323–F31. doi: 10.1152/ajprenal.00495.2017
39. Yang P, Xiao Y, Luo X, Zhao Y, Zhao L, Wang Y, et al. Inflammatory stress promotes the development of obesity-related chronic kidney disease via CD36 in mice. J Lipid Res. (2017) 58:1417–27. doi: 10.1194/jlr.M076216
40. Spoto B, Pisano A, and Zoccali C. Insulin resistance in chronic kidney disease: a systematic review. Am J Physiol Renal Physiol. (2016) 311:F1087–F108. doi: 10.1152/ajprenal.00340.2016
Keywords: diabetes, cohort, epidemiology, nontraditional lipid parameters, lipids
Citation: Wang Y, Chen Z, He Z, Qin H, Wu K, Zheng H, Fu P, Cai Z, Wu W, Lan Y, Wu D, Wu S and Chen Y (2025) Relationship between nontraditional lipid parameters and the risk of type 2 diabetes in individuals recovered from dyslipidemia: a cohort study. Front. Endocrinol. 16:1610091. doi: 10.3389/fendo.2025.1610091
Received: 11 April 2025; Accepted: 09 September 2025;
Published: 25 September 2025.
Edited by:
Wei Zhao, China-Japan Friendship Hospital, ChinaReviewed by:
Hyder Mirghani, University of Tabuk, Saudi ArabiaFatemeh Ayoobi, Rafsanjan University of Medical Sciences, Iran
Copyright © 2025 Wang, Chen, He, Qin, Wu, Zheng, Fu, Cai, Wu, Lan, Wu, Wu and Chen. This is an open-access article distributed under the terms of the Creative Commons Attribution License (CC BY). The use, distribution or reproduction in other forums is permitted, provided the original author(s) and the copyright owner(s) are credited and that the original publication in this journal is cited, in accordance with accepted academic practice. No use, distribution or reproduction is permitted which does not comply with these terms.
*Correspondence: Shouling Wu, ZHJ3dXNsQDE2My5jb20=; Youren Chen, eXJjaGVuM0BzdHUuZWR1LmNu