 Yanling Wei
 Fangxiang Mu
 Fang Wang
- Department of Reproductive Medicine, Lanzhou University Second Hospital, Lanzhou, China
Objective: The single measurement of serum progesterone is considered a predictor for non-viable pregnancies. However, the dynamic change in progesterone during early pregnancy loss (EPL) remains uninvestigated. This study evaluated the association between serum progesterone decline thresholds (PDT) and EPL.
Methods: This retrospective study included 664 pregnant women who visited a single medical center from January 2023 to December 2024. Based on pregnancy outcomes within the first trimester, participants were classified into the ongoing pregnancy group (n=388) and the EPL group (n=286). PDT was defined as a decline of ≥ 1/5 standard deviation (SD), 1/3 SD, 1/2 SD, 7/10 SD, or 1 SD compared with the last measurement of serum progesterone levels. SD was calculated based on the baseline serum progesterone levels. Multivariate logistic regression was applied to explore the association between PDT and EPL. Receiver operating characteristic (ROC) curve analysis was conducted to assess the diagnostic value of PDT. Subgroup analyses were performed to evaluate the robustness of the results.
Results: Compared with the ongoing pregnancy group, the EPL group had significantly lower baseline serum progesterone levels (P < 0.05). PDT ≥ 1/5 SD, 1/3 SD, and 1/2 SD were all significantly associated with EPL (OR [95%CI]=2.74 [1.76, 4.27], P < 0.001; OR [95%CI]=1.74 [1.18, 2.56], P=0.005; and OR [95%CI]=1.63 [1.07, 2.49], P=0.024, respectively). The corresponding AUC values were 0.502, 0.512, and 0.503. Additionally, a linear positive correlation was observed between the number of occurrences of PDT ≥ 1/3 SD and EPL. For each additional occurrence of PDT ≥ 1/3 SD, the risk of EPL increased by 36% (OR [95%CI]=1.36 [1.09, 1.70], P=0.006). Subgroup analyses supported the robustness of these results.
Conclusion: PDT ≥ 1/5 SD, 1/3 SD, and 1/2 SD are significantly associated with an increased risk of EPL. This suggests that these thresholds hold potential predictive value in EPL diagnosis and may help identify pregnant women at higher risk for early intervention.
1 Introduction
Pregnancy loss affects 15%–25% of clinically recognized pregnancies (1). Approximately 80% of pregnancy losses occur during the first trimester (up to 12 weeks and 6/7 days), termed early pregnancy loss (EPL) (2). Common symptoms of EPL include vaginal bleeding and uterine cramping (3); however, these symptoms are also observed in normal and ectopic pregnancies, which makes the diagnosis and management of EPL challenging.
Transvaginal ultrasonographic (TVS) diagnosis is the primary method for confirming EPL by detecting fetal cardiac activity. However, due to incomplete embryonic development in early pregnancy, a single TVS examination may not provide a definitive diagnosis, often requiring follow-up scans within 7–14 days (4–6). Consequently, researchers have focused on identifying highly sensitive and specific biomarkers for early EPL diagnosis (7–9).
Progesterone is secreted by the corpus luteum, which ensures normal embryonic development by establishing maternal-fetal immune tolerance, inhibiting uterine contractions, and improving uteroplacental circulation (10). Its levels remain relatively stable before 9 weeks of gestation and gradually increase after 10–12 weeks as the placenta takes over secretion (11). Studies have consistently confirmed that serum progesterone levels are significantly lower in women experiencing pregnancy loss compared to those with ongoing pregnancies (12, 13), and baseline progesterone levels in early pregnancy have been shown to aid in discriminating between viable and non-viable pregnancies (14–16). However, progesterone levels fluctuate significantly within individuals due to pulsatile secretion patterns, hormone distribution, and dietary influences (17–19), particularly when gestational age is not consistently recorded in studies. Furthermore, studies have suggested that the progesterone level partially overlaps between normal and abnormal pregnancies (20, 21), which complicates their clinical application.
Therefore, we hypothesize that the dynamic monitoring of serum progesterone decline might address the limitations of single measurements because it captures changes in progesterone levels between measurements. In this study, we aimed to evaluate the association between progesterone decline threshold (PDT) and EPL, which may provide predictive value for EPL diagnosis.
2 Methods
2.1 Participants
This retrospective analysis was conducted on 1,865 pregnant women who visited the Department of Reproductive Medicine, Lanzhou University Second Hospital between January 2023 and December 2024. The study was approved by the Ethics Committee of Lanzhou University Second Hospital (Approval No. 2019A-231), and all participants provided written informed consent.
The inclusion criteria were as follows (1): Age between 18 and 45 years (2); Natural conception (3); Availability of early pregnancy outcome (4); At least two progesterone measurements completed between 3 and 12 weeks of pregnancy.
Participants were excluded if they had (1): Parental or embryonic chromosomal abnormalities (2); Congenital uterine anomalies (e.g., septate uterus, unicornuate uterus, bicornuate uterus, or uterus didelphys) without surgical correction during the current pregnancy (3); Multiple pregnancies (4); Infertility (5); Ectopic pregnancy (6); Missing progesterone data or fewer than two measurements. The participants’ demographics were also recorded, including maternal age, body mass index (BMI), age at menarche, and menstrual regularity.
2.2 Progesterone measurement
Progesterone (ng/mL) was the exposure variable in this study. Peripheral venous blood was collected from all patients during their visits, and serum was separated after centrifugation. Progesterone levels were measured using an automated chemiluminescence immunoassay analyzer (Immulite 1000, Siemens Healthineers). The timing of subsequent measurements was determined based on pregnancy status.
2.3 Definition of PDT
In this study, any progesterone level lower than the last measurement was considered a decline. To explore the association between PDT and EPL, PDT was defined as a decline of ≥ 1/5 standard deviation (SD), 1/3 SD, 1/2 SD, 7/10 SD, and 1 SD compared to the last measurement of serum progesterone levels. SD was calculated from the baseline serum progesterone levels of the eligible participants.
2.4 Study outcomes
The study outcomes were pregnancy loss (including biochemical pregnancy) and ongoing pregnancy within 12 weeks of gestation. Embryonic viability was assessed using TVS. Ongoing pregnancy was defined as the presence of embryonic cardiac activity, while EPL was defined as the absence of cardiac activity, confirmed by repeated TVS after 7–14 days.
2.5 Statistical analysis
Categorical variables were presented as numbers and percentages (%), and group comparisons were performed using the Chi-square test. Continuous variables, if normally distributed, were described as mean ± SD; otherwise, they were presented as median (interquartile range). Group differences for continuous variables were compared using the Student’s t-test or the Kruskal-Wallis H test. Missing data were handled using multiple imputation.
The association between PDT and EPL was investigated using multivariate logistic regression analysis. To control for confounding factors, three adjusted models were constructed: Model 1 adjusted for age; Model 2 adjusted for age and baseline serum progesterone; Model 3 adjusted for age, baseline serum progesterone, and number of progesterone measurements. Receiver operator characteristic (ROC) curve analysis was conducted to assess the diagnostic value of PDT, and the area under the ROC curve (AUC) was calculated using the DeLong test. Restricted cubic spline analysis was utilized to explore potential non-linear relationships between the number of PDT occurrences and EPL. Furthermore, subgroup analyses were performed by dividing participants into two groups based on whether their progesterone levels fell below baseline, to assess the robustness of the association between PDT and EPL.
All statistical analyses were conducted using R version 4.3.1 (http://www.R-project.org, The R Foundation) and EmpowerStats version 4.2 (https://www.empowerstats.net/en/; X&Y solutions, Inc.). All statistical tests were two-tailed, with P < 0.05 considered statistically significant.
3 Results
3.1 Baseline characteristics of the participants
This study included 664 women who met the inclusion criteria (Figure 1), with 276 cases of EPL and 388 cases of ongoing pregnancy. Table 1 summarizes the characteristics of the participants. The EPL group had significantly higher age (31.56 ± 3.98 vs. 30.62 ± 3.70 years, P=0.004) and body mass index (22.04 ± 2.95 vs. 21.52 ± 2.92 kg/m², P=0.018), as well as significantly lower number of progesterone measurements (5.84 ± 3.42 vs. 8.78 ± 3.78, P < 0.001) and baseline serum progesterone levels (30.73 ± 24.74 vs. 35.62 ± 25.47 ng/mL, P < 0.001) compared to the ongoing pregnancy group (all P < 0.05). Other characteristics were comparable between the two groups.
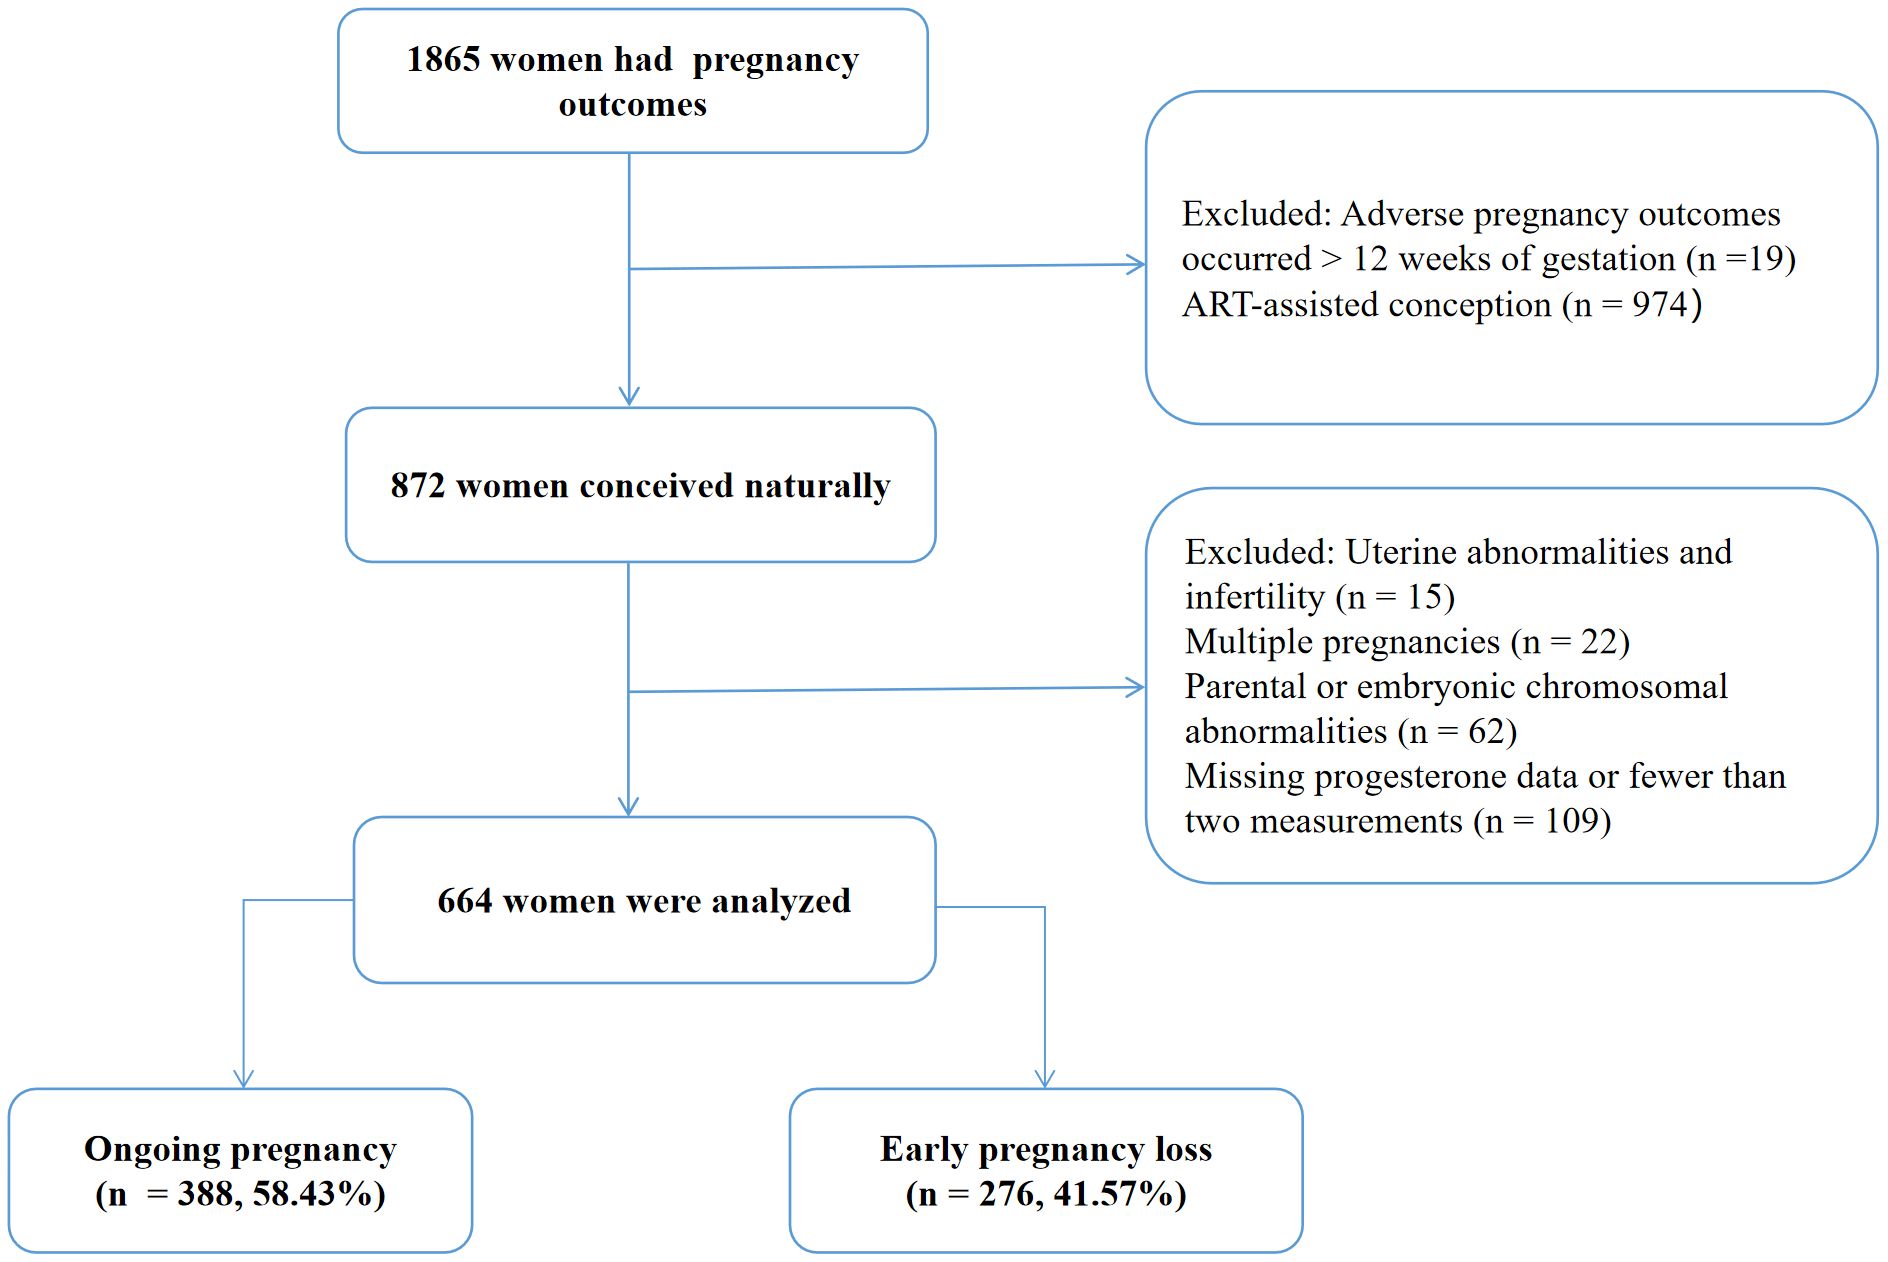
Figure 1. Participant selection flow diagram.
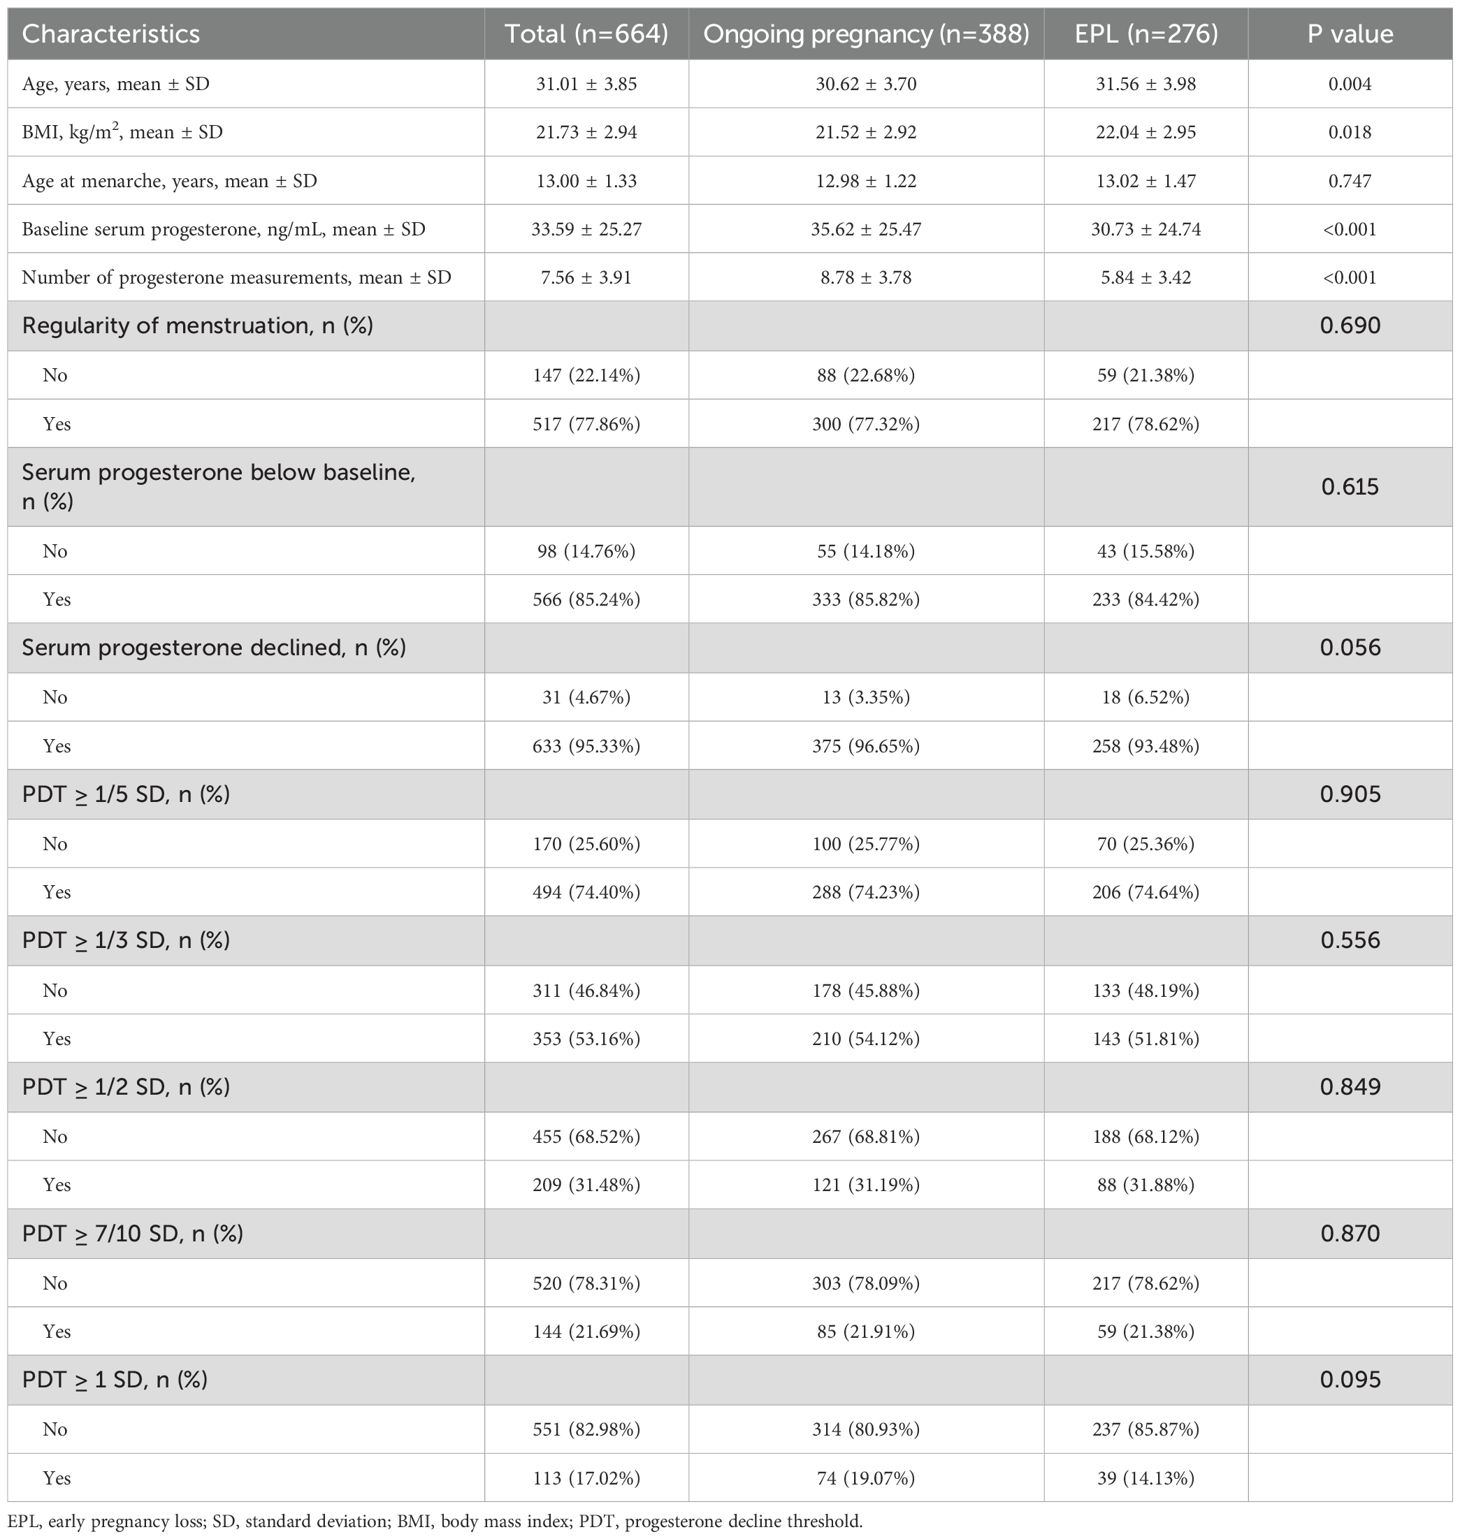
Table 1. Baseline characteristics of participants.
3.2 Association between PDT and EPL
In Models 1 and 2, PDT was not significantly associated with EPL (P > 0.05). In Model 3, however, PDT ≥ 1/5 SD, 1/3 SD, and 1/2 SD were positively associated with EPL, with risks of 2.74-fold (95%CI: 1.76, 4.27, P < 0.001), 1.74-fold (95%CI: 1.18, 2.56, P=0.005), and 1.63-fold (95%CI: 1.07, 2.49, P=0.024) for those experiencing a decline compared to those without a decline, respectively (Table 2, Figure 2).
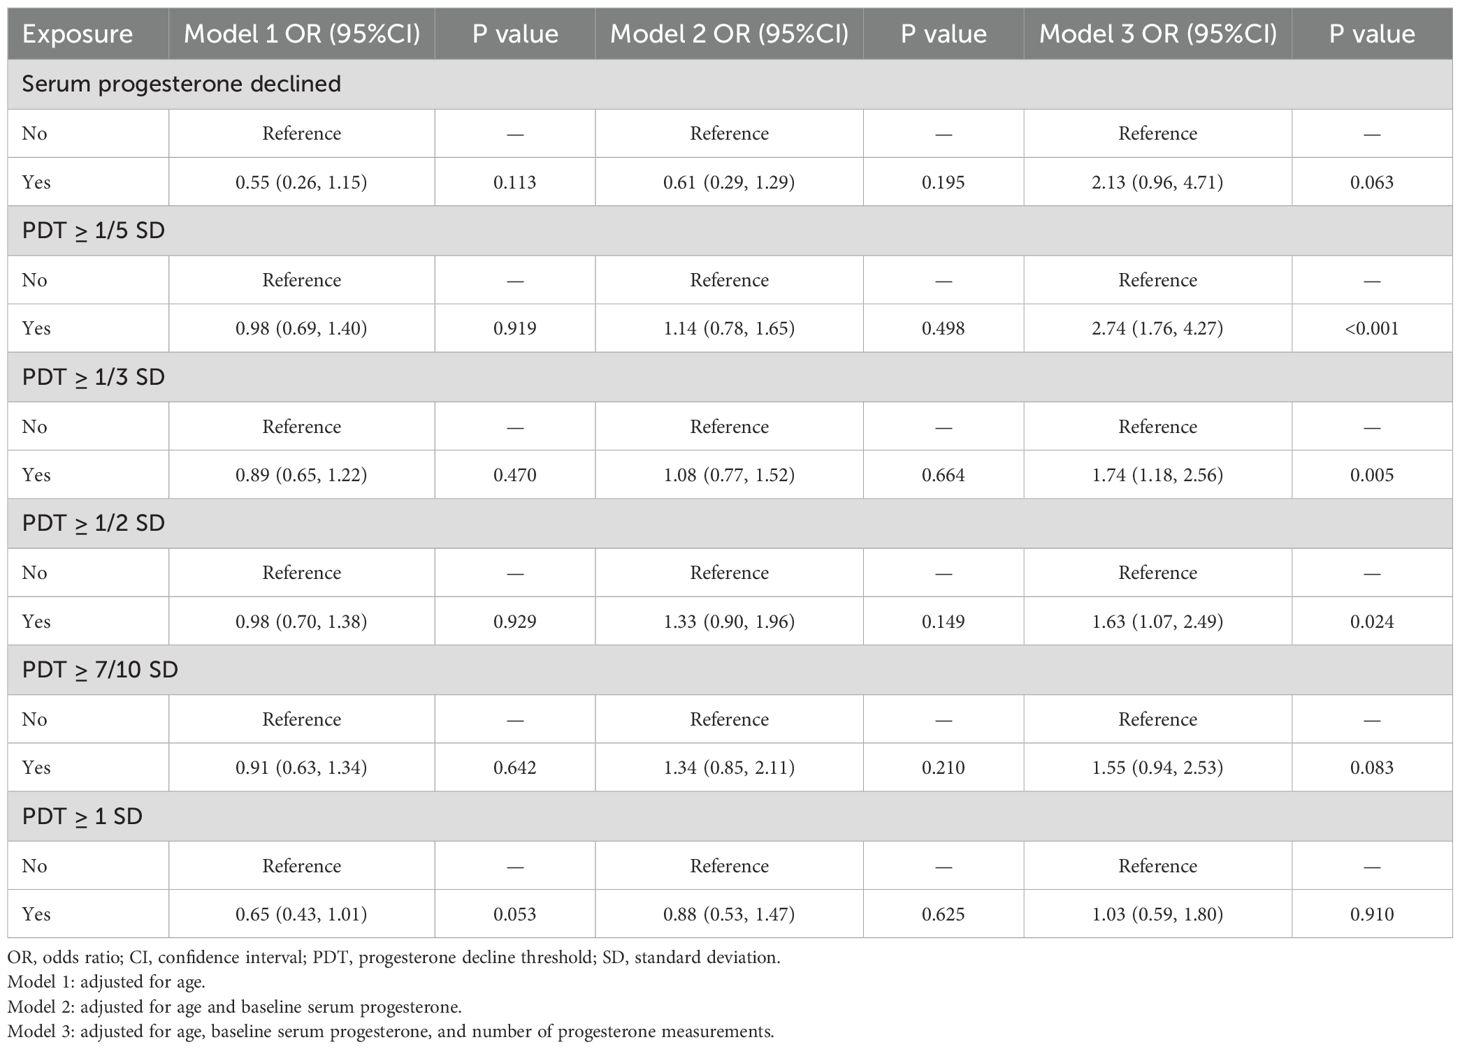
Table 2. The association between PDT and EPL.
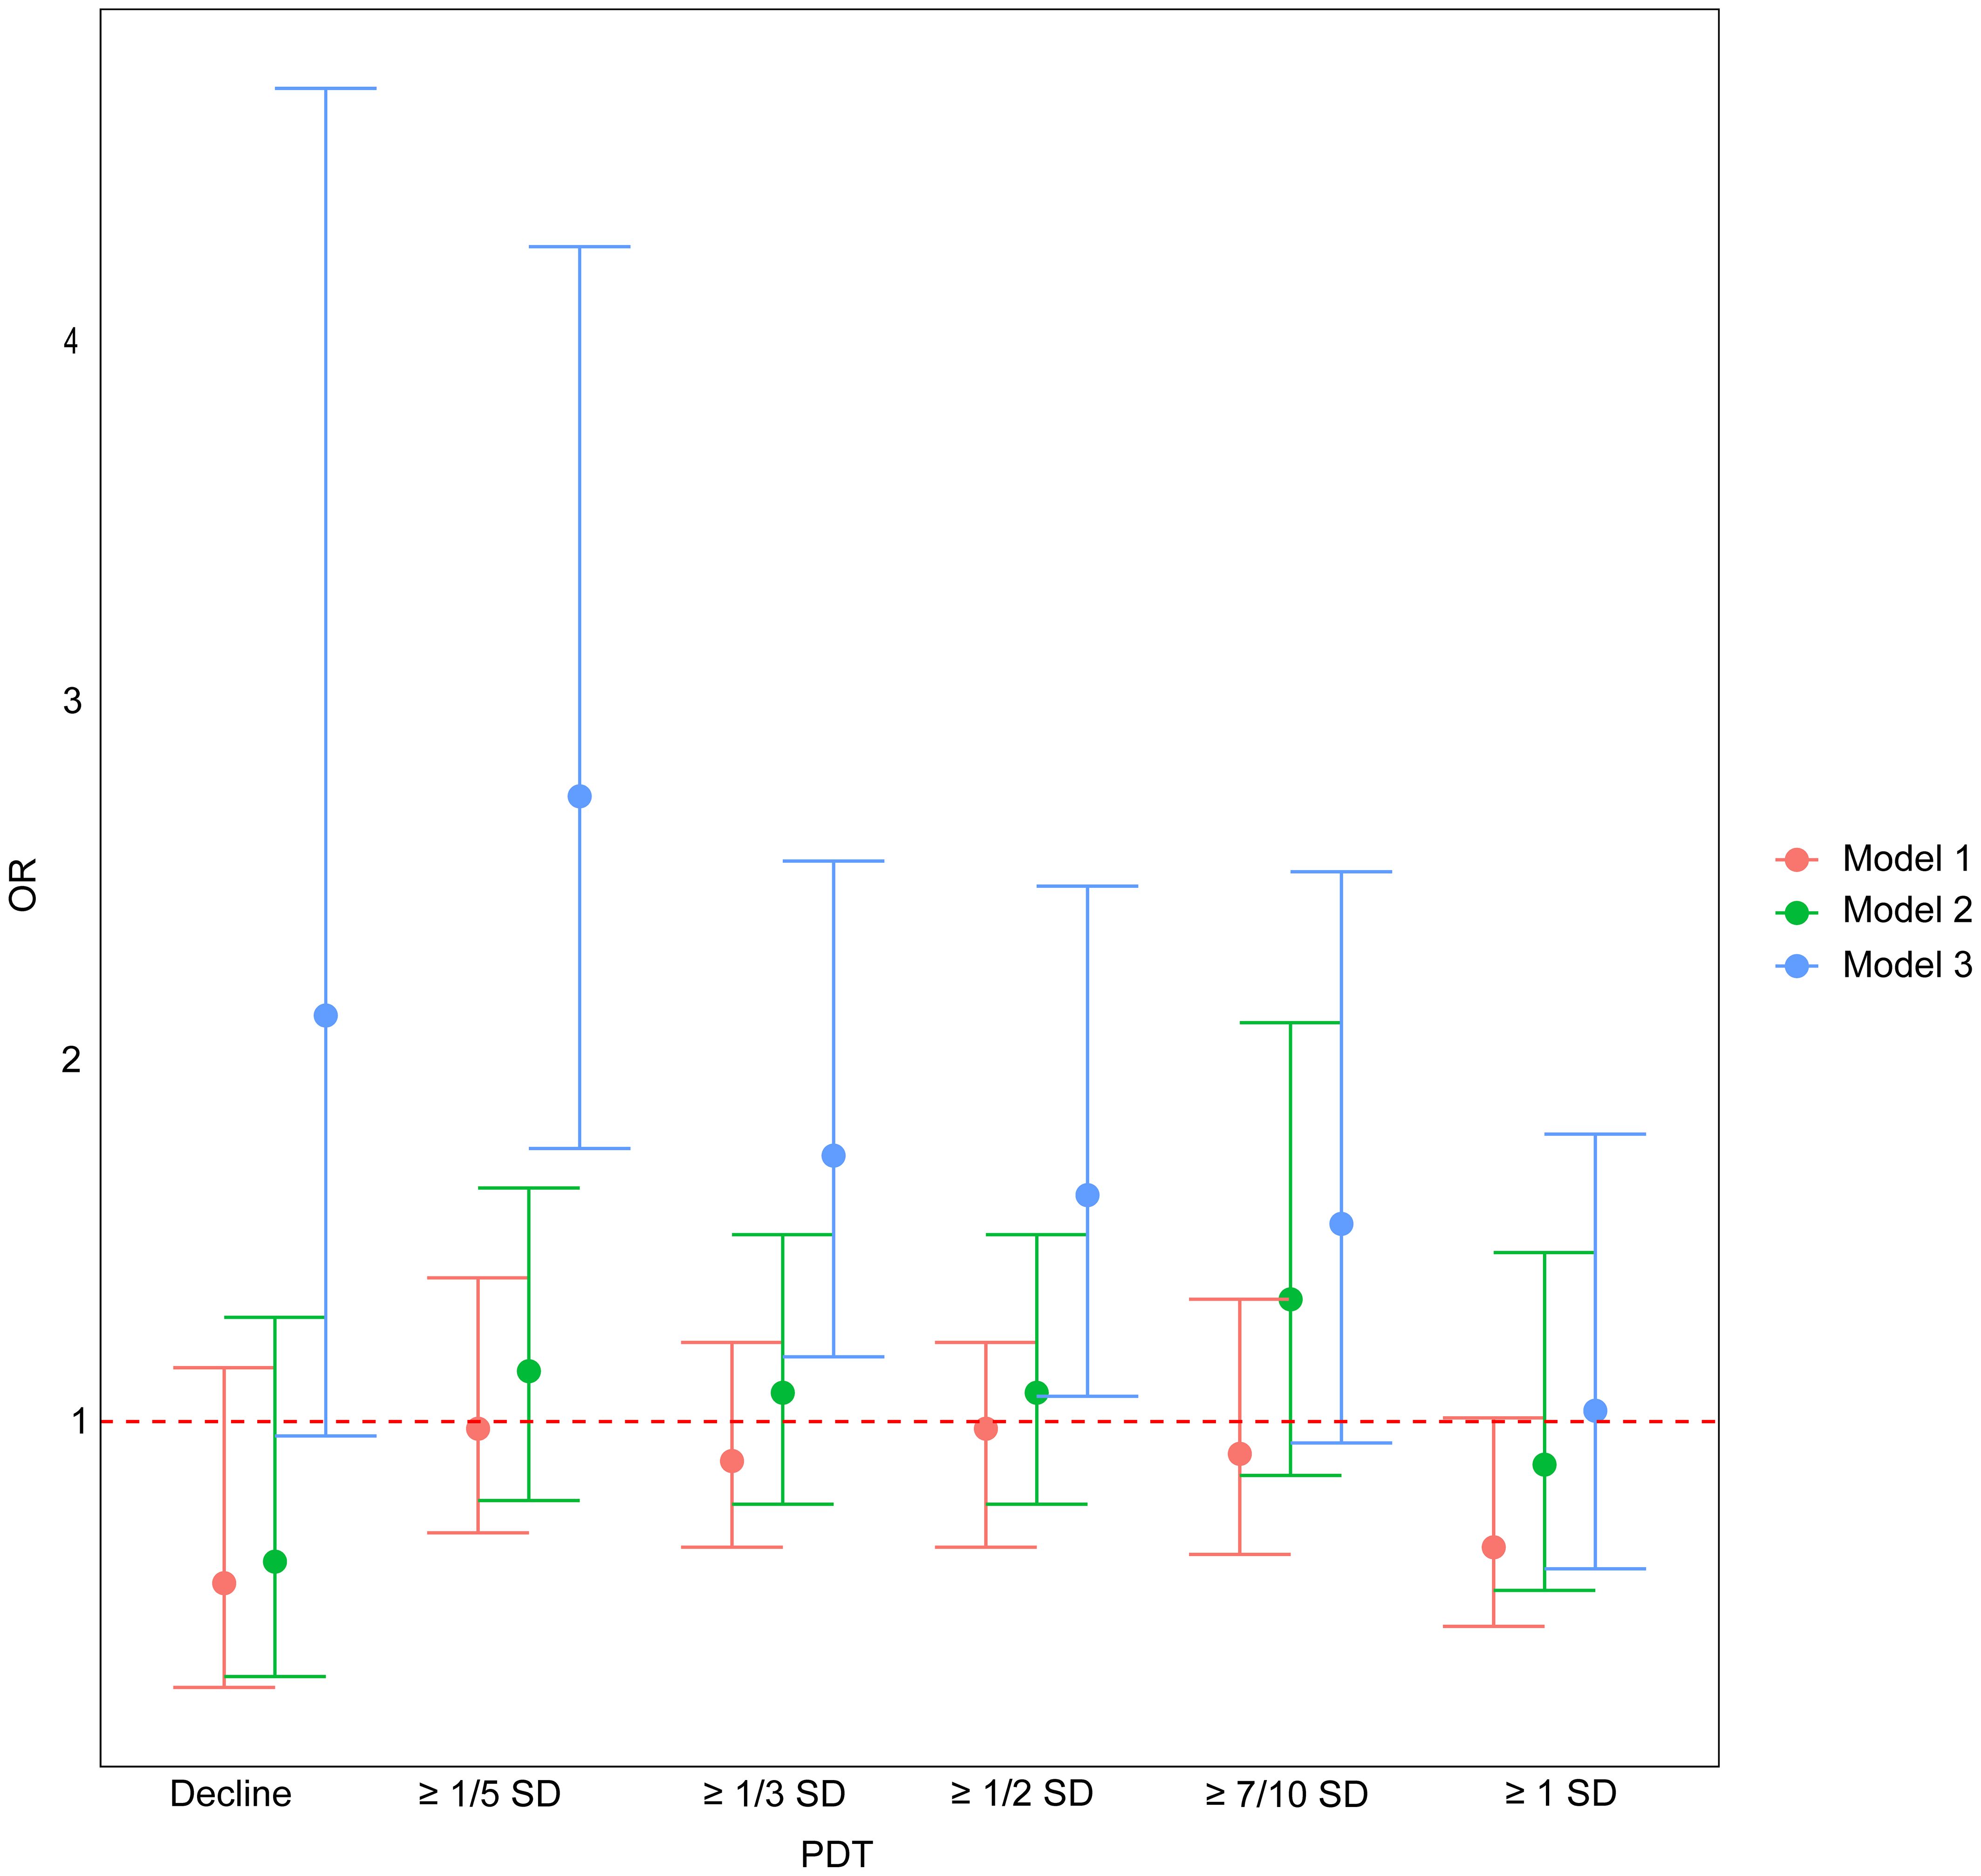
Figure 2. The association between PDT and EPL. OR, odds ratio; PDT, progesterone decline threshold; SD, standard deviation. Model 1: adjusted for age; Model 2: adjusted for age and baseline serum progesterone; Model 3: adjusted for age, baseline serum progesterone, and number of progesterone measurements.
3.3 Diagnostic value of PDT
The ROC analysis showed that when PDT ≥ 1/5 SD, 1/3 SD, and 1/2 SD, the AUC values were 0.502, 0.512, and 0.503, respectively (Table 3). The DeLong test results were not significant (P > 0.05), indicating no significant differences in diagnostic performance for EPL across these decline magnitudes.
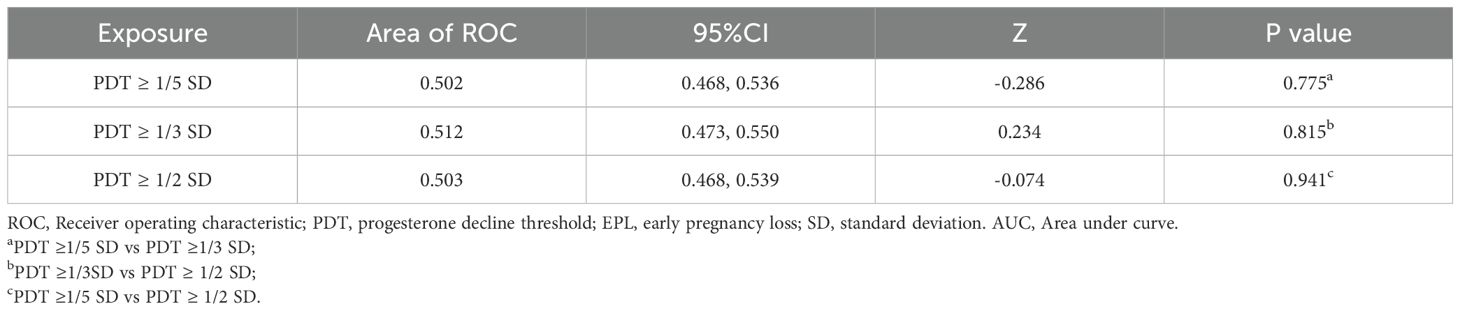
Table 3. ROC analysis of the predictive value of PDT in predicting EPL.
3.4 Association between the number of occurrences of PDT ≥ 1/3 SD and EPL
The logistic regression results presented in Table 4 indicated that, in Model 3, the number of occurrences of PDT ≥ 1/3 SD was significantly positively associated with EPL. Each additional occurrence of this decline increased the risk of EPL by 36% (OR=1.36, 95%CI: 1.09, 1.70, P=0.006). Similarly, restricted cubic spline analysis also demonstrated a linear association between the number of occurrences of PDT ≥ 1/3 SD and EPL (P < 0.05), with an increasing risk of EPL as the occurrences of declines increased (Figure 3).

Table 4. The association between the number of occurrences of PDT ≥ 1/3 SD and EPL.
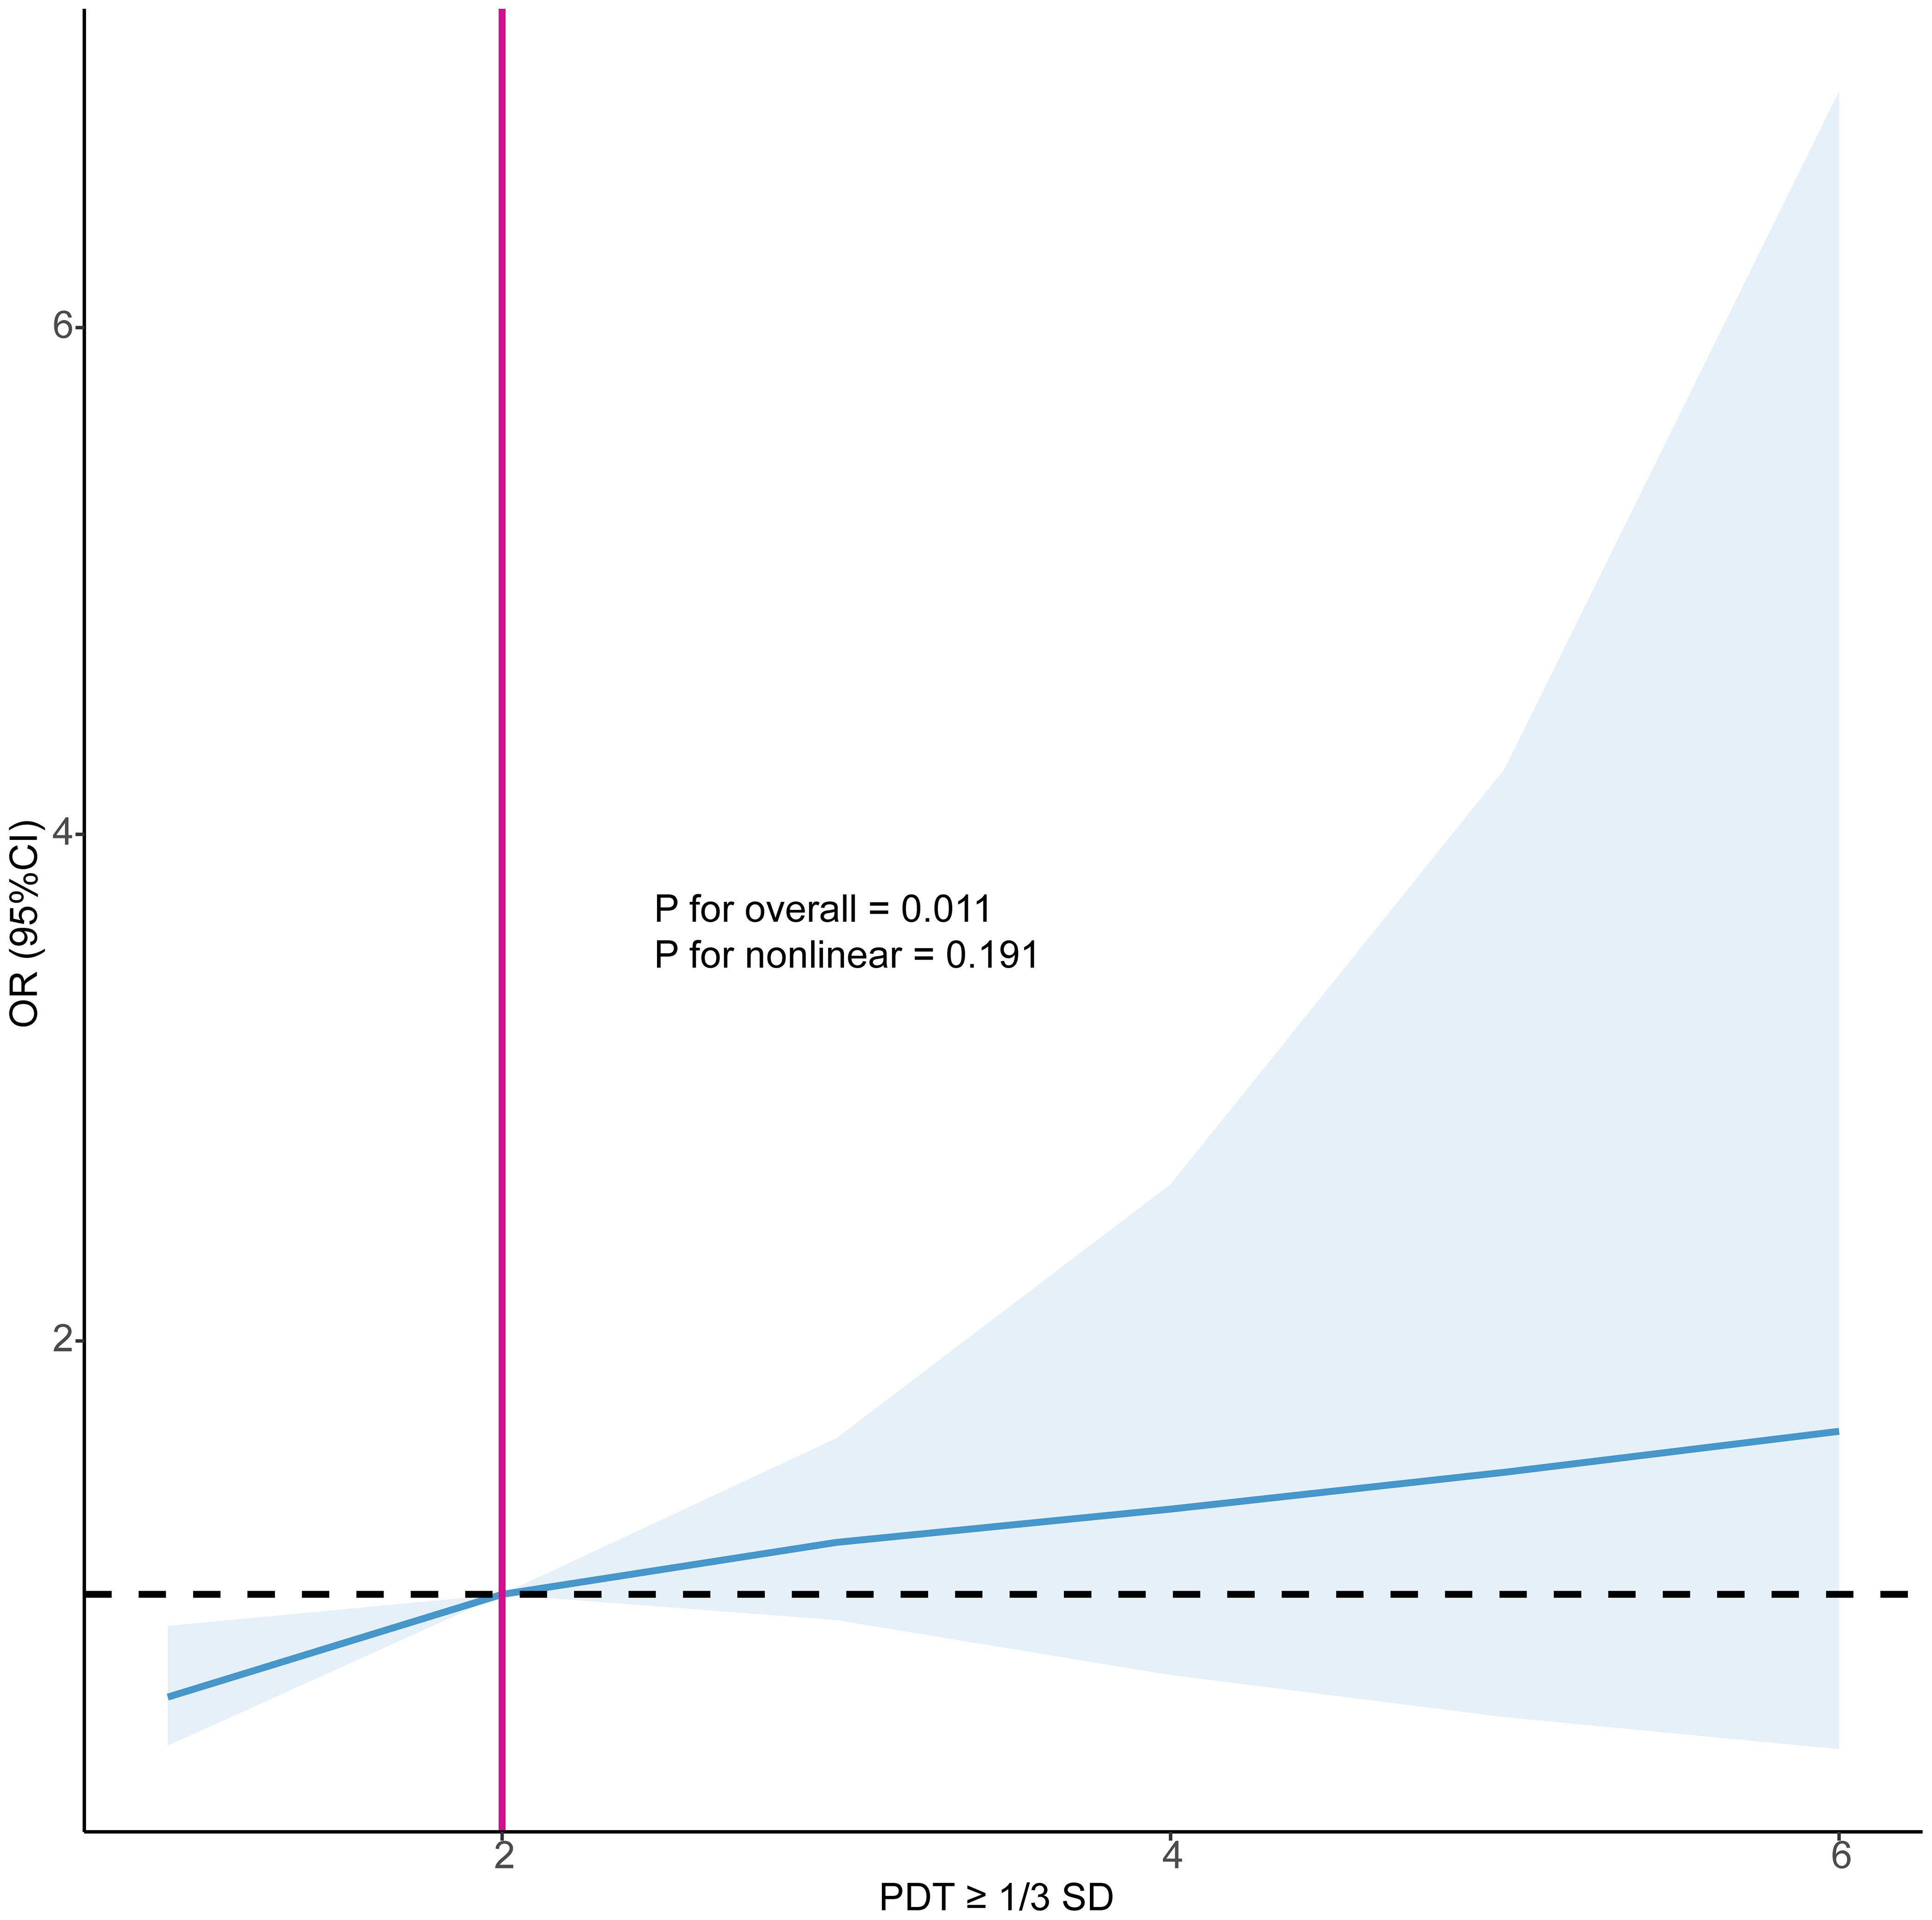
Figure 3. Restricted cubic splines examined the association between the number of occurrences of PDT ≥ 1/3 SD and EPL. PDT, progesterone decline threshold; SD, standard deviation; OR, odds ratio; CI, confidence interval.
3.5 Subgroup analysis
When PDT ≥ 1/5 SD and 1/3 SD, along with the serum progesterone levels below baseline levels, they were significantly positively associated with EPL risk (OR=2.76, 95%CI: 1.66, 4.60, P < 0.001 for 1/5SD; OR=1.54, 95%CI: 1.01, 2.34, P=0.043 for 1/3 SD) (Table 5). However, no significant associations with EPL were observed in the other subgroups. Additionally, all P for interaction values across subgroups were not significant, suggesting that the significant associations between PDT ≥ 1/5 SD, 1/3 SD, 1/2 SD, and EPL were robust regardless of whether the serum progesterone levels after decline were below baseline.
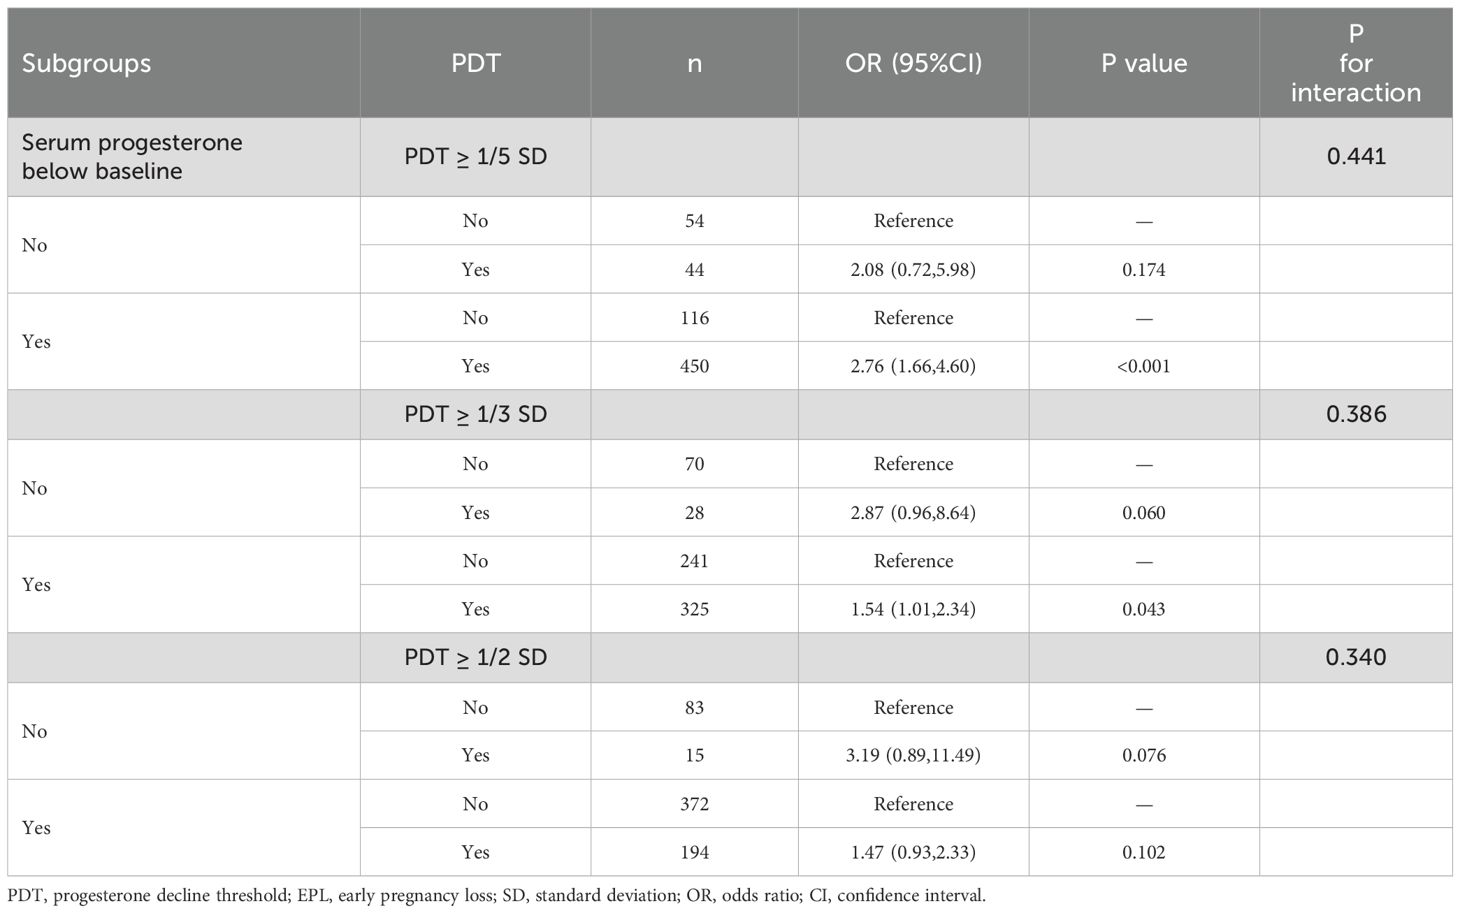
Table 5. Subgroup analyses of the effect of PDT on EPL.
4 Discussion
Developing useful and reliable clinical prediction models based on serum biomarkers is crucial for identifying at-risk populations to improve their pregnancy outcomes. To our knowledge, this study is the first to investigate the predictive value of varying decline thresholds of progesterone levels for EPL. The results indicate that changes in progesterone levels can effectively predict pregnancy outcomes. Specifically, when PDT ≥ 1/5 SD, 1/3 SD, and 1/2 SD, the risk of EPL increased by 2.74 times, 1.76 times, and 1.63 times, respectively. Furthermore, each additional occurrence of PDT ≥ 1/3 SD increased the risk of EPL by 36%. These findings remained robust even when serum progesterone levels, after a decline, were below baseline levels. This study supports that PDT ≥ 1/5 SD, 1/3 SD, and 1/2 SD holds potential predictive value in EPL diagnosis, which may aid clinicians in developing more targeted interventions.
Progesterone levels fluctuate and rise during pregnancy, playing a critical role in maintaining gestation. A decrease in progesterone levels in early pregnancy may reflect inadequate luteal function or abnormal placental development, leading to compromised pregnancy maintenance (22, 23). The lower the serum progesterone levels, the lower the likelihood of pregnancy viability (24). Therefore, previous studies have sought to identify a progesterone cut-off value for predicting pregnancy outcome. Hanita et al., (25) Li et al., (26) and Puget etal., (27) reported cut-off values of 32.7, 19.4, and 6.2 ng/mL ng/mL, respectively, for predicting non-viable pregnancies. However, Sakar reported that a 10.7 ng/mL cut-off value more accurately identified viable pregnancies but poorly diagnosed non-viable ones (28). Additionally, some studies noted that the diagnostic cut-off value for non-viable pregnancies might be influenced by gestational age and symptoms (e.g., bleeding or pain) (29, 30). Collectively, inter-study heterogeneity complicates the selection of a reliable cut-off value. In contrast, this study introduces dynamic monitoring of serum progesterone changes and suggests that PDT ≥ 1/5 SD, 1/3 SD, and 1/2 SD has predictive value for diagnosing EPL. This approach minimizes bias from assay variability and population differences, allows earlier prediction of EPL, and may improve clinical decision-making and management.
Dynamic monitoring of early pregnancy hormones is clinically valuable for assessing gestational outcomes. Whittaker et al. performed serial measurements of progesterone, estradiol, and human chorionic gonadotropin (hCG) from gestational days 21 to 91 in asymptomatic women who later experienced early pregnancy failure. They observed that, around day 50, hormone levels continued to rise in normal pregnancies but declined in the early-failure group, indicating that dynamic monitoring can identify high-risk, asymptomatic women earlier (7). Similarly, Li et al. showed that tracking changes in estradiol and hCG over time enabled earlier detection of bad pregnancy outcomes (31). Additionally, Mu et al. reported that the average estradiol decreased times correlated positively with EPL risk (32). Su et al. further examined the absolute rate of progesterone change (Δprogesterone) between weeks 6 and 10, finding it predictive of outcome—though not as strongly as ΔhCG or Δestradiol (33). Our findings also support the significance of dynamic monitoring for pregnancy progress. We define PDT to stratify declines between consecutive measurements and suggest its significant predictive value for EPL.
Although our findings have positive clinical implications for managing pregnant women, they should be interpreted with caution. We observed that as PDT increased, the associated risk of EPL weakened, and PDT ≥ 7/10 SD and 1 SD did not show significance. This may be due to the reduced sample size of participants with progesterone decline participants as PDT increased, leading to lower statistical power. Future studies should aim to expand sample sizes and adopt prospective designs to more accurately assess the relationship between PDT and the risk of EPL. Additionally, our model’s AUC values were relatively low (0.502, 0.503, and 0.512), indicating limited predictive ability on their own. This may reflect progesterone’s intrinsic pulsatile secretion, in which a single decline may indicate physiological fluctuations rather than a pathological state; furthermore, our study did not control the intervals between measurements, inherently introducing risks of information bias. As a result, in clinical practice, these PDT indicators should serve as supplementary or adjunctive diagnostic tools. For example, combining other available indicators, such as new ultrasonographic parameters, hCG, estradiol, and PAPP-A (31, 34), to conduct multivariate analysis could enhance the diagnostic performance of the predictive models. Moreover, this study was retrospective and relied on historical case data, excluding patients with incomplete progesterone testing records, which inherently introduced risks of selection bias and potential information bias. In addition, we did not obtain medication information for these participants, making it impossible to exclude the use of progesterone supplements, which affects the accuracy of the results. Finally, as these results lack external validation, we plan to confirm their reliability in larger, independent, multicenter cohorts.
In conclusion, our study suggests that PDT ≥ 1/5 SD, 1/3 SD, and 1/2 SD may provide useful information for identifying high-risk EPL populations, thereby assisting clinical decision-making. Currently, EPL diagnosis primarily relies on TVS examinations, which have limited utility in early pregnancy due to incomplete embryonic development. Our findings offer a potential complementary tool for this diagnostic process. By incorporating dynamic assessments of progesterone levels, particularly cases where serum progesterone decline exceeds 1/5 SD, 1/3 SD, and 1/2 SD, clinicians may identify high-risk EPL populations earlier. This could enable more frequent pregnancy monitoring or early interventions, providing scientifically based decision support for early screening and management of EPL.
5 Conclusion
PDT ≥ 1/5 SD, 1/3 SD, and 1/2 SD significantly increased the risk of EPL. These results may aid in EPL diagnosis and help clinicians optimize pregnancy management strategies. Future large-scale studies are needed to further validate the application value of these findings.
Data availability statement
The raw data supporting the conclusions of this article will be made available by the authors, without undue reservation.
Ethics statement
The studies involving humans were approved by Ethics Committee of Lanzhou University Second Hospital (Approval No. 2019A-231). The studies were conducted in accordance with the local legislation and institutional requirements. The participants provided their written informed consent to participate in this study.
Author contributions
YW: Conceptualization, Data curation, Writing – original draft. XX: Data curation, Formal analysis, Writing – original draft. FM: Validation, Visualization, Writing – original draft. FW: Conceptualization, Writing – review & editing.
Funding
The author(s) declare financial support was received for the research and/or publication of this article. This study was supported by the Science Foundation of Lanzhou University (Grant No. 071100132).
Conflict of interest
The authors declare that the research was conducted in the absence of any commercial or financial relationships that could be construed as a potential conflict of interest.
Generative AI statement
The author(s) declare that no Generative AI was used in the creation of this manuscript.
Any alternative text (alt text) provided alongside figures in this article has been generated by Frontiers with the support of artificial intelligence and reasonable efforts have been made to ensure accuracy, including review by the authors wherever possible. If you identify any issues, please contact us.
Publisher’s note
All claims expressed in this article are solely those of the authors and do not necessarily represent those of their affiliated organizations, or those of the publisher, the editors and the reviewers. Any product that may be evaluated in this article, or claim that may be made by its manufacturer, is not guaranteed or endorsed by the publisher.
References
1. Practice Committee of the American Society for Reproductive Medicine. Evaluation and treatment of recurrent pregnancy loss: a committee opinion. Fertility sterility. (2012) 98:1103–11. doi: 10.1016/j.fertnstert.2012.06.048
2. American College of Obstetricians and Gynecologists’ Committee on Practice Bulletins—Gynecology. ACOG practice bulletin no. 200: early pregnancy loss. Obstet Gynecol. (2018) 132:e197–207. doi: 10.1097/AOG.0000000000002899
3. Sapra KJ, Joseph KS, Galea S, Bates LM, Louis GM, and Ananth CV. Signs and symptoms of early pregnancy loss. Reprod Sci (Thousand Oaks Calif). (2017) 24:502–13. doi: 10.1177/1933719116654994
4. Preisler J, Kopeika J, Ismail L, Vathanan V, Farren J, Abdallah Y, et al. Defining safe criteria to diagnose miscarriage: prospective observational multicenter study. BMJ (Clinical Res ed). (2015) 351:h4579. doi: 10.1136/bmj.h4579
5. Huchon C, Deffieux X, Beucher G, Capmas P, Carcopino X, Costedoat-Chalumeau N, et al. Pregnancy loss: French clinical practice guidelines. Eur J obstetrics gynecology Reprod Biol. (2016) 201:18–26. doi: 10.1016/j.ejogrb.2016.02.015
6. Doubilet PM, Benson CB, Bourne T, Blaivas M, Barnhart KT, Benacerraf BR, et al. Diagnostic criteria for nonviable pregnancy early in the first trimester. New Engl J Med. (2013) 369:1443–51. doi: 10.1056/NEJMra1302417
7. Whittaker PG, Schreiber CA, and Sammel MD. Gestational hormone trajectories and early pregnancy failure: a reassessment. Reprod Biol endocrinology: RB&E. (2018) 16:95. doi: 10.1186/s12958-018-0415-1
8. Huang J, Lv P, Lian Y, Zhang M, Ge X, Li S, et al. Construction of machine learning tools to predict threatened miscarriage in the first trimester based on AEA, progesterone and β-hCG in China: a multicenter, observational, case-control study. BMC Pregnancy Childbirth. (2022) 22:697. doi: 10.1186/s12884-022-05025-y
9. Pillai RN, Konje JC, Tincello DG, and Potdar N. Role of serum biomarkers in the prediction of outcome in women with threatened miscarriage: a systematic review and diagnostic accuracy meta-analysis. Hum Reprod update. (2016) 22:228–39. doi: 10.1093/humupd/dmv054
10. Di Renzo GC, Giardina I, Clerici G, Brillo E, and Gerli S. Progesterone in normal and pathological pregnancy. Hormone Mol Biol Clin Invest. (2016) 27:35–48. doi: 10.1515/hmbci-2016-0038
11. Taraborrelli S. Physiology, production and action of progesterone. Acta obstetricia gynecologica Scandinavica. (2015) 94 Suppl 161:8–16. doi: 10.1111/aogs.12771
12. Duan L, Yan D, Zeng W, Yang X, and Wei Q. Predictive power progesterone combined with beta human chorionic gonadotropin measurements in the outcome of threatened miscarriage. Arch gynecology obstetrics. (2011) 283:431–5. doi: 10.1007/s00404-010-1367-7
13. Lek SM, Ku CW, Allen JC Jr., Malhotra R, Tan NS, Østbye T, et al. Validation of serum progesterone <35nmol/L as a predictor of miscarriage among women with threatened miscarriage. BMC Pregnancy Childbirth. (2017) 17:78. doi: 10.1186/s12884-017-1261-4
14. Yalçin I, Taşkin S, Pabuçcu EG, and Söylemez F. The value of placental protein 13, β-human chorionic gonadotropin and progesterone in the prediction of miscarriages in threatened miscarriage patients. J obstetrics gynecology. (2015) 35:283–6. doi: 10.3109/01443615.2014.948822
15. Ucyigit A, Fuller JL, Poon LC, Johns J, and Ross JA. The significance of low first trimester serum progesterone in ongoing early pregnancies presenting as pregnancies of unknown location. Eur J obstetrics gynecology Reprod Biol. (2021) 258:294–8. doi: 10.1016/j.ejogrb.2021.01.013
16. He S, Allen JC Jr., Malhotra R, Østbye T, and Tan TC. Association of maternal serum progesterone in early pregnancy with low birth weight and other adverse pregnancy outcomes. J maternal-fetal neonatal Med. (2016) 29:1999–2004. doi: 10.3109/14767058.2015.1072159
17. Filicori M, Butler JP, and Crowley WF Jr. Neuroendocrine regulation of the corpus luteum in the human. Evidence for pulsatile progesterone secretion. J Clin Invest. (1984) 73:1638–47. doi: 10.1172/JCI111370
18. Schliep KC, Mumford SL, Hammoud AO, Stanford JB, Kissell KA, Sjaarda LA, et al. Luteal phase deficiency in regularly menstruating women: prevalence and overlap in identification based on clinical and biochemical diagnostic criteria. J Clin Endocrinol Metab. (2014) 99:E1007–14. doi: 10.1210/jc.2013-3534
19. Nakajima ST, McAuliffe T, and Gibson M. The 24-hour pattern of the levels of serum progesterone and immunoreactive human chorionic gonadotropin in normal early pregnancy. J Clin Endocrinol Metab. (1990) 71:345–53. doi: 10.1210/jcem-71-2-345
20. Radwanska E, Frankenberg J, and Allen EI. Plasma progesterone levels in normal and abnormal early human pregnancy. Fertility sterility. (1978) 30:398–402. doi: 10.1016/S0015-0282(16)43571-5
21. Ku CW, Allen JC Jr., Lek SM, Chia ML, Tan NS, and Tan TC. Serum progesterone distribution in normal pregnancies compared to pregnancies complicated by threatened miscarriage from 5 to 13 weeks gestation: a prospective cohort study. BMC Pregnancy Childbirth. (2018) 18:360. doi: 10.1186/s12884-018-2002-z
22. Shah D and Nagarajan N. Luteal insufficiency in first trimester. Indian J Endocrinol Metab. (2013) 17:44–9. doi: 10.4103/2230-8210.107834
23. Tuckey RC. Progesterone synthesis by the human placenta. Placenta. (2005) 26:273–81. doi: 10.1016/j.placenta.2004.06.012
24. Bobdiwala S, Kyriacou C, Christodoulou E, Farren J, Mitchell-Jones N, Al-Memar M, et al. Evaluating cut-off levels for progesterone, β human chorionic gonadotropin and β human chorionic gonadotropin ratio to exclude pregnancy viability in women with a pregnancy of unknown location: A prospective multicenter cohort study. Acta obstetricia gynecologica Scandinavica. (2022) 101:46–55. doi: 10.1111/aogs.14295
25. Hanita O and Hanisah AH. Potential use of single measurement of serum progesterone in detecting early pregnancy failure. Malaysian J pathology. (2012) 34:41–6. doi: 10.1002/jcla.23559
26. Li H, Qin S, Xiao F, Li Y, Gao Y, Zhang J, et al. Predicting first-trimester outcome of embryos with cardiac activity in women with recurrent spontaneous abortion. J Int Med Res. (2020) 48:300060520911829. doi: 10.1177/0300060520911829
27. Puget C, Joueidi Y, Bauville E, Laviolle B, Bendavid C, Lavoué V, et al. Serial hCG and progesterone levels to predict early pregnancy outcomes in pregnancies of uncertain viability: A prospective study. Eur J obstetrics gynecology Reprod Biol. (2018) 220:100–5. doi: 10.1016/j.ejogrb.2017.11.020
28. Sakar MN, Balsak D, Demir SS, Budak MŞ, Tahaoglu AE, Gungor SE, et al. The ability of a single serum progesterone measurement to predict the prognosis of first trimester pregnancy. Gynecology Obstetrics Reprod Med. (2020) 26:1–5. doi: 10.21613/GORM.2019.942
29. Deng W, Sun R, Du J, Wu X, Ma L, Wang M, et al. Prediction of miscarriage in first trimester by serum estradiol, progesterone and β-human chorionic gonadotropin within 9 weeks of gestation. BMC Pregnancy Childbirth. (2022) 22:112. doi: 10.1186/s12884-021-04158-w
30. Verhaegen J, Gallos ID, van Mello NM, Abdel-Aziz M, Takwoingi Y, Harb H, et al. Accuracy of single progesterone test to predict early pregnancy outcome in women with pain or bleeding: meta-analysis of cohort studies. BMJ (Clinical Res ed). (2012) 345:e6077. doi: 10.1136/bmj.e6077
31. Li Y, Zhang J, Zhang K, Wang E, and Shu J. Significance of dynamically monitoring serum estrogen and β-human chorionic gonadotropin in early pregnancy assessment. J Clin Lab analysis. (2021) 35:e23559. doi: 10.1002/jcla.23559
32. Mu F, Wang C, Li X, and Wang F. The relationship between the average decreased times of estradiol and early miscarriage: an observational study. Reprod Sci (Thousand Oaks Calif). (2025) 32:358–65. doi: 10.1186/s12884-021-04158-w
33. Su R, Wang Y, Lu Y, Lin B, and An J. Weekly changes in serum β-human chorionic gonadotropin, estradiol, and progesterone levels for pregnancy assessment in women with unexplained recurrent miscarriage. J Int Med Res. (2025) 53:3000605251327478. doi: 10.1177/03000605251327478
34. Bucuri CE, Ciortea R, Malutan AM, Berceanu C, Rada MP, and Mihu D. Progesterone’s serum level and a new ultrasonographic parameter in the first trimester pregnancy - prognostic factors for embryonic demise. Rev Bras ginecologia e obstetricia: Rev da Federacao Bras das Sociedades Ginecologia e Obstetricia. (2019) 41:525–30. doi: 10.1515/hmbci-2015-0030
Keywords: pregnancy, progesterone, early pregnancy loss, progesterone decline threshold, risk assessment
Citation: Wei Y, Xin X, Mu F and Wang F (2025) Progesterone decline threshold in predicting early pregnancy loss: a retrospective study. Front. Endocrinol. 16:1611257. doi: 10.3389/fendo.2025.1611257
Received: 14 April 2025; Accepted: 19 August 2025;
Published: 09 September 2025.
Edited by:
Leonardo Ermini, University of Siena, ItalyReviewed by:
Luiz Vinicius De Alcantara Sousa, Faculdade de Medicina do ABC, BrazilAlaa Ismail, Women’s Health Hospital;Ass, Egypt
Copyright © 2025 Wei, Xin, Mu and Wang. This is an open-access article distributed under the terms of the Creative Commons Attribution License (CC BY). The use, distribution or reproduction in other forums is permitted, provided the original author(s) and the copyright owner(s) are credited and that the original publication in this journal is cited, in accordance with accepted academic practice. No use, distribution or reproduction is permitted which does not comply with these terms.
*Correspondence: Fang Wang, ZXJ5X2Z3YW5nQGx6dS5lZHUuY24=