 Yu Gong
 Guojuan Wang
 Qianqian Zhang1
 Xu Jiang
 Ying Li
- 1Department of Endocrinology and Metabolism, the Third Affiliated Hospital of Anhui Medical University (The First People’s Hospital of Hefei), Hefei, Anhui, China
- 2Graduate School, Bengbu Medical University, Bengbu, Anhui, China
Background: We aimed to investigate the correlation between central thyroid hormone sensitivity and Hypertriglyceridemia (HTG) in euthyroid population.
Methods: A total of 833 individuals who underwent physical examinations were randomly selected. Biochemical parameters including thyroid hormones (THs), liver and kidney functions, blood glucose, and blood lipids were measured. Central TH sensitivity was evaluated using the thyroid feedback quantile-based index (TFQI), thyroid-stimulating hormone index (TSHI) and thyrotropin thyroxine resistance index (TT4RI). We analyzed the relationship between central TH sensitivity and triglyceride (TG) level using smooth curve fitting and threshold effect analysis and trend tests in multiple regression equations.
Results: TSHI (β=0.158, P=0.0443) was positively correlated with TG, while TT4RI (β=0.018, P=0.0112, inflection point: 25.809) and TFQI (β=0.798, P=0.0066, inflection point: -0.194) were both positively correlated with TG before the inflection points. Subgroup analyses revealed these relationships were particularly pronounced in females (TT4RI β=0.026, P=0.0205, inflection point: 22.487; TFQI β=0.780, P=0.0133, inflection point: -0.142), males (TFQI β=1.954, P=0.0100, inflection point: -0.395), individuals with age <65 years (TT4RI β=0.019, P=0.0119, inflection point: 25.809; TFQI β=0.878, P=0.0060, inflection point: -0.206), and individuals with BMI<28kg/m² (TT4RI β=0.026, P=0.0090, inflection point: 21.515; TFQI β=0.735, P=0.0132, inflection point: -0.173), all showing positive correlations before the point correlations. Tests for trend in multiple regression equations showed that with the increased quartiles of TT4RI (OR=1.321, P=0.00118) and TSHI (OR=1.253, P=0.00784), the risk of HTG increased correspondingly. For per SD increase in TT4RI, the odds of HTG increased by 36.5% (OR=1.365, P=0.00703). For per SD increase in TSHI, the odds of HTG increased by 19.1% (OR=1.191, P=0.06648).
Conclusion: Impaired central thyroid hormone sensitivity is associated with increased triglyceride in euthyroid population, this association is more pronounced in individuals with aged<65 years and BMI<28kg/m2. Impaired central thyroid hormone sensitivity may be an independent risk factor for hypertriglyceridemia.
Introduction
Dyslipidemia is a chronic disease with significant public health implications. According to WHO estimates, the global prevalence of elevated total cholesterol among adults aged ≥25 years was 39% in 2008 (1). The overall pooled prevalence of dyslipidemia in Chinese adults has reached 41.9% (2). Most dyslipidemia guidelines focused on low-density lipoprotein cholesterol (LDL-C), whereas triglycerides (TGs) have received comparatively less attention. With an estimated prevalence of 10% (3), Hypertriglyceridemia (HTG) significantly elevated the risk of atherosclerotic cardiovascular disease (ASCVD) through triglyceride-rich lipoproteins (TRLs) and their remnants (4). Furthermore, severe HTG independently increased pancreatitis risk (4).
Despite these clinical consequences, significant gaps persisted in identifying specific risk factors and high-risk individuals for HTG. Current risk assessment strategies failed to address the distinct molecular pathophysiology of HTG. It has been established that endocrine hormones, such as thyroid hormones (THs), have emerged as key modulators of lipid metabolism (5).
THs critically regulate the synthesis, mobilization, and degradation of lipid primarily via thyroid receptor β (TRβ), modulating sterol regulatory element-binding proteins (SREBPs) and peroxisome proliferator-activated receptor gamma coactivator 1-alpha (PGC-1α) pathways (6). A large body of evidence has revealed that fluctuations in either high or low levels of thyroid hormones could lead to dyslipidemia. In hypothyroidism, the levels of total cholesterol (TC), low-density lipoprotein cholesterol (LDL-C) and TG were increased, while the levels of high-density lipoprotein cholesterol (HDL-C) were decreased. In contrast, opposite changes in lipid profile were found in hyperthyroidism (7, 8). When thyroid stimulating hormone (TSH) was in the normal range, THs were positively correlated with the levels of TC, TG and LDL-C, but negatively correlated with the levels of HDL (9, 10). These findings highlighted the important role of THs on lipid regulation. Considering the complexity of hormone interactions between hypothalamic-pituitary-thyroid axis (HPA) and the specific metabolic behavior of thyroid hormones, thyroid function could not be comprehensively evaluated by a single serological index. However, thyroid hormone sensitivity index provided a new dimension for clinical research. Spanish researcher Laclaustra et al. proposed the thyroid feedback quantile-based index (TFQI), which reflected the sensitivity of central nervous system to THs (11). It was used to evaluate the response of pituitary to THs. The central thyroid hormone sensitivity indexes also included thyrotropin thyroxine resistance index (TT4RI) and thyroid-stimulating hormone index (TSHI) (12). This positions central TH sensitivity as a potential modulator of TG metabolism beyond classical pathways—a gap not addressed in prior epidemiological studies.
To our knowledge, one prior study has preliminarily explored the association between TFQI and TG in patients with nonalcoholic fatty liver disease (NAFLD) (13), but no research has comprehensively examined the relationship between central TH sensitivity and HTG risk in general euthyroid population. The purpose of our study was to investigate the association between central thyroid hormone sensitivity and HTG in euthyroid population, which may provide new ideas for early prevention for HTG in our clinic work.
Materials and methods
Participants
We selected 1334 participants who underwent physical examinations in the physical examination center of the First People’s Hospital of Hefei from January 2024 to June 2024. According to the exclusion criteria and inclusion criteria, 833 individuals with normal thyroid functions were finally screened (Figure 1). There were 166 cases (115 males and 51 females, mean age: 46.36 ± 10.45 years) in TG≥2.3mmol/L group and 667 cases (331 males and 336 females, mean age: 47.66 ± 12.29 years) in TG<2.3mmol/L group.
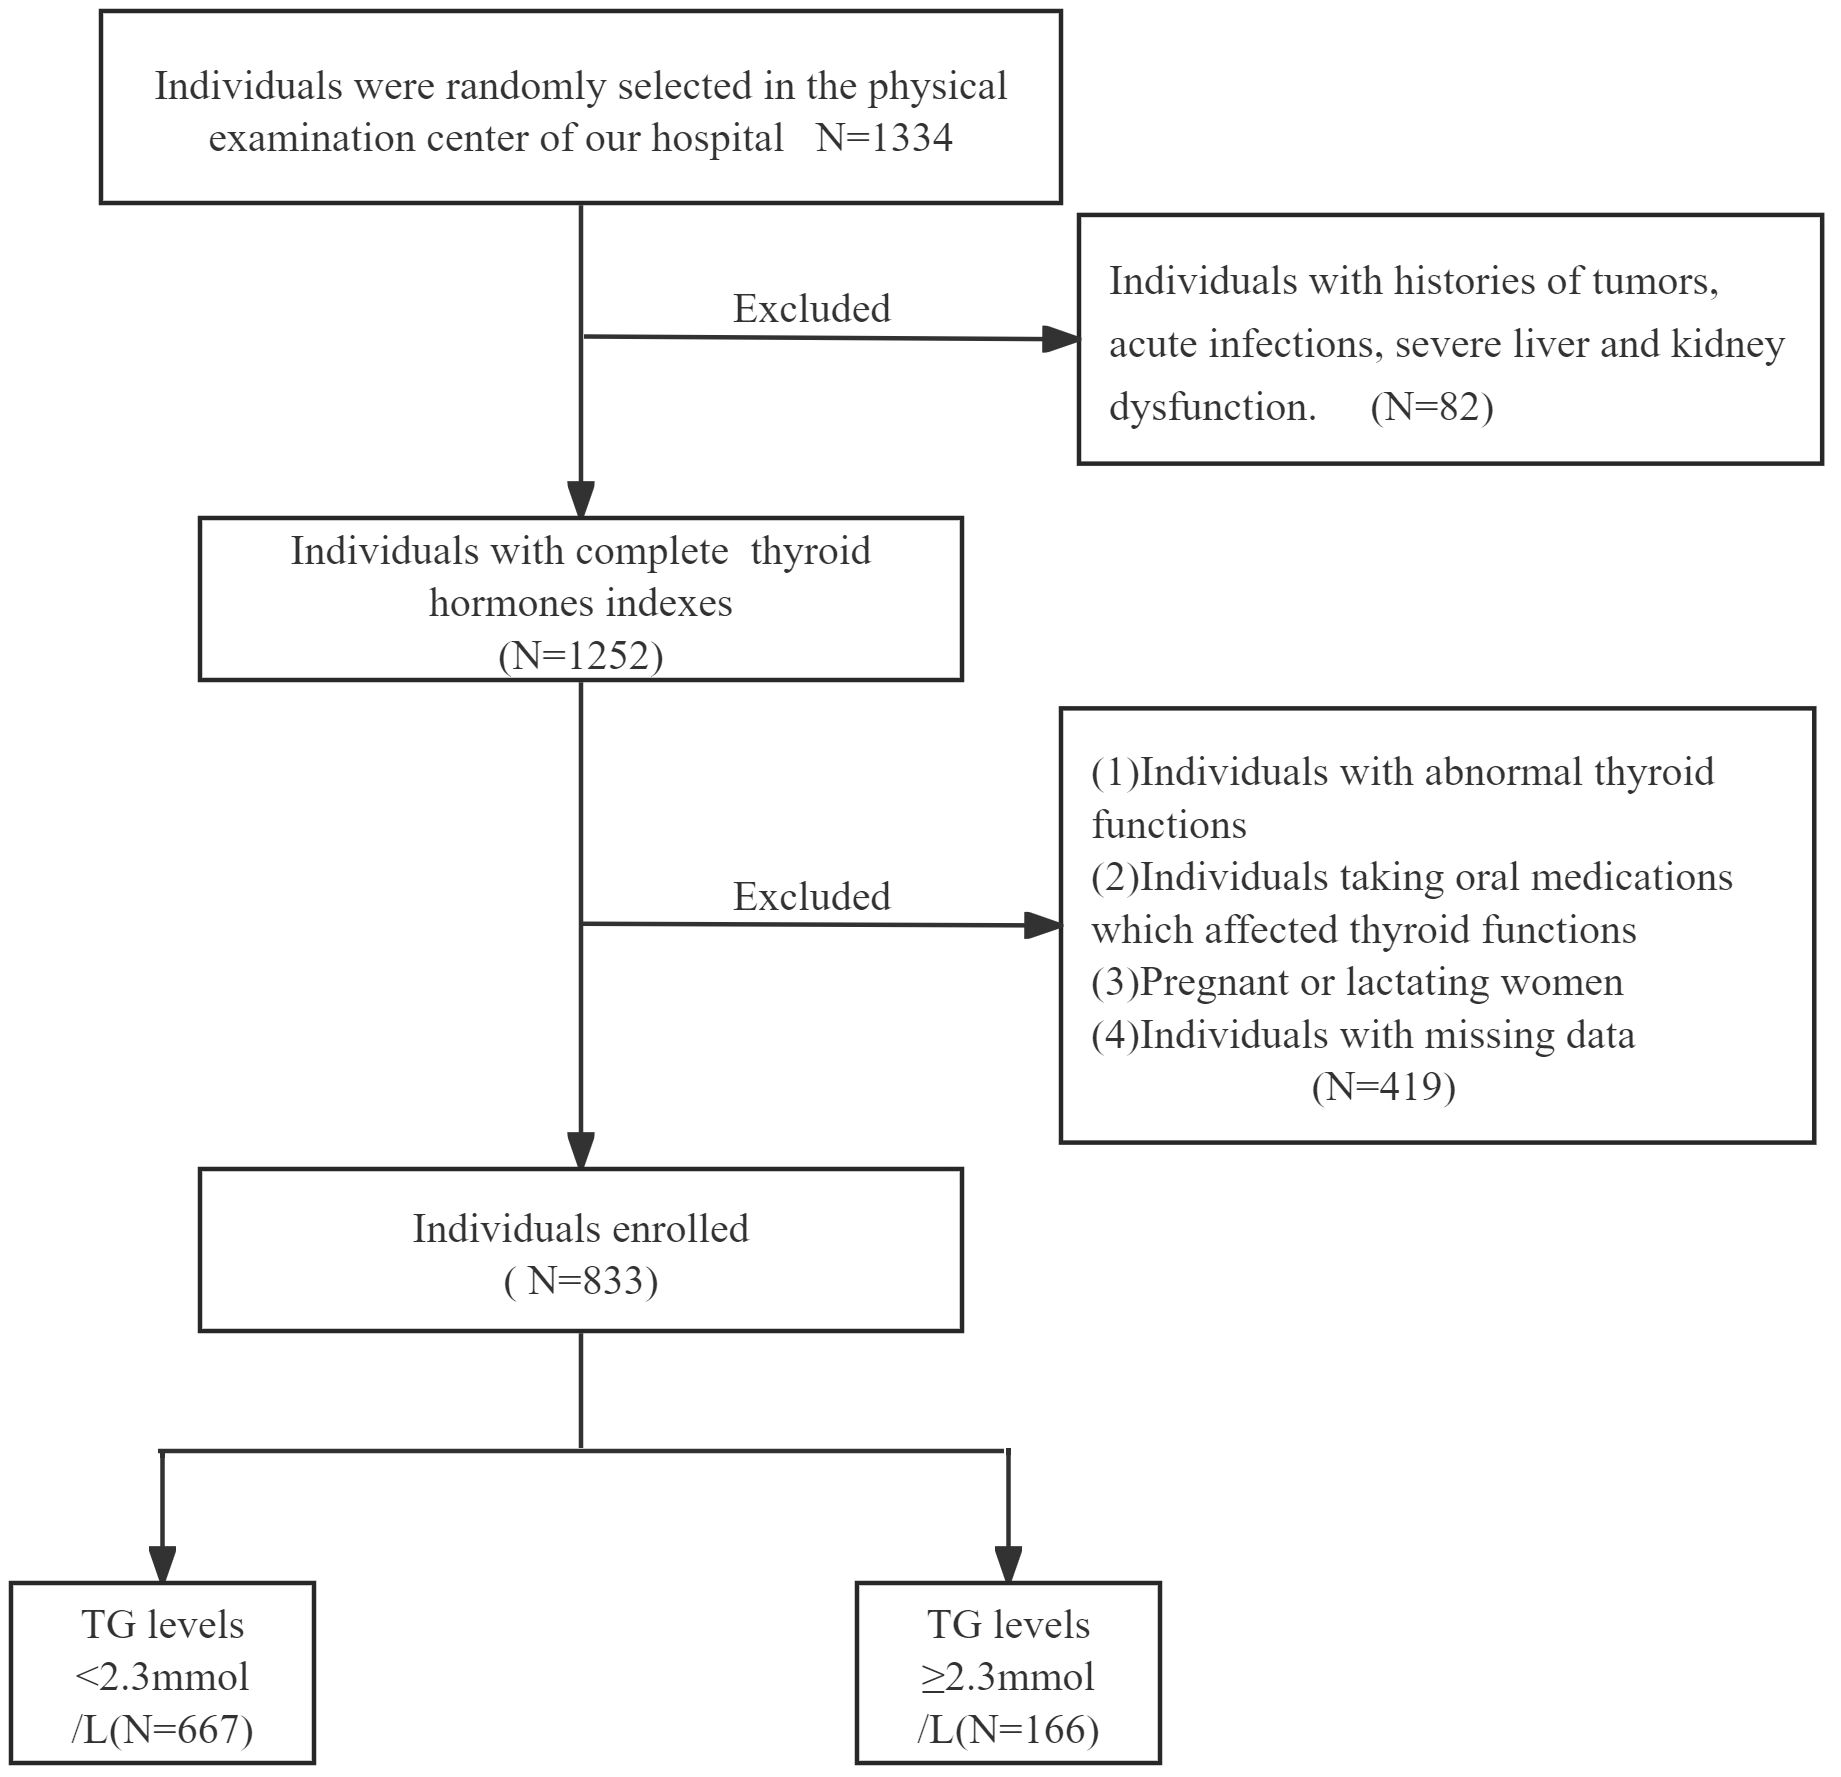
Figure 1. The flow chart of the study population.
Inclusion criteria: age between 18 and 90 years old (including 18 and 90 years old).
Exclusion criteria: (1) Individuals with histories of tumors, acute infections, severe liver and kidney dysfunction. (2) Individuals with abnormal thyroid functions, histories of thyroid diseases, including hyperthyroidism, hypothyroidism and hashimoto’s thyroiditis. (3) Individuals taking oral medications which affected thyroid functions, such as corticosteroids or thyroid hormones. (4) Pregnant or lactating women. (5) Individuals with missing data.
Physical examination and laboratory measurements
The basic clinical information of all the individuals was collected: name, gender, age, chronic medical histories of diabetes mellitus (DM), hypertension, hyperlipidemia, drug use and surgery. Height, weight, systolic blood pressure (SBP) and diastolic blood pressure (DBP) were measured in the state of fasting in the morning. The levels of fasting blood-glucose (FBG), TG, TC, HDL-C, LDL-C, alanine transaminase (ALT), aspartic transaminase (AST), gamma-glutamyl transferase (GGT), total bilirubin (TBIL), direct bilirubin (DBIL), indirect bilirubin (IBIL), albumin (ALB), serum creatinine (SCr), serum uric acid (SUA), estimated glomerular filtration rate(eGFR), hemoglobin (Hb), blood platelets (Plt) were all measured by well-trained technicians (Roche automatic biochemical analyzer. Combas 8000). Thyrotropic hormone (TSH), free triiodothyronine (FT3) and free thyroxine (FT4) were determined using standardized Chemiluminescence methods (Abbott 12000SR). The normal ranges of THs: TSH (0.350-4.949μIU/mL) and FT4 (9.03-19.04pmol/L) and FT3 (2.43-6.01pmol/L). All measurements were performed using the same assays.
Hypertension was defined as SBP≥140mmHg or DBP≥90mmHg or self-reported histories (14). Diabetes was defined as FBG≥7.0mmol/L or self-reported history (15). HTG was defined as ≥2.3mmol/L (16).
Central TH sensitivity indices were calculated as follows: TT4RI = FT4 (pmol/L) × TSH (mIU/L) (17); TSHI = lnTSH (mIU/L) + 0.1345 × FT4 (pmol/L) (18); TFQI = cdfFT4 − (1 − cdfTSH): The index varies within the range of -1 to 1, with a negative value suggesting increased central TH sensitivity and a positive value suggesting decreased central thyroid hormone sensitivity.
Statistical analysis
Sample size was calculated using G*Power 3.1 (19) to detect a clinically significant difference in TT4RI between TG<2.3mmol/L group and TG≥2.3mmol/L groups. Based on preliminary data (TG<2.3mmol/L group mean = 22.99, TG≥2.3mmol/L group mean = 27.24, pooled SD = 12.37; Cohen’s d = 0.34) with α = 0.05 (two-tailed), 90% power, and 1:4 case-control ratio, 166 cases of TG≥2.3mmol/L group and 667 cases of TG<2.3mmol/L group were required. This design provided >99% power to detect associations (OR ≥1.3) while maintaining EPV >15 for robust adjustment of 10 covariates. We used IBM SPSS Statistics Software Version 27, GraphPad Prism 10.0.3, Empower(R) (www.empowerstats.com, X&Y Solutions, Inc.) (Boston, MA), and R (http://www.r-project.org) to complete the statistical analyses. A significance level of P<0.05 was considered statistically significant. The normality of the data was assessed using the Shapiro-Wilk test and Q-Q plot. Normally distributed variables were presented as mean ± standard deviation (SD), while skewed variables were expressed as median (25th percentile, 75th percentile). Independent sample T-test was used to analyze the differences of central TH sensitivity indexes between TG<2.3mmol/L group and TG≥2.3mmol/L group. Smoothing function and threshold effect analysis were performed to determine the correlations of TFQI, TT4RI, TSHI and TG. Log-likelihood ratio tests for single-line linear regression model and two-segment linear regression model were conducted. Multiple regression equations were further tested for P-trend. All tests were two-way tests, and the statistical significance level was α=0.05. P<0.05 was considered statistically significant.
Results
The baseline clinical characteristics of all the individuals in this study
Compared with TG<2.3mmol/L group, TG≥2.3mmol/L group showed higher proportion of women, younger ages and higher levels of BMI. The levels of FBG, ALB, ALT, AST, GGT, SUA, SCr and TC were significantly elevated. In terms of thyroid function, compared with TG<2.3mmol/L group, the levels of TSH, FT3, TT4RI, TSHI and TFQI were higher in TG≥2.3mmol/L group. There was no significant difference in FT4 level between two groups (P>0.05) (Table 1, Figure 2).
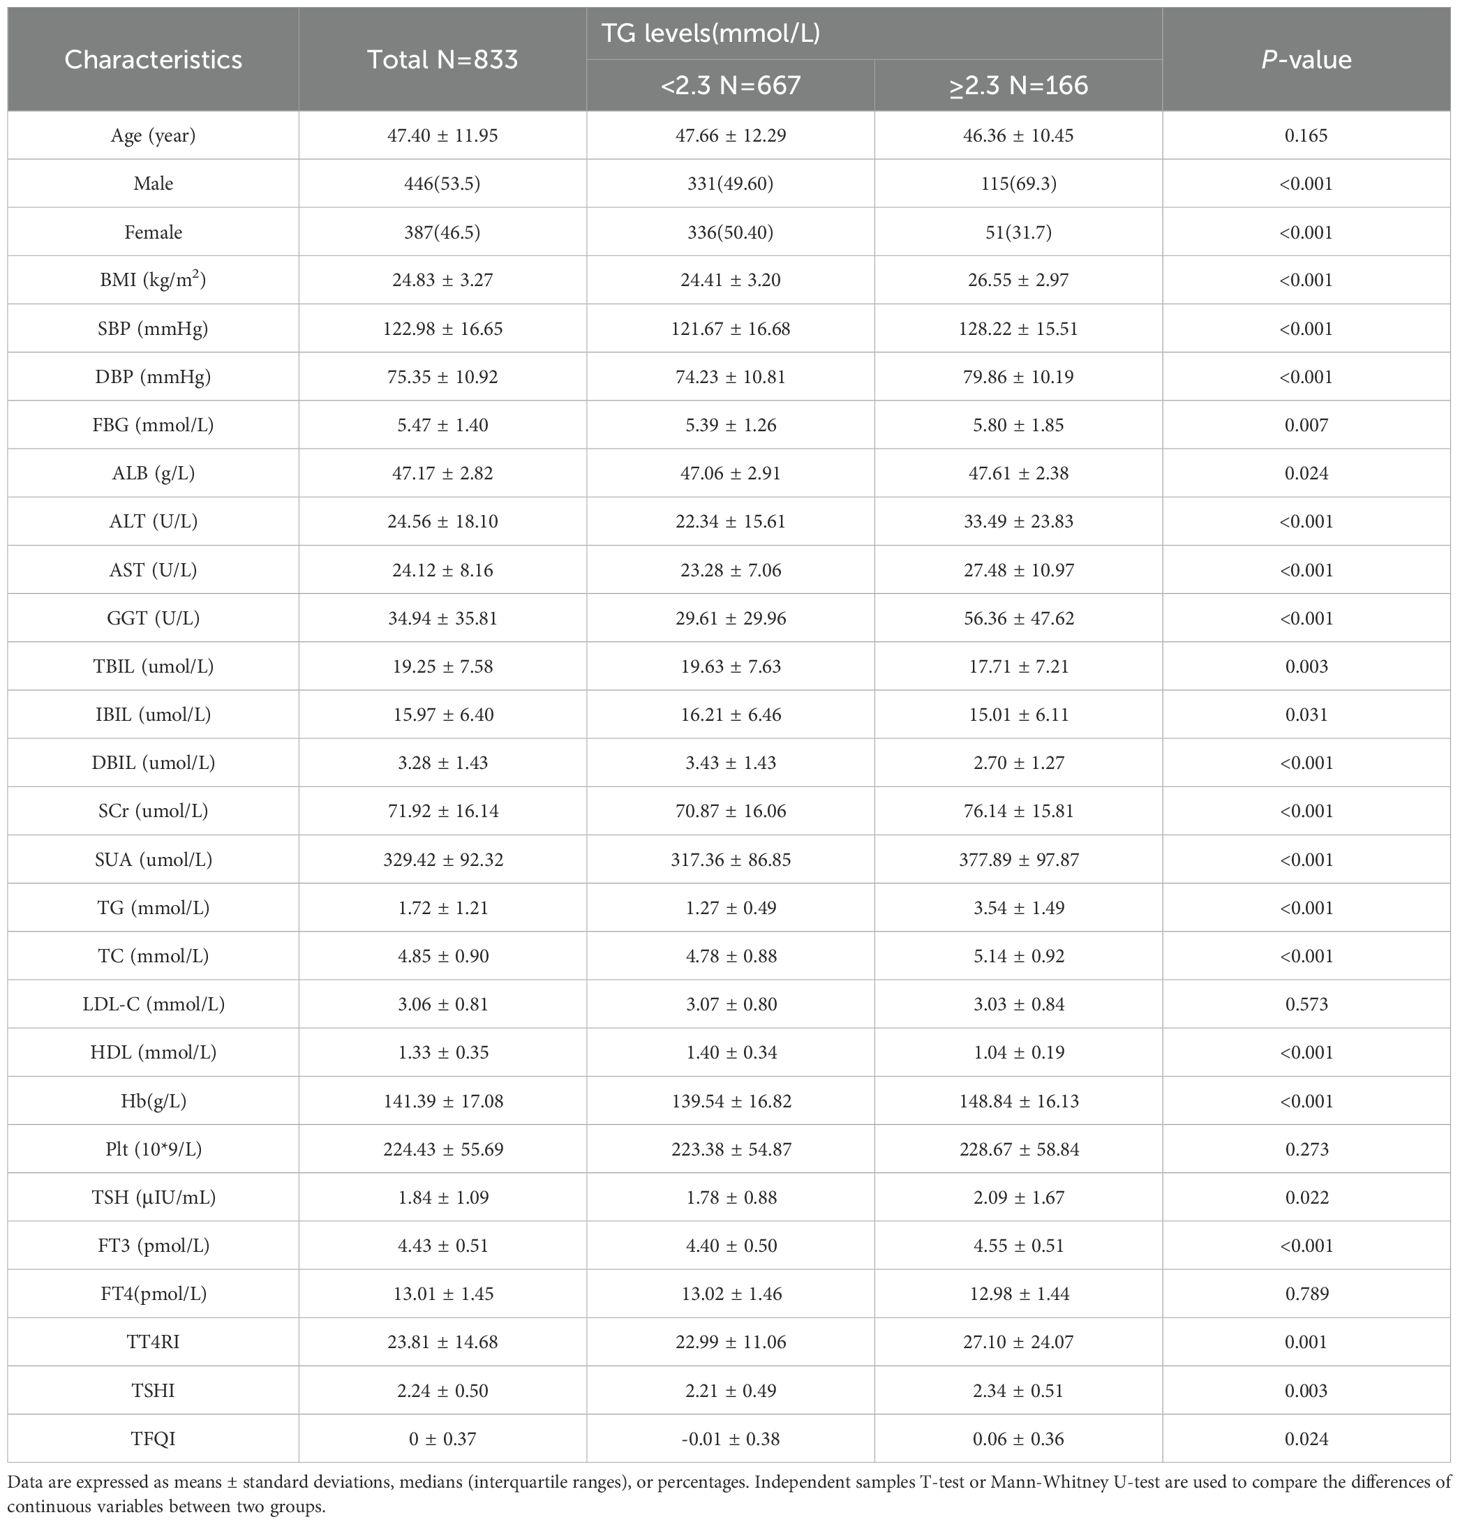
Table 1. Baseline characteristics of participants according to TG levels.
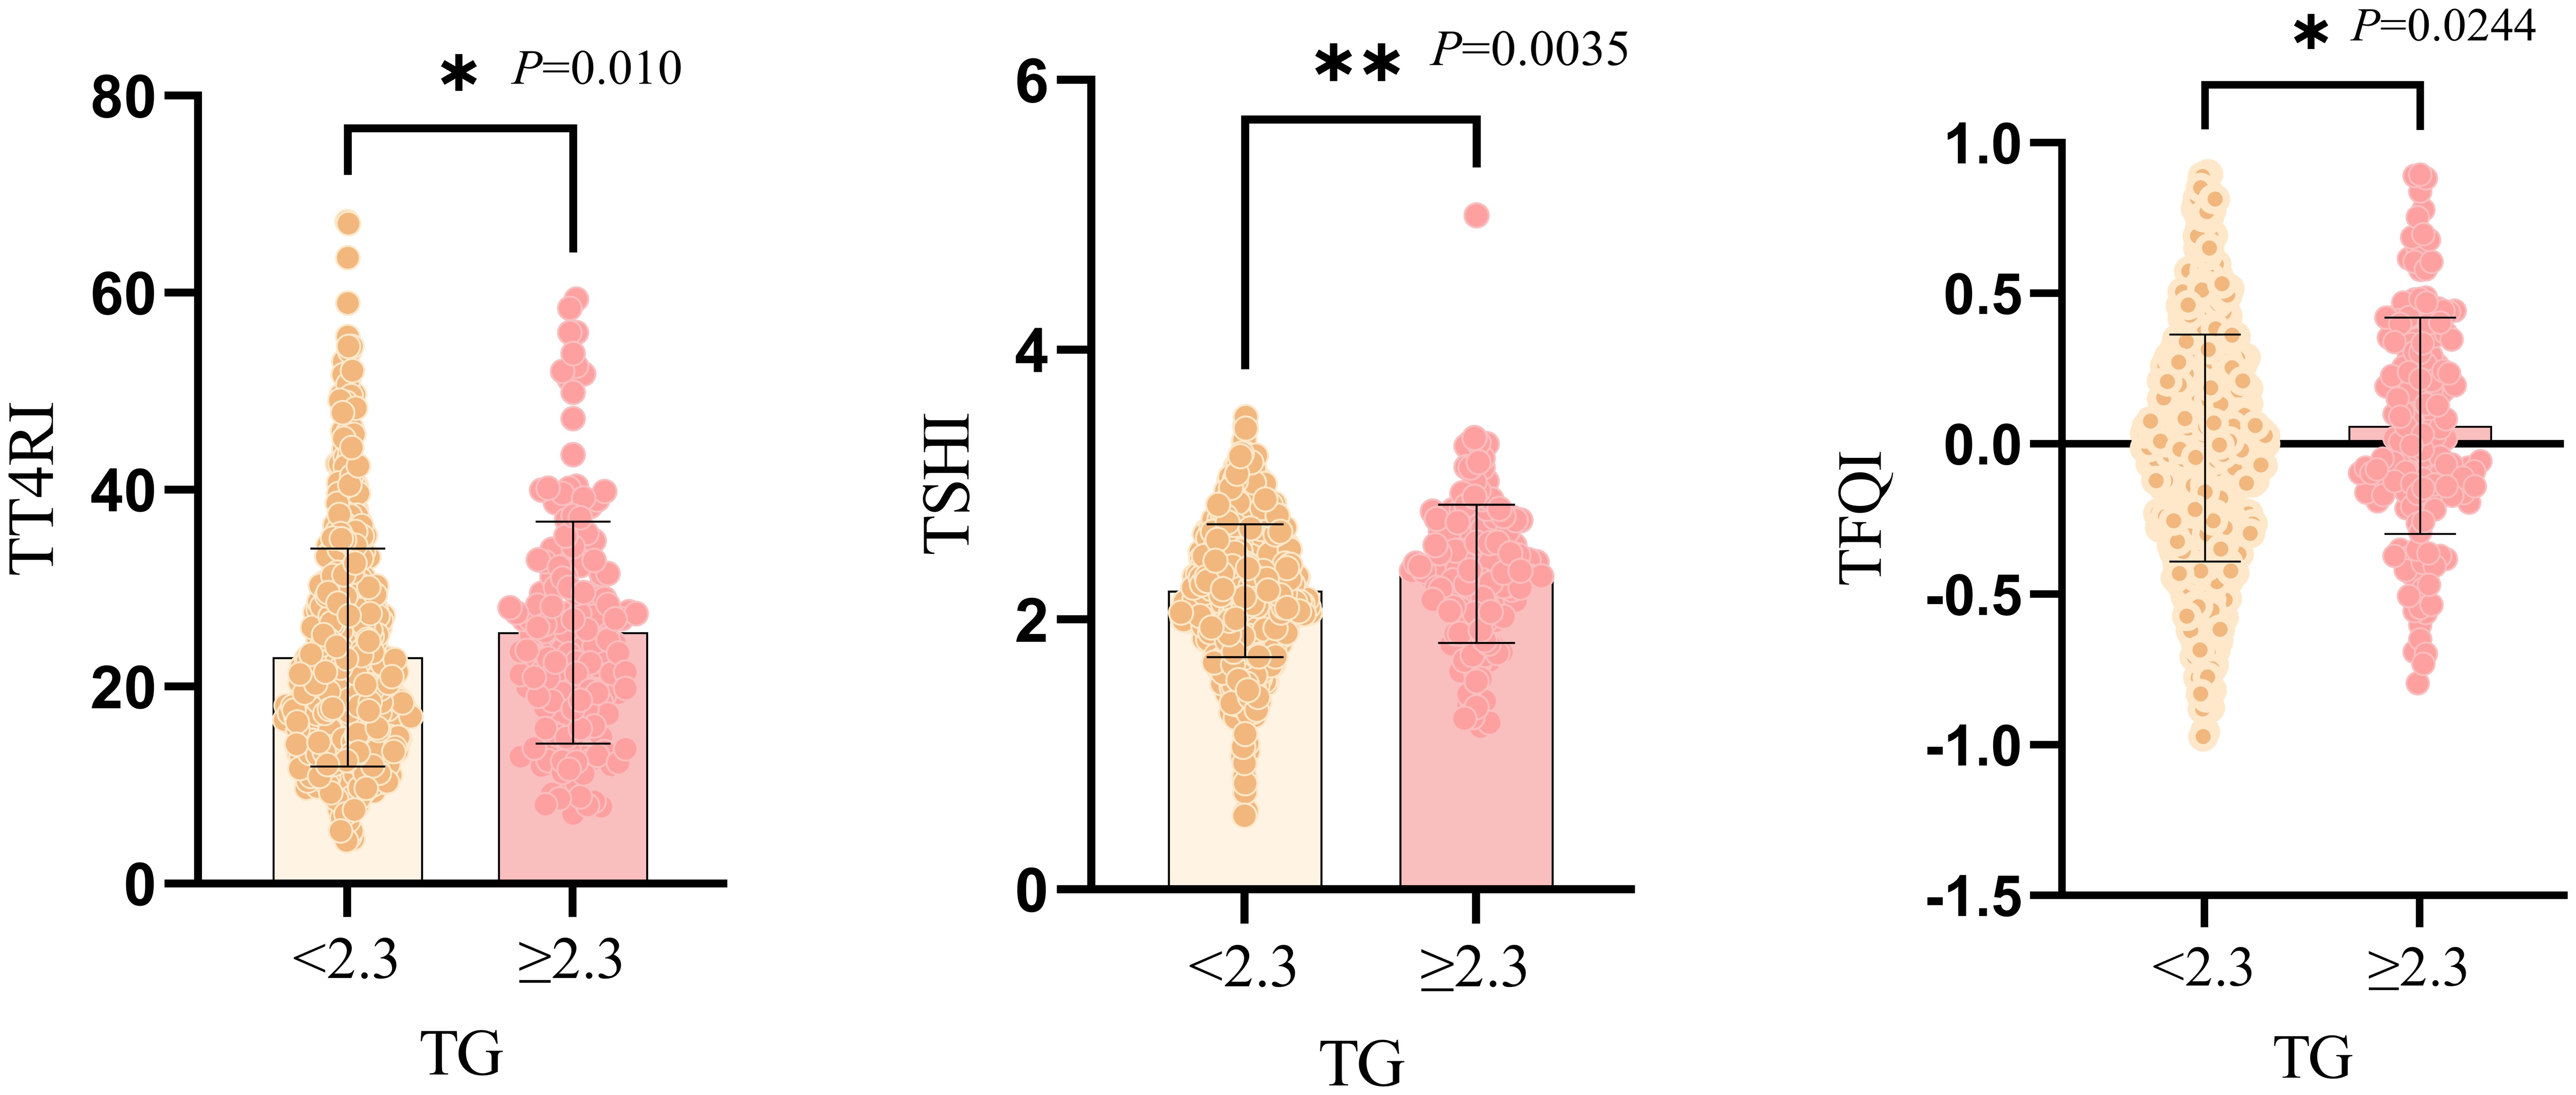
Figure 2. Graphical representation of independent samples T-test for comparison between two groups of TG subgroups. *:P<0.05; **:P<0.01.
Smoothing function and threshold effect analysis of the relationship between central TH sensitivity and TG
After adjusting the confounding factors of gender, age, BMI, FBG, ALT, AST, GGT, TBIL, SUA and SCr, TT4RI was curvilinearly correlated with TG. TT4RI was positively correlated with TG before the inflection point at 6.471, with a corresponding increase of 0.018 in TG for every 1-unit increase in TT4RI (β=0.018, P=0.0112), there was no correlation after the inflection point. TSHI was positively correlated with TG, with a corresponding increase of 0.158 in TG for every 1-unit increase in TSHI (β=0.158, P=0.0443). TFQI was positively correlated with TG before the inflection point at -0.194, with a corresponding increase of 0.798 in TG for every 1-unit increase in TT4RI (β=0.798, P=0.0066), there was no correlation after the inflection point (P=0.1955) (Table 2, Figure 3).
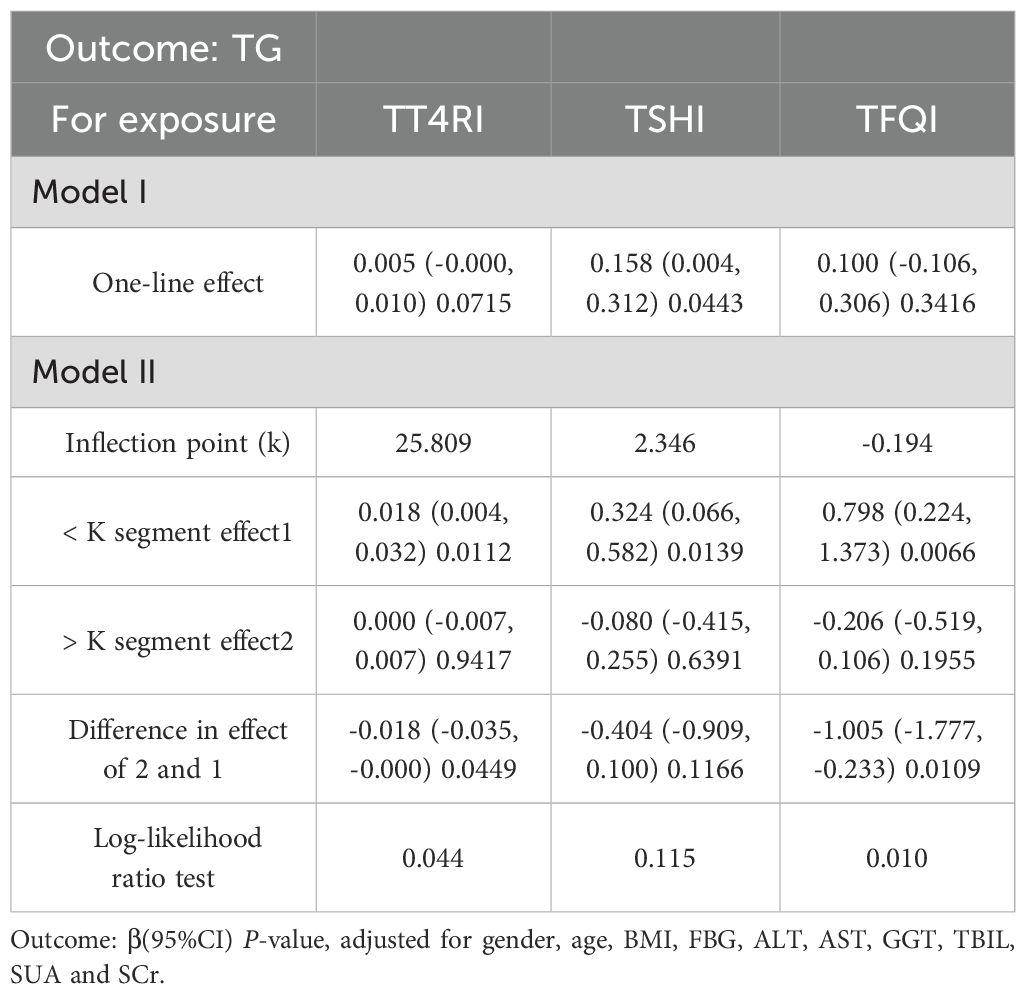
Table 2. Threshold effect analysis of the relationship between central thyroid hormone sensitivity and TG in overall population.
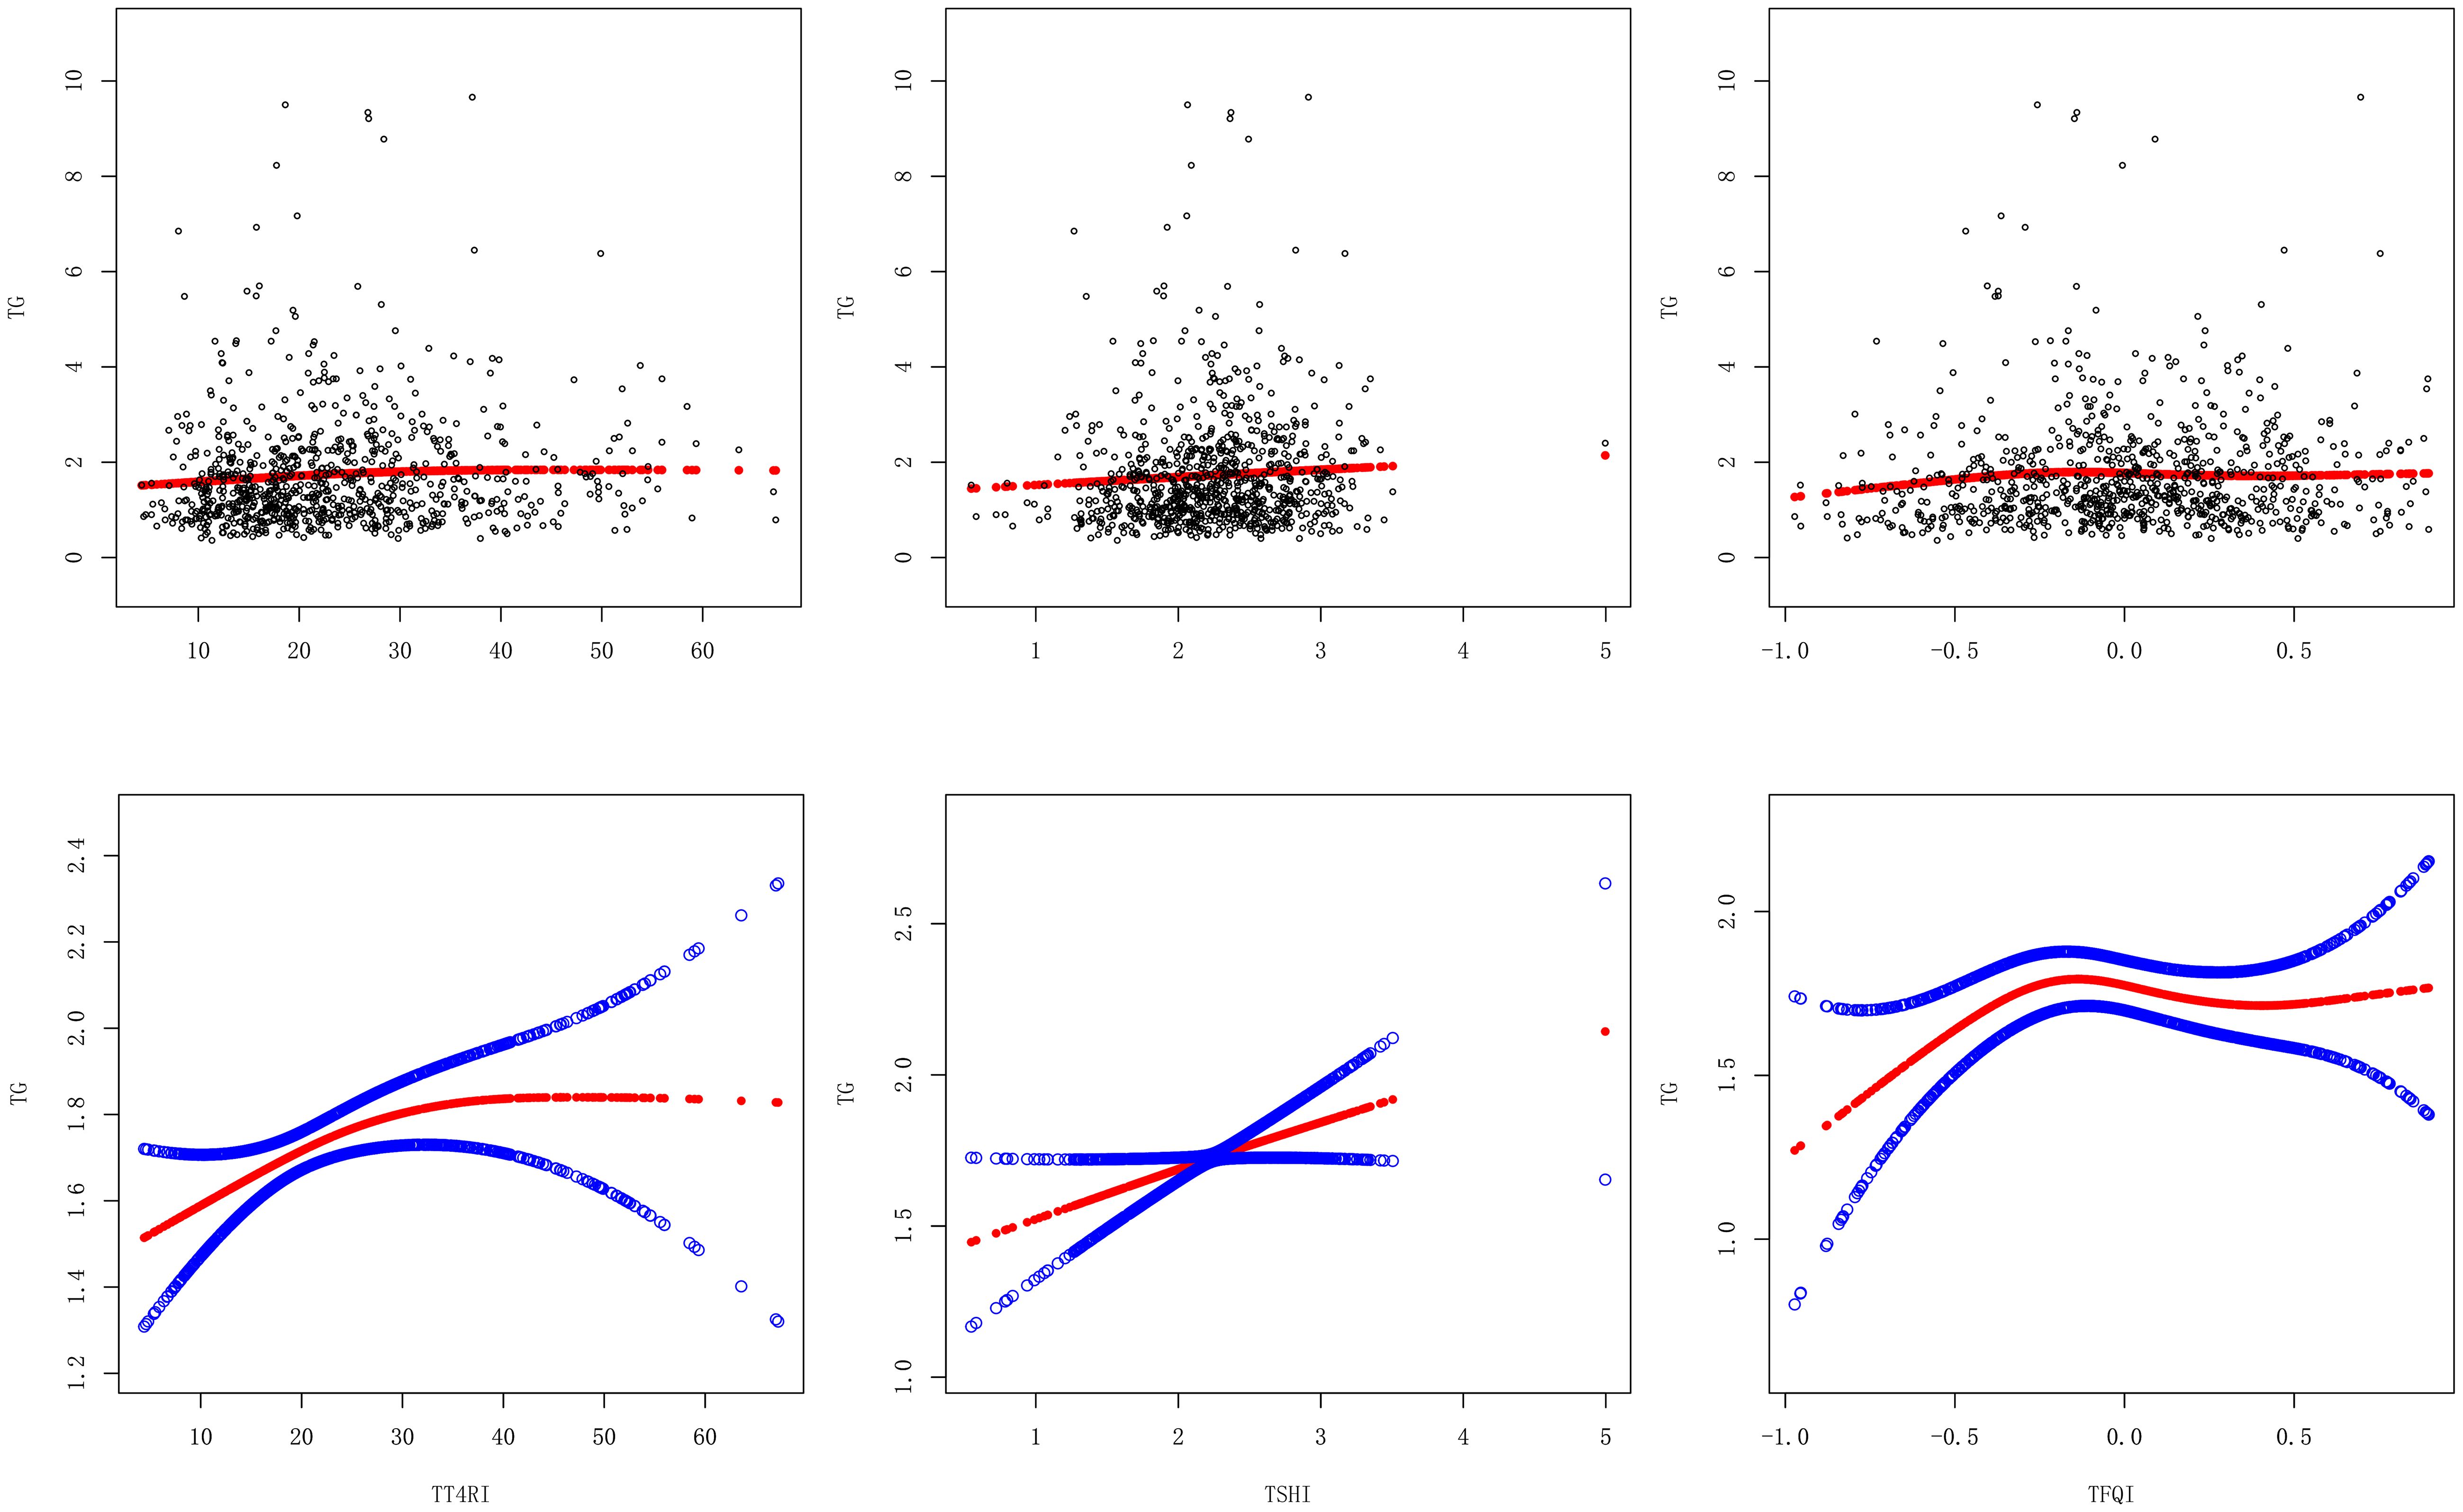
Figure 3. Smooth curve fitting diagram of central thyroid hormone sensitivity and TG.
Subgroup analysis of the correlation between central thyroid hormone sensitivity and TG
In female group, after adjusting the confounding factors including age, BMI, FBG, ALT, AST, GGT, TBIL, SUA and SCr, TT4RI was positively correlated with TG before the inflection point at 22.487, with a corresponding increase of 0.026 in TG for every 1-unit increase in TT4RI (β=0.026, P=0.0205), there was no correlation after the inflection point. TFQI was positively correlated with TG before the inflection point at -0.142, with a corresponding increase of 0.780 in TG for every 1-unit increase in TFQI (β=0.780, P=0.0133), there was no correlation after the inflection point. TSHI had no correlation with TG. In male group, TFQI was positively correlated with TG before the inflection point at -0.395, with a corresponding increase of 1.954 in TG for every 1-unit increase in TT4RI (β=1.954, P=0.0100), there was no correlation after the inflection point. There were no correlations between TT4RI, TSHI and TG.
We concluded that TT4RI and TFQI were positively correlated with TG in females, while TFQI was positively correlated with TG in males (Table 3, Figure 4).
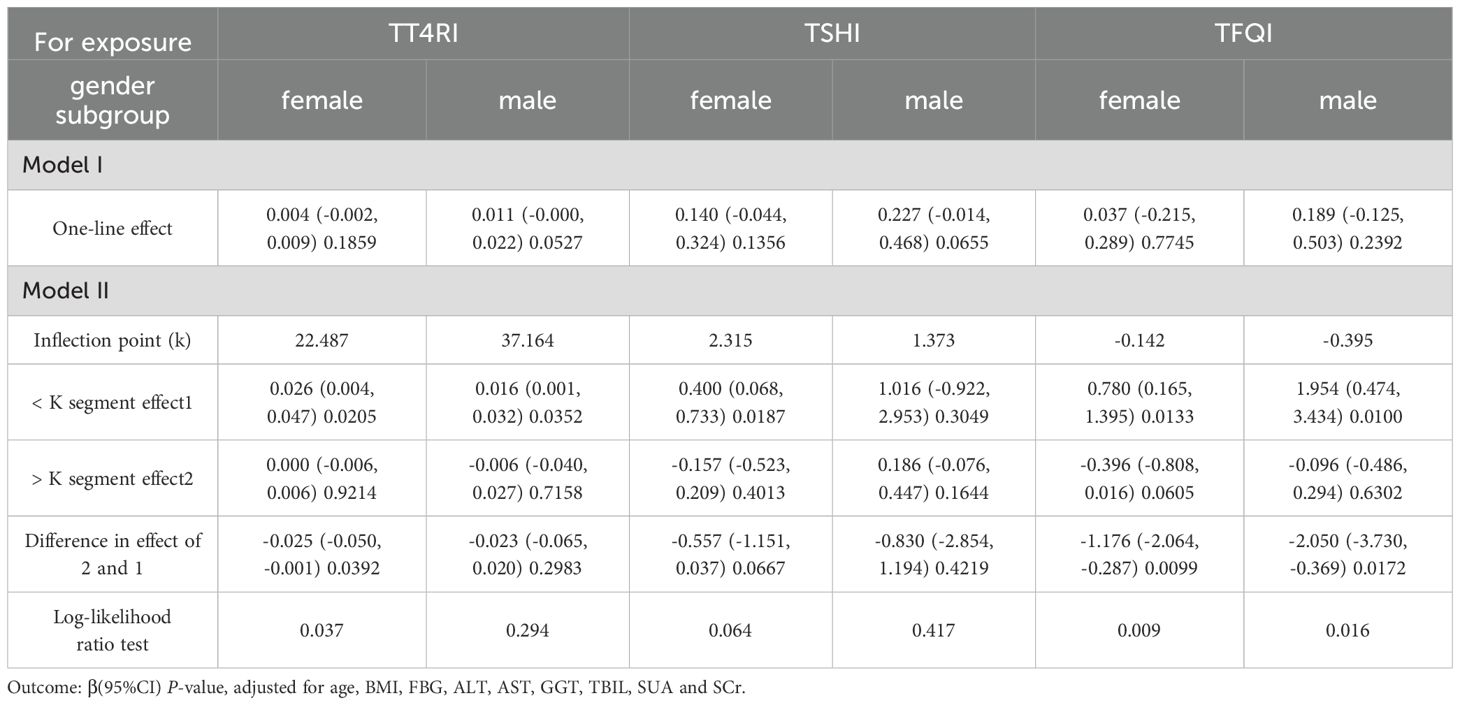
Table 3. Gender subgroup analysis of the correlation between central thyroid hormone sensitivity and TG.
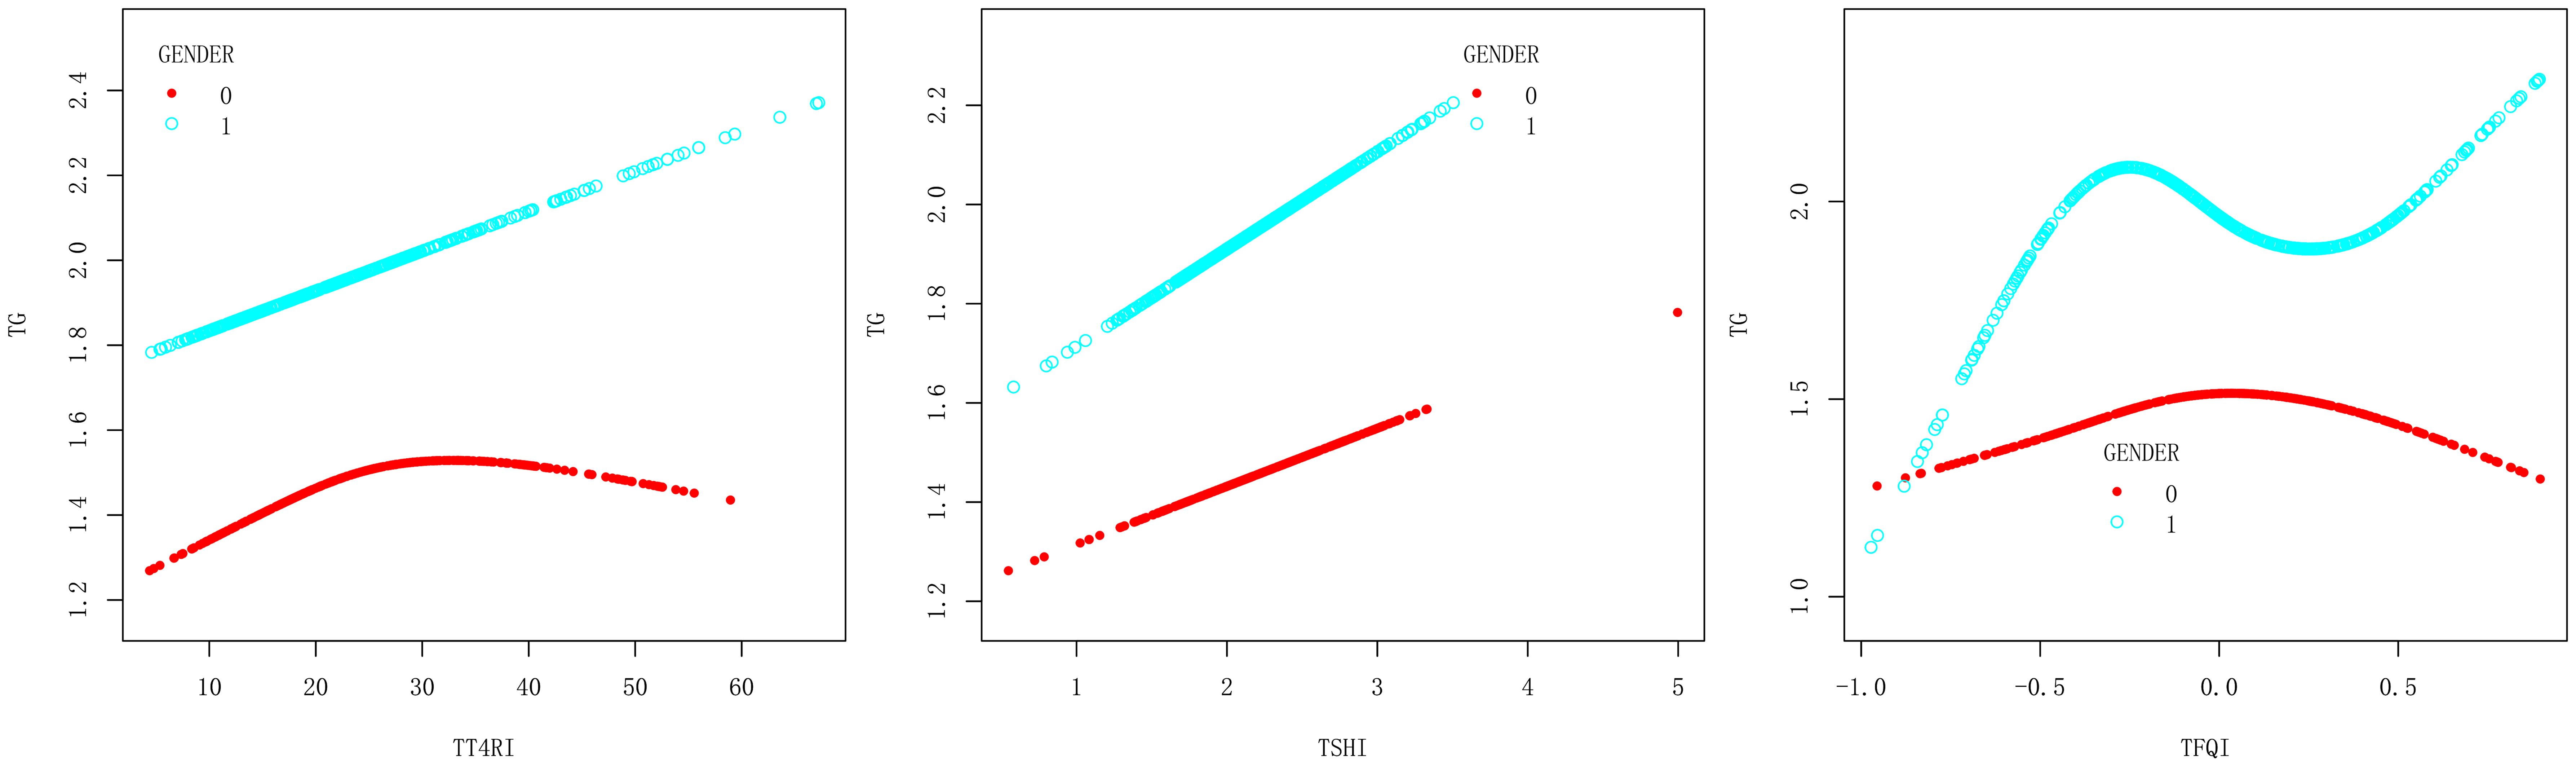
Figure 4. Smooth curve fitting diagram of TFQI, TT4RI, TSHI and TG were analyzed stratified by gender (0, female; 1, male).
In age<65 years group, after adjusting the confounding factors including gender, BMI, FBG, ALT, AST, GGT, TBIL, SUA and SCr, TT4RI was positively correlated with TG before the inflection point at 25.809, with a corresponding increase of 0.019 in TG for every 1-unit increase in TT4RI (β=0.019, P=0.0119), there was no correlation after the inflection point. TSHI was positively correlated with TG, with a corresponding increase of 0.177 in TG for every 1-unit increase in TSHI (β=0.177, P=0.0359). TFQI was positively correlated with TG before the inflection point at -0.206, with a corresponding increase of 0.878 in TG for every 1-unit increase in TFQI (β=0.878, P=0.0060), there was no correlation after the inflection point. In age≥65 years group, there were no correlations between TT4RI, TSHI, TFQI and TG.
We concluded that central TH sensitivity was positively associated with TG only in population with age<65 years (Table 4, Figure 5).
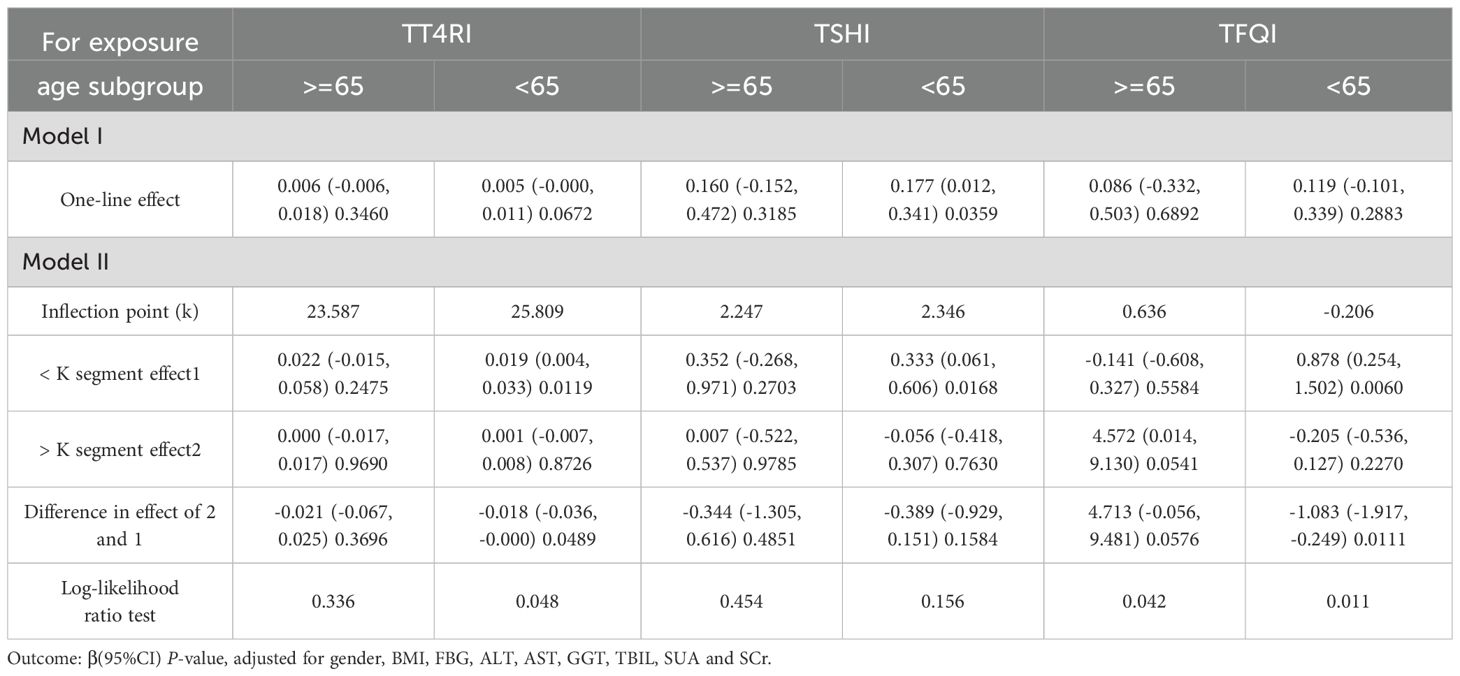
Table 4. Age subgroup analysis of the correlation between central thyroid hormone sensitivity and TG.
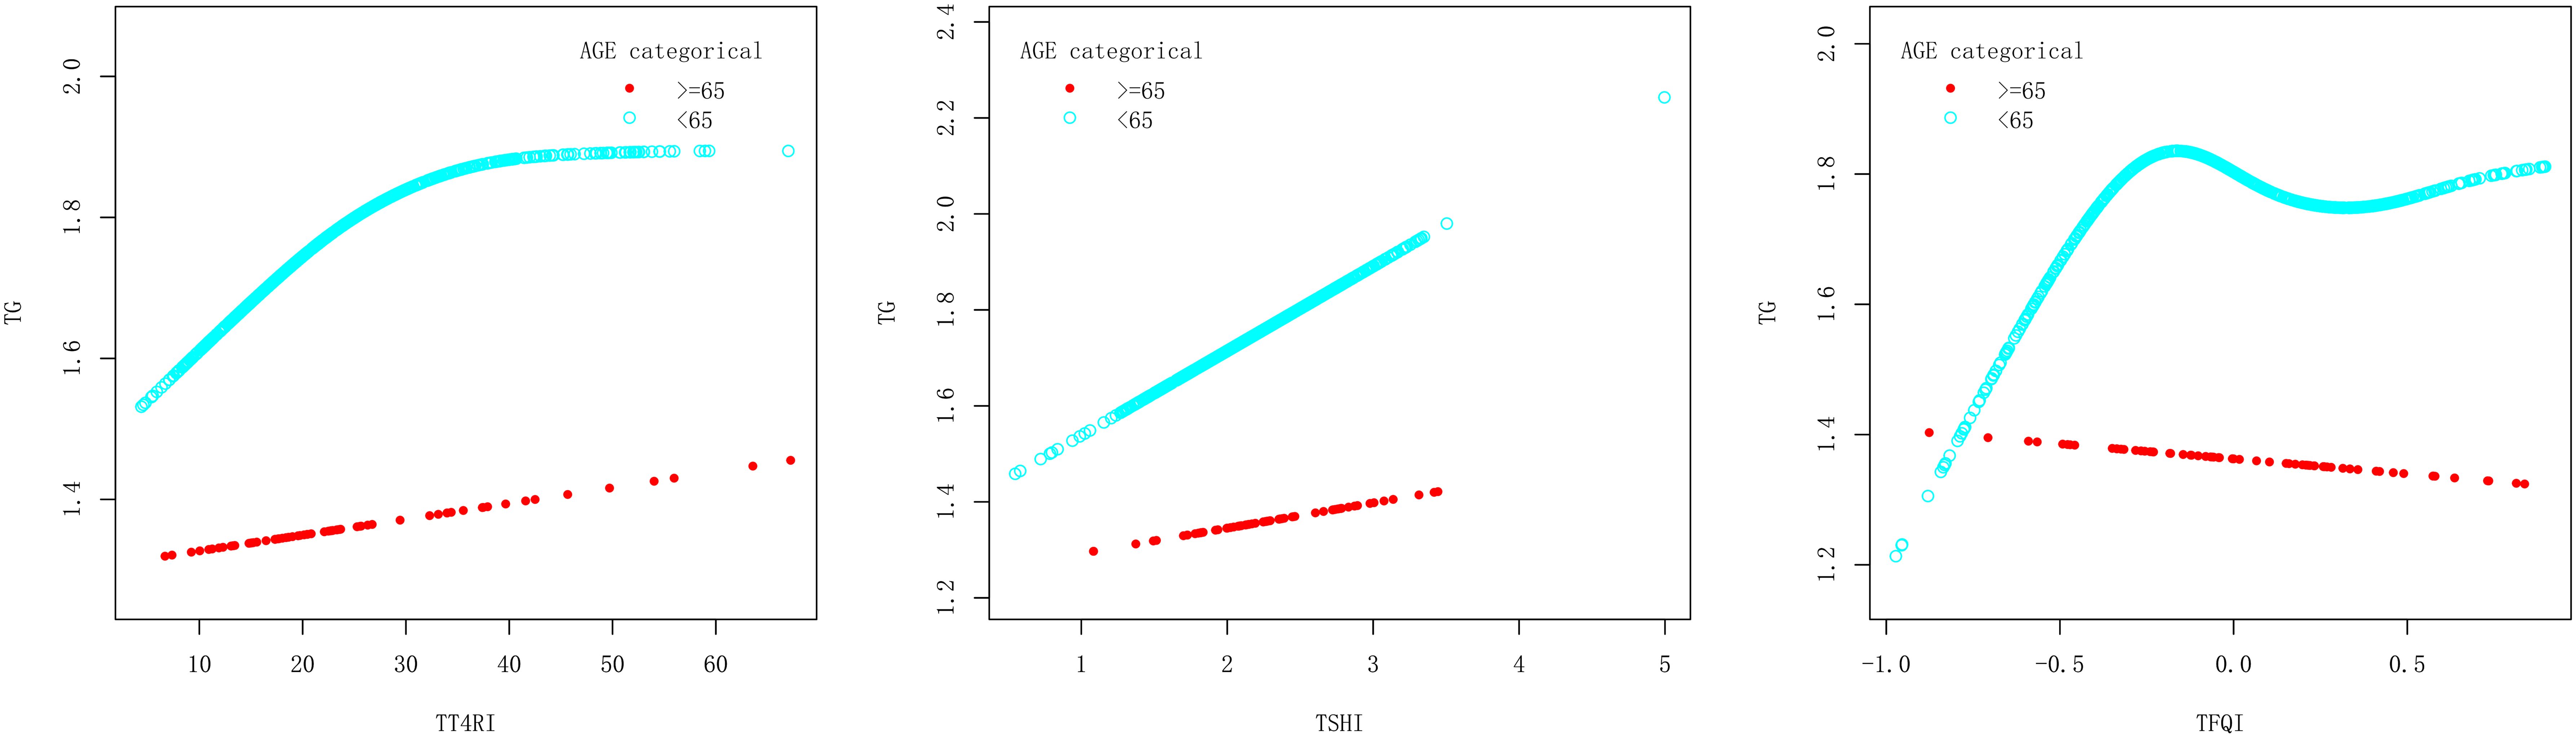
Figure 5. Smooth curve fitting diagram of TFQI, TT4RI, TSHI and TG were analyzed stratified by age.
In BMI<28kg/m2 group, after adjusting the confounding factors including gender, age, FBG, ALT, AST, GGT, TBIL, SUA and SCr, TT4RI was positively correlated with TG before the inflection point at 21.515, with a corresponding increase of 0.026 in TG for every 1-unit increase in TT4RI (β=0.026, P=0.0090), there was no correlation after the inflection point. TSHI was positively correlated with TG, for every 1-unit increase in TSHI, TG increased by 0.188 (β=0.188, P=0.0247). TFQI was positively correlated with TG before the inflection point at -0.173, with a corresponding increase of 0.735 in TG for every 1-unit increase in TFQI (β=0.735, P=0.0132), there was no correlation after the inflection point. In BMI≥28 kg/m2 group, there were no correlations between TT4RI, TSHI, TFQI and TG.
We concluded that central TH sensitivity was positively associated with TG in population with BMI<28kg/m2 (Table 5, Figure 6).
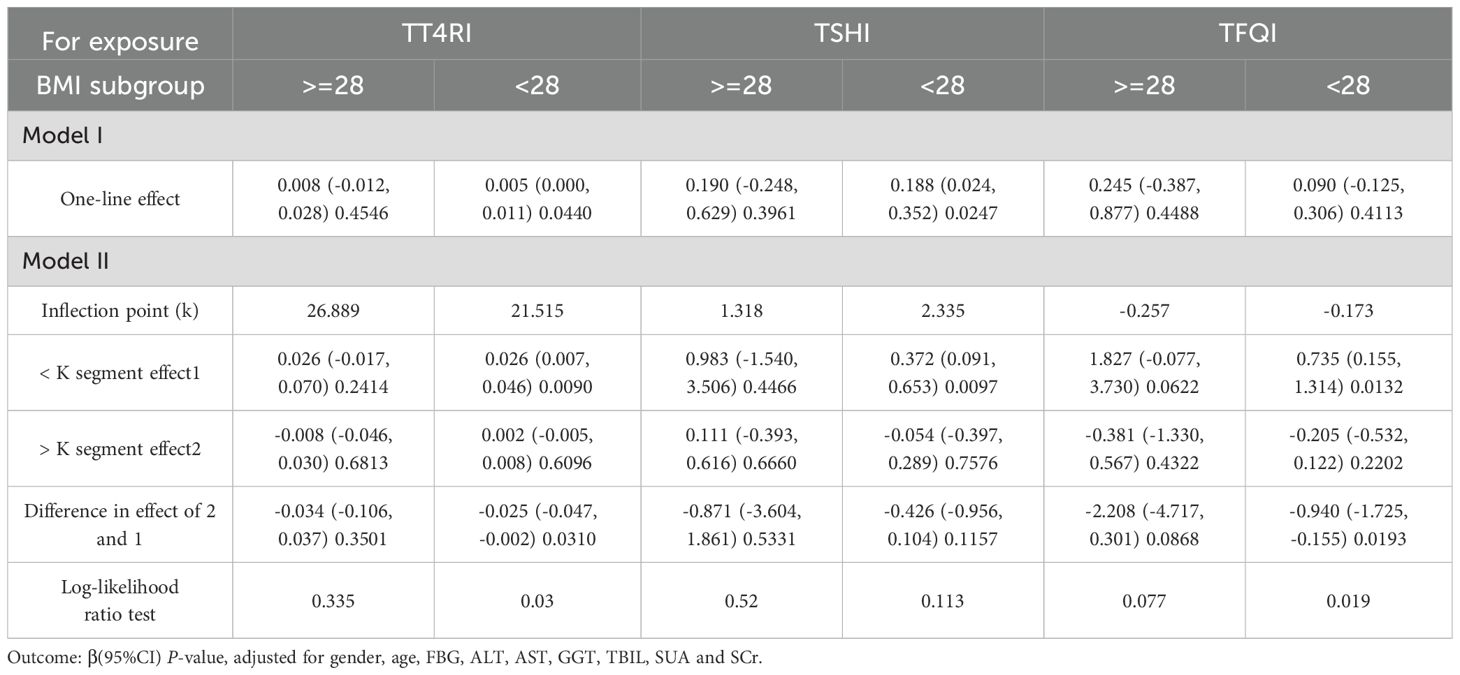
Table 5. BMI subgroup analysis of the correlation between central thyroid hormone sensitivity and TG.
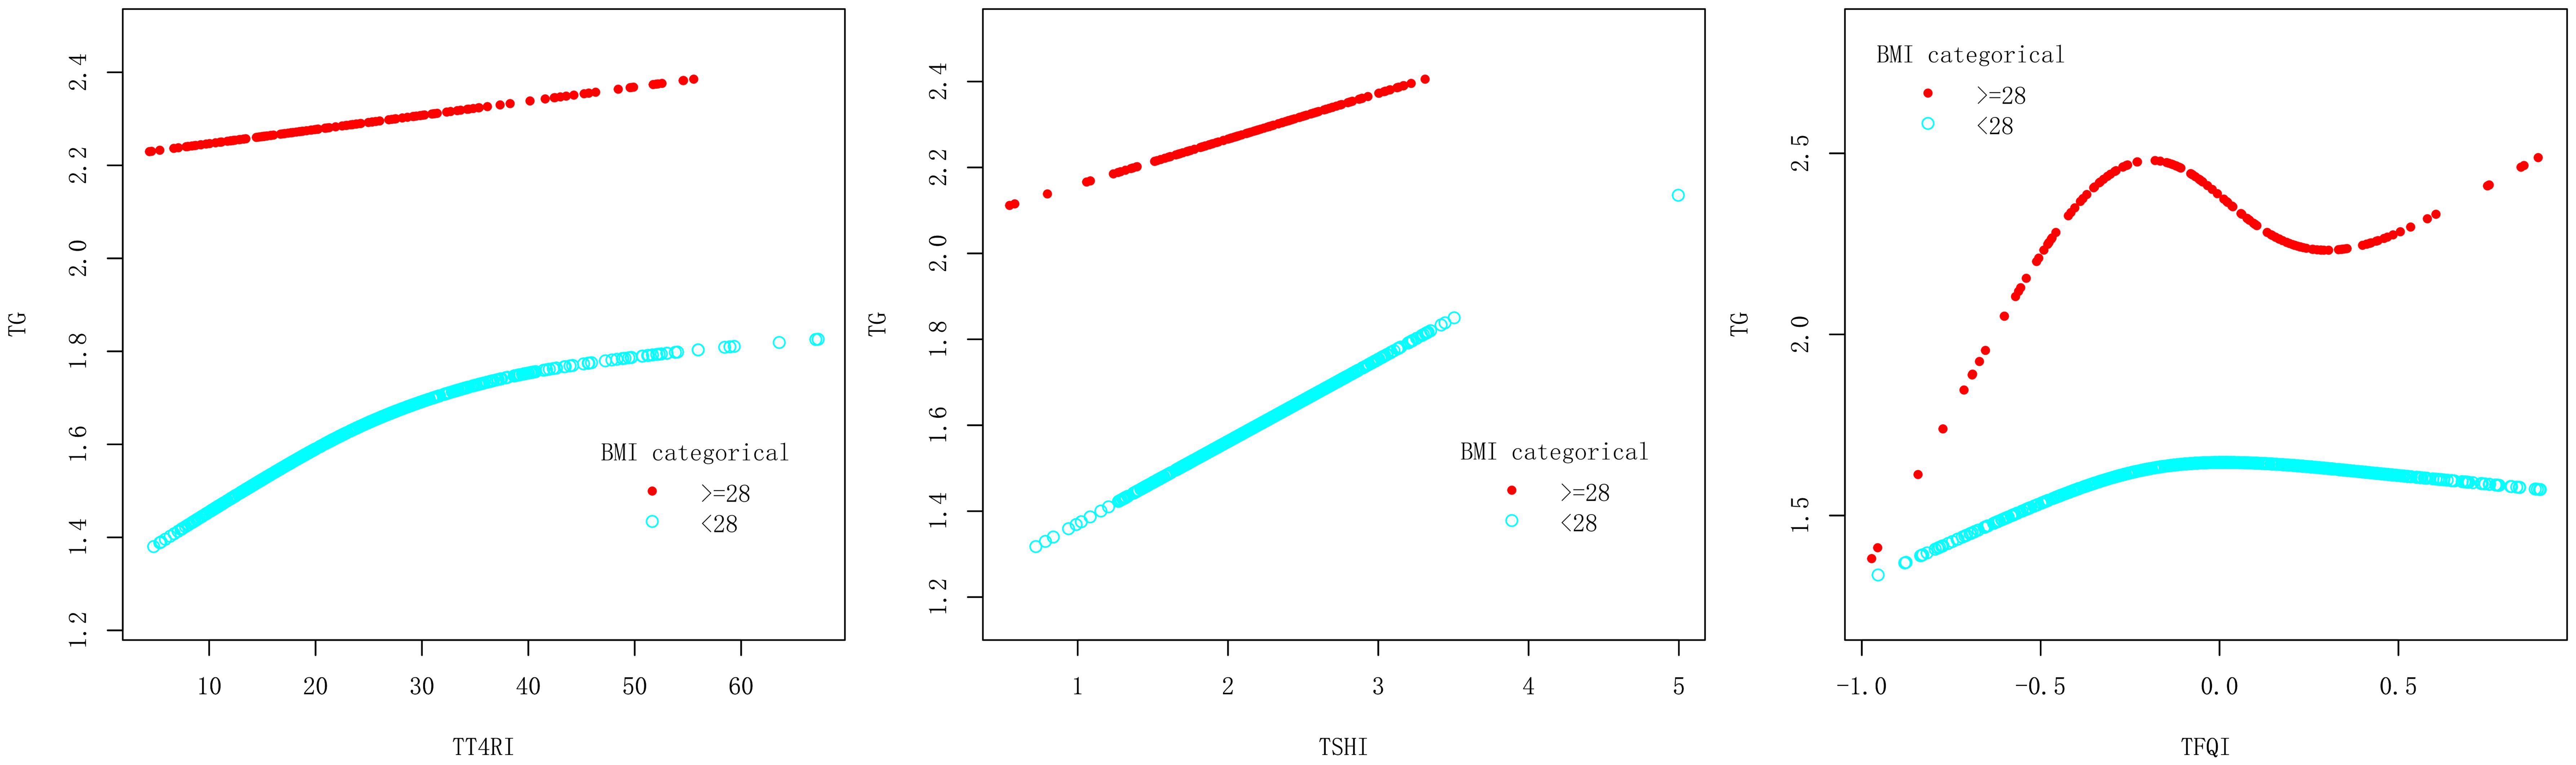
Figure 6. Smooth curve fitting diagram of TFQI, TT4RI, TSHI and TG were analyzed stratified by BMI.
Trend test of multiple regression equations for the relationship between central thyroid hormone sensitivity and HTG
Trend tests of multiple regression equations were performed to verify whether there was correlation between thyroid hormone sensitivity and HTG. HTG was defined as TG≥2.3mmol/L, Model I was adjusted for confounding factors including gender, age and BMI, Model II was adjusted for confounding factors including gender, age, BMI, FBG, ALT, AST, GGT, TBIL, SUA and SCr. The results showed that with the increase of quartiles of TT4RI and TSHI, the risk of HTG increased significantly. With per quartile increase in TT4RI, the hazard ratio for HTG increased by 32.1% (OR=1.321, P=0.00118). For per SD increase in TT4RI, the risk of HTG increased by 36.5% (OR=1.365, P=0.00703). The risk of HTG in the highest quartile of TT4RI was 1.895 times higher than that in the lowest quartile (OR=1.895, P=0.01881). With per quartile increase in TSHI, the hazard ratio for HTG increased by 25.3% (OR=1.253, P=0.00784). For per SD increase in TSHI, the risk of HTG increased by 19.1% (OR=1.191, P=0.06648). The risk of HTG in the highest quartile of TSHI was 1.784 times higher than that in the lowest quartile (OR=1.784, P=0.0343). TFQI was not associated with the risk of HTG (P>0.05) (Table 6, Figure 7).
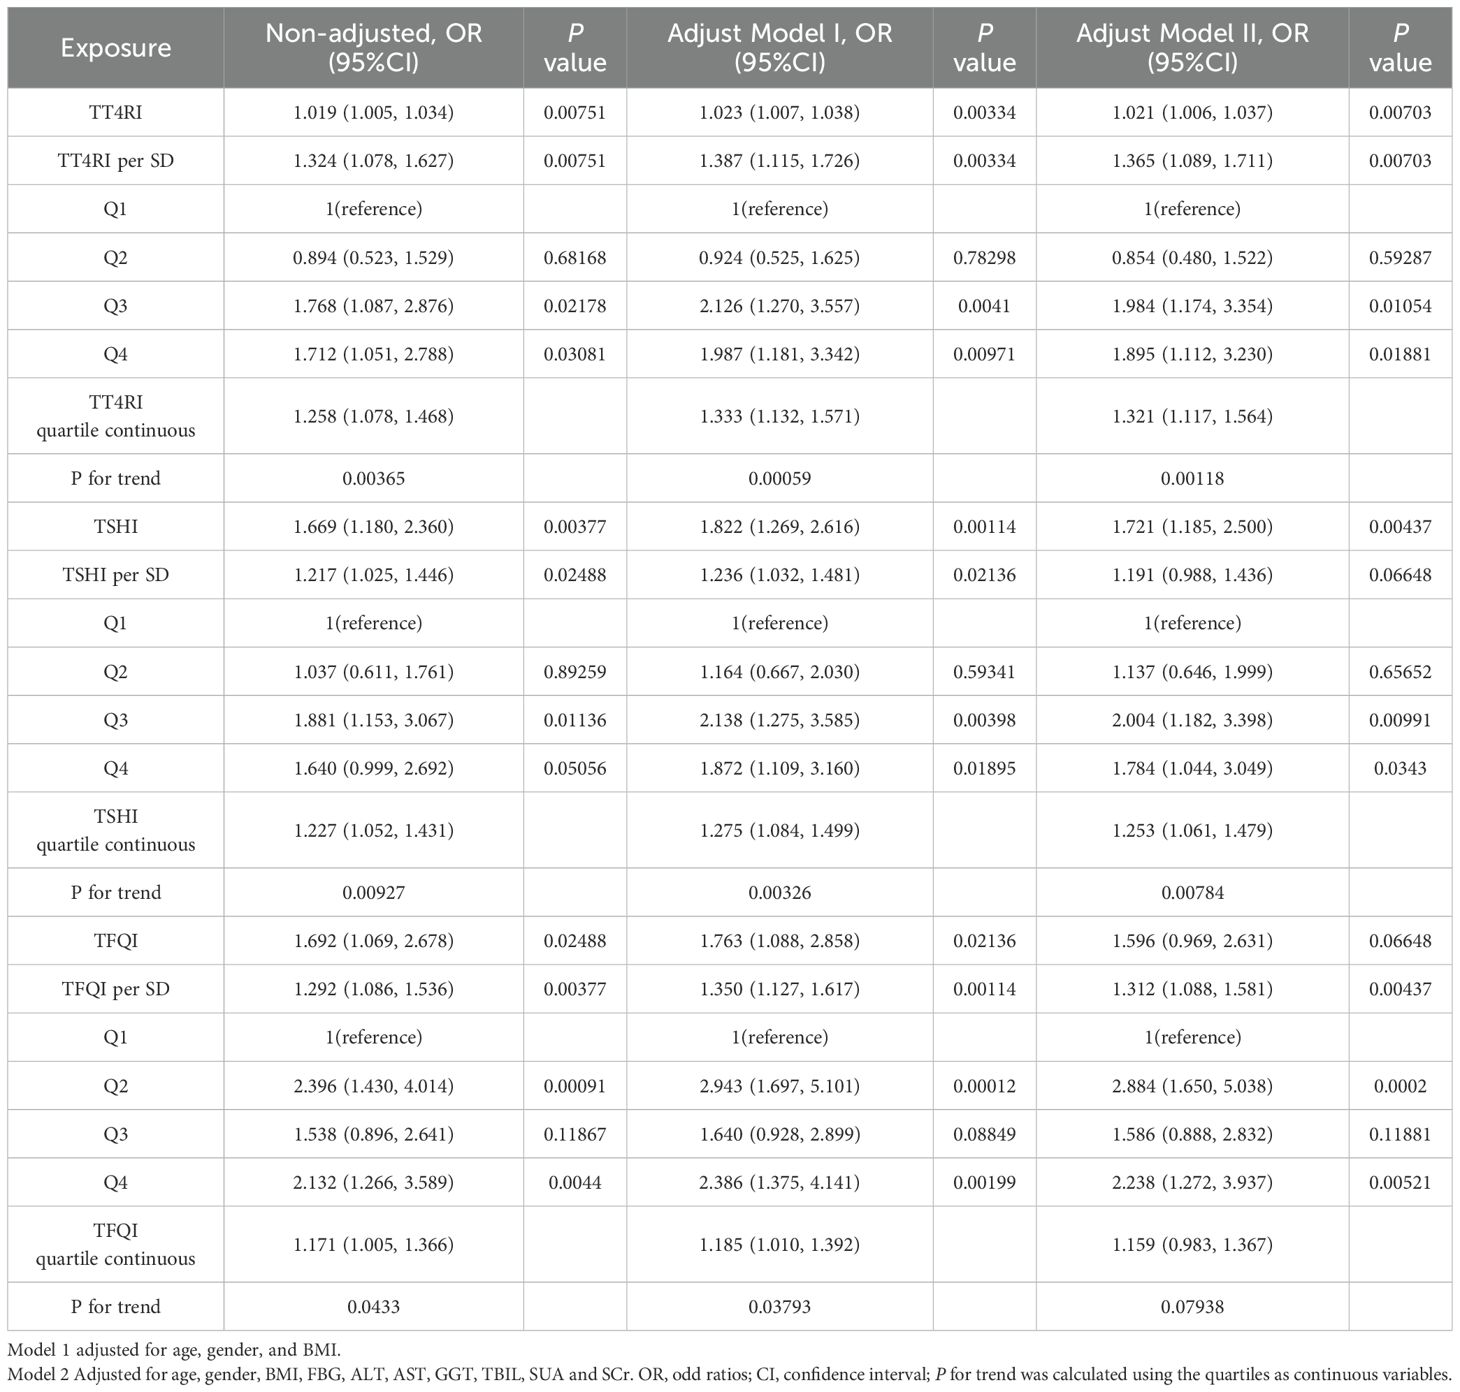
Table 6. Logistic regression analysis of the correlation between central thyroid hormone sensitivity and HTG.
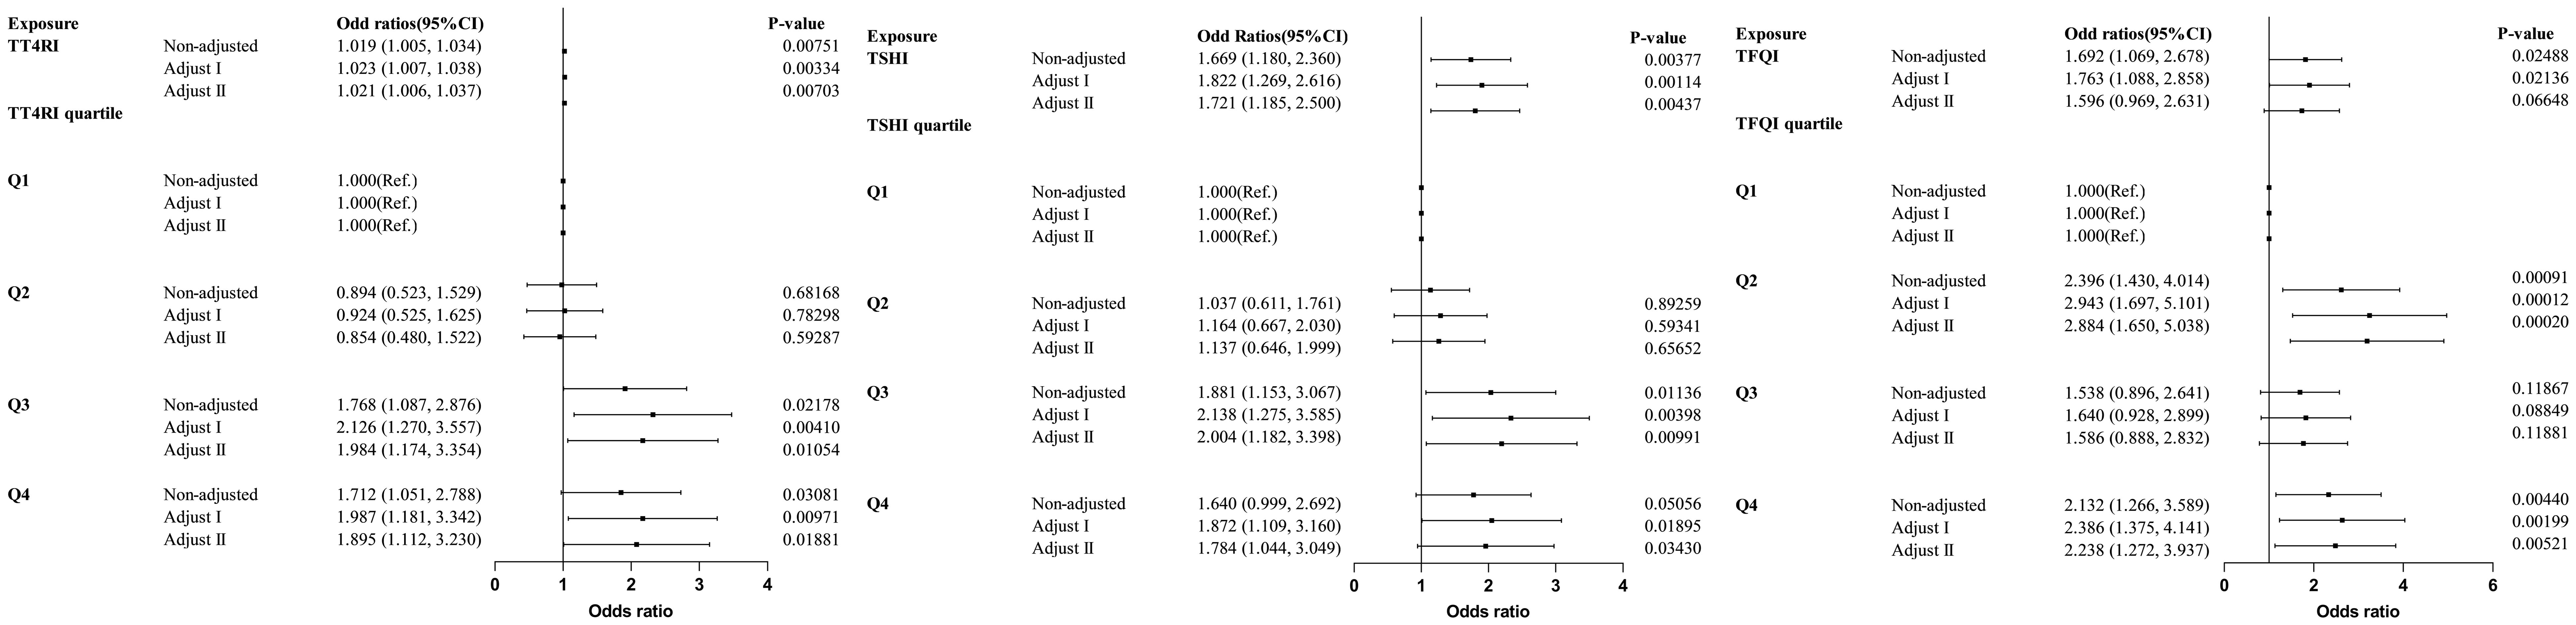
Figure 7. Forest plot of correlation between central thyroid hormone sensitivity and HTG.
Discussion
Our study provided evidence of the association between decreased central TH sensitivity and increased TG, and may increase the risk of HTG in euthyroid population. TFQI was positively correlated with TG in males, while TT4RI and TFQI were positively correlated with TG in females; TT4RI, TSHI and TFQI were positively correlated with TG in population with age<65 years and BMI<28 kg/m2. This suggested that this relationship between central TH sensitivity and TG was more pronounced in young and middle-aged non-obese adults. The indexes of central TH sensitivity may provide more information than the absolute values of TSH, FT3 and FT4, and our study provided new evidence about THs as independent risk factors for HTG in general population. However, as a fundamental constraint of the cross-sectional design, our findings cannot establish causal relationship—whether impaired TH contributes to HTG development.
Elevated levels of TG are the results of overproduction and impaired clearance of triglyceride-rich lipoproteins-very low-density lipoproteins (VLDL) and chylomicrons (20). HTG is a significant contributor to atherosclerosis and the risk of pancreatitis. Experimental findings suggested that HTG accompanied by increased serum fatty acid (FA) concentration inhibited the functions of mitochondrial complexes in pancreatic alveolar cells (21). This inhibition led to pathologically elevated intracellular calcium, cytokine release, tissue damage and reduced pancreatic ductal function, ultimately resulted in acute pancreatitis (22). HTG was associated with elevated triglyceride-rich lipoprotein (TGRL) and its residues (23), which penetrated the endothelium and interacted with macrophages, leading to the formations of foam cells in the arterial wall and the inflammatory response which would promote atherogenesis (24). In conclusion, patients with HTG may experience various endocrine and metabolic disorders, deserving more in-depth researches.
THs play important roles in regulating lipid metabolism. Evidences suggested that THs, in addition to stimulating lipid substrate utilization by increasing the mobilization of stored TG in adipose tissue, were major regulators of lipid metabolism (25). They promoted lipid mobilization, degradation and de novo FA synthesis in the liver (26). THs stimulated 3-hydroxy-3-methylglutaryl-coa reductase (27), which initiated TC biosynthesis and regulated TC metabolism by increasing the expression of sterol regulatory element-binding protein-2 (SREBP-2) (28). Previous studies have shown that the concentration of THs was correlated with hepatic TG content by increasing cholesteryl ester transfer activity, which facilitated the exchange of cholesteryl esters between very low-density lipoproteins (VLDL) and TG in opposite direction (29). Triiodothyronine (T3) could stimulate lipoprotein lipase, which catabolized TG-rich lipoproteins, ultimately leading to a reduction in TG levels (30). In a mouse model with TSH receptor, we could see that TSH inhibited the expression of adipose triglyceride lipase (ATGL) significantly in mature adipocytes in a dose-dependent manner via the PKA pathway (31). However, all of these mechanisms were obtained through animal experiments, which may not be able to fully explain the phenomena observed in our studied population.
Previous studies have confirmed the adverse effects of impaired sensitivity to central THs, with increased incidence of MAFLD (32) and increased prevalence of hyperuricemia (33), as well as dyslipidemia (34). Our findings provided a possible biological basis for the clinical phenomenon where patients with dyslipidemia often exhibited subtle perturbations in thyroid axis, but no overt dysfunction criteria. The stronger associations observed in non-obese and younger adults aligned with population-based evidence that TH sensitivity progressively declined with aging and adiposity (35). Notably, the inflection points (TT4RI=25.8; TFQI=-0.194) in our study may reflect possible clinical cutoffs of evaluating TH-lipid relationships (12). Current guidelines (20) primarily focus on LDL-C reduction, while residual HTG-related cardiovascular risk persists in 15-20% in statin-treated patients (4). Our study imply that TH resistance indices may supplement existing tools by unmasking occult endocrine contributors to TG dysregulation, particularly in patients with recurrent pancreatitis or premature ASCVD despite with adequate LDL control. Our findings provided a possible mechanism for the characteristic TH profile observed in patients with dyslipidemia in general population.
Considering the well-established alterations in thyroid profiles with aging (35) and the impact of sex steroids on thyroid function modulation (36), subgroup analyses were conducted based on sex and age. Regarding the differences within gender subgroups, which may be attributed to the different regulatory effects of gonadal hormones on thyroid function. As an example, estrogen or androgen therapy had contrasting impact on the concentration of serum thyroxine-binding globulin, thereby exerting different influence on thyroid function (37). Lipid abnormalities may be rapidly elevated with biological aging and endocrine changes associated with menopause.
Our findings also reveal distinct relationships between central TH sensitivity and TG in distinct BMI statuses. It has been shown that obese individuals exhibited greater central resistance to thyroid hormones, which may be related to the decreased expression of THs and thyrotropin receptors in adipocytes (38). Additionally, interactions between THs and leptin maybe as follows: Leptin secreted by adipose tissue directly stimulates thyrotropin-releasing hormone (TRH) transcription in the hypothalamic paraventricular nucleus (39), while also indirectly promotes TRH secretion via proopiomelanocortin (POMC) products in the arcuate nucleus (40). Despite these potential mechanisms, the precise links between central TH sensitivity and TG across different subgroups remain unexplored, necessitating future investigations.
Certain limitations were presented in our study: 1. Due to the limitation of a cross-sectional study, the causal relationship between central thyroid hormone sensitivity and TG could not be established. 2. This was a single-center study with a relatively small sample size and geographic limitation, and the generalizability of the results still need to be verified in large-scale population. 3. The histories taking in our study may be insufficient and medication histories may not be detailed. 4. We measured the levels of thyroid hormones, but did not test for thyroid hormone antibodies, so we could not completely exclude the effects of Hashimoto’s thyroiditis and other thyroid diseases. 5. We lacked dietary and physical activity data, which were known to influence TG levels and may confound the observed associations.
Conclusion
Impaired central TH sensitivity was associated with HTG, this association was stronger in young and middle-aged non-obese individuals. We speculated that impaired central TH sensitivity may be contribute to an increased risk of HTG, which still need to be confirmed by more in-depth studies.
Data availability statement
The original contributions presented in the study are included in the article/Supplementary Material. Further inquiries can be directed to the corresponding author.
Ethics statement
The studies involving humans were approved by Research Ethics Committee of the Third Affiliated Hospital of Anhui Medical University (No.2024-167-01). The studies were conducted in accordance with the local legislation and institutional requirements. The participants provided their written informed consent to participate in this study.
Author contributions
YG: Formal Analysis, Supervision, Methodology, Data curation, Visualization, Software, Validation, Conceptualization, Writing – original draft, Investigation. GW: Visualization, Data curation, Resources, Validation, Formal Analysis, Conceptualization, Investigation, Writing – review & editing, Methodology, Supervision, Software. QZ: Visualization, Formal Analysis, Data curation, Conceptualization, Validation, Investigation, Software, Writing – review & editing, Methodology. XJ: Visualization, Writing – review & editing, Conceptualization, Software, Investigation, Data curation, Methodology. ZZ: Software, Conceptualization, Validation, Investigation, Writing – review & editing, Data curation, Methodology. YL: Writing – review & editing, Validation, Conceptualization, Methodology, Supervision, Investigation, Software, Formal Analysis, Resources, Visualization, Data curation, Project administration.
Funding
The author(s) declare that no financial support was received for the research and/or publication of this article.
Conflict of interest
The authors declare that the research was conducted in the absence of any commercial or financial relationships that could be construed as a potential conflict of interest.
Generative AI statement
The author(s) declare that no Generative AI was used in the creation of this manuscript.
Publisher’s note
All claims expressed in this article are solely those of the authors and do not necessarily represent those of their affiliated organizations, or those of the publisher, the editors and the reviewers. Any product that may be evaluated in this article, or claim that may be made by its manufacturer, is not guaranteed or endorsed by the publisher.
Supplementary material
The Supplementary Material for this article can be found online at: https://www.frontiersin.org/articles/10.3389/fendo.2025.1616907/full#supplementary-material
References
1. Newman CB, Blaha MJ, Boord JB, Cariou B, Chait A, Fein HG, et al. Lipid management in patients with endocrine disorders: an endocrine society clinical practice guideline. J Clin Endocrinol Metab. (2020) 105:dgaa674. doi: 10.1210/clinem/dgaa674
2. Pirillo A, Casula M, Olmastroni E, Norata GD, and Catapano AL. Global epidemiology of dyslipidaemias. Nat Rev Cardiol. (2021) 18:689–700. doi: 10.1038/s41569-021-00541-4
3. Laufs U, Parhofer KG, Ginsberg HN, and Hegele RA. Clinical review on triglycerides. Eur Heart J. (2020) 41:99–109c. doi: 10.1093/eurheartj/ehz785
4. Packard CJ, Boren J, and Taskinen MR. Causes and consequences of hypertriglyceridemia. Front Endocrinol. (2020) 11:252. doi: 10.3389/fendo.2020.00252
5. Mavromati M and Jornayvaz FR. Hypothyroidism-associated dyslipidemia: potential molecular mechanisms leading to NAFLD. Int J Mol Sci. (2021) 22:12797. doi: 10.3390/ijms222312797
6. Duntas LH and Brenta G. A renewed focus on the association between thyroid hormones and lipid metabolism. Front Endocrinol. (2018) 9:511. doi: 10.3389/fendo.2018.00511
7. Kotwal A, Cortes T, Genere N, Hamidi O, Jasim S, Newman CB, et al. Treatment of thyroid dysfunction and serum lipids: A systematic review and meta-analysis. J Clin Endocrinol Metab. (2020) 105:dgaa672. doi: 10.1210/clinem/dgaa672
9. Patrizio A, Ferrari SM, Elia G, Ragusa F, Balestri E, Botrini C, et al. Hypothyroidism and metabolic cardiovascular disease. Front Endocrinol. (2024) 15:1408684. doi: 10.3389/fendo.2024.1408684
10. Sinha RA, Bruinstroop E, Singh BK, and Yen PM. Nonalcoholic fatty liver disease and hypercholesterolemia: roles of thyroid hormones, metabolites, and agonists. Thyroid. (2019) 29:1173–91. doi: 10.1089/thy.2018.0664
11. Laclaustra M, Moreno-Franco B, Lou-Bonafonte JM, Mateo-Gallego R, Casasnovas JA, Guallar-Castillon P, et al. Impaired sensitivity to thyroid hormones is associated with diabetes and metabolic syndrome. Diabetes Care. (2019) 42:303–10. doi: 10.2337/dc18-1410
12. Lv F, Cai X, Li Y, Zhang X, Zhou X, Han X, et al. Sensitivity to thyroid hormone and risk of components of metabolic syndrome in a Chinese euthyroid population. J Diabetes. (2023) 15:900–10. doi: 10.1111/1753-0407.13441
13. Lai S, Li J, Wang Z, Wang W, and Guan H. Sensitivity to thyroid hormone indices are closely associated with NAFLD. Front Endocrinol. (2021) 12:766419. doi: 10.3389/fendo.2021.766419
14. Chaturvedi S. The Seventh Report of the Joint National Committee on Prevention, Detection, Evaluation, and Treatment of High Blood Pressure (JNC 7): is it really practical? Natl Med J India. (2004) 17:227.
15. American Diabetes Association. Standards of medical care in diabetes-2020 abridged for primary care providers. Clin Diabetes. (/2020) 38:10–38. doi: 10.2337/cd20-as01
16. Parhofer KG and Laufs U. The diagnosis and treatment of hypertriglyceridemia. Deutsches Arzteblatt Int. (2019) 116:825–32. doi: 10.3238/arztebl.2019.0825
17. Yagi H, Pohlenz J, Hayashi Y, Sakurai A, and Refetoff S. Resistance to thyroid hormone caused by two mutant thyroid hormone receptors beta, R243Q and R243W, with marked impairment of function that cannot be explained by altered in vitro 3,5,3’-triiodothyroinine binding affinity. J Clin Endocrinol Metab. (1997) 82:1608–14. doi: 10.1210/jcem.82.5.3945
18. Jostel A, Ryder WD, and Shalet SM. The use of thyroid function tests in the diagnosis of hypopituitarism: definition and evaluation of the TSH Index. Clin Endocrinol. (2009) 71:529–34. doi: 10.1111/j.1365-2265.2009.03534.x
19. Faul F, Erdfelder E, Lang AG, and Buchner A. G*Power 3: a flexible statistical power analysis program for the social, behavioral, and biomedical sciences. Behav Res Methods. (2007) 39:175–91. doi: 10.3758/bf03193146
20. Mach F, Baigent C, Catapano AL, Koskinas KC, Casula M, Badimon L, et al. 2019 ESC/EAS Guidelines for the management of dyslipidaemias: lipid modification to reduce cardiovascular risk. Eur Heart J. (2020) 41:111–88. doi: 10.1093/eurheartj/ehz455
21. Rawla P, Sunkara T, Thandra KC, and Gaduputi V. Hypertriglyceridemia-induced pancreatitis: updated review of current treatment and preventive strategies. Clin J Gastroenterol. (2018) 11:441–8. doi: 10.1007/s12328-018-0881-1
22. Kiss L, Fűr G, Pisipati S, Rajalingamgari P, Ewald N, Singh V, et al. Mechanisms linking hypertriglyceridemia to acute pancreatitis. Acta Physiol (Oxford England). (2023) 237:e13916. doi: 10.1111/apha.13916
23. Chapman MJ, Ginsberg HN, Amarenco P, Andreotti F, Borén J, Catapano AL, et al. Triglyceride-rich lipoproteins and high-density lipoprotein cholesterol in patients at high risk of cardiovascular disease: evidence and guidance for management. Eur Heart J. (2011) 32:1345–61. doi: 10.1093/eurheartj/ehr112
24. Peng X and Wu H. Inflammatory links between hypertriglyceridemia and atherogenesis. Curr Atheroscl Rep. (2022) 24:297–306. doi: 10.1007/s11883-022-01006-w
25. Wang JJ, Zhuang ZH, Shao CL, Yu CQ, Wang WY, Zhang K, et al. Assessment of causal association between thyroid function and lipid metabolism: a Mendelian randomization study. Chin Med J. (2021) 134:1064–9. doi: 10.1097/cm9.0000000000001505
26. Mason RL, Hunt HM, and Hurxthal L. Blood cholesterol values in hyperthyroidism and hypothyroidism-their significance. N Engl J Med. (1930) 203:1273–8. doi: 10.1056/NEJM193012252032601
27. Rizos CV, Elisaf MS, and Liberopoulos EN. Effects of thyroid dysfunction on lipid profile. Open Cardiovasc Med J. (2011) 5:76–84. doi: 10.2174/1874192401105010076
28. Shin DJ and Osborne TF. Thyroid hormone regulation and cholesterol metabolism are connected through Sterol Regulatory Element-Binding Protein-2 (SREBP-2). J Biol Chem. (2003) 278:34114–8. doi: 10.1074/jbc.M305417200
29. Bril F, Kadiyala S, Portillo Sanchez P, Sunny NE, Biernacki D, Maximos M, et al. Plasma thyroid hormone concentration is associated with hepatic triglyceride content in patients with type 2 diabetes. J Invest Med. (2016) 64:63–8. doi: 10.1136/jim-2015-000019
30. Prieur X, Huby T, Coste H, Schaap FG, Chapman MJ, and Rodríguez JC. Thyroid hormone regulates the hypotriglyceridemic gene APOA5. J Biol Chem. (2005) 280:27533–43. doi: 10.1074/jbc.M503139200
31. Jiang D, Ma S, Jing F, Xu C, Yan F, Wang A, et al. Thyroid-stimulating hormone inhibits adipose triglyceride lipase in 3T3-L1 adipocytes through the PKA pathway. PloS One. (2015) 10:e0116439. doi: 10.1371/journal.pone.0116439
32. Zhang X, Chen Y, Ye H, Luo Z, Li J, Chen Z, et al. Correlation between thyroid function, sensitivity to thyroid hormones and metabolic dysfunction-associated fatty liver disease in euthyroid subjects with newly diagnosed type 2 diabetes. Endocrine. (2023) 80:366–79. doi: 10.1007/s12020-022-03279-2
33. Wu Z, Jiang Y, Li P, Wang Y, Zhang H, Li Z, et al. Association of impaired sensitivity to thyroid hormones with hyperuricemia through obesity in the euthyroid population. J Trans Med. (2023) 21:436. doi: 10.1186/s12967-023-04276-3
34. Liu Y, Ma M, Li L, Liu F, Li Z, Yu L, et al. Association between sensitivity to thyroid hormones and dyslipidemia in patients with coronary heart disease. Endocrine. (2023) 79:459–68. doi: 10.1007/s12020-022-03254-x
35. Visser WE, Visser TJ, and Peeters RP. Thyroid disorders in older adults. Endocrinol Metab Clinics North Am. (2013) 42:287–303. doi: 10.1016/j.ecl.2013.02.008
36. Tahboub R and Arafah BM. Sex steroids and the thyroid. Best Pract Res Clin Endocrinol Metab. (2009) 23:769–80. doi: 10.1016/j.beem.2009.06.005
37. Duntas LH and Brenta G. The effect of thyroid disorders on lipid levels and metabolism. Med Clinics North Am. (2012) 96:269–81. doi: 10.1016/j.mcna.2012.01.012
38. Juiz-Valiña P, Cordido M, Outeiriño-Blanco E, Pértega S, Varela-Rodríguez BM, García-Brao MJ, et al. Central resistance to thyroid hormones in morbidly obese subjects is reversed after bariatric surgery-induced weight loss. J Clin Med. (2020) 9:269–81. doi: 10.3390/jcm9020359
39. Santini F, Marzullo P, Rotondi M, Ceccarini G, Pagano L, Ippolito S, et al. Mechanisms in endocrinology: the crosstalk between thyroid gland and adipose tissue: signal integration in health and disease. Eur J Endocrinol. (2014) 171:R137–52. doi: 10.1530/eje-14-0067
Keywords: thyroid hormone sensitivity, hypertriglyceridemia, thyroid feedback quantile-based index, thyroid-stimulating hormone index, thyrotropin thyroxine resistance index
Citation: Gong Y, Wang G, Zhang Q, Jiang X, Zhu Z and Li Y (2025) Impaired central sensitivity to thyroid hormone is associated with hypertriglyceridemia in euthyroid population. Front. Endocrinol. 16:1616907. doi: 10.3389/fendo.2025.1616907
Received: 07 May 2025; Accepted: 25 June 2025;
Published: 14 July 2025.
Edited by:
Francesco Corica, University of Messina, ItalyReviewed by:
Mostafa Vaghari-Tabari, Tabriz University of Medical Sciences, IranWissal Abassi, University of Jendouba, Tunisia
Copyright © 2025 Gong, Wang, Zhang, Jiang, Zhu and Li. This is an open-access article distributed under the terms of the Creative Commons Attribution License (CC BY). The use, distribution or reproduction in other forums is permitted, provided the original author(s) and the copyright owner(s) are credited and that the original publication in this journal is cited, in accordance with accepted academic practice. No use, distribution or reproduction is permitted which does not comply with these terms.
*Correspondence: Ying Li, NDc0NzMxODgwQHFxLmNvbQ==
†These authors share first authorship