 Yongke Wu
 Yuanhao Su
 Yiyuan Zhao
 Zhidong Wang
- Department of Geriatric General Surgery, The Second Affiliated Hospital, Xi’an Jiaotong University, Xi’an, Shaanxi, China
Background: Current guidelines lack nomograms to predict lymph node metastasis (LNM) in thyroid carcinoma (TC) in China. Nomograms are simple, accurate tools to estimate the probability of specific events and have been extensively developed to predict LNM in TC. However, few effective nomograms have been validated in clinical practice.
Methods: The recommendations of the Cochrane Prognosis Methods Group were implemented in this systematic review. We conducted searches in PubMed, Web of Science, and Scopus for published research. The nomogram was categorized based on outcomes. We summarized the key characteristics and effectiveness of the nomogram and assessed the overall risk of bias (ROB). We employed random-effects and bivariate mixed-effects models to estimate the efficacy of the nomogram group and its predictive reliability.
Results: The systematic review identified 57 nomogram models from China, of which only 14 had external validation cohorts. While the applicability was acceptable, the heterogeneity among the included nomograms was substantial, leading to a high overall risk of bias (ROB). Ultrasound information was utilized in nearly all studies. Size, extrathyroidal extension (ETE), tumor consistency index (TCI), and multifocality are commonly employed independent risk factors. Both outcome models showed good to excellent predictive efficacy. However, the performance of models that integrate radiomics with clinical features was inferior to those using ultrasound alone.
Conclusions: The feature-combined model offers several potential outcomes and advantages for clinical practice in China. Additionally, the systematic review serves as a reference tool for physicians to select appropriate nomograms based on individual clinical needs. Future research should focus on external validation and evaluation to minimize limitations in clinical utility.
1 Introduction
A long-term study showed that the incidence of thyroid cancer (TC) has rapidly increased in recent decades (1). According to the latest Chinese cancer statistics, there were 466,100 new TC cases, and the incidence of TC was the third most prevalent in 2022 (2). Differentiated thyroid cancer (DTC), which includes papillary thyroid carcinoma (PTC), accounts for more than 80% of all thyroid cancers (3, 4). Although PTC generally has low-grade malignancy and a favorable long-term prognosis, the recurrence rate is relatively high, up to 20%, and lymph node metastasis (LNM) is about 30%–90%, primarily in the central compartment of the neck (5).
Current clinical guidelines differ in diagnosing and treating LNM from PTC. In China, individualized management of low-risk patients at stage cN0 (clinically uninvolved central neck lymph nodes) without associated high-risk factors (6) is emphasized, while the American Joint Committee on Cancer (AJCC) staging places more focus on patient recurrence and survival (7, 8). The National Comprehensive Cancer Network (NCCN) recommends considering prophylactic central neck dissection (pCND) for patients with cN0 (9, 10). However, the NCCN guidelines overrule previous conclusions based on the results of only one study (11). The American Thyroid Association (ATA) guidelines suggest pCND for patients with cN0 PTC, particularly for tumors >4 cm or with extrathyroidal extensions (ETE) (12). Yet, relying solely on simple imaging features as risk factors may not sufficiently predict many subclinical LNM of TC. Prophylactic neck dissection (pND) facilitates more complete staging of the cervical lymph nodes and could enhance prognosis while guiding subsequent treatment and follow-up management. However, patients must consider the risk of over-diagnosis and over-treatment (13). Highly accurate detection of LNM from PTC is a crucial factor influencing treatment outcomes for patients.
The main tests for detecting LNM in TC are ultrasound, fine needle aspiration (FNA), and computed tomography (CT). Ultrasound and FNA with thyroglobulin washout (FNA-Tg) significantly improve the diagnostic rate of PTC and LNM (14). However, due to non-standardization and technical limitations, they cannot be used as the only standard method for detecting LNM (15–18). Although CT and positron emission tomography (PET) compensate for the low sensitivity of these tests (19–21), their high cost and complexity are drawbacks. No specific laboratory indicator has been found to have a diagnostic value for clinical practice. While LNM may not be detectable on preoperative imaging or clinical examination, it may still be present or recur after thyroidectomy (22, 23).
A nomogram serves as a user-friendly tool to predict individual probabilities of specific patient events, such as tumor metastasis and prognosis, as well as to construct risk stratification, which helps to personalize medical care and counsel (24). The developed nomograms varied based on the data set characteristics and the outcome variables. Nevertheless, few predictive models have been implemented in clinical practice. The most significant drawback is the lack of adequate feature interpretation and model validation (both internal and external), making the model challenging to apply in clinical settings.
The standardization of diagnosis and treatment for TC and its LNM needs urgent resolution in China. In this article, we first conducted a systematic review and meta-analysis of multivariate nomograms for predicting LNM related to TC in a real-world Chinese study. We summarize nomograms based on clinical data, identify those suitable for further research, and provide recommendations for individual patients and reference tools for clinical practice.
2 Materials and methods
We conducted this systematic review according to the recommendations of the Cochrane Prognosis Methods Group (25, 26). The systematic review protocol was prospectively registered on the PROSPERO website (registration ID: CRD42024548413).
2.1 Eligibility criteria
We utilized the CHARMS checklist (27) and TRIPOD-SRMA checklist (28) for systematic reviews of prediction model studies and employed the PICOTS scheme to define the review questions (Table 1): What is the clinical value of nomograms in predicting LNM in (PTC)?
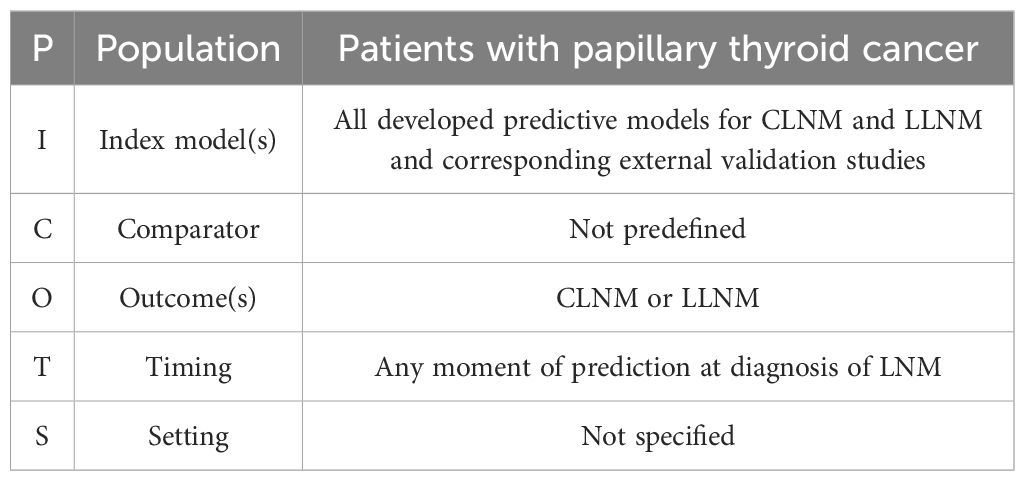
Table 1. PICOTS system for predictive models of LNM of papillary thyroid cancer.
Studies were eligible if they (I) matched the research question by including patients with PTC and (II) presented a multivariable prognostic nomogram that was based on development and validated either internally or externally. (III) The model’s accuracy and calibration for the nomograms were graphically reported. (IV) Only full-text manuscripts published in English were included. (V) Additionally, only studies involving adult TC were considered.
2.2 Databases searched
A systematic search strategy was conducted in PubMed, Web of Science, and Scopus using the following keywords: (thyroid cancer OR differentiated thyroid cancer OR papillary thyroid carcinoma) AND (nomogram OR nomograms) AND (CLNM OR LLNM OR central lymph node metastasis OR lateral lymph node metastasis). To gather as many detailed papers as possible, we developed a search formula by combining subject terms with free words (Supplementary Material S1). Based on the varying outcomes, we categorized the articles that passed the screening into two groups: CLNM-nomograms and LLNM-nomograms.
2.3 Data extraction process
We extracted data from the following fields: paper information, participant information, sample size, predictors, outcomes to be predicted, model performance, and information on internal and external validation. If different models are reported in the same article, we consider them to be separate independent nomograms. However, as is known from the methodological behavior of prediction models and the large number of systematic reviews reported (29, 30), calibration performed poorly and was unsuitable for further assessment. Therefore, we evaluated the inadequacy of calibration reporting. Similarly, we collected an index of model efficacy (AUC, sensitivity, and specificity). We extracted sensitivity and specificity from ROC curves for articles without descriptions using Origen2021 software and screened sensitivity and specificity using the optimal Jordon index.
2.4 Risk of bias assessment
The Prediction model Risk of Bias Assessment Tool (PROBAST) evaluated the quality of predictive model studies. PROBAST comprises 20 signaling questions utilized for ROB assessment across four domains: participants, predictors, outcomes, and analysis. The results of the PROBAST analysis were reported for each domain and categorized as follows: bias (low risk, high risk, unclear) and applicability (low concern, high concern, unclear). Any potential disagreements were discussed and resolved through constructive commentary and mutual consensus among all authors.
2.5 Statistical analysis
Different outcome nomograms were grouped due to the lack of validation studies in the meta-analysis and the heterogeneity of the nomograms. Considering the specificity of LNM models in TC, no clear model is applied to clinical practice in the guidelines. We grouped the models with the same outcome together and investigated the overall performance of the nomogram groups by pooling the C-index. The C-index is equivalent to the area under the receiver operating characteristic (ROC) curve for models with binary endpoints (31). We established cutoff values of 0.6, 0.75, and 0.85 for moderate, significant, and excellent discrimination accuracy in nomograms.
We included the C-index that best accounted for the risk of overfitting in development studies, favoring the internal validation cohort and validation through resampling by bootstrapping instead of the development cohort without validation—subgroup analysis based on modeling variables and model type (ultrasound and combined radiomic). A sensitivity, specificity, and AUC meta-analysis was conducted using bivariate mixed-effects and random-effects models. We utilized the statistical v.4.2.2 software (R Development Core Team, Vienna, http://www.R-project.org).
3 Results
3.1 Nomogram search and study characteristics
A total of 2,835 studies were identified through the search strategy and by merging three databases. After removing duplicates, the titles and abstracts of 2,332 articles were reviewed. By carefully examining the titles and abstracts, we excluded literature that was not relevant to the topic (n = 1,691), along with types of reviews, comments, letters (n = 289), and non-English articles (n = 85). We conducted a full-text review of 267 articles. Ultimately, 51 studies, comprising 57 models, were included in the systematic review, while 50 studies, totaling 56 models, were included in the meta-analysis (Figure 1). All included studies are detailed in Supplementary Material S2. The heat map of China was created based on the frequency and total number of included models to illustrate the establishment and popularity of LNM models of PTC, with variations potentially linked to the local medical care level and the population’s epidemiology (Supplementary Material S3).
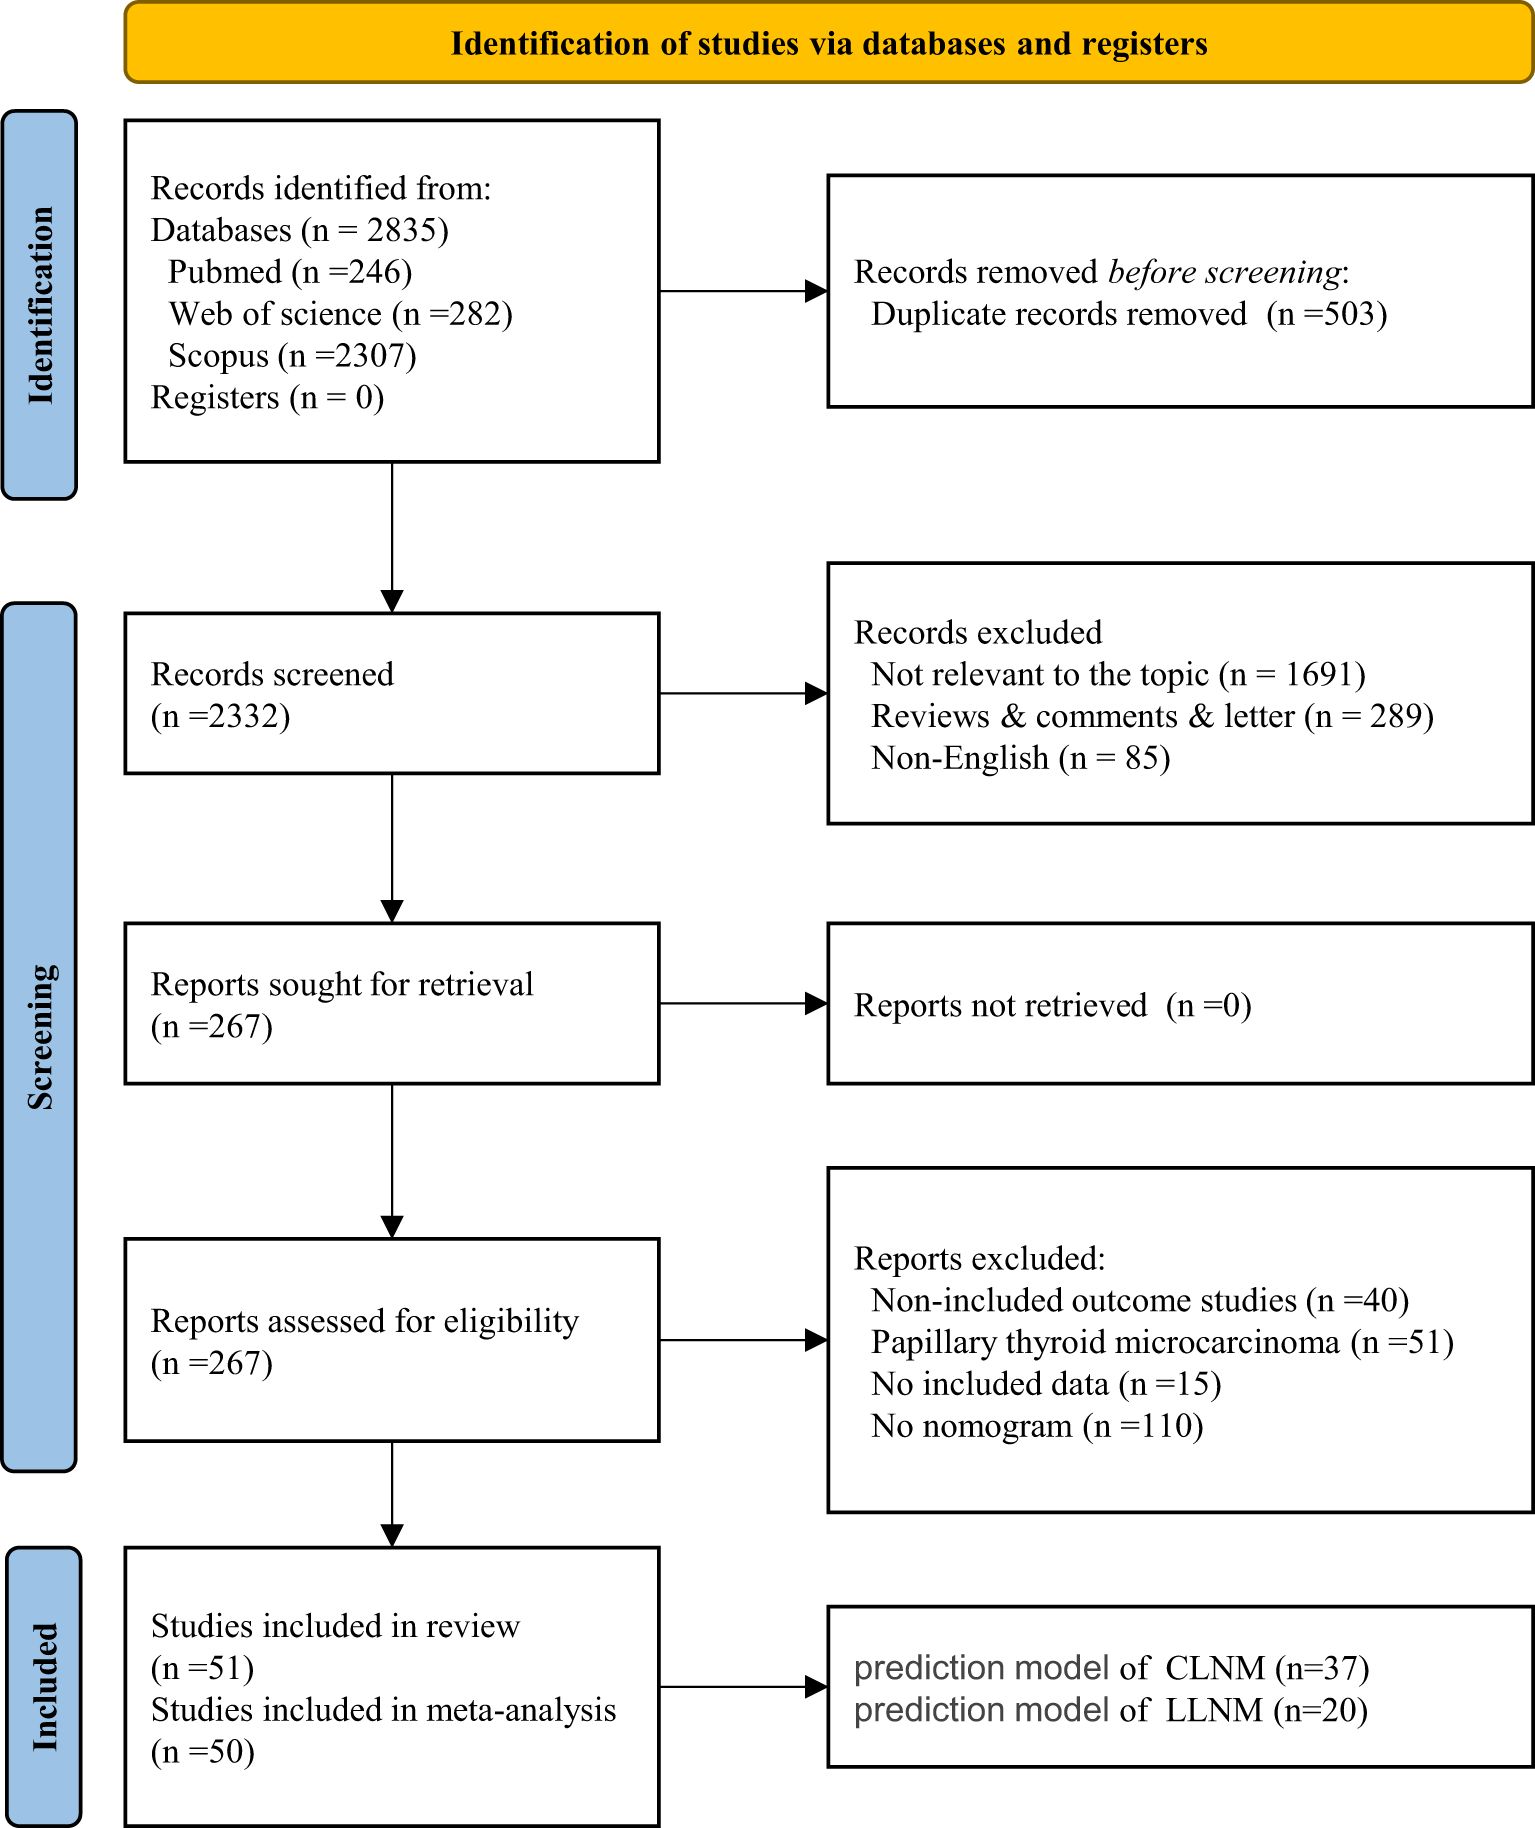
Figure 1. PRISMA flow chart of the study selection process.
In the CLNM group, a total of 37 nomograms were included, with 25,102 patients enrolled in the training set. A total of 9,993 cases were used for internal validation, while 1,958 cases were utilized for external validation. All studies were conducted in China, spanning from 2011 to 2024. A total of 31 studies employed internal validation procedures. Specifically, 19 studies used split-sample validation with varying proportions, Tong’s study utilized multicenter internal validation (32), eight studies verified splitting samples by admission time, and the remaining two studies employed internal validation via bootstrap resampling. Five studies (including six nomogram models) performed external validation. The primary source of external validation was split samples of different proportions. The detailed literature information is shown in Table 2.
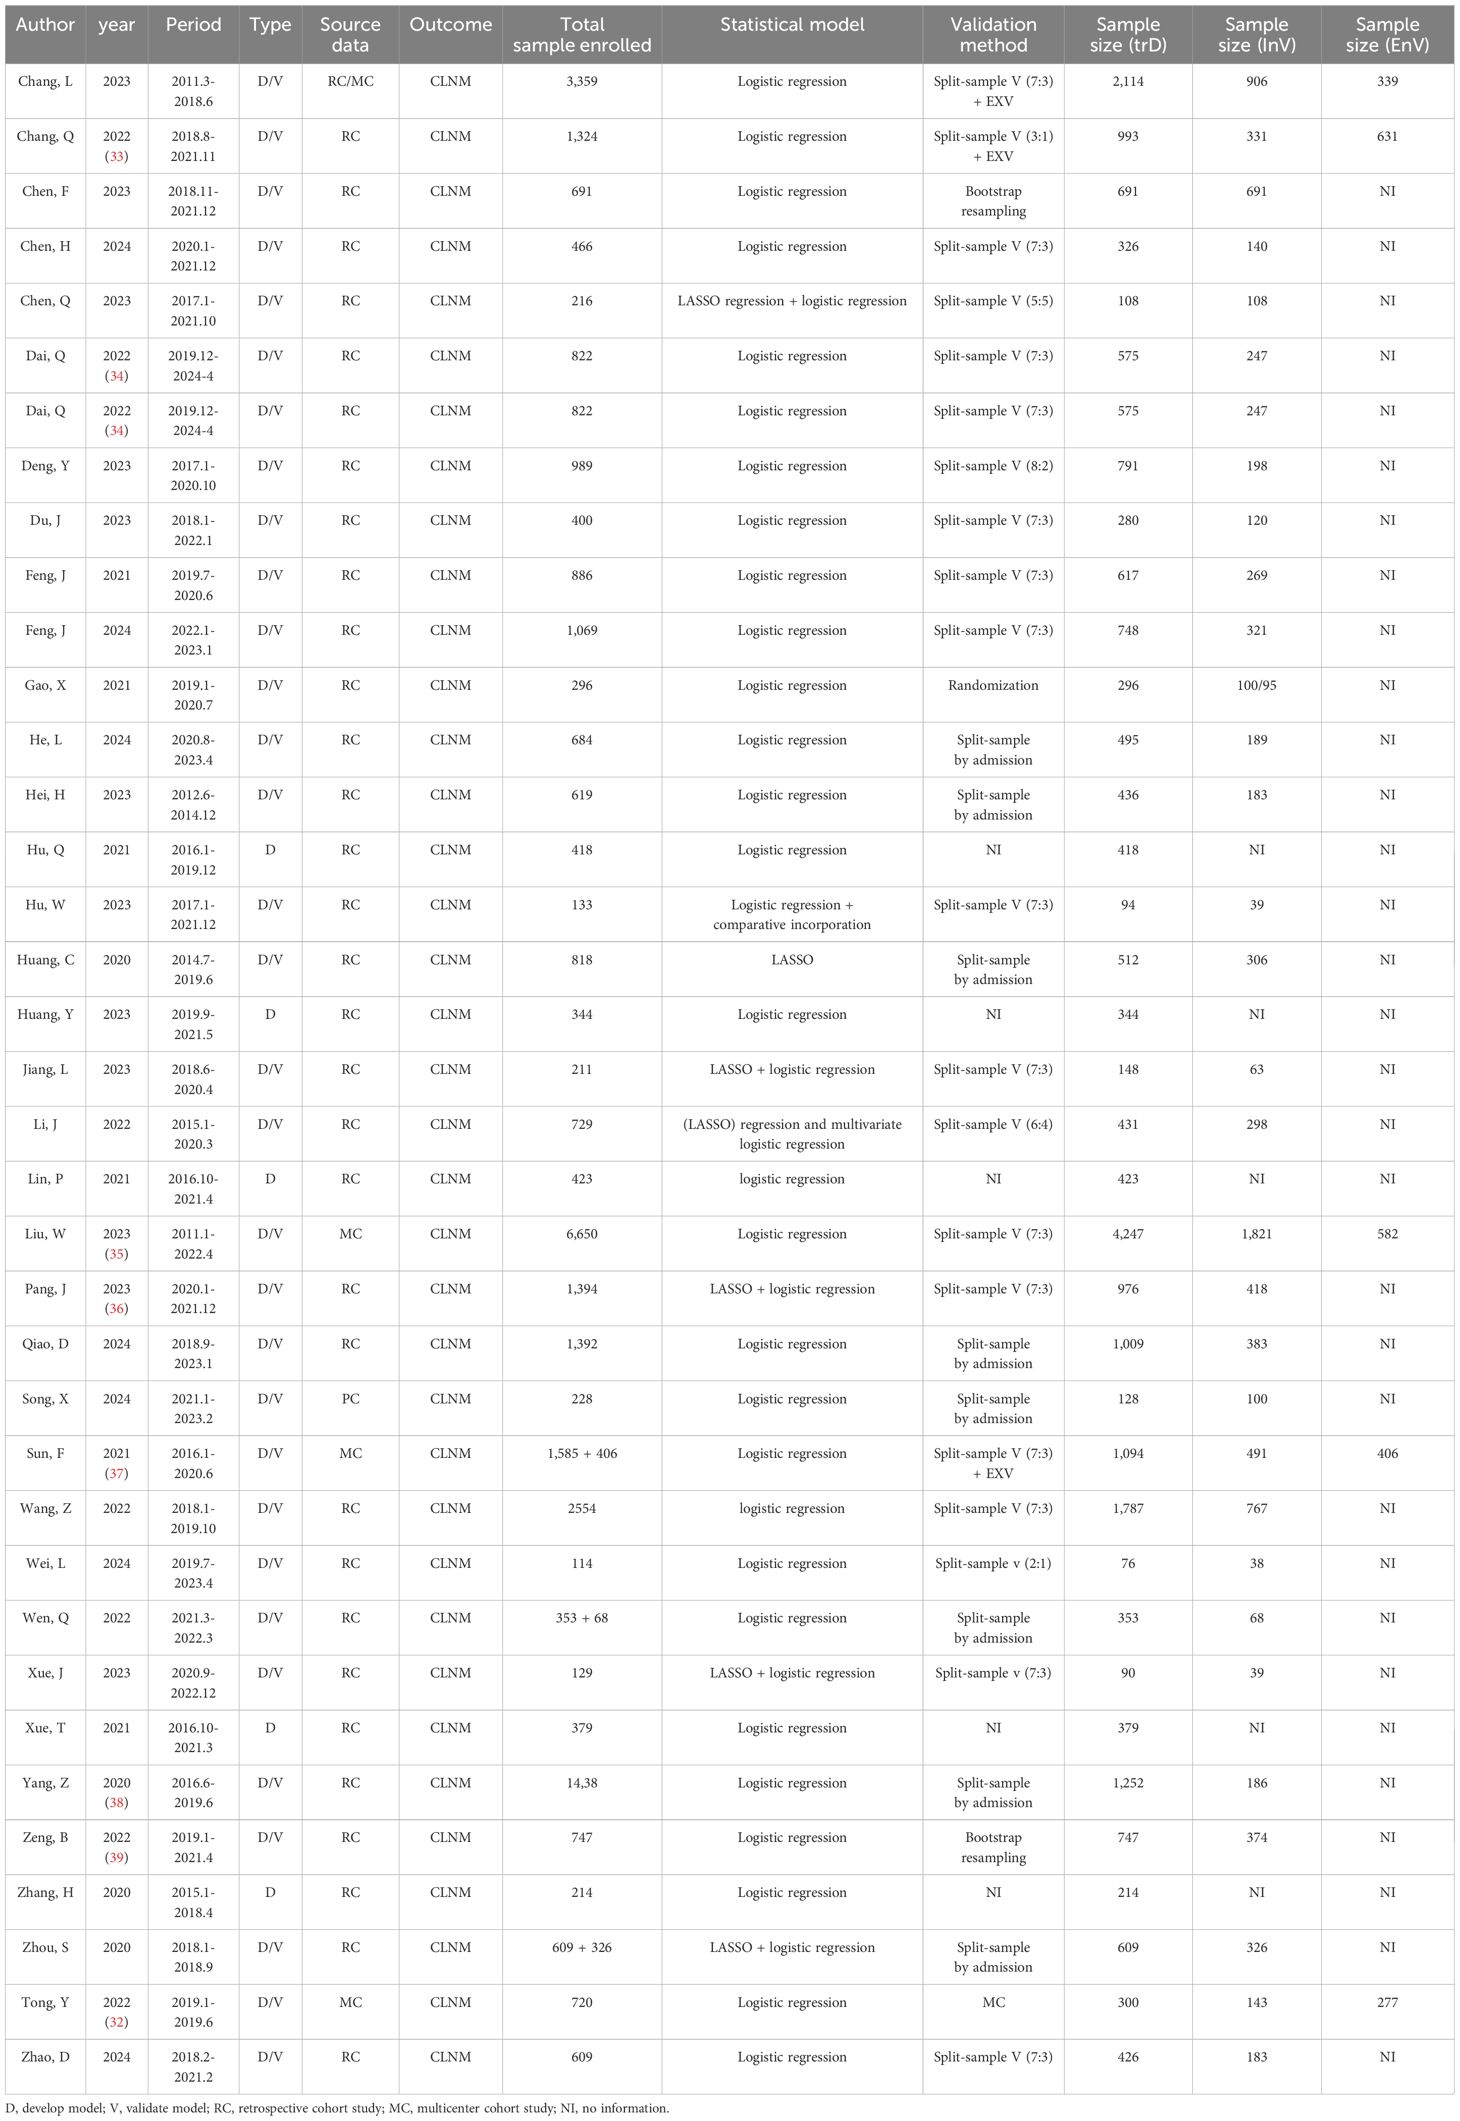
Table 2. Summary of the publications included in the systematic review, highlighting paper information and nomogram prediction outcome (CLNM).
In the LLNM group, more than 17,673 patients were enrolled in the development group, while 6,348 were used in the validation group, of which 2,103 were utilized for external validation. All studies were conducted within the Chinese population. Internal validation was applied in 15 studies. Specifically, seven studies employed split samples in varying proportions, and bootstrap validation was implemented in three studies (including four nomograms). Only one study utilized internal multicenter validation (32). Although two studies (three nomograms) included internal validation cohorts, we did not find specific instructions in the articles (40, 41). Eight studies conducted external validation. The external validation cohort was derived from splitting different samples and multicenter studies. The detailed information above is shown in Table 3.
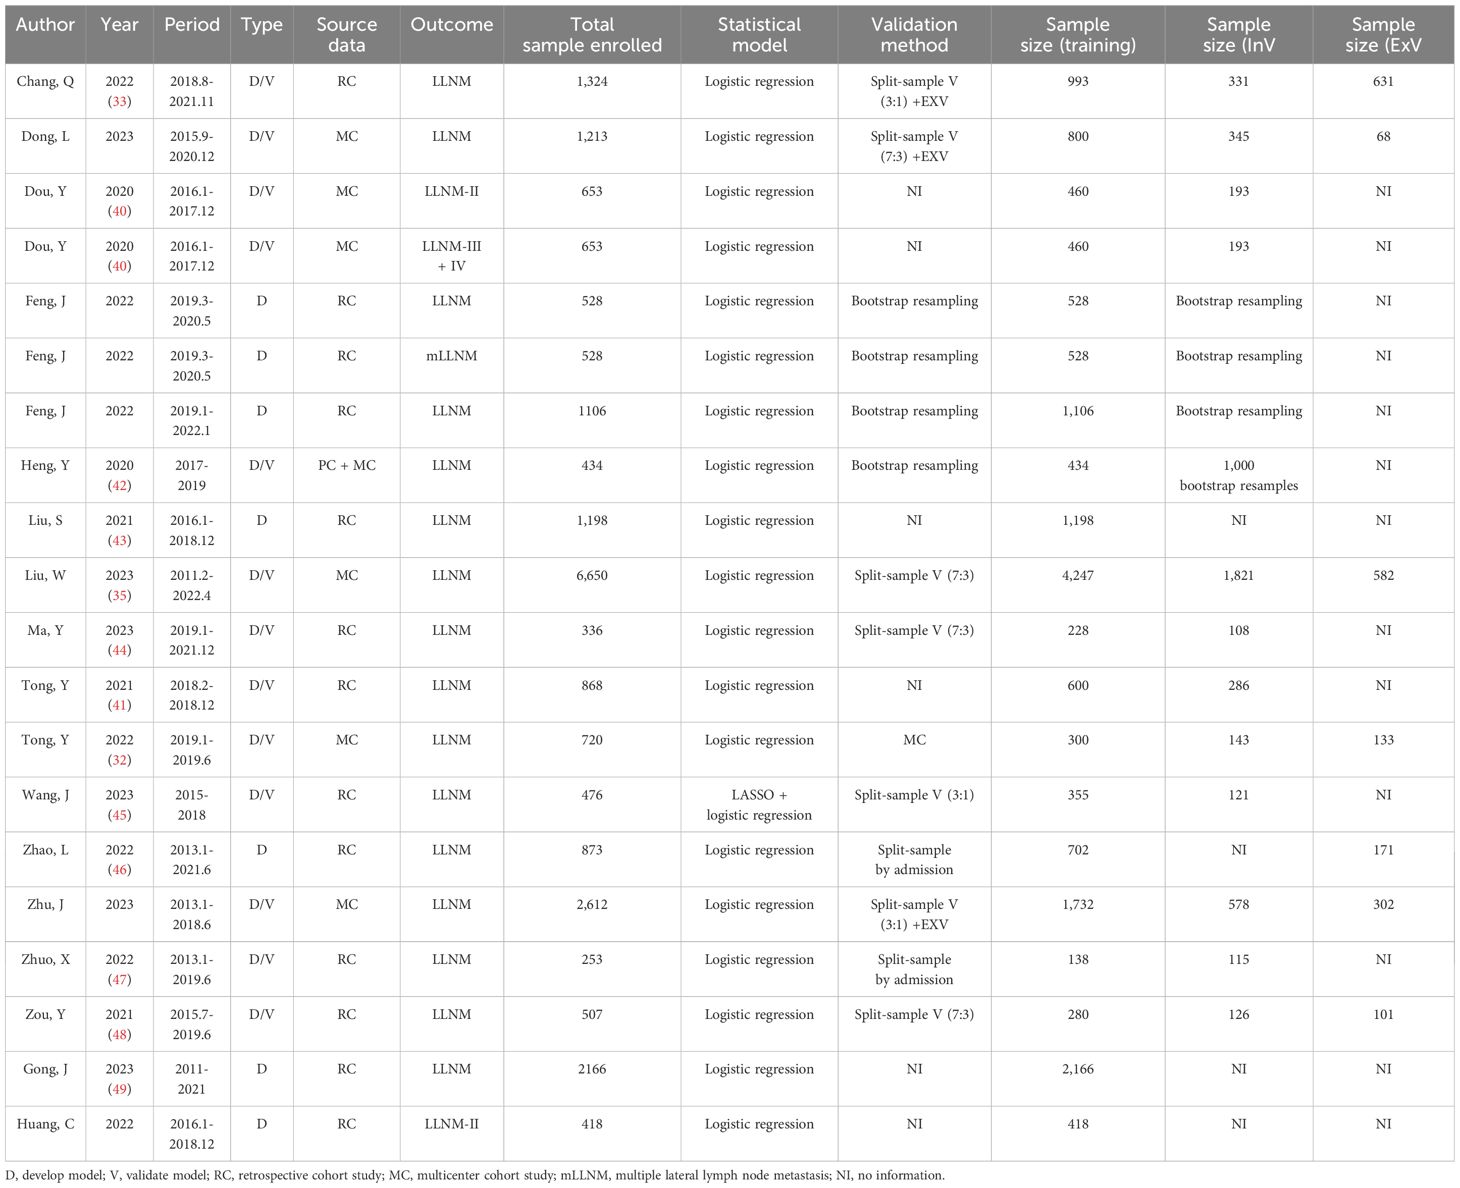
Table 3. Summary of the publications included in the systematic review, highlighting paper information and nomogram prediction outcome (LLNM).
3.2 Risk of bias assessment in included studies
For CLNM group training studies (Table 4, Figures 2A, B), the overall risk of bias (ROB) was high in 34 out of 37 studies, primarily due to the unreliability of the analysis domain (34/37). Additionally, the data sources and inclusion/exclusion criteria of the studies also posed a high risk of bias. Applicability addresses how relevant the included articles are to the review questions. The overall applicability of development studies was unclear in six out of 37 studies, mainly because of inconsistencies in participant domains (3/37), predictors (2/37), and outcomes (3/37).
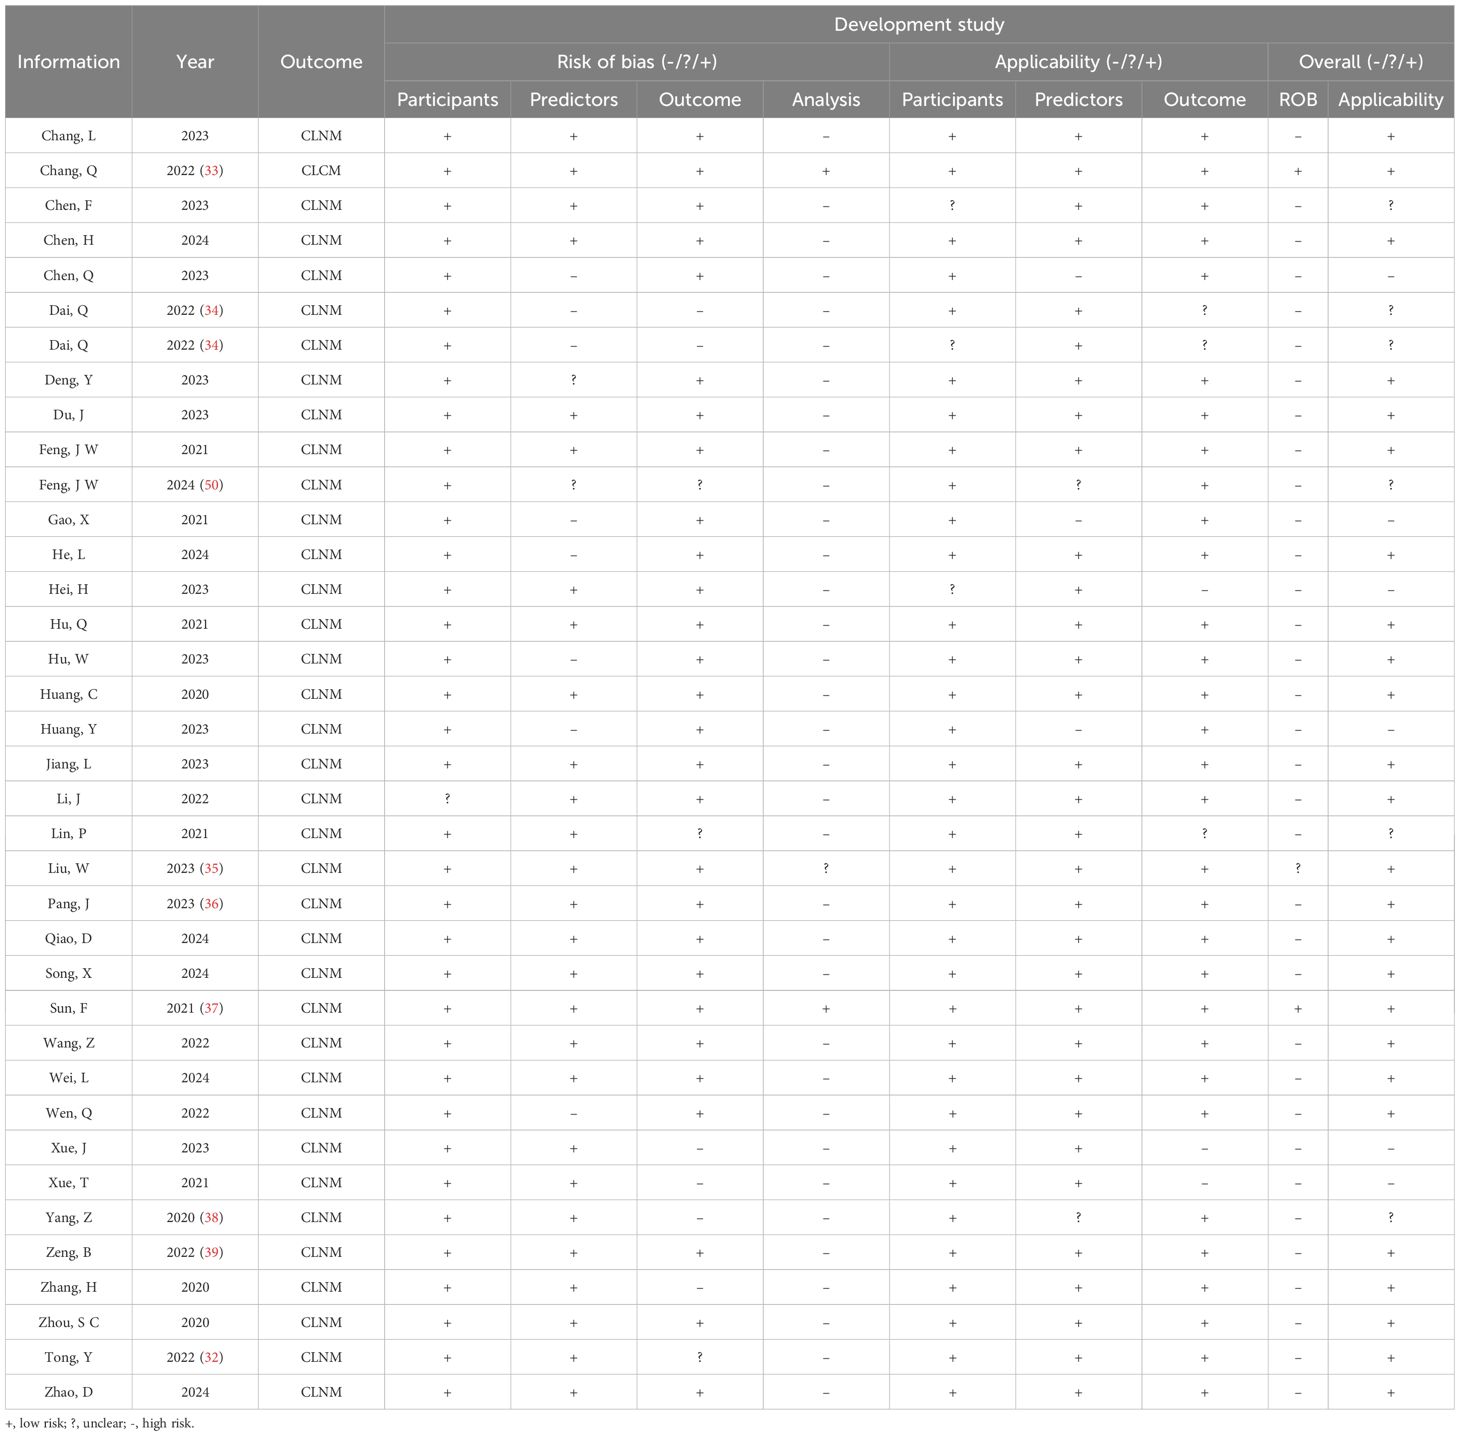
Table 4. PROBAST risk of bias of the CLNM group.
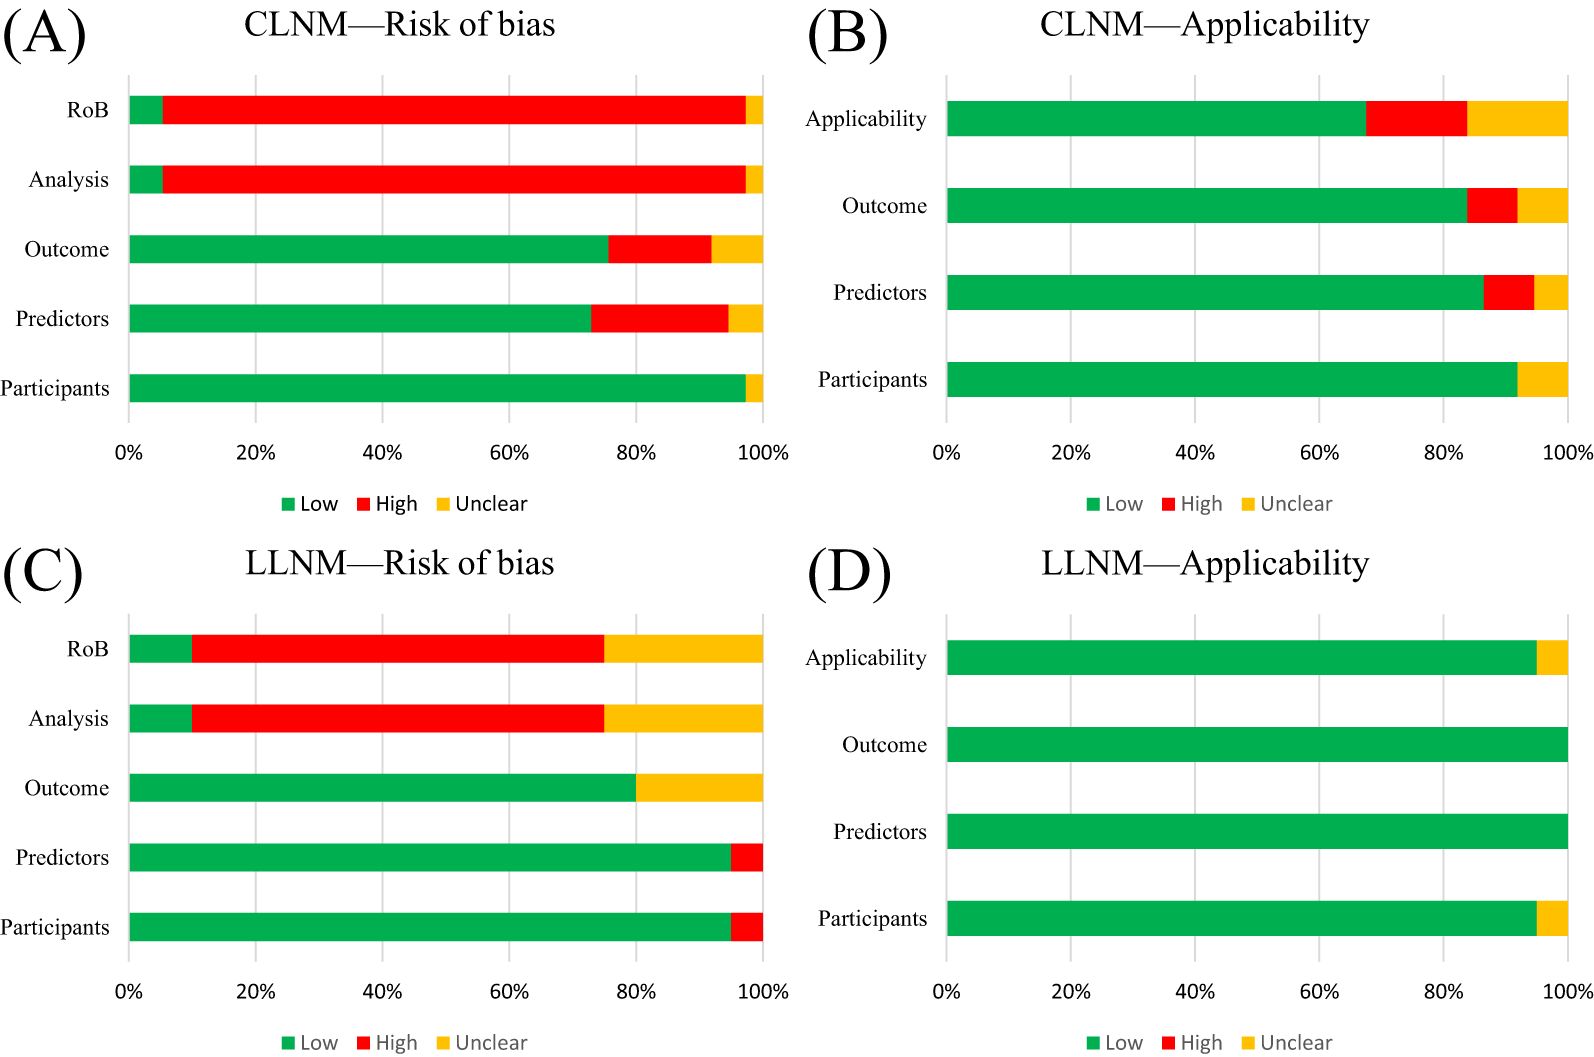
Figure 2. PROBAST summary for all nomogram development. (A) PROBAST risk of bias for CLNM included models. (B) Applicability of those included in the CLNM model systematic review. (C) PROBAST risk of bias for LLNM included models. (D) Applicability of those included in LLNM model systematic review.
For the LLNM group development studies (Table 5, Figures 2C, D), the overall risk of bias (ROB) was high in 13 out of 20 due to incompatibilities in those analysis domains. The overall applicability of development studies was low risk in 19 out of 20. The articles included in the LLNM group addressed the review questions. Overall, the applicability of the LLNM group development studies was good.
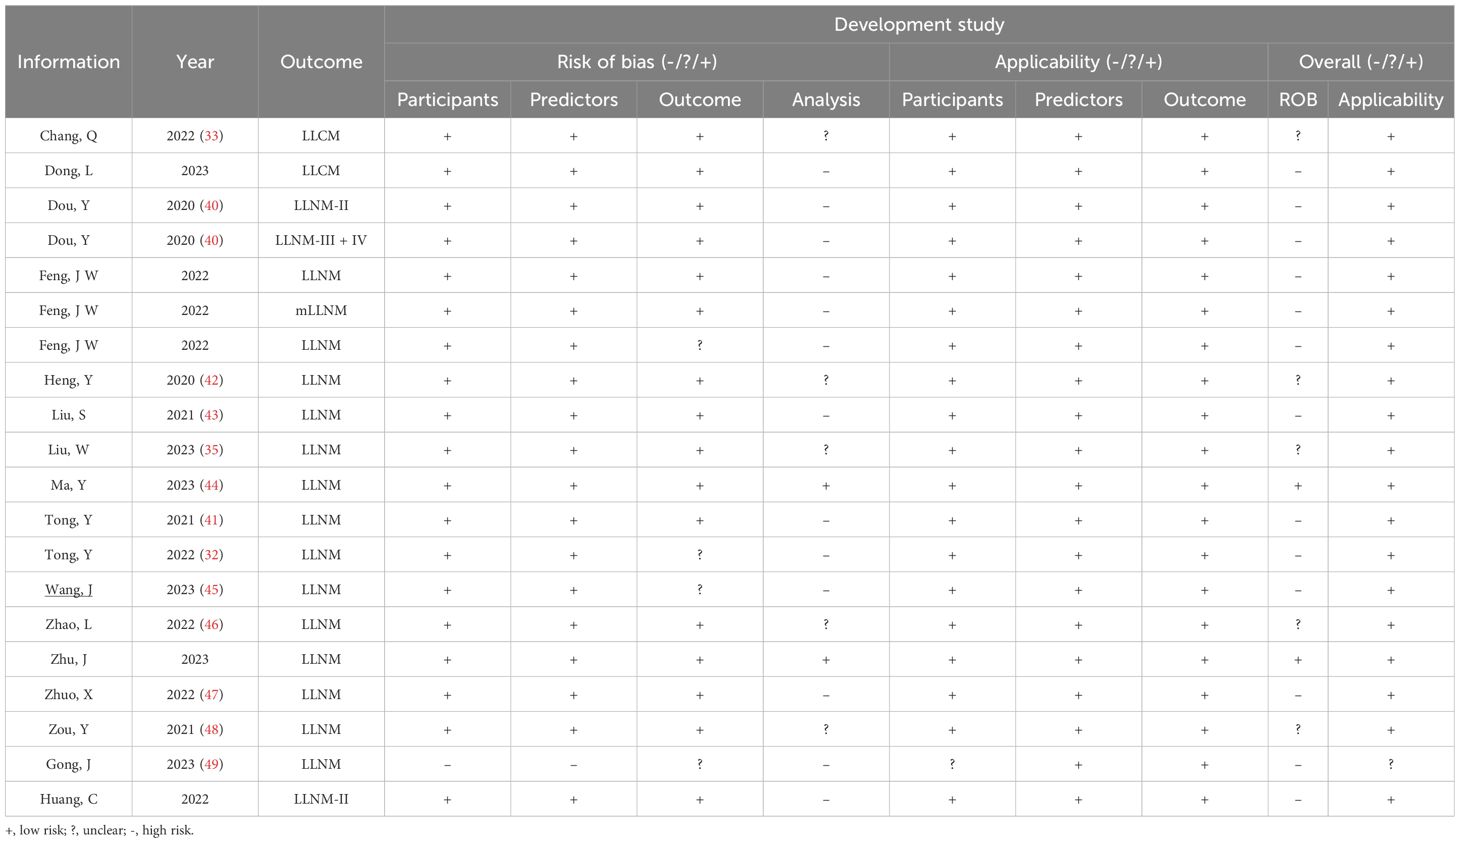
Table 5. PROBAST risk of bias of the LLNM group.
The predictive model, which lacked discussion on model fitting, calibration evaluation, and DCA curves, resulted in a high risk of bias (ROB) for the analysis domain. Furthermore, most validation studies did not report missing data or update the nomograms. Meanwhile, the assessment of risk stratification was carried out on a blank board. We also conducted PROBAST ROB and TRIPOD + AI assessments of external validation cohort studies to visually present the results. The detailed table is available in Supplementary Material S4.
3.3 Nomogram predictors
3.3.1 CLNM group
In most studies, age, gender, tumor diameters or size, location, multifocality, and capsular invasion or ETE were analyzed. We examined risk factors by collecting standard categorical variables from the included literature. ETE (OR, 95% CI, 2.644, 2.644, 1.781–3.924), TCI (3.541, 3.541, 2.475–5.067), multifocality (2.387, 2.387, 1.961–2.90), and tumor size (3.087, 3.087, 2.647–3.599) are identified risk factors for CLNM (Figure 3A). All nomograms were constructed using multivariate logistic regression. Overall, four and 22 factors were included in the univariate and multivariate analyses, respectively. A minimum of three (32) predictors and a maximum of 10 (36) predictors were displayed in the nomograms. We summarized the frequency of common risk factors (Supplementary Material S5). Interestingly, almost all studies incorporated US information. Some studies adopted LASSO regression based on image features to provide more details compared to the malignant features observed in ultrasound of TC. Some studies obtained combined scores by integrating relevant characteristics and risk factors. The laboratory tests used in the nomograms mainly consisted of thyroid function tests. For complete details of the risk factors for the CLNM-group nomograms, see Supplementary Materials S5 and S6.
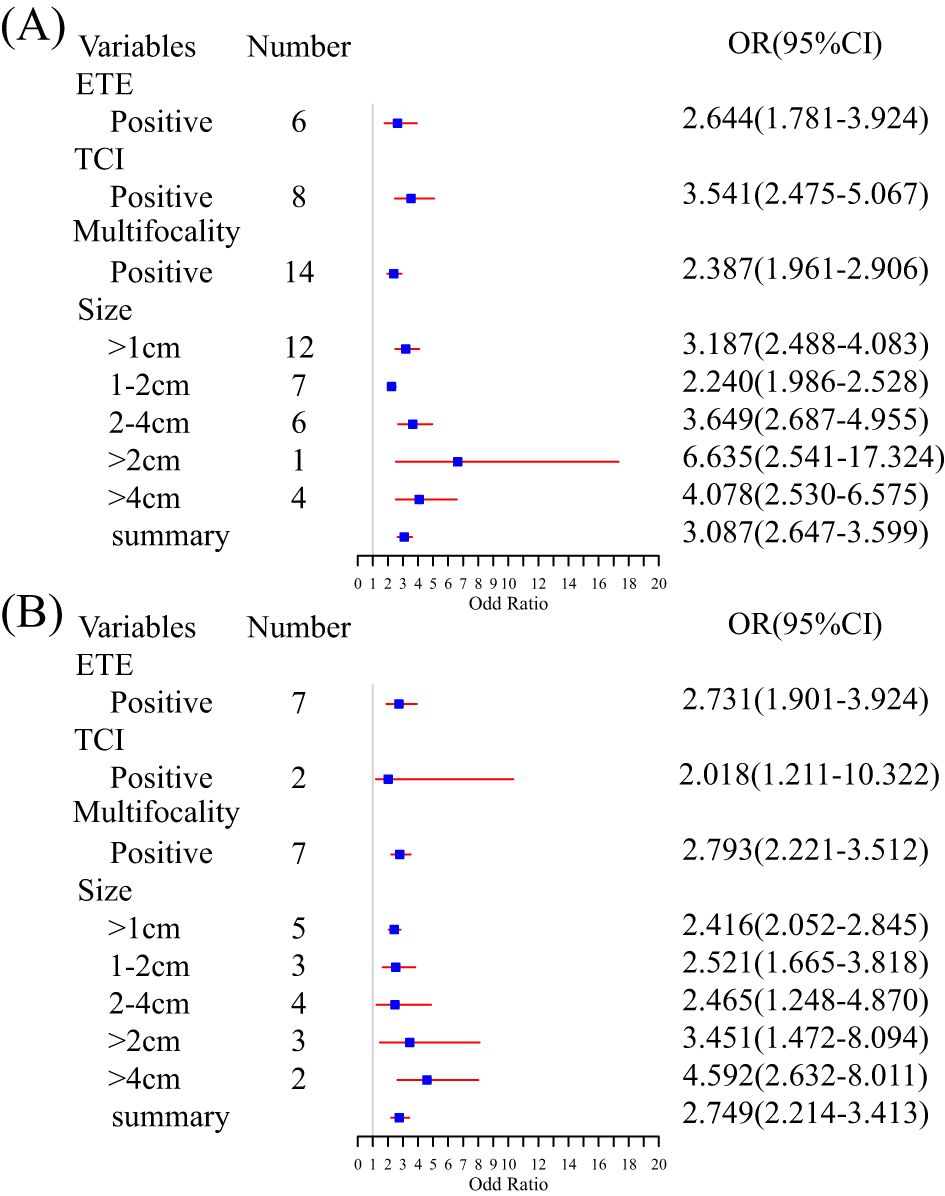
Figure 3. Summary meta-analysis forest plot for several standard predictor variables: (A) subgroup analysis of risk factors for CLNM and (B) subgroup analysis of risk factors for LLNM.
3.3.2 LLNM group
Age, gender, tumor size or diameter, central lymph node status, location, and multifocality were analyzed in all included studies. ETE (OR, 95% CI, 2.731, 2.731, 1.901–3.924), TCI (2.018, 2.018, 1.211–10.322), and multifocality (2.793, 2.793, 2.221–3.512) were examined. An increasing tumor diameter suggested a high risk of LNM (>1 cm vs. >2 cm vs. >4 cm, 2.416, 2.416, 2.052–2.845 vs. 3.451, 3.451, 1.472–8.094 vs. 4.592, 4.592, 2.632–8.011) (Figure 3B). Multivariate logistic regression analysis was used in all models to identify independent risk factors. A minimum of two (46) and a maximum of 11 predictors (45) were shown in nomograms. The image features from the US and CT allowed many predictors to be displayed in the nomograms. Although laboratory indicators were included in five studies, only four predictors, such as PS-Tg ≥30.175 ng/mL, serum TSH ≥ 2.910 uIU/mL, SIC > 45 Ug/L, and SII (33, 35, 45, 46) were verified as independent risk factors. For complete details of the risk factors for LLNM group nomograms, see Supplementary Materials S5 and S6.
3.3.3 Nomogram performance
The C-index for developing CLNM studies ranged from 0.703 (39) to 0.960 (95% CI, 0.947–0.972) (50), with the majority concentrated in the 0.75–0.9 range, suggesting good model prediction performance (C-index >0.7). The C-index of the external validation studies ranged from 0.734 (35) to 0.923 (95% CI, 0.893–0.947) (37). Although 28 studies reported the DCA analysis, its efficacy was challenging to accept. Almost all studies provided calibration curves. However, few studies reported calibration performance and p-values. All studies with external validation included calibration curves as well as DCA, yet few studies reported calibrated slopes and/or intercepts, making it difficult to gather data for analysis.
The C-index of the developed LLNM nomograms ranged from 0.702 (95% CI, 0.667–0.736) (49) to 0.956 (95% CI, 0.925–0.986) (47). The internal validation C-index ranged from 0.731 (95% CI, 0.635–0.827) (44) to 0.914 (95% CI: 0.842–0.987) (41). The C-index of the external validation studies ranged from 0.762 (35) to 0.915 (95% CI, 0.862–0.967) (47). The prediction performance of the developed nomogram was good (>0.7). Calibration was performed in 18 studies, and 12 studies reported DCA. Compared to the external validation of the nomogram for the CLNM group, all LLNM groups with external validation provided calibration plots (regardless of internal or external validation), and only one did not assess the DCA curves. Few of the included studies reported calibrated slopes and/or intercepts, while none reported observed/expected ratios, making it challenging to assess in a meta-analysis and validate quantitatively in the clinical cohort. Supplementary Material S7 summarizes the performance and calibration of the nomograms.
3.4 Meta-analysis
We performed a subgroup analysis based on model characteristics. Models that included biochemical tests and non-uniform metrics demonstrated greater heterogeneity, which led to their exclusion. Ultrasound was the most frequently incorporated feature in the models. The pooled C-index for CLNM-US and LLNM-US was 0.80 (95% CI, 0.76–0.84) and 0.78 (0.73–0.82), respectively (Figure 4A). The ultrasound model for predicting CLNM showed excellent performance, while the 95% CI for LLNM-US was 0.73 (less than 0.75), indicating moderate predictive efficacy. The model combined with radiomics enhanced the effectiveness of the CLNM-RS and LLNM-RS summary C-index, which were 0.88 (0.79–0.93) and 0.90 (0.83–0.95) (Figure 4A), respectively, both demonstrating excellent predictive efficacy. We collected and carried out a subgroup analysis for sensitivity and specificity in the included models. Similarly, both outcomes combined with the radiomics group exhibited better performance in sensitivity and specificity (Figures 4B, C). A comprehensive evaluation of multi-source detection methods proved more conducive to detecting LNM. Additionally, the external validation group models demonstrated excellent predictive efficacy (Supplementary Material S8). However, in the CLNM EX group, the combination of four nomograms resulted in wide 95% prediction intervals, indicating the impact of random error and uncertainty in the model parameters. All of the detailed information can be found in Supplementary Materials S7 and S8.
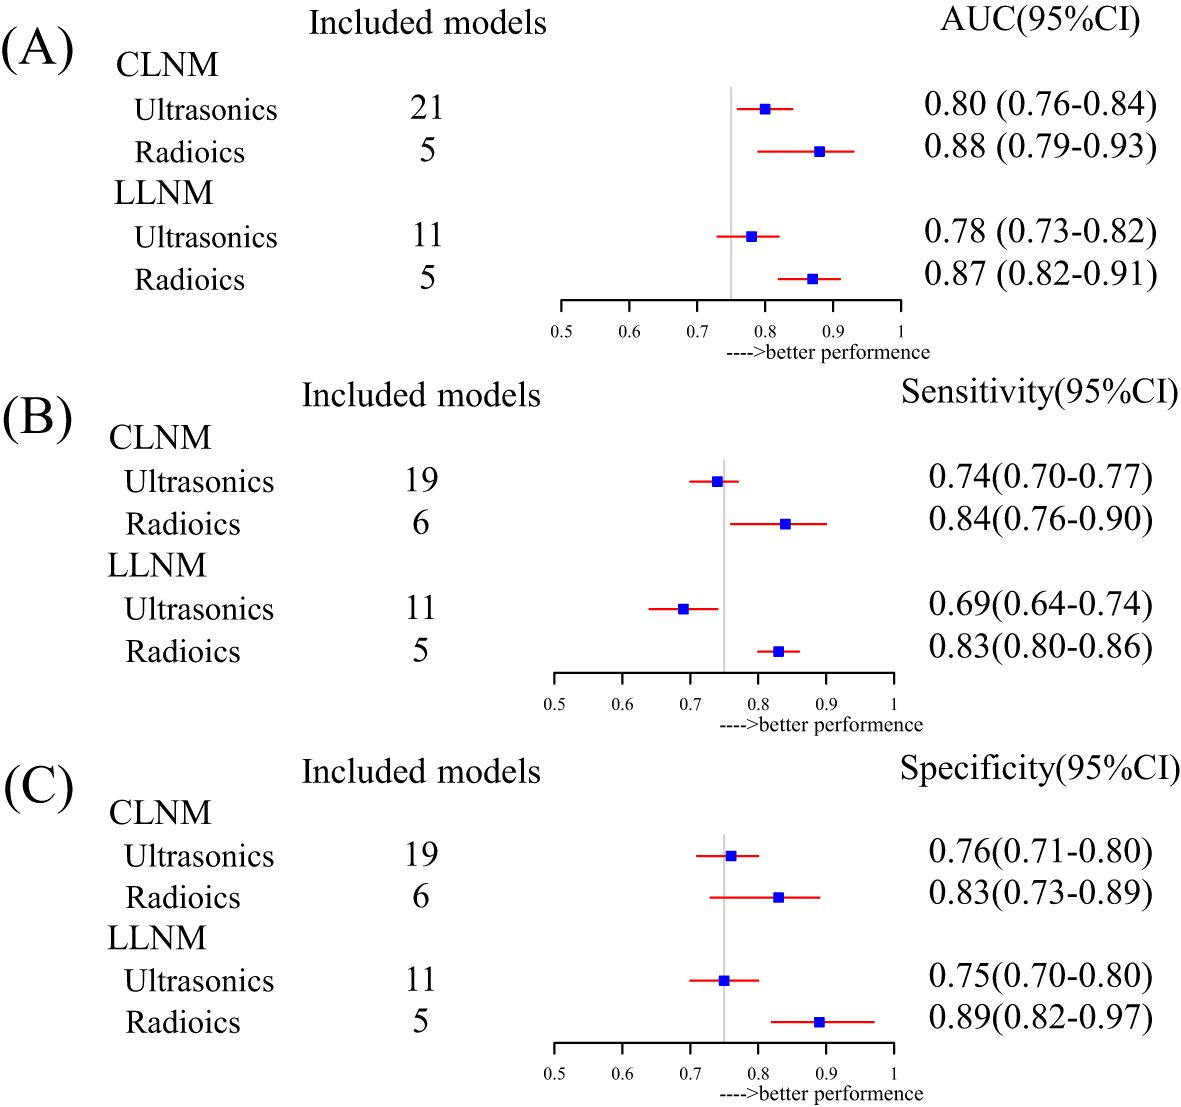
Figure 4. Subgroup summary evaluation of model efficacy for different outcomes: (A) forest plot for pooled AUC based on inclusion factor classification, (B) forest plot for pooled sensitivity based on inclusion factor classification, and (C) forest plot for pooled specificity based on inclusion factor classification.
4 Discussion
The nomogram model serves as a visual tool for surgeons in their decision-making process. However, as of the submission of this article, no official guidelines exist for grading and applying predictive models. In our work, we performed a systematic review and meta-analysis of nomograms used to predict LNM in PTC within a real-world Chinese context. We systematically summarized the nomograms based on clinical data, identified those suitable for further research, provided personalized recommendations for individual patients, and offered valuable reference tools for clinical practice.
Based on the inclusion and exclusion criteria, 57 nomograms of predictive models were selected. The results of this review demonstrate that most predictive models were single-center retrospective studies and were modeled and validated simultaneously. Recently, a meta-study has shown that the model performance based on logistic regression was considered satisfactory (51). Univariate and multivariate logistic regression analyses are the most common methods for screening variables and constructing models in this review. The CLNM rate of PTC is more than 50% (52, 53), and the LLNM rate is approximately 20% (54). The included research on the LNM rate was broadly consistent with the conclusions.
We summarized the frequency of standard variables included in the review. Age and tumor size or diameter were the most common independent risk factors. Younger patients are at a high risk for LNM, and the findings confirmed the previous conclusions (34, 42). Nevertheless, there is controversy over the age demarcation between 45 and 55 years. The difference in clinical staging between the seventh and eighth editions of the AJCC guidelines has led to this debate. Few studies have focused on the population within this interval (7, 8). Previous research demonstrated a positive correlation between tumor diameters and the risk of LNM; tumor size indicated tumor aggressiveness (55). However, the AJCC guidelines emphasize age and distant metastasis-oriented TNM staging criteria (7). Multifocality, capsular invasion, and ETE have been verified by many studies to be positively correlated with thyroid LNM (38, 43, 48), consistent with the results of our pooled meta-analysis (Figure 3). Simultaneously, some studies have suggested a potential correlation with prognosis (56, 57). Some predictive models incorporated biochemical analysis, such as Tg, Tg-Ab, and SII (33, 35, 45, 46), but they were limited in their ability to predict metastasis and were primarily used to study prognosis. High-risk pathological subtypes, lymph node metastasis count and size, and extranodal extension have been regarded as risk factors associated with disease recurrence and prognosis as supported by studies (58–60). Nonetheless, due to the limitations of the original research, most data failed to adequately cover these key variables. Novel and effective biomarkers are needed for PTC and LNM diagnosis.
In contrast to Maria’s study (61), random-effects models were used for this meta-analysis to explain heterogeneity. The meta-analysis findings validate that ultrasound has moderate to good predictive efficacy (pooled AUC, sensitivity, and specificity) for CLNM, which is better than LLNM (Figure 4). The model’s efficacy and the incorporation of radiomics were greater than that of the single model (Figure 4). Multi-omics predictive models have better predictive performance than a single model. Similarly, Liu’s study identified logistic regression as the best method for LNM of TC models (51). More importantly, our analysis highlights the overall potential of nomogram models as predictive tools for LNM in TC and the need for further research efforts. However, in many predictive models, the absence of external validation is a prevalent issue that greatly hinders the generalization of their findings and deters the application of nomograms in clinical practice.
The present study shows that 34/37 and 13/20 of the overall ROB of included studies had a high risk, respectively (Figure 2, Tables 4, 5). We reviewed the reasons and limitations of the high-risk studies. First, the participants’ domain, comprising the majority of populations included in this systematic review, derived from single-central or multicentral retrospective cohort studies, which made it challenging to avoid selection bias. Additionally, predictors predominantly came from clinical detection or composite indicators. Converting continuous variables to categorical variables according to the guidelines, such as age or tumor size, neglected the distribution characteristics of these variables, which, in turn, increased the risk of information bias. In the outcome domain, the results from the included studies were not entirely uniform, and differences in stage and LNM region could affect the performance of pooled models. Most studies reported calibration curves, whereas only a minority included Hosmer–Lemeshow test results and calibration metrics, which may lead to an overestimation of accurate event rates. We were unable to assess the overall calibration of the nomograms, and evaluating the degree of model fit was challenging in the literature.
The significant diversity among nomograms, combined with a serious shortage of external validation studies, has limited its clinical application (62, 63). Consequently, it remains uncertain whether and how patients and clinicians could benefit from using nomograms. Ultimately, although the initial search strategy identified 2,835 articles, all non-Chinese studies did not meet the inclusion criteria, possibly due to the relatively low proportion of relevant studies in other countries. Nonetheless, we present the heat map of China, intending to recommend that local doctors adopt models appropriate for the level of diagnosis and treatment. This work provides new insights and perspectives. With the rapid advancement of various model algorithms and artificial intelligence applications in hospitals, nomograms, as an early approach for model integration, have gained widespread acceptance. Furthermore, the development of web-based prediction models enhances their broader application in clinical practice. Influenced by artificial intelligence, integrating models with electronic medical records (EMRs) not only improves usability but also significantly boosts the accuracy of predictions. Integrating models into electronic health records or clinical pathways would be beneficial.
Multi-centric data and comprehensive validation methods are crucial to develop predictive models. A significant number of validations of the same model enhance its effectiveness for future quantitative analysis. This study aims to identify gaps in predictive model research, particularly emphasizing the lack of established guidelines. Given the potential for bias in many studies, clinical decision-making would benefit from the incorporation of prospective validation studies to support more robust and reliable conclusions. In this context, prospective cohort studies were conducted to improve the level of evidence and provide visual reference tools and new insights for clinicians and medical guidelines in China.
5 Conclusions
The feature-combined model is better suited for use in Chinese clinical practice than the LNM of PTC. Despite demonstrating excellent discrimination accuracy of prediction models, significant heterogeneity has limited the application of uninformed predictive nomograms. At the same time, the systematic review offers reference tools for physicians to choose appropriate nomograms based on individual clinical needs in China. Future research should focus on external validation and assessment of clinical utility to effectively translate the nomogram into clinical practice rather than solely for research purposes.
Author contributions
YW: Formal analysis, Data curation, Visualization, Conceptualization, Writing – original draft, Software, Writing – review & editing, Investigation. SY: Writing – original draft, Software, Visualization, Validation, Data curation. YZ: Supervision, Software, Data curation, Validation, Investigation, Writing – review & editing. NM: Validation, Writing – review & editing, Investigation. ZW: Writing – review & editing, Supervision, Funding acquisition, Project administration, Validation.
Funding
The author(s) declare that financial support was received for the research and/or publication of this article. This study was supported by the National Social Science Fund of China (no. 21BRK022).
Conflict of interest
The authors declare that the research was conducted in the absence of any commercial or financial relationships that could be construed as a potential conflict of interest.
Generative AI statement
The author(s) declare that no Generative AI was used in the creation of this manuscript.
Publisher’s note
All claims expressed in this article are solely those of the authors and do not necessarily represent those of their affiliated organizations, or those of the publisher, the editors and the reviewers. Any product that may be evaluated in this article, or claim that may be made by its manufacturer, is not guaranteed or endorsed by the publisher.
Supplementary material
The Supplementary Material for this article can be found online at: https://www.frontiersin.org/articles/10.3389/fendo.2025.1617563/full#supplementary-material
Abbreviations
A/P, capsular abutment-to-lesion perimeter ratio; A/T, height divided by width on transverse views; ADC, apparent diffusion coefficient; AJCC, American Joint Committee on Cancer; ATA, American Thyroid Association; BMI, Body Mass Index; CEA, carcinoembryonic antigen; CI, Confidence Interval; CLN, found suspicious central lymph nodes; CLNR, central lymph node ratio, CLT, chronic lymphocytic thyroiditis; Cr, creatinine; CT, computed tomography; DCA, decision curve analysis; dNLR, derived neutrophil-to-lymphocyte ratio; DTC, differentiated thyroid cancer; ELN, enlarged lymph nodes; ETE, extrathyroidal extension; FNA, fine-needle aspiration; FT3, free triiodothyronine; FT4, free tetraiodothyronine; HT, Hashimoto’s thyroiditis; IC, iodine concentration; LLN CDFI, lateral lymph node color Doppler flow imaging; LLN, lateral lymph node found suspicious; LND, lymph node dissection; LNM, lymph node metastasis; LNR, lymph node ratio; MLR, monocyte-to-lymphocyte ratio; NCCN, National Comprehensive Cancer Network; NIC, normalized iodine concentration; NLR, neutrophil-to-lymphocyte ratio; O/E ratios, Observed-to-expected ratio; pCND, prophylactic central neck dissection; PET, Positron emission tomography; PI, Prediction Interval; PLR, platelet-lymphocyte ratio; pND, Prophylactic neck dissection; PNI, prognostic nutritional index; PROBAST, Prediction model Risk of Bias Assessment Tool; PTC, papillary thyroid carcinoma; Rad-score, Radiomics-score; RoB, risk of bias; ROC, receiver-operating characteristic; SII, systemic immune-inflammatory index; SIRI, systemic inflammation response index; TCI, Thyroid capsular invasion, Tg, thyroglobulin; TgAb, thyroglobulin antibodies; TI-RADS, Thyroid Imaging Reporting and Data System; TPOAb, thyroid peroxidase antibodies; TSH, thyroid-stimulating hormone; λHU, the slope of energy spectrum curve.
References
1. Li M, Hu M, Jiang L, Pei J, and Zhu C. Trends in cancer incidence and potential associated factors in China. JAMA Netw Open. (2024) 7:e2440381. doi: 10.1001/jamanetworkopen.2024.40381
2. Han B, Zheng R, Zeng H, Wang S, Sun K, Chen R, et al. Cancer incidence and mortality in China, 2022. J Natl Cancer Cent. (2024) 4:47–53. doi: 10.1016/j.jncc.2024.01.006
3. Kobaly K, Kim CS, and Mandel SJ. Contemporary management of thyroid nodules. Annu Rev Med. (2022) 73:517–28. doi: 10.1146/annurev-med-042220-015032
4. Wong R, Farrell SG, and Grossmann M. Thyroid nodules: diagnosis and management. Med J Aust. (2018) 209:92–8. doi: 10.5694/mja17.01204
5. Gao Y, Wang W, Yang Y, Xu Z, Lin Y, Lang T, et al. An integrated model incorporating deep learning, hand-crafted radiomics and clinical and us features to diagnose central lymph node metastasis in patients with papillary thyroid cancer. BMC Cancer. (2024) 24:69. doi: 10.1186/s12885-024-11838-1
6. China NHCotPsRo. Guidelines for the diagnosis and treatment of thyroid carcinoma. Chin J Pract Surg. (2022) 42:1343–57 + 63. doi: 10.19538/j.cjps.issn1005-2208.2022.12.02
7. Amin MB, Greene FL, Edge SB, Compton CC, Gershenwald JE, Brookland RK, et al. The eighth edition ajcc cancer staging manual: continuing to build a bridge from a population-based to a more “Personalized” Approach to cancer staging. CA Cancer J Clin. (2017) 67:93–9. doi: 10.3322/caac.21388
8. Edge SB and Compton CC. The american joint committee on cancer: the 7th edition of the ajcc cancer staging manual and the future of tnm. Ann Surg Oncol. (2010) 17:1471–4. doi: 10.1245/s10434-010-0985-4
9. Palestini N, Borasi A, Cestino L, Freddi M, Odasso C, and Robecchi A. Is central neck dissection a safe procedure in the treatment of papillary thyroid cancer? Our experience. Langenbecks Arch Surg. (2008) 393:693–8. doi: 10.1007/s00423-008-0360-0
10. Wu HW and Liu YH. 2012 Nccn guideline interpretation of the differentiated thyroid carcinoma. Zhonghua Wai Ke Za Zhi. (2012) 50:675–7. doi: 10.3760/cma.j.issn.0529-5815.2012.08.002
11. Haddad RI, Nasr C, Bischoff L, Busaidy NL, Byrd D, Callender G, et al. Nccn guidelines insights: thyroid carcinoma, version 2.2018. J Natl Compr Canc Netw. (2018) 16:1429–40. doi: 10.6004/jnccn.2018.0089
12. Haugen BR, Alexander EK, Bible KC, Doherty GM, Mandel SJ, Nikiforov YE, et al. 2015 American thyroid association management guidelines for adult patients with thyroid nodules and differentiated thyroid cancer: the american thyroid association guidelines task force on thyroid nodules and differentiated thyroid cancer. Thyroid. (2016) 26:1–133. doi: 10.1089/thy.2015.0020
13. Filetti S, Durante C, Hartl D, Leboulleux S, Locati LD, Newbold K, et al. Thyroid cancer: esmo clinical practice guidelines for diagnosis, treatment and follow-up†. Ann Oncol. (2019) 30:1856–83. doi: 10.1093/annonc/mdz400
14. Bakuła-Zalewska E, Żyłka A, Długosińska J, Musiał E, Gałczyński J, and Dedecjus M. Thyroglobulin measurements in washouts of fine-needle aspiration biopsy in the monitoring of patients with differentiated thyroid carcinoma. Endokrynol Pol. (2021) 72:601–8. doi: 10.5603/EP.a2021.0077
15. Zhao H and Li H. Meta-analysis of ultrasound for cervical lymph nodes in papillary thyroid cancer: diagnosis of central and lateral compartment nodal metastases. Eur J Radiol. (2019) 112:14–21. doi: 10.1016/j.ejrad.2019.01.006
16. Albuck AL, Issa PP, Hussein M, Aboueisha M, Attia AS, Omar M, et al. A combination of computed tomography scan and ultrasound provides optimal detection of cervical lymph node metastasis in papillary thyroid carcinomas: A systematic review and meta-analysis. Head Neck. (2023) 45:2173–84. doi: 10.1002/hed.27451
17. Zhang Y, Lu YY, Li W, Zhao JH, Zhang Y, He HY, et al. Lymphatic contrast-enhanced us to improve the diagnosis of cervical lymph node metastasis from thyroid cancer. Radiology. (2023) 307:e221265. doi: 10.1148/radiol.221265
18. Wang Y, Duan Y, Zhou M, Liu J, Lai Q, Ye B, et al. The diagnostic value of thyroglobulin in fine-needle aspiration of metastatic lymph nodes in patients with papillary thyroid cancer and its influential factors. Surg Oncol. (2021) 39:101666. doi: 10.1016/j.suronc.2021.101666
19. Xing Z, Qiu Y, Yang Q, Yu Y, Liu J, Fei Y, et al. Thyroid cancer neck lymph nodes metastasis: meta-analysis of us and ct diagnosis. Eur J Radiol. (2020) 129:109103. doi: 10.1016/j.ejrad.2020.109103
20. Piscopo L and Volpe F. Pet/ct imaging with radiolabeled fapi: new opportunities for diagnosis and treatment of thyroid cancer. Eur J Nucl Med Mol Imaging. (2024) 51:800–2. doi: 10.1007/s00259-023-06452-5
21. Yadav D, Shah K, Naidoo K, and Sudha Surasi DS. Pet/computed tomography in thyroid cancer. Neuroimaging Clin N Am. (2021) 31:345–57. doi: 10.1016/j.nic.2021.04.004
22. Schlumberger M and Leboulleux S. Current practice in patients with differentiated thyroid cancer. Nat Rev Endocrinol. (2021) 17:176–88. doi: 10.1038/s41574-020-00448-z
23. Santhanam P and Ladenson PW. Surveillance for differentiated thyroid cancer recurrence. Endocrinol Metab Clin North Am. (2019) 48:239–52. doi: 10.1016/j.ecl.2018.11.008
24. Efthimiou O, Seo M, Chalkou K, Debray T, Egger M, and Salanti G. Developing clinical prediction models: A step-by-step guide. Bmj. (2024) 386:e078276. doi: 10.1136/bmj-2023-078276
25. Damen JAA, Moons KGM, van Smeden M, and Hooft L. How to conduct a systematic review and meta-analysis of prognostic model studies. Clin Microbiol Infect. (2023) 29:434–40. doi: 10.1016/j.cmi.2022.07.019
26. Debray TP, Damen JA, Snell KI, Ensor J, Hooft L, Reitsma JB, et al. A guide to systematic review and meta-analysis of prediction model performance. Bmj. (2017) 356:i6460. doi: 10.1136/bmj.i6460
27. Page MJ, McKenzie JE, Bossuyt PM, Boutron I, Hoffmann TC, Mulrow CD, et al. The prisma 2020 statement: an updated guideline for reporting systematic reviews. Bmj. (2021) 372:n71. doi: 10.1136/bmj.n71
28. Snell KIE, Levis B, Damen JAA, Dhiman P, Debray TPA, Hooft L, et al. Transparent reporting of multivariable prediction models for individual prognosis or diagnosis: checklist for systematic reviews and meta-analyses (Tripod-srma). Bmj. (2023) 381:e073538. doi: 10.1136/bmj-2022-073538
29. Heus P, Damen J, Pajouheshnia R, Scholten R, Reitsma JB, Collins GS, et al. Poor reporting of multivariable prediction model studies: towards a targeted implementation strategy of the tripod statement. BMC Med. (2018) 16:120. doi: 10.1186/s12916-018-1099-2
30. Collins GS, Reitsma JB, Altman DG, and Moons KG. Transparent reporting of a multivariable prediction model for individual prognosis or diagnosis (Tripod): the tripod statement. Bmj. (2015) 350:g7594. doi: 10.1136/bmj.g7594
31. Kreuzberger N, Damen JA, Trivella M, Estcourt LJ, Aldin A, Umlauff L, et al. Prognostic models for newly-diagnosed chronic lymphocytic leukaemia in adults: A systematic review and meta-analysis. Cochrane Database Syst Rev. (2020) 7:Cd012022. doi: 10.1002/14651858.CD012022.pub2
32. Tong Y, Zhang J, Wei Y, Yu J, Zhan W, Xia H, et al. Ultrasound-based radiomics analysis for preoperative prediction of central and lateral cervical lymph node metastasis in papillary thyroid carcinoma: A multi-institutional study. BMC Med Imaging. (2022) 22:82. doi: 10.1186/s12880-022-00809-2
33. Chang Q, Zhang J, Wang Y, Li H, Du X, Zuo D, et al. Nomogram model based on preoperative serum thyroglobulin and clinical characteristics of papillary thyroid carcinoma to predict cervical lymph node metastasis. Front Endocrinol (Lausanne). (2022) 13:937049. doi: 10.3389/fendo.2022.937049
34. Dai Q, Liu D, Tao Y, Ding C, Li S, Zhao C, et al. Nomograms based on preoperative multimodal ultrasound of papillary thyroid carcinoma for predicting central lymph node metastasis. Eur Radiol. (2022) 32:4596–608. doi: 10.1007/s00330-022-08565-1
35. Liu W, Zhang D, Jiang H, Peng J, Xu F, Shu H, et al. Prediction model of cervical lymph node metastasis based on clinicopathological characteristics of papillary thyroid carcinoma: A dual-center retrospective study. Front Endocrinol (Lausanne). (2023) 14:1233929. doi: 10.3389/fendo.2023.1233929
36. Pang J, Yang M, Li J, Zhong X, Shen X, Chen T, et al. Interpretable machine learning model based on the systemic inflammation response index and ultrasound features can predict central lymph node metastasis in cn0t1-T2 papillary thyroid carcinoma. Gland Surg. (2023) 12:1485–99. doi: 10.21037/gs-23-349
37. Sun F, Zou Y, Huang L, Shi Y, Liu J, Cui G, et al. Nomogram to assess the risk of central cervical lymph node metastasis in patients with clinical N0 papillary thyroid carcinoma. Endocr Pract. (2021) 27:1175–82. doi: 10.1016/j.eprac.2021.06.010
38. Yang Z, Heng Y, Lin J, Lu C, Yu D, Tao L, et al. Nomogram for predicting central lymph node metastasis in papillary thyroid cancer: A retrospective cohort study of two clinical centers. Cancer Res Treat. (2020) 52:1010–8. doi: 10.4143/crt.2020.254
39. Zeng B, Min Y, Feng Y, Xiang K, Chen H, and Lin Z. Hashimoto’s thyroiditis is associated with central lymph node metastasis in classical papillary thyroid cancer: analysis from a high-volume single-center experience. Front Endocrinol (Lausanne). (2022) 13:868606. doi: 10.3389/fendo.2022.868606
40. Dou Y, Chen Y, Hu D, Xiong W, Xiao Q, and Su X. Development and validation of web-based nomograms for predicting lateral lymph node metastasis in patients with papillary thyroid carcinoma. Gland Surg. (2020) 9:172–82. doi: 10.21037/gs.2020.01.11
41. Tong Y, Li J, Huang Y, Zhou J, Liu T, Guo Y, et al. Ultrasound-based radiomic nomogram for predicting lateral cervical lymph node metastasis in papillary thyroid carcinoma. Acad Radiol. (2021) 28:1675–84. doi: 10.1016/j.acra.2020.07.017
42. Heng Y, Yang Z, Zhou L, Lin J, Cai W, and Tao L. Risk stratification for lateral involvement in papillary thyroid carcinoma patients with central lymph node metastasis. Endocrine. (2020) 68:320–8. doi: 10.1007/s12020-020-02194-8
43. Liu S, Liu C, Zhao L, Wang K, Li S, Tian Y, et al. A prediction model incorporating the braf(V600e) protein status for determining the risk of cervical lateral lymph node metastasis in papillary thyroid cancer patients with central lymph node metastasis. Eur J Surg Oncol. (2021) 47:2774–80. doi: 10.1016/j.ejso.2021.08.033
44. Ma Y, Li Y, Zheng L, and He Q. Prospective application of a prediction model for lateral lymph node metastasis in papillary thyroid cancer patients with central lymph node metastasis. Front Endocrinol (Lausanne). (2023) 14:1283409. doi: 10.3389/fendo.2023.1283409
45. Wang J, Gao Y, Zong Y, Gao W, Wang X, Sun J, et al. Nomogram model based on iodine nutrition and clinical characteristics of papillary thyroid carcinoma to predict lateral lymph node metastasis. Cancer Control. (2023) 30:10732748231193248. doi: 10.1177/10732748231193248
46. Zhao L, Zhou T, Zhang W, Wu F, Jiang K, Lin B, et al. Blood immune indexes can predict lateral lymph node metastasis of thyroid papillary carcinoma. Front Endocrinol (Lausanne). (2022) 13:995630. doi: 10.3389/fendo.2022.995630
47. Zhuo X, Yu J, Chen Z, Lin Z, Huang X, Chen Q, et al. Dynamic nomogram for predicting lateral cervical lymph node metastasis in papillary thyroid carcinoma. Otolaryngol Head Neck Surg. (2022) 166:444–53. doi: 10.1177/01945998211009858
48. Zou Y, Sun S, Liu Q, Liu J, Shi Y, Sun F, et al. A new prediction model for lateral cervical lymph node metastasis in patients with papillary thyroid carcinoma: based on dual-energy ct. Eur J Radiol. (2021) 145:110060. doi: 10.1016/j.ejrad.2021.110060
49. Gong J, Zhu B, Liu W, Shi C, Xia C, Zeng L, et al. Risk factors for lymph node metastasis in papillary thyroid carcinoma: A retrospective study. Horm Metab Res. (2023) 55:315–22. doi: 10.1055/a-2057-8358
50. Feng JW, Liu SQ, Qi GF, Ye J, Hong LZ, Wu WX, et al. Development and validation of clinical-radiomics nomogram for preoperative prediction of central lymph node metastasis in papillary thyroid carcinoma. Acad Radiol. (2024) 31:2292–305. doi: 10.1016/j.acra.2023.12.008
51. Liu F, Han F, Lu L, Chen Y, Guo Z, and Yao J. Meta-analysis of prediction models for predicting lymph node metastasis in thyroid cancer. World J Surg Oncol. (2024) 22:278. doi: 10.1186/s12957-024-03566-4
52. Chen H, Zhu L, Zhuang Y, Ye X, Chen F, and Zeng J. Prediction model of cervical lymph node metastasis in papillary thyroid carcinoma. Cancer Control. (2024) 31:10732748241295347. doi: 10.1177/10732748241295347
53. Ji YB, Yoo HS, Song CM, Park CW, Lee CB, and Tae K. Predictive factors and pattern of central lymph node metastasis in unilateral papillary thyroid carcinoma. Auris Nasus Larynx. (2016) 43:79–83. doi: 10.1016/j.anl.2015.09.005
54. So YK, Kim MJ, Kim S, and Son YI. Lateral lymph node metastasis in papillary thyroid carcinoma: A systematic review and meta-analysis for prevalence, risk factors, and location. Int J Surg. (2018) 50:94–103. doi: 10.1016/j.ijsu.2017.12.029
55. Chen H, Pan WK, Ren SY, and Zhou YL. An online model for central lymph node metastases in papillary thyroid carcinoma with braf V600e mutation. Am J Clin Oncol. (2024) 47:383–390. doi: 10.1097/coc.0000000000001109
56. Maino F, Botte M, Dalmiglio C, Valerio L, Brilli L, Trimarchi A, et al. Prognostic factors improving ata risk system and dynamic risk stratification in low- and intermediate-risk dtc patients. J Clin Endocrinol Metab. (2024) 109:722–9. doi: 10.1210/clinem/dgad591
57. Hu L, Ye L, Pei C, Sun C, Zhang C, Jiang F, et al. Enhanced stiffness in peri-cancerous tissue: A marker of poor prognosis in papillary thyroid carcinoma with lymph node metastasis. Oncologist. (2024) 29:e1132–e48. doi: 10.1093/oncolo/oyae086
58. Ghossein R, Katabi N, Dogan S, Shaha AR, Tuttle RM, Fagin JA, et al. Papillary thyroid carcinoma tall cell subtype (Ptc-tc) and high-grade differentiated thyroid carcinoma tall cell phenotype (Hgdtc-tc) have different clinical behaviour: A retrospective study of 1456 patients. Histopathology. (2024) 84:1130–8. doi: 10.1111/his.15157
59. Zhu H, Zhang H, Wei P, Zhang T, Hu C, Cao H, et al. Development and validation of a clinical predictive model for high-volume lymph node metastasis of papillary thyroid carcinoma. Sci Rep. (2024) 14:15828. doi: 10.1038/s41598-024-66304-6
60. Abuduwaili M, Aili A, Xia B, Chen Z, Wu Z, Xing Z, et al. Surgical treatment and prognosis values of extranodal extension to recurrent laryngeal nerve in papillary thyroid carcinoma. Eur Arch Otorhinolaryngol. (2023) 280:2341–9. doi: 10.1007/s00405-022-07782-0
61. Luisa Garo M, Deandreis D, Campennì A, Vrachimis A, Petranovic Ovcaricek P, and Giovanella L. Accuracy of papillary thyroid cancer prognostic nomograms: A systematic review. Endocr Connect. (2023) 12:e220457. doi: 10.1530/ec-22-0457
62. Chen R, Wang SF, Zhou JC, Sun F, Wei WW, and Zhan SY. Introduction of the prediction model risk of bias assessment tool: A tool to assess risk of bias and applicability of prediction model studies. Chin J Epidemiol. (2020) 41:776–81. doi: 10.3760/cma.j.cn112338-20190805-00580
Keywords: papillary thyroid carcinoma, lymph node metastasis, thyroidectomy, nomogram, meta-analysis, China
Citation: Wu Y, Su Y, Zhao Y, Mourdi N and Wang Z (2025) Precision of predictive nomograms for lymph node metastasis of thyroid cancer from Chinese real-world study: a systematic review and meta-analysis. Front. Endocrinol. 16:1617563. doi: 10.3389/fendo.2025.1617563
Received: 24 April 2025; Accepted: 17 June 2025;
Published: 09 July 2025.
Edited by:
Mehmet Haciyanli, Izmir Katip Celebi University, TürkiyeReviewed by:
Mehmet Taner Ünlü, Şişli Hamidiye Etfal Education and Research Hospital, TürkiyeCengiz Aydın, Izmir Tepecik Training and Research Hospital, Türkiye
Copyright © 2025 Wu, Su, Zhao, Mourdi and Wang. This is an open-access article distributed under the terms of the Creative Commons Attribution License (CC BY). The use, distribution or reproduction in other forums is permitted, provided the original author(s) and the copyright owner(s) are credited and that the original publication in this journal is cited, in accordance with accepted academic practice. No use, distribution or reproduction is permitted which does not comply with these terms.
*Correspondence: Zhidong Wang, eGF3emRAMTYzLmNvbQ==
†These authors have contributed equally to this work