 Amélie Taschereau1
 Frédérique White2
 Catherine Allard3
 Andrea G. Edlow4François Aguet5Kristin G. Ardlie6Jose C. Florez7,8,9,10Pierre-Étienne Jacques2,3,11
 S. Ananth Karumanchi12Camille E. Powe4,7,8,10
 Luigi Bouchard1,3,13Marie-France Hivert3,8,14*
- 1Department of Biochemistry and Functional Genomics, Université de Sherbrooke, Sherbrooke, QC, Canada
- 2Département de Biologie, Université de Sherbrooke, Sherbrooke, QC, Canada
- 3Centre de Recherche du Centre Hospitalier Universitaire de Sherbrooke (CRCHUS), Sherbrooke, QC, Canada
- 4Department of Obstetrics and Gynecology, Massachusetts General Hospital, and Harvard Medical School, Boston, MA, United States
- 5Cancer Program, Broad Institute of MIT and Harvard, Cambridge, MA, United States
- 6GTEx Laboratory Data Analysis and Coordination Center, Broad Institute of MIT and Harvard, Cambridge, MA, United States
- 7Programs in Metabolism and Medical & Population Genetics, Broad Institute of MIT and Harvard, Cambridge, MA, United States
- 8Diabetes Unit, Endocrine Division, Department of Medicine, Massachusetts General Hospital, Boston, MA, United States
- 9Center for Genomic Medicine, Massachusetts General Hospital, Boston, MA, United States
- 10Department of Medicine, Harvard Medical School, Boston, MA, United States
- 11Institut de recherche sur le cancer de l’Université de Sherbrooke (IRCUS), Sherbrooke, QC, Canada
- 12Department of Medicine, Cedars-Sinai Medical Center, Los Angeles, CA, United States
- 13Department of Medical Biology, CIUSSS of Saguenay-Lac-Saint-Jean, Saguenay, QC, Canada
- 14Department of Population Medicine, Harvard Medical School, Harvard Pilgrim Health Care Institute, Boston, MA, United States
Background/Aims: The placenta expresses and releases specific microRNAs (miRNAs) into the maternal circulation that may influence insulin secretion during pregnancy. We hypothesized that specific decidual/placental miRNAs are associated with maternal insulin secretion during pregnancy.
Methods: In the Genetics of Glucose regulation in Gestation and Growth (Gen3G) prospective cohort, we estimated maternal insulin secretion using the Stumvoll first phase index derived from an oral glucose tolerance test at ~26 weeks of gestation. We quantified miRNAs by small RNA sequencing in placenta (N=435) and first trimester plasma (=422) samples. We used the Limma R package to identify miRNAs associated with the Stumvoll index (P<0.05). We adjusted models for Matsuda index, gravidity, maternal age, newborn sex, gestational age at sampling (first trimester plasma sampling or delivery for placenta samples), and for technical covariates (batch and run for plasma, surrogate variables for placenta).
Results: Participants had a median [IQR] Stumvoll first phase index of 1112.9 [905.4 - 1284.5] in pregnancy. We identified 30 decidual/placental and 93 first trimester plasma miRNAs nominally associated with the Stumvoll first phase estimate (P<0.05). Lower insulin secretion was associated with lower levels of has-miR-199a-3p|has-miR-199b-3p (b=1.47 [0.10, 2.69] in placenta and b= 4.22 [0.70, 7.67] in plasma), and with higher levels of has-miR-3150b-3p (b= -6.97 [-14.39, 0.40] in placenta and b= -9.19 [-18.38, -0.60] in plasma).
Conclusion: We identified hsa-miR-199a-3p|hsa-miR-199b-3p and hsa-miR-3150b-3p as differentially expressed in placenta and circulating levels associated with insulin secretion in pregnancy. Hsa-miR-199a-3p may regulate insulin secretion by modulating the expression of E-cadherin and components of the Notch signaling pathway; hsa-miR-3150b-3p may influence glucose-induced insulin secretion through interaction with phospholipase A2.
Introduction
Gestational diabetes mellitus (GDM) affects approximately 14% of pregnancies worldwide and is associated with both short- and long-term complications for the mother and her offspring (1). Short-term complications include an increased risk of gestational hypertensive disorders, caesarean delivery, large for gestational age birth, and neonatal hypoglycemia (2, 3). In the long term, GDM is associated with an increased risk of metabolic and cardiovascular diseases in both the mother and offspring (4). GDM manifests as hyperglycemia due to excessive insulin resistance or inadequate insulin secretion or a combination of both defects. Defect in insulin secretion revealed in pregnancy affects many but not all GDM cases (5) and may be an important predictor for future maternal risk of type 2 diabetes (6).
The placenta is an important regulator of maternal metabolism during pregnancy, and its structure and function are also influenced by maternal signals during its development (7). Recent evidence suggests that the placenta may also play a role in modulating insulin secretion during pregnancy through the release of small extracellular vesicles (containing hormones and microRNAs) into the maternal circulation (8). In addition, insulin secretion increases during the first trimester, before any decline in insulin sensitivity (9). Animal studies have also shown that pancreatic beta cell proliferation during pregnancy is regulated by placental lactogen and serotonin (10, 11). However, the exact placental factors responsible for increasing insulin secretion during human pregnancy are still unknown.
MicroRNAs (miRNAs) are short non-coding, single strand RNA sequences of ~19 to 25 nucleotides, mostly implicated in protein synthesis repression (12). miRNAs are secreted into bloodstream where they are highly stable and can exert their functions in autocrine, paracrine or endocrine manners, like hormones. Placental miRNAs are mainly (not exclusively) encoded into three clusters (i.e., C19MC, C14MC, and miR-371–3 clusters), released into maternal circulation as early as the sixth week of gestation, and implicated in pregnancy processes like placentation and fetal growth (13). Circulating and placental miRNAs in pregnancy have been associated with GDM development, insulinemia and glycemia (14). These associations may be partially explained by the effects of placental miRNAs on both insulin sensitivity and secretion during pregnancy. While previous studies have reported associations between placental miRNAs and insulin sensitivity during pregnancy (15, 16), their potential role in the modulation of insulin secretion remains unclear. We therefore hypothesized that some specific decidual/placental miRNAs secreted into the maternal bloodstream contribute to modulating insulin secretion during pregnancy.
The goal of this study was to discover novel decidual/placental miRNA implicated in insulin secretion modulation during pregnancy. We investigated whether maternal insulin secretion in late second trimester was associated with decidual/placental miRNA expression levels (assessed by whole-genome miRNA sequencing), and with circulating miRNA detectable in first-trimester plasma samples, using an agnostic approach.
Methods
Gen3G cohort
The Genetics of Glucose regulation in Gestation and Growth (Gen3G) cohort is a prospective pregnancy and birth cohort from Sherbrooke, Canada, described previously (17). Briefly, between 2010 and 2013, we recruited 1024 women without pre-existing diabetes or overt diabetes (hemoglobin A1c ≥6.5% or glucose ≥185 mg/dL after a 50-g glucose load) at first trimester of pregnancy. Exclusion criteria were non-singleton pregnancy, alcohol use disorder, and regular use of medications affecting glucose metabolism. In addition, participants who declined biobanking of both plasma and placental samples were also excluded from the present analyses. We followed women throughout their pregnancy during which we collected data and information at first trimester (V1), in the late second trimester (V2), and at delivery. Each participant provided written informed consent according to the Declaration of Helsinki. The study protocol was approved by the ethical committees from the CHUS and the Harvard Pilgrim Health Care Institute.
Variable collection and measurements
At V1, we collected demographic data, anthropometric measures (standardized height and weight, to calculate body mass index (BMI)), obstetric history, and blood samples. Blood samples were centrifuged, and plasma samples were aliquoted and kept at -80°C until RNA extraction.
At V2, women underwent a 75g oral glucose tolerance test (OGTT) during which we collected additional blood samples at fasting, 1h and 2h time-points to measure glucose and insulin levels. We measured glucose levels (mmol/L) immediately after blood sample collection using the hexokinase method (Roche Diagnostics; CHUS biochemistry laboratory). We aliquoted plasma samples after blood centrifugation and stored them at -80°C until insulin measurement (pg/ml), using a multiplexed particle-based flow cytometric assay (Human Milliplex MAP kits; EMD Millipore). We estimated insulin sensitivity using the Matsuda index and insulin secretion using the Stumvoll first phase index based on first phase β-cell function using 0, 60, 120 min glucose and insulin values during the 75g OGTT, without inclusion of demographic parameters into the formulas. We used the following formulas: Matsuda= 10 000/√(Gluc0 ×Ins0 ×mean glucose×mean insulin), with concentrations in glucose and insulin being expressed as mg/dL and μU/mL (18); and Stumvoll= 1194 + 4.724 Å~ Ins0 − 117.0 Å~ Gluc60 + 1.414 Å~ Ins60, with concentrations in glucose and insulin being expressed as mg/dL and pmol/L (43). We ascertained GDM using the International Association of Diabetes and Pregnancy Study Groups criteria (fasting plasma glucose ≥ 5.1mmol/L and/or 1-hour plasma glucose ≥ 10.0mmol/L and/or 2-hour plasma glucose ≥ 8.5 mmol/L) (19). Women clinically diagnosed with GDM were referred to a diabetes in pregnancy clinic managed by endocrinologists.
At delivery, we collected newborn gestational age and sex using medical records. Trained research staff collected placental tissue within 30 minutes of delivery, following a standardized protocol (17). Briefly, a 1 cm3 placental biopsy, including decidual tissue, was collected from the maternal facing side of the placenta within a 5 cm radius of the corresponding location of cord insertion on the other side. The biopsy sample was immediately placed in RNA-Later for at least 24 hours at 4°C, then stored at -80°C until RNA extraction.
RNA extraction, sequencing, and quality control
Trained laboratory staff extracted total RNA from placental biopsies (15 mg) and first trimester plasma samples (500 μL) using the MirVana PARIS kit (Thermo Fisher Scientific, catalog no. AM1556) following the manufacturer’s standard procedure for tissues stored in RNAlater and liquid samples respectively. For plasma samples, total RNA was eluded in 75 μL of nuclease-free water and samples were concentrated by precipitation and resuspended in 5 μL of nuclease-free water, as previously described (20).
Placenta
We sent 3 μg of each sample with (RNA Integrity Number) RIN ≥ 5 and RNA concentration ≥ 89 ng/µl to Novogene for small RNA sequencing (N=476). We prepared libraries using Qiagen Small RNA Kit to generate 75-bp single end reads on NovaSeq 6000 platform. On average, we obtained 28M total reads (range 19M-60M). We excluded six duplicated samples and used Mahalanobis distance (21) on quantified miRNAs to identify and exclude one outlier sample. We additionally excluded two who had hyperglycemia detected and treated before V2, 9 non-European (outliers on principal component plots) and 23 participants with missing phenotypic data leaving 435 placenta samples available for this analysis (see Figure 1).
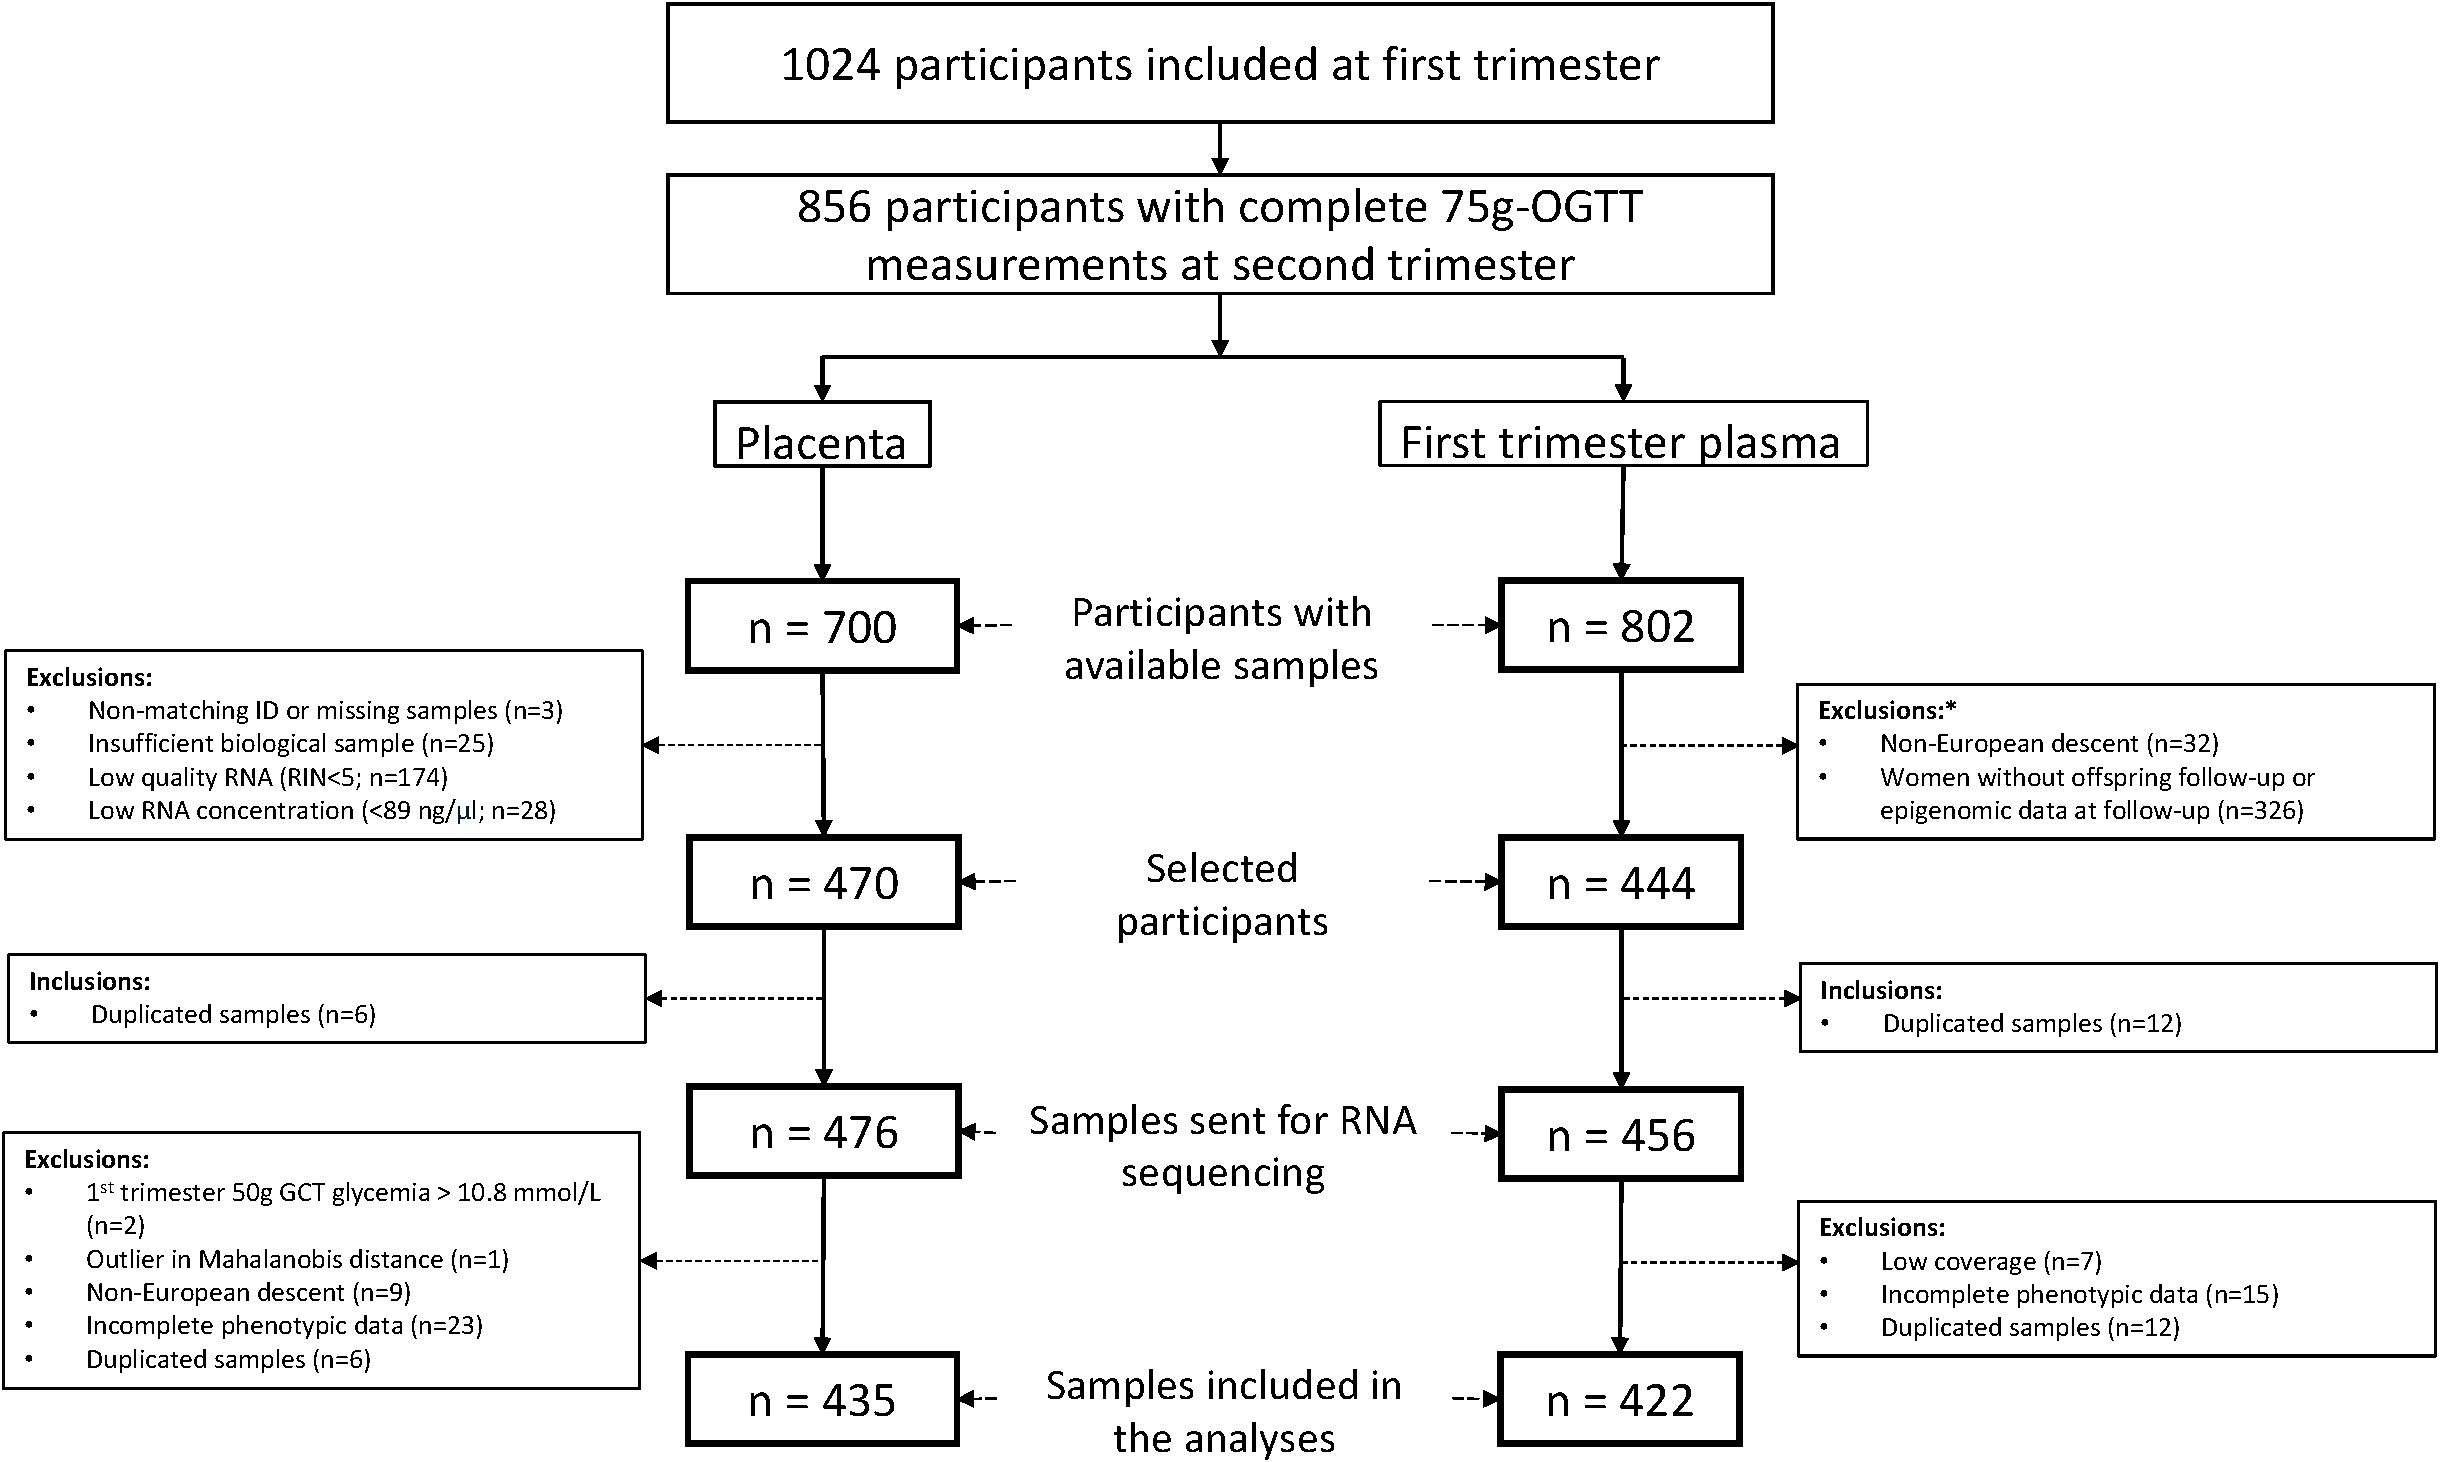
Figure 1. Flowchart illustrating participant selection from the Gen3G cohort for inclusion in both the placenta and first trimester plasma datasets. *Exclusion criteria for maternal plasma microRNA sequencing study. GCT, glucose challenge test; OGTT, oral glucose tolerance test; RIN, RNA integrity number.
Plasma
We prepared libraries using the Truseq Small RNA Sample Prep kit (Illumina, BC, Canada, catalog #RS-200-0012) following our standardized protocol detailed in (20). The quality of each library was evaluated using either the Agilent High Sensitivity DNA kit (Agilent, Mississauga, Ontario, Canada; catalog no 5067-4626) on the Agilent 2100 Bioanalyzer or the Kapa Illumina GA with Revised Primers-SYBR Fast Universal kit (Kapa Biosystems; library concentration) and the LabChip GX instrument (PerkinElmer, catalog no CLS760672; library length and absence of primer dimers). The libraries sent for sequencing were selected based on availability of samples and offspring longitudinal data (see Figure 1). Libraries (n=456) were sequenced at McGill University and Génome Québec Innovation Centre (Montréal, Canada) either on a HiSeq 2500 or HiSeq 4000 platform at 50 cycles, with 7 cycles indexing read. Twelve samples were sequenced twice on both platforms (Pearson’s correlation coefficient between platform ≥0.94). We removed the 12 duplicated samples, 7 outlier samples with low read counts (<500 000), and 15 participants with missing phenotypic data, leaving 422 plasma samples available for this analysis (see Figure 1).
Statistical analyses
We visually inspected histograms of each continuous variable to assess distribution. We transformed the Stumvoll first phase index (Box-Cox), and the Matsuda Index (log2) to approach a normal distribution.
First, we investigated the association between insulin secretion, estimated using the Stumvoll first-phase index, and GDM development. We performed logistic regression with GDM as the outcome and the z-score of the Box-Cox transformed Stumvoll first-phase estimate as the exposure. The regression model included maternal age at first trimester, first trimester BMI, and gravidity status as covariates.
To process miRNA expression data in both placenta and plasma samples, we applied the extracellular RNA processing toolkit (exceRpt) pipeline (version 4.6) from Rozowsky et al. (22). Briefly, exceRpt uses FASTX-Toolkit and FastQC to remove the adapters and poor quality read (Phred score <20 for 80% or more of the read), applies STAR to align remaining high-quality sequences to the human genome (GRCh37) then performs miRNA quantification using miRbase (version 21) annotations. We removed miRNAs with low abundance by keeping only those with at least 6 read counts in a minimum of 20% of samples, leaving 674 miRNAs in plasma and 952 miRNAs in placenta for analyses. We normalized the retained miRNAs using the edgeR R package (23) by computing counts per million reads (CPM).
For the placenta miRNA data analyses, we adjusted models for Matsuda Index (log2), gravidity status, maternal age, newborn sex and gestational age at delivery as well as 5 surrogate variables (SVs) to account for cell type composition and technical bias including batch effects. We used the EstDimRMT function from isva (24) on the residual matrix - obtained by regressing the Stumvoll first phase estimate and adjustment variables on the miRNA counts - to determine the optimal number of SVs to estimate, which was found to be 21 based on the variance structure of our dataset. Subsequently, we applied the SmartSVA (25) R package to compute the 21 SVs, of which we retained only the first 5 for downstream analyses, as the remaining SVs captured biological variance. In the plasma miRNA analyses, we adjusted models for Matsuda Index (log2), gravidity status, maternal age and gestational age at first trimester (i.e., at the time of plasma collection for miRNA quantification), batch, and sequencing run. We also conducted sensitivity analyses to additionally include delivery mode as covariate. For both placenta and plasma analysis, we applied the voom (26) transformation to the CPM expression and then fit a linear model for each miRNA using Limma (27) identify differential levels of miRNAs with Stumvoll first phase index as a continuous independent variable; we reported miRNAs with differential levels in relation to the Stumvoll with P-values <0.05.
To further assess the robustness of these findings in the placenta and plasma datasets, we performed a bootstrap resampling analysis (28). In the placenta, considering the stability of the SVs, which capture batch effects and cell type composition, as well as the substantial computational burden associated with recomputing SVs in each bootstrap sample, we retained the 5 SVs estimated in the main analysis rather than recalculating them for each resampled dataset. For each miRNA, we reported the frequency of significance (P-value < 0.05) across bootstrap re-samples, as well as the 95% confidence interval (CI) around the normalized read count and beta values, corresponding to the values of the 2.5th and 97.5th percentiles of the distribution of the corresponding estimates across 1,000 bootstrap re-samples of the dataset. We did not correct for multiple testing but instead focused on insulin secretion-associated miRNAs identified in both plasma and placenta analyses and on direction of associations. Statistical analyses were conducted in R (version 4.0.3).
miRNA-mRNA interactions
For miRNA associated with Stumvoll index in both the placenta and first trimester plasma analyses (same direction of association), we assessed miRNA-mRNA interactions using the DIANA database TarBase-v9.0 as it considers those validated experimentally (29). We applied the following filter: experimental throughput set to low, and experimental type including both direct and indirect methods.
Data and resource availability
The datasets analyzed during the current study are available on dbGAP, (https://www.ncbi.nlm.nih.gov/projects/gap/cgi-bin/study.cgi?study_id=phs003151.v1.p1) and on GEO, (https://www.ncbi.nlm.nih.gov/geo/query/acc.cgi). No applicable resources were generated or analyzed during the current study.
Results
Participants’ characteristics
The characteristics of the 435 participants included in the placenta sample analyses are described in Table 1. Overall, women had a median [interquartile range (IQR)] age of 28.5 [25.4 - 31.5] years, and BMI of 23.8 [21.4 – 28.0] kg/m2 in the first trimester of pregnancy (gestational age: 9.3 [8.1 - 11.6] weeks); 159 (36.5%) were primigravid. In the second trimester of pregnancy (gestational age: 26.3 [25.9 - 27.3] weeks), women had a Stumvoll first phase index of 1112.9 [905.4 - 1284.5] and Matsuda index of 6.8 [4.7 – 9.4]; 36 (8.3%) met diagnosis criteria for GDM. The gestational age at delivery was 39.6 [38.7 - 40.3] weeks) and 205 (47.1%) of newborns were female. The characteristics of the 422 participants included in the analysis of miRNAs from plasma samples were very similar and are described in Supplementary Table 1.
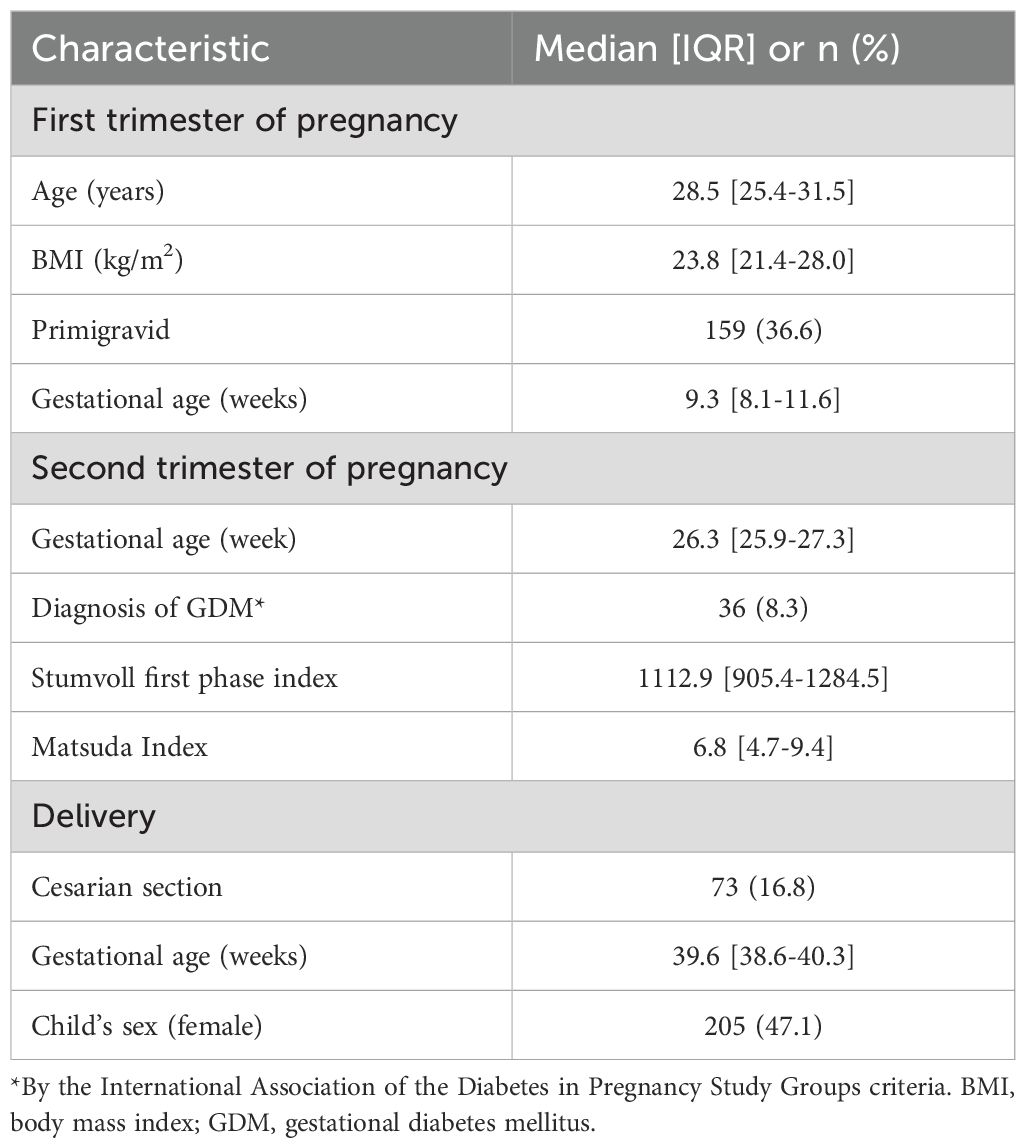
Table 1. Characteristics of the 435 Gen3G participants with decidual/placental miRNA measurements.
Insulin secretion estimated by the Stumvoll index measured at ~26 weeks of gestation is associated with GDM status
Using logistic regression and controlling for maternal first-trimester age, first-trimester BMI, and gravidity, we found that higher insulin secretion, estimated using the z-score of the Box-Cox transformed Stumvoll first-phase index, measured at ~26 weeks’ gestation, was significantly associated with a lower odds of GDM at the same assessment (odds ratio [OR] = 0.56 per SD increase of Stumvoll, 95% confidence interval [CI]: 0.39-0.80, p-value=0.001).
Decidual/placental and first trimester plasma miRNAs associated with insulin secretion estimated by the Stumvoll index measured at ~26 weeks of gestation
We detected a total of 952 miRNAs in placental samples and 674 miRNAs in first trimester plasma samples. We identified 30 decidual/placental and 93 first trimester plasma miRNAs nominally associated (P<0.05; no correction for multiple testing) with Stumvoll first phase index measured at ~26 weeks of gestation. Of these, 13 decidual/placental and 44 plasma miRNAs were positively associated with the Stumvoll index. Supplementary Tables 2, 3 provide the full list of these miRNAs with their mean normalized read counts, percentages of placenta and plasma samples in which they were detected, beta, nominal P-values, and summary metrics from the bootstrap analysis. Briefly, the beta values, representing log2-fold changes in miRNA levels per unit increase in the Box-Cox transformed Stumvoll index, ranged from –9.34 to 7.65 in placental samples and from –14.0 to 14.9 in first trimester plasma samples. On average, the 30 decidual/placental miRNAs and 93 first trimester plasma miRNAs, remained significant in 95% and 92% of bootstrap iterations, respectively. Two of these miRNAs (hsa-miR-199a-3p|hsa-miR-199b-3p and hsa-miR-3150b-3 miRNAs) were nominally associated (P<0.05 and same direction of association) with the Stumvoll first phase index in both placenta and first trimester plasma samples (see Table 2). Specifically, lower insulin secretion was associated with lower levels of has-miR-199a-3p|has-miR-199b-3p (b=1.47 [0.11, 2.84] in placenta and b= 4.22 [0.93, 7.52] in plasma), and with higher levels of has-miR-3150b-3p (b= -6.97 [-13.85, -0.09] in placenta and b= -9.19 [-17.42, -0.96] in plasma). In our sensitivity analyses including delivery mode as a covariate, results remained essentially the same for hsa-miR-199a-3p|hsa-miR-199b-3p and hsa-miR-3150b-3 miRNAs.
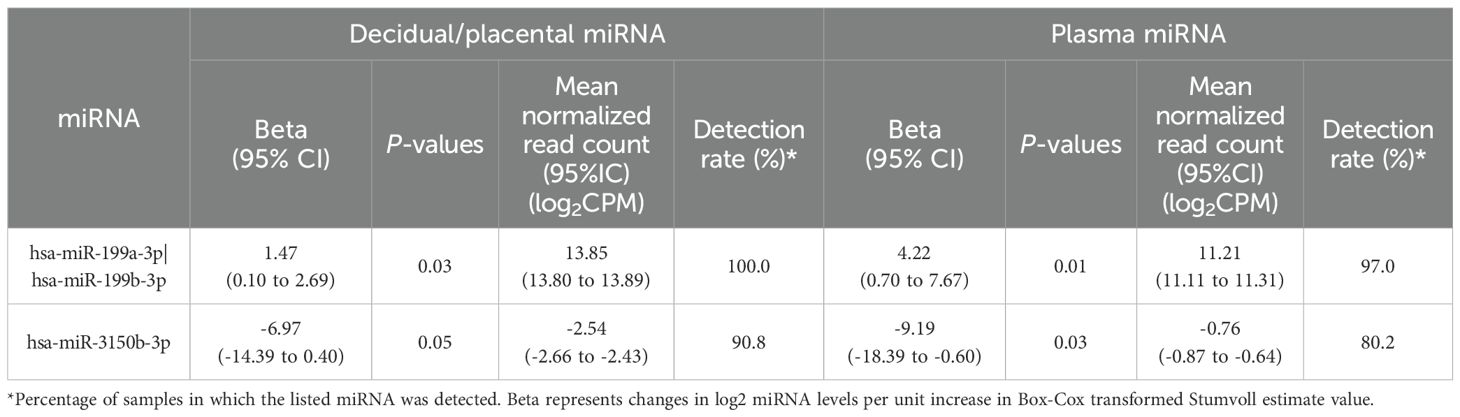
Table 2. Common miRNAs associated with Stumvoll first phase index (P<0.05) in both placenta and first trimester plasma samples.
miRNA-mRNA interactions for miRNAs associated with the Stumvoll index in both the placenta and first trimester plasma analyses
Table 3 present target genes of miRNAs associated with the Stumvoll index in both the placenta and first trimester plasma analyses. We identified miRNA–mRNA interactions only for hsa-miR-199a-3p, which targets the following genes: DNAJA4, FLT1, TAB3, TGFB1, and ZHX1.
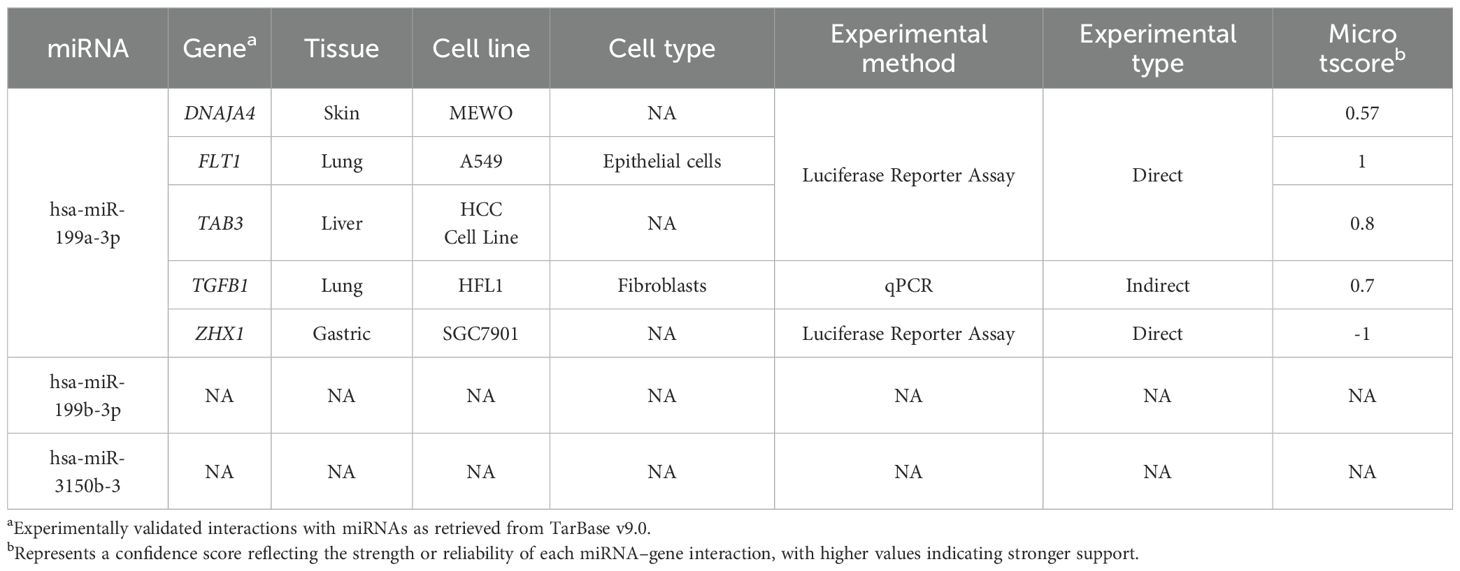
Table 3. Experimentally validated microRNA–target gene interactions and associated experimental details.
Discussion
In this large prospective cohort, we used genome-wide miRNA sequencing to identify decidual/placental miARNs associated with insulin secretion during pregnancy. Our study identified 30 decidual/placental miRNAs suggestively associated (nominal P-value) with insulin secretion as estimated by the Stumvoll first phase index from 75g-OGTT performed at ~26 weeks of gestation. Two of these identified miRNAs (hsa-miR-199a-3p|hsa-miR-199b-3p, hsa-miR-3150b-3p) were detected in first trimester plasma samples and their circulating levels were associated with insulin secretion in later pregnancy. Although none of the associations would remain statistically significant after correction for multiple testing (e.g. FDR), we prioritized miRNAs that exhibited consistent directional associations across both placental and plasma tissues. As placental miRNAs are produced in trophoblast cells, and can be exported to maternal circulation (30), this consistency may reinforce their physiological relevance. Supporting this, a previous study reported that the ten most abundant miRNAs in mid-gestation placental tissue were also highly abundant in matched maternal plasma samples collected at the same time point (31).
Higher insulin secretion in pregnancy was associated with greater levels of hsa-miR-199a-3p|hsa-miR-199b-3p, in both placenta and plasma. These results are consistent with a previous study conducted by our group, which reported that hsa-miR-199a-3|hsa-miR-199b-3p were detected at lower levels in first-trimester plasma samples from women who later developed GDM, compared to those who did not (32). However, these miRNAs did not appear as GDM predictors in that previous study which may be because the analyses were conducted on the general GDM definition without any subtyping based on the underlying physiological processes (insulin resistance or deficiency). Given that our samples were collected from the maternal side of the placenta, it could be hypothesis that the release of hsa-miR-199a-3p|hsa-miR-199b-3p from decidual cells into the maternal circulation enhance insulin secretion during pregnancy and might protect against development of GDM. Further analyses should be conducted to investigate whether these miRNAs would be good predictors of GDM development in subtypes affected by insulin deficiency.
Hsa-miR-199a-3p|hsa-miR-199b-3p are expressed in multiple human tissues, including the pancreas (33). They are encoded in two distinct genes (MIR199a on chromosome 1 and MIR199b on chromosome 9, respectively), although their mature miRNAs are identical, allowing them to target the same mRNAs and exert similar post-transcriptional regulatory functions. Nevertheless, their distinct genomic location may have differential transcriptional regulation. To date, research has primarily focused on the biological functions of hsa-miR-199a-3p, particularly in the context of cancer (34) and only a few studies related to glycemic/insulin regulation. In the field of diabetes, Zhang et al. reported that hsa-miR-199a-3p was the most downregulated miRNA in peripheral blood from patients with diabetic nephropathy, and that its blood levels were negatively correlated with proteinuria in these patients (35). Using human proximal tubular kidney HK-2 cells, the authors demonstrated that hsa-miR-199a-3p inhibited apoptosis and the inflammatory response by targeting the IKKβ/NF-κB pathway in vitro (35). Another functional study in HK-2 kidney cells examining the role of hsa-miR-199a-3p in diabetic nephropathy showed that hsa-miR-199a-3p protects these cells from diabetic-induced injury by upregulating E-cadherin expression through the repression of KDM6A, a histone lysine demethylase (36). Interestingly, cadherins have been shown to directly influence the ability of pancreatic beta cells to secrete insulin in response to glucose by facilitating the formation of adhesion junctions (37). Moreover, hsa-miR-199a-3p has been shown to activate the Notch signaling pathway by inducing the overexpression of Notch1, Jagged1, DII-1, and Hes1 genes in cultured cardiospheres (38). The Notch signaling pathway is expressed in the adult human pancreas, where it regulates beta cell proliferation and maturation (39). Inhibition of Notch1 has also been shown to reduce insulin secretion and beta cell mass in isolated pancreatic beta cells (40). Given these findings, the effects of hsa-miR-199a-3p on the regulation of E-cadherin and the Notch signaling pathway should be further explored in pancreatic beta cells and to determine whether these mechanisms are relevant to insulin secretion.
Higher levels of hsa-miR-3150b-3p (in both placenta and plasma) were associated with lower insulin secretion during pregnancy. To our knowledge, no study has yet investigated the role and actions of hsa-miR-3150b-3p in the context of pregnancy or diabetes. However, bioinformatic analyses suggest that hsa-miR-3150b-3p interacts with phospholipase A2 (41). Interestingly, inhibition of phospholipase A2 reduces glucose-induced insulin secretion in isolated human islets (42). Therefore, the downregulation of phospholipase A2 by hsa-miR-3150b-3p may represent a mechanism contributing to the association with reduced insulin secretion observed in our study, but this hypothesis needs to be tested in functional experiments.
Strengths and limitations
The strengths of this study include a large sample size and the use of agnostic transcriptome-wide small RNA sequencing in two tissues from the same participant to identify novel insulin secretion-associated miRNAs. This study also has some limitations. First, we focused our attention on consistency of association (direction and nominal P<0.05) in miRNA datasets from two different tissues; however, we did not adjust for multiple hypothesis testing, with remaining possibility of false positives. We also lacked external validation in a different cohort. Thus, our findings should be interpreted with caution, replicated in other cohorts and be viewed as hypothesis-generating to be tested in future functional studies. In addition, our study is observational, so we cannot infer causality of the observed associations. Finally, our sample included only participants of European descent, which precludes the extrapolation of our results to other ancestries.
Conclusion
In conclusion, we reported that lower insulin secretion in late second trimester of pregnancy was nominally associated with lower hsa-miR-199a-3p|hsa-miR-199b-3p and with higher hsa-miR-3150b-3p in both first trimester plasma and placenta at delivery. Our previous findings reported lower levels of hsa-mir-199a-3p|hsa-mir-199b-3p in the first-trimester plasma of pregnant women who later developed GDM, highlighting their potential protective role. The effects of hsa-mir-199a-3p on E-cadherin and the Notch signaling pathway should be further explored in pancreatic beta cells to determine whether these mechanisms are relevant to insulin secretion during pregnancy. These novel miRNAs may complement existing metabolic or genetic risk models to improve early prediction of GDM risk or be targeted to augment insulin secretion in GDM with insulin deficiency.
Data availability statement
The datasets presented in this study can be found in online repositories. The names of the repository/repositories and accession number(s) can be found in the article/Supplementary Material.
Ethics statement
The ethical committees from the CHUS under reference number: 2010-198, 07-027-A1. The studies were conducted in accordance with the local legislation and institutional requirements. The participants provided their written informed consent to participate in this study.
Author contributions
AT: Writing – review & editing, Writing – original draft. FW: Writing – review & editing, Formal analysis. CA: Writing – review & editing, Formal analysis. AGE: Writing – review & editing. FA: Writing – review & editing. KA: Writing – review & editing. JCF: Writing – review & editing. P-EJ: Supervision, Writing – review & editing. SAK: Writing – review & editing. CEP: Writing – review & editing. LB: Supervision, Writing – review & editing. M-FH: Writing – review & editing, Funding acquisition, Supervision.
Funding
The author(s) declare financial support was received for the research and/or publication of this article. This work was supported by a grant from the National Institute of Health (NIH) (R01HD094150). Gen3G was initially supported by a Fonds de recherche du Québec – Santé (FRQS) operating grant (to M-FH, grant #20697); Canadian Institute of Health Research (CIHR) operating grants (to M-FH grant #MOP 115071 and to LB #PJT-152989); and a Diabète Québec grant. JF is supported by NHLBI K24 HL157960. P-EJ is a senior research scholar from the FRQS. M-FH was a recipient of an American Diabetes Association (ADA) Pathways To Stop Diabetes Accelerator Award (#1-15-ACE-26). CEP was supported by the National Institute of Diabetes and Digestive and Kidney Diseases (K23DK113218). AE supported by MGH ECOR- Patricia and Scott Eston MGH Research Scholar Award.
Acknowledgments
We first and foremost thank the participants of the Gen3G cohort for their commitment to research. We thank the McGill University and Génome Québec Innovation Centre (Montréal, Canada) as well as Novogene staff for their work with the miRNA-sequencing. M-FH is the guarantor of this work and, as such, had full access to all the data in the study and takes responsibility for the integrity of the data and the accuracy of the data analysis.
Conflict of interest
C.E.P. is an Associate Editor of Diabetes Care, receives payments from Wolters Kluwer for UpToDate chapters on diabetes in pregnancy and has received payments for consulting and speaking from Mediflix. M.-F.H. is co-editor of textbook ‘Essentials of Clinical Nutrition in Healthcare’ published by McGraw Hill. F.A. has been an employee of Illumina since 8 November 2021. J.C.F. has received grant funding for an investigator-initiated proposal from Novo Nordisk, a one-time consulting honorarium from AstraZeneca and speaker fees from Merck and Novo Nordisk for scientific presentations over which he had full control of content. J.C.F.’s wife has received a one-time consulting honorarium from Novartis. A.G.E. serves as a consultant for Mirvie and receives research funding from Merck Pharmaceuticals outside of this work.
The remaining authors declare that the research was conducted in the absence of any commercial or financial relationships that could be construed as a potential conflict of interest.
Generative AI statement
The author(s) declare that no Generative AI was used in the creation of this manuscript.
Any alternative text (alt text) provided alongside figures in this article has been generated by Frontiers with the support of artificial intelligence and reasonable efforts have been made to ensure accuracy, including review by the authors wherever possible. If you identify any issues, please contact us.
Publisher’s note
All claims expressed in this article are solely those of the authors and do not necessarily represent those of their affiliated organizations, or those of the publisher, the editors and the reviewers. Any product that may be evaluated in this article, or claim that may be made by its manufacturer, is not guaranteed or endorsed by the publisher.
Supplementary material
The Supplementary Material for this article can be found online at: https://www.frontiersin.org/articles/10.3389/fendo.2025.1622500/full#supplementary-material
Abbreviations
BMI, body mass index; CPM, counts per million reads; GDM, gestational diabetes mellitus; Gen3G, Genetics of Glucose regulation in Gestation and Growth; miRNAs, microRNAs; RIN, RNA integrity number; SVs, surrogate variables.
References
1. Bellamy L, Casas JP, Hingorani AD, and Williams D. Type 2 diabetes mellitus after gestational diabetes: a systematic review and meta-analysis. Lancet. (2009) 373:1773–9. doi: 10.1016/S0140-6736(09)60731-5
2. Dodd JM, Crowther CA, Antoniou G, Baghurst P, and Robinson JS. Screening for gestational diabetes: the effect of varying blood glucose definitions in the prediction of adverse maternal and infant health outcomes. Aust N Z J Obstet Gynecol. (2007) 47:307–12. doi: 10.1111/j.1479-828X.2007.00743.x
3. Karmon A, Levy A, Holcberg G, Wiznitzer A, Mazor M, and Sheiner E. Decreased perinatal mortality among women with diet-controlled gestational diabetes mellitus. Int J Gynecol Obstet. (2009) 104:199–202. doi: 10.1016/j.ijgo.2008.09.016
4. Sheiner E. Gestational diabetes mellitus: long-term consequences for the mother and child grand challenge: how to move on towards secondary prevention? Front Clin Diabetes Healthc. (2020) 1:546256. doi: 10.3389/fcdhc.2020.546256
5. Powe CE, Allard C, Battista MC, Doyon M, Bouchard L, Ecker JL, et al. Heterogeneous contribution of insulin sensitivity and secretion defects to gestational diabetes mellitus. Diabetes Care. (2016) 39:1052–5. doi: 10.2337/dc15-2672
6. Metzger BE, Cho NH, Roston SM, and Radvany R. Prepregnancy weight and antepartum insulin secretion predict glucose tolerance five years after gestational diabetes mellitus. Diabetes Care. (1993) 16:1598–605. doi: 10.2337/diacare.16.12.1598
7. Hivert MF, Backman H, Benhalima K, Catalano P, Desoye G, Immanuel J, et al. Pathophysiology from preconception, during pregnancy, and beyond. Lancet. (2024) 404(10448):158–74. doi: 10.1016/S0140-6736(24)00827-4
8. Seedat F, Kandzija N, Ellis MJ, Jiang S, Sarbalina A, Bancroft J, et al. Placental small extracellular vesicles from normal pregnancy and gestational diabetes increase insulin gene transcription and content in β cells. Clin Sci (Lond). (2024) 138:1481–502. doi: 10.1042/CS20241782
9. Powe CE, Huston Presley LP, Locascio JJ, and Catalano PM. Augmented insulin secretory response in early pregnancy. Diabetologia. (2019) 62:1445–52. doi: 10.1007/s00125-019-4881-6
10. Kim H, Toyofuku Y, Lynn FC, Chak E, Uchida T, Mizukami H, et al. Serotonin regulates pancreatic beta cell mass during pregnancy. Nat Med. (2010) 16:804–8. doi: 10.1038/nm.2173
11. Rawn SM, Huang C, Hughes M, Shaykhutdinov R, Vogel HJ, and Cross JC. Pregnancy hyperglycemia in prolactin receptor mutant, but not prolactin mutant, mice and feeding-responsive regulation of placental lactogen genes implies placental control of maternal glucose homeostasis. Biol Reprod. (2015) 93:75. doi: 10.1095/biolreprod.115.132431
12. Jonas S and Izaurralde E. Towards a molecular understanding of microRNA-mediated gene silencing. Nat Rev Genet. (2015) 16:421–33. doi: 10.1038/nrg3965
13. Poirier C, Desgagné V, Guérin R, and Bouchard L. MicroRNAs in pregnancy and gestational diabetes mellitus: emerging role in maternal metabolic regulation. Curr Diabetes Rep. (2017) 17:35. doi: 10.1007/s11892-017-0856-5
14. Liu ZN, Jiang Y, Liu XQ, Yang MM, Chen C, Zhao BH, et al. MiRNAs in gestational diabetes mellitus: potential mechanisms and clinical applications. J Diabetes Res. (2021) 2021:4632745. doi: 10.1155/2021/4632745
15. Nair S, Jayabalan N, Guanzon D, Palma C, Scholz-Romero K, Elfeky O, et al. Human placental exosomes in gestational diabetes mellitus carry a specific set of miRNAs associated with skeletal muscle insulin sensitivity. Clin Science. (2018) 132:2451–67. doi: 10.1042/CS20180487
16. Alvarado-Flores F, Chu T, Catalano P, Sadovsky Y, and O’Tierney-Ginn P. The expression of chromosome 19 miRNA cluster members during insulin sensitivity changes in pregnancy. Placenta. (2025) 161:23–30. doi: 10.1016/j.placenta.2025.01.007
17. Guillemette L, Allard C, Lacroix M, Patenaude J, Battista MC, Doyon M, et al. Genetics of Glucose regulation in Gestation and Growth (Gen3G): a prospective prebirth cohort of mother–child pairs in Sherbrooke, Canada. BMJ Open. (2016) 6:e010031. doi: 10.1136/bmjopen-2015-010031
18. Matsuda M and DeFronzo RA. Insulin sensitivity indices obtained from oral glucose tolerance testing: comparison with the euglycemic insulin clamp. Diabetes Care. (1999) 22:1462–70. doi: 10.2337/diacare.22.9.1462
19. International Association of Diabetes and Pregnancy Study Groups Consensus Panel. International association of diabetes and pregnancy study groups recommendations on the diagnosis and classification of hyperglycemia in pregnancy. Diabetes Care. (2010) 33:676–82. doi: 10.2337/dc09-1848
20. Légaré C, Desgagné V, Poirier C, Thibeault K, White F, Clément AA, et al. First trimester plasma microRNAs levels predict Matsuda Index-estimated insulin sensitivity between 24th and 29th week of pregnancy. BMJ Open Diabetes Res Care. (2022) 10:e002703. doi: 10.1136/bmjdrc-2021-002703
21. Reprint of: Mahalanobis, P.C. (1936) “On the generalized distance in statistics. Sankhya
22. Rozowsky J, Kitchen R, Park JJ, Galeev TR, Diao J, Warrell J, et al. exceRpt: A comprehensive analytic platform for extracellular RNA profiling. Cell Syst. (2019) 8:352–7. doi: 10.1016/j.cels.2019.03.004
23. Robinson MD, McCarthy DJ, and Smyth GK. edgeR : a Bioconductor package for differential expression analysis of digital gene expression data. Bioinformatics. (2010) 26:139–40. doi: 10.1093/bioinformatics/btp616
24. Teschendorff AE, Zhuang J, and Widschwendter M. Independent surrogate variable analysis to deconvolve confounding factors in large-scale microarray profiling studies. Bioinformatics. (2011) 27:1496–505. doi: 10.1093/bioinformatics/btr171
25. Chen J, Behnam E, Huang J, Moffatt MF, Schaid DJ, Liang L, et al. Fast and robust adjustment of cell mixtures in epigenome-wide association studies with SmartSVA. BMC Genomics. (2017) 18:413. doi: 10.1186/s12864-017-3808-1
26. Law CW, Chen Y, Shi W, and Smyth GK. voom: Precision weights unlock linear model analysis tools for RNA-seq read counts. Genome Biol. (2014) 15(2):R29. doi: 10.1186/gb-2014-15-2-r29
27. Ritchie ME, Phipson B, Wu D, Hu Y, Law CW, Shi W, et al. limma powers differential expression analyses for RNA-sequencing and microarray studies. Nucleic Acids Res. (2015) 43:e47. doi: 10.1093/nar/gkv007
28. Davison AC and Hinkley DV. Bootstrap Methods and their Application. Cambridge: Cambridge University Press (1997). Available online at: https://www.cambridge.org/core/books/bootstrap-methods-and-their-application/ED2FD043579F27952363566DC09CBD6A (Accessed July 10, 2025).
29. Skoufos G, Kakoulidis P, Tastsoglou S, Zacharopoulou E, Kotsira V, Miliotis M, et al. TarBase-v9.0 extends experimentally supported miRNA-gene interactions to cell-types and virally encoded miRNAs. Nucleic Acids Res. (2024) 52:D304–10. doi: 10.1093/nar/gkad1071
30. Ali A, Hadlich F, Abbas MW, Iqbal MA, Tesfaye D, Bouma GJ, et al. MicroRNA–mRNA networks in pregnancy complications: A comprehensive downstream analysis of potential biomarkers. Int J Mol Sci. (2021) 22:2313. doi: 10.3390/ijms22052313
31. Smith MD, Pillman K, Jankovic-Karasoulos T, McAninch D, Wan Q, Bogias KJ, et al. Large-scale transcriptome-wide profiling of microRNAs in human placenta and maternal plasma at early to mid-gestation. medRxiv. (2020) 18(sup1):507–20. doi: 10.1101/2020.08.19.20177873v2
32. Légaré C, Desgagné V, Thibeault K, White F, Clément AA, Poirier C, et al. First trimester plasma microRNA levels predict risk of developing gestational diabetes mellitus. Front Endocrinol (Lausanne. (2022) 13:928508. doi: 10.3389/fendo.2022.928508
33. Chair for Clinical Bioinformatics. TissueAtlas (2024). Available online at: https://ccb-web.cs.uni-saarland.de/tissueatlas2/patterns/hsa/mirna/hsa-miR-199a-3p (Accessed April 08, 2025).
34. Wang Q, Ye B, Wang P, Yao F, Zhang C, and Yu G. Overview of microRNA-199a regulation in cancer. CMAR. (2019) 11:10327–35. doi: 10.2147/CMAR.S231971
35. Zhang R, Qin L, and Shi J. MicroRNA−199a−3p suppresses high glucose−induced apoptosis and inflammation by regulating the IKKβ/NF−κB signaling pathway in renal tubular epithelial cells. Int J Mol Med. (2020) 46:2161–71. doi: 10.3892/ijmm.2020.4751
36. Bai S, Xiong X, Tang B, Ji T, Li X, Qu X, et al. hsa-miR-199b-3p prevents the epithelial-mesenchymal transition and dysfunction of the renal tubule by regulating E-cadherin through targeting KDM6A in diabetic nephropathy. Oxid Med Cell Longev. (2021) 2021:8814163. doi: 10.1155/2021/8814163
37. Parnaud G, Lavallard V, Bedat B, Matthey-Doret D, Morel P, Berney T, et al. Cadherin engagement improves insulin secretion of single human β-cells. Diabetes. (2015) 64:887–96. doi: 10.2337/db14-0257
38. Secco I, Barile L, Torrini C, Zentilin L, Vassalli G, Giacca M, et al. Notch pathway activation enhances cardiosphere in vitro expansion. J Cell Mol Med. (2018) 22:5583–95. doi: 10.1111/jcmm.13832
39. Bartolome A, Zhu C, Sussel L, and Pajvani UB. Notch signaling dynamically regulates adult β cell proliferation and maturity. J Clin Invest. (2019) 129:268–80. doi: 10.1172/JCI98098
40. Eom YS, Gwon AR, Kwak KM, Youn JY, Park H, Kim KW, et al. Notch1 has an important role in β-cell mass determination and development of diabetes. Diabetes Metab J. (2020) 45:86. doi: 10.4093/dmj.2019.0160
41. Oveisee M, Gholipour A, Bagheri Moghaddam M, and Malakootian M. Bioinformatics analysis of differentially expressed genes in carpal tunnel syndrome using RNA sequencing. Iran J Public Health. (2024) 53(8):1871–82. doi: 10.18502/ijph.v53i8.16293
42. Persaud SJ, Muller D, Belin VD, Kitsou-Mylona I, Asare-Anane H, Papadimitriou A, et al. The role of arachidonic acid and its metabolites in insulin secretion from human islets of langerhans. Diabetes. (2007) 56:197–203. doi: 10.2337/db06-0490
Keywords: pregnancy, placenta, insulin secretion, diabetes, microRNA
Citation: Taschereau A, White F, Allard C, Edlow AG, Aguet F, Ardlie KG, Florez JC, Jacques P-É, Karumanchi SA, Powe CE, Bouchard L and Hivert M-F (2025) Decidual/placental and first trimester plasma levels of hsa-miR-199a-3p|hsa-miR-199b-3p and hsa-miR-3150b-3p are associated with insulin secretion in pregnancy. Front. Endocrinol. 16:1622500. doi: 10.3389/fendo.2025.1622500
Received: 03 May 2025; Accepted: 31 July 2025;
Published: 19 August 2025.
Edited by:
Alicia E. Damiano, University of Buenos Aires, ArgentinaReviewed by:
Tatiana El-Bacha, Federal University of Rio de Janeiro, BrazilGuilherme de Moraes Nobrega, Icahn School of Medicine at Mount Sinai, United States
Erika Chavira-Suárez, National Autonomous University of Mexico, Mexico
Copyright © 2025 Taschereau, White, Allard, Edlow, Aguet, Ardlie, Florez, Jacques, Karumanchi, Powe, Bouchard and Hivert. This is an open-access article distributed under the terms of the Creative Commons Attribution License (CC BY). The use, distribution or reproduction in other forums is permitted, provided the original author(s) and the copyright owner(s) are credited and that the original publication in this journal is cited, in accordance with accepted academic practice. No use, distribution or reproduction is permitted which does not comply with these terms.
*Correspondence: Marie-France Hivert, bWhpdmVydEBtZ2Iub3Jn