 Cheng-lan Xu
 Xiao-cen Kong
 Xiao-mei Liu
 Bing-li Liu
 Jian-hua Ma
- Department of Endocrinology, Nanjing First Hospital, Nanjing Medical University, Nanjing, China
Aim: Investigate effects of Ebenatide, a novel glucagon-like peptide-1 analogue, on glycemic control and body composition in type 2 diabetes mellitus (T2DM).
Methods: This randomized, prospective, interventional study enrolled 78 subjects (76 finished). Subjects were randomized to either the Ebenatide group (52 subjects, Ebenatide for 52 weeks) or the placebo group (24 subjects, placebo for 24 weeks followed by Ebenatide for 28 weeks) according to a 2:1 allocation ratio. Assessments included continuous glucose monitoring and body composition analysis.
Results: The Ebenatide group showed significantly lower in hemoglobin A1c (HbA1c), mean blood glucose (MBG), time above range (TAR) and standard deviation (SD), along with improvement of time in range (TIR) at Week 24 and Week 52 compared to baseline (P<0.05). The triglyceride-glucose index (TyG) decreased at Week 52 compared with baseline (P<0.01). Compared with the placebo group, the Ebenatide group demonstrated greater reductions in HbA1c and TAR and improved TIR at Week 24 (P<0.05), but no difference at Week 52. Body composition analysis showed that the Ebenatide group had significant declines in weight, BMI, body fat and waist-to-height ratio (WHtR) (P<0.05). Compared with baseline, the Ebenatide group exhibited decreased blood pressure and hemoglobin levels and elevated serum amylase and lipase levels at Week 24 and Week 52 (P<0.05). Adverse events were limited to gastrointestinal reactions.
Conclusion: Ebenatide treatment for 24 weeks significantly improved HbA1c, TIR, TyG, weight and WHtR in T2DM subjects, with these benefits sustained for at least 52 weeks.
Clinical trial registration: https://clinicaltrials.gov/, identifier NCT05990374.
1 Introduction
With the gradual aging of the population structure, the prevalence of type 2 diabetes mellitus (T2DM) has nearly doubled in the past decade, reaching 12.8% in China (1) while mortality rates show an upward trend (2). In clinical treatment, in addition to strict glycemic control, the protective effects of medications on the cardiovascular system, kidneys, and other organs have gained increasing attention. Glucagon-like peptide-1 receptor agonists (GLP-1RAs), which can simultaneously regulate blood glucose and body weight (3) while offering cardiovascular and cerebrovascular protection (4), are now widely recommended in T2DM treatment (5).
Ebenatide, a novel drug, is derived from lizard-origin Exendin-4. As a once-weekly long-acting GLP-1RA, Ebenatide potentially prolongs its half-life beyond some current analogs. Ebenatide is modified through a proprietary drug affinity complex technology, enabling it forms a stable Exendin-4-albumin conjugate. This structure resists quickly degradation by dipeptidyl peptidase-4 (DPP-4) and avoids rapid renal clearance. Its albumin-binding moiety may enhance tissue distribution while reducing renal clearance, a pharmacokinetic profile distinct from either short- or long-acting GLP-1RAs.
Continuous Glucose Monitoring (CGM) comprehensively evaluates glycemic control through multidimensional parameters. In 2017, an international consensus statement on CGM core metrics was released, recognized CGM-related indices as important tools for assessing glycemic levels in patients with T2DM (6). Among these, Time in Range (TIR) has emerged as a new glycemic control metric alongside hemoglobin A1c (HbA1c) and is associated with diabetes-related complications (7).
Body composition assessment through bioelectrical impedance analysis offers a convenient, noninvasive approach that yields additional physiological parameters compared to conventional anthropometric measurements (8). Adiposity and muscle-related indices not only assess obesity and metabolic risk but also reflect muscle functional status, providing critical evidence for nutritional interventions, exercise rehabilitation, and chronic disease management.
In this study on Ebenatide, in addition to conventional efficacy assessments such as fasting blood glucose (FBG), HbA1c, body mass index (BMI), and waist circumference (WC), more precise and clinically significant indicators—including CGM, body composition analysis, triglyceride-glucose index (TyG), and waist-to-height ratio (WHtR)—were employed to further evaluate the drug’s therapeutic effects.
Studies have demonstrated that WHtR exhibits stronger correlation with T2DM than conventional anthropometric indices including waist-to-hip ratio and BMI (9). Emerging evidence suggests WHtR may serve as a superior predictor for cardiovascular risk assessment (10). The TyG, derived from FBG and triglyceride (TG), has gained increasing recognition in recent years for its utility in evaluating insulin resistance of T2DM (11). This index has also been proposed as a potential predictor for diabetic kidney disease (12). Notably, elevated TyG levels have been associated with higher risks of coronary artery disease, progression of heart failure, and both incidence and recurrence of ischemic stroke (13, 14). In the present study, we employed this index to further evaluate the potential effects of Ebenatide on insulin resistance improvement.
This study fills the gap in evaluating the therapeutic efficacy of Ebenatide. These innovative assessment strategies may provide a more comprehensive understanding of the metabolic health impacts of GLP-1RAs and may offer new evidences for the standardized clinical use of GLP-1RAs.
2 Methods
2.1 Participants
We designed the trial with primary endpoint defined as glycated hemoglobin (HbA1c) at 24 weeks. Based on an assumed population standard deviation of 1.2% and an expected between‐group difference of 1% in HbA1c, the smallest difference that we considered to be clinically meaningful, we set a two‐sided significance level (α) of 0.05 and statistical power of 80%. Under a 2:1 allocation ratio, the initial calculations indicated a requirement of 36 participants in the treatment arm and 18 in the placebo arm. To allow for anticipated dropout rates of 30% in the treatment arm and 20% in the placebo arm, the final target sample sizes were increased to 52 and 24, respectively. All sample‐size calculations were performed using the R package pwr.
Between August 2023 and September 2024, a total of 78 patients with T2DM were recruited as inpatients at the Department of Endocrinology, Nanjing First Hospital. The inclusion criteria included patients aged 18–70 years with 20 kg/m²≤ BMI ≤40 kg/m², and 7.0%≤ HbA1c ≤11.0%. The study population included both treatment-naïve patients with newly diagnosed T2DM and patients who had received stable maximal tolerated doses of metformin for ≥3 months prior to enrollment. The exclusion criteria were (1): hyperglycemia: from randomization to Week 6: FBG >15 mmol/L, from the Week 7 to Week 12: FBG >13.3 mmol/L, from Week 13 to the Week 24: FBG >11.1 mmol/L (200 mg/dL), from Week 25 to Week 52: FBG >11.1 mmol/L (2). history of long-term use of medications affecting gastrointestinal motility, and use of weight-loss drugs or hormonal therapy within the past 3 months (3). impaired liver/kidney function: alanine aminotransferase and/or aspartate aminotransferase >2.5×ULN or total bilirubin >1.5×ULN; estimated glomerular filtration rate <60 mL/min; systolic blood pressure (SBP) >160 mmHg and/or diastolic blood pressure (DBP) >100 mmHg; fasting triglycerides >5.64 mmol/L; serum amylase or lipase >3×ULN (4). history of gastric-related surgeries (5). history of pancreatitis, medullary thyroid carcinoma, or multiple endocrine neoplasia type 2 (6). recent weight-loss attempts or pregnancy plans.
All participants on metformin pre-enrollment continued their stable doses throughout the study, with no dosage adjustments permitted unless medically necessary.
2.2 Experimental procedure
This was a randomized, prospective, interventional study (Clinical Trial Register identifier NCT05990374). The study protocol was approved by the institutional ethical committee of Nanjing First Hospital, Nanjing Medical University. Informed consent was provided by all recruited subjects. All procedures followed were in accordance with the Helsinki Declaration of 1964, as revised in 2013.
A stratified block randomization was employed, with metformin usage (yes/no) as the stratification factor. The allocation sequence was generated and concealed through a centralized interactive web-response system (IWRS). Participants were randomized at a 2:1 ratio to either Ebenatide (n=52) or placebo (n=26) group, with a fixed block size of 6 to ensure inter-group balance. This study utilized a double-blind design, where the investigational drug and placebo were identical in appearance, packaging, and odor. Both participants and investigators remained blinded to group assignments until database lock. The study flowchart is shown in Figure 1.
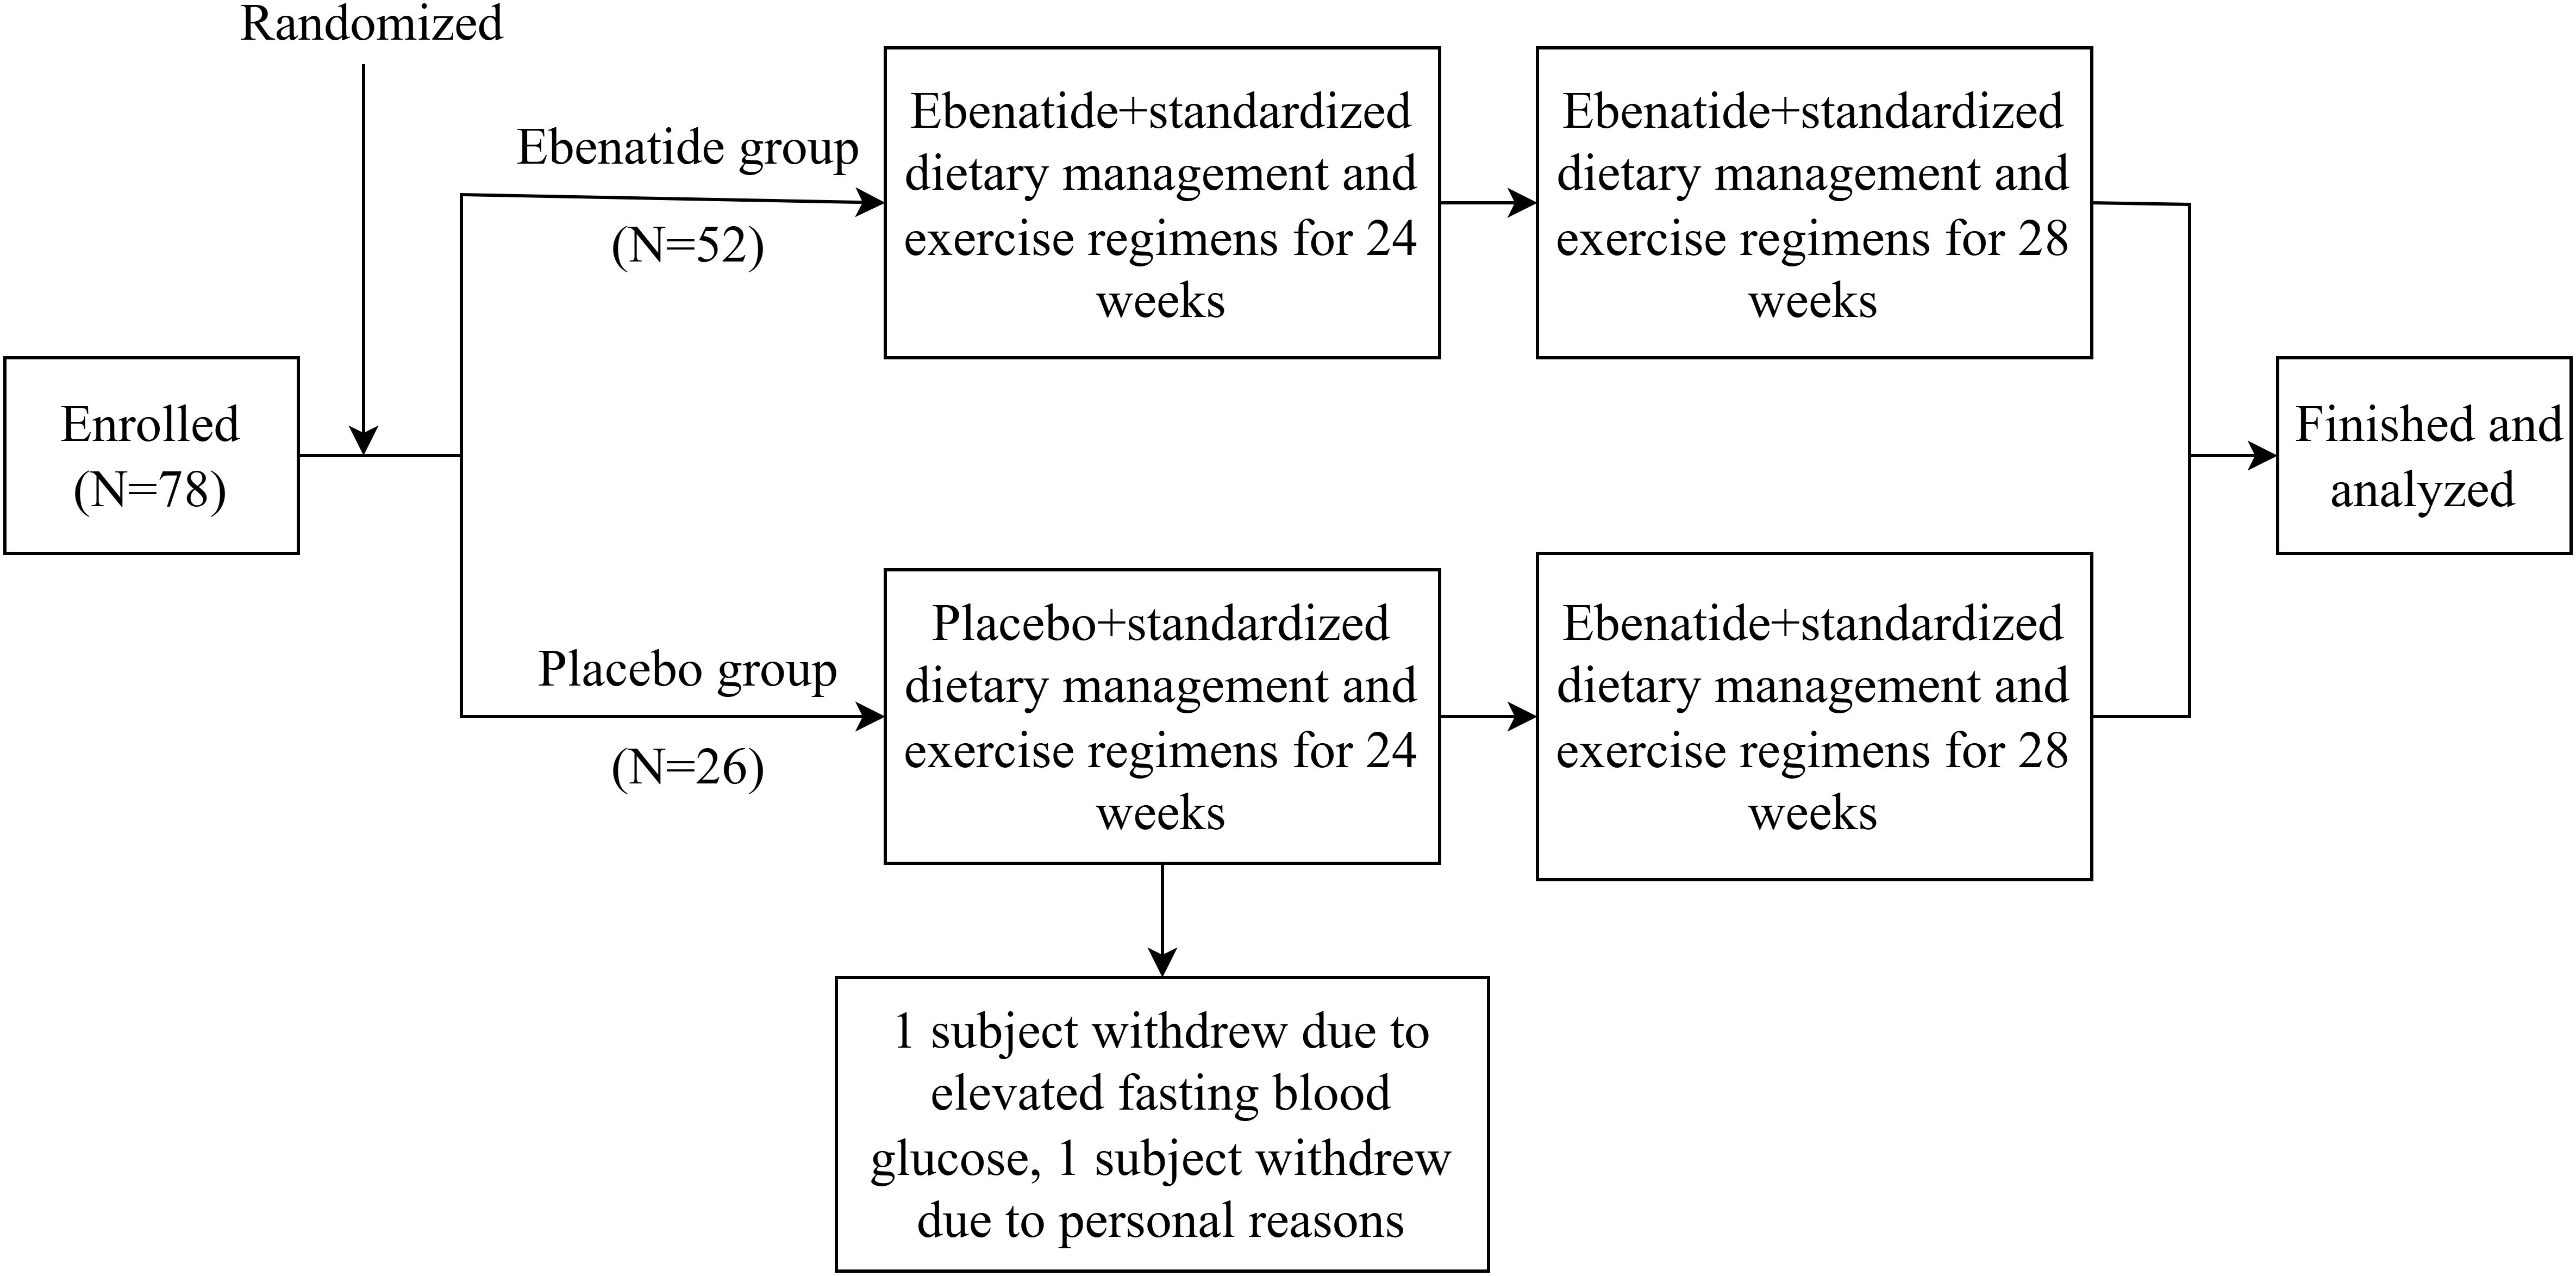
Figure 1. Study flow chart.
All subjects continued structured medical nutrition therapy (MNT) and moderate-intensity physical activity throughout the study, as per ADA guidelines (15).
Both Ebenatide and placebo were provided by Changshan Kaijiejian Biopharmaceutical R&D Co., Ltd. The drug was administered via subcutaneous injection at a dosage of 0.2 ml (2 mg) once per week. Biochemical, body fat composition, and CGM parameters were assessed at baseline, Week 24, and Week 52 post-treatment.
2.3 Body composition assessment
Body composition was assessed using bioelectrical impedance analysis (InBody 770, Korea). During measurements, participants stood barefoot on the analyzer’s foot electrodes with proper positioning of forefeet and heels, while grasping hand electrodes with thumbs and fingers aligned. Participants fasted, emptied bladder/bowel, and rested at least 10 minutes in a quiet state before testing.
2.4 CGM assessment
This study implemented standardized CGM to evaluate glycemic fluctuations in subjects. All subjects underwent three 72-hour CGM sessions at baseline, Week 24, and Week 52 using the Medtronic CGMS-Gold system with Sof-sensors, administered by certified diabetes care specialists. The monitoring protocol specified sensor insertion between 08:00-10:00, with a minimum of four capillary blood glucose calibrations per 24-hour period, followed by sensor removal and data collection at 72 hours post-insertion (day 3, 08:00-10:00). Comprehensive glycemic variability analysis included calculation of: 24-hour mean blood glucose (MBG), glucose standard deviation (SD), coefficient of variation (CV), time in range (TIR), time above range (>10.0 mmol/L) and below range (<3.9 mmol/L), area under the curve for hyperglycemia (AUC>10.0 mmol/L), area under the curve for hypoglycemia (AUC<3.9 mmol/L), and documented hypoglycemic events. The CGM flow chart was described as Figure 2.
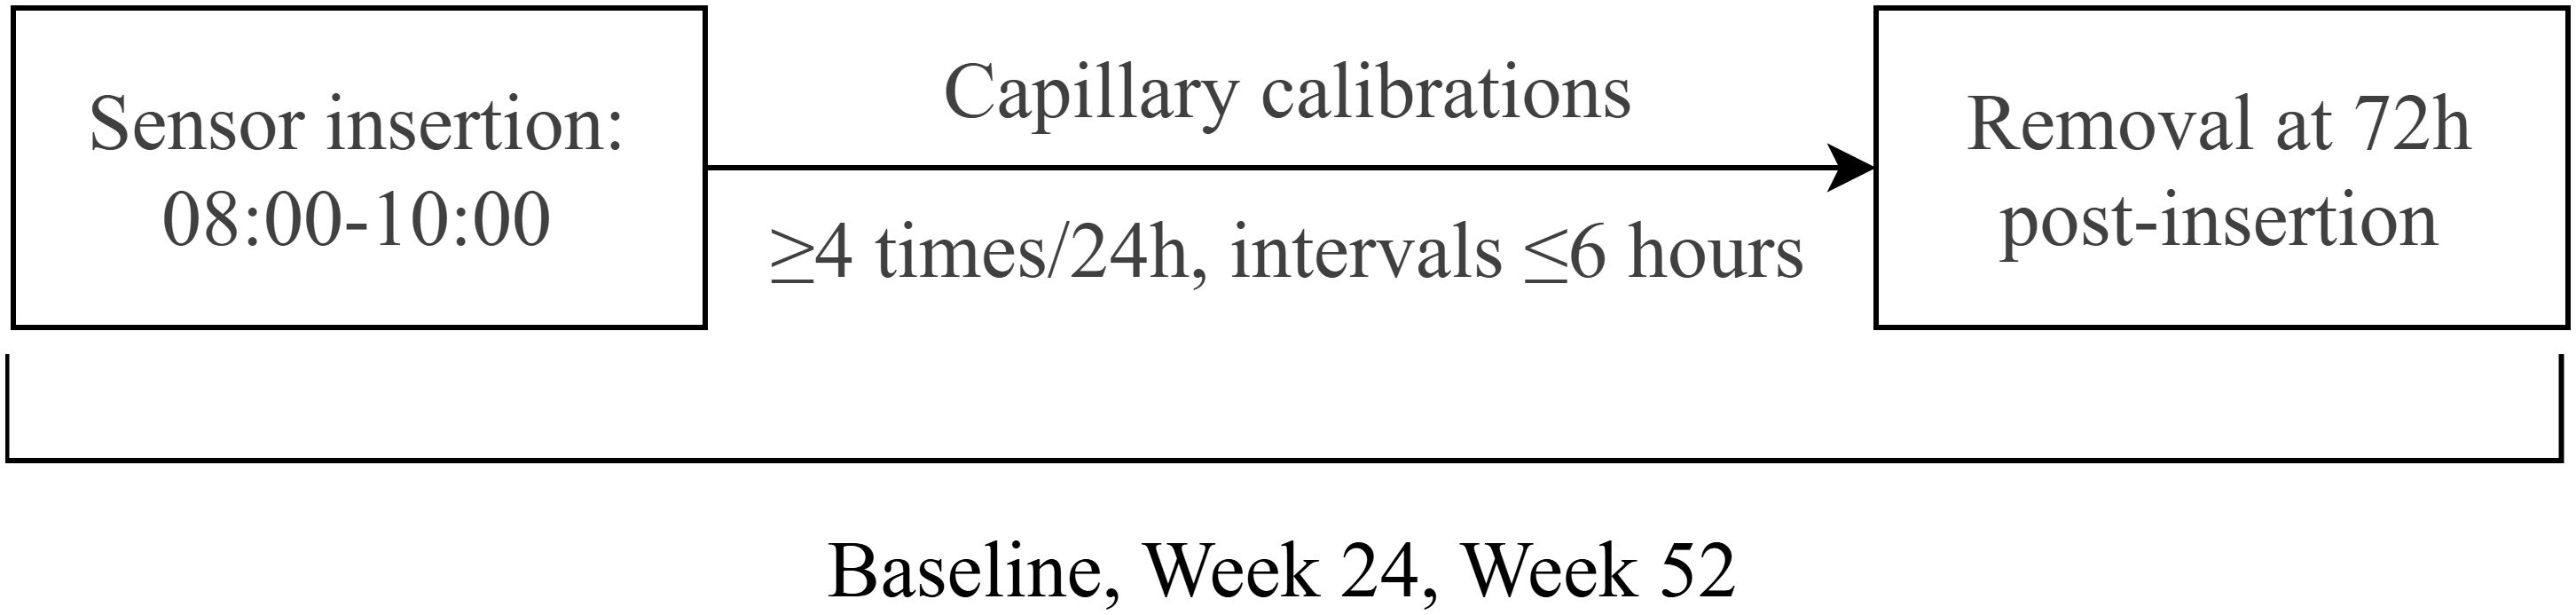
Figure 2. CGM flow chart.
2.5 Statistical analysis
Data were analyzed by using SPSS 26.0. Normally distributed variables are expressed as mean ± SD (paired/independent t-tests). Non-normal variables are presented as median (interquartile range) (Wilcoxon signed-rank/Mann-Whitney U tests). P<0.05 was considered statistically significant.
3 Result
This study enrolled 78 patients with poorly controlled T2DM from Nanjing First Hospital. Two placebo-group subjects withdrew (one due to FBG >13.3 mmol/L at Week 8, one for personal reasons). During the trial, three participants (two from the Ebenatide group and one from the placebo group) missed CGM assessments due to equipment issues, while one additional participant (the Ebenatide group) failed to complete body composition analysis for personal reasons. In the overall analysis, all missing data from these participants were excluded. No other missing data were observed in the study. Baseline characteristics showed no statistically significant differences between the Ebenatide and placebo groups across all measured parameters (Table 1).
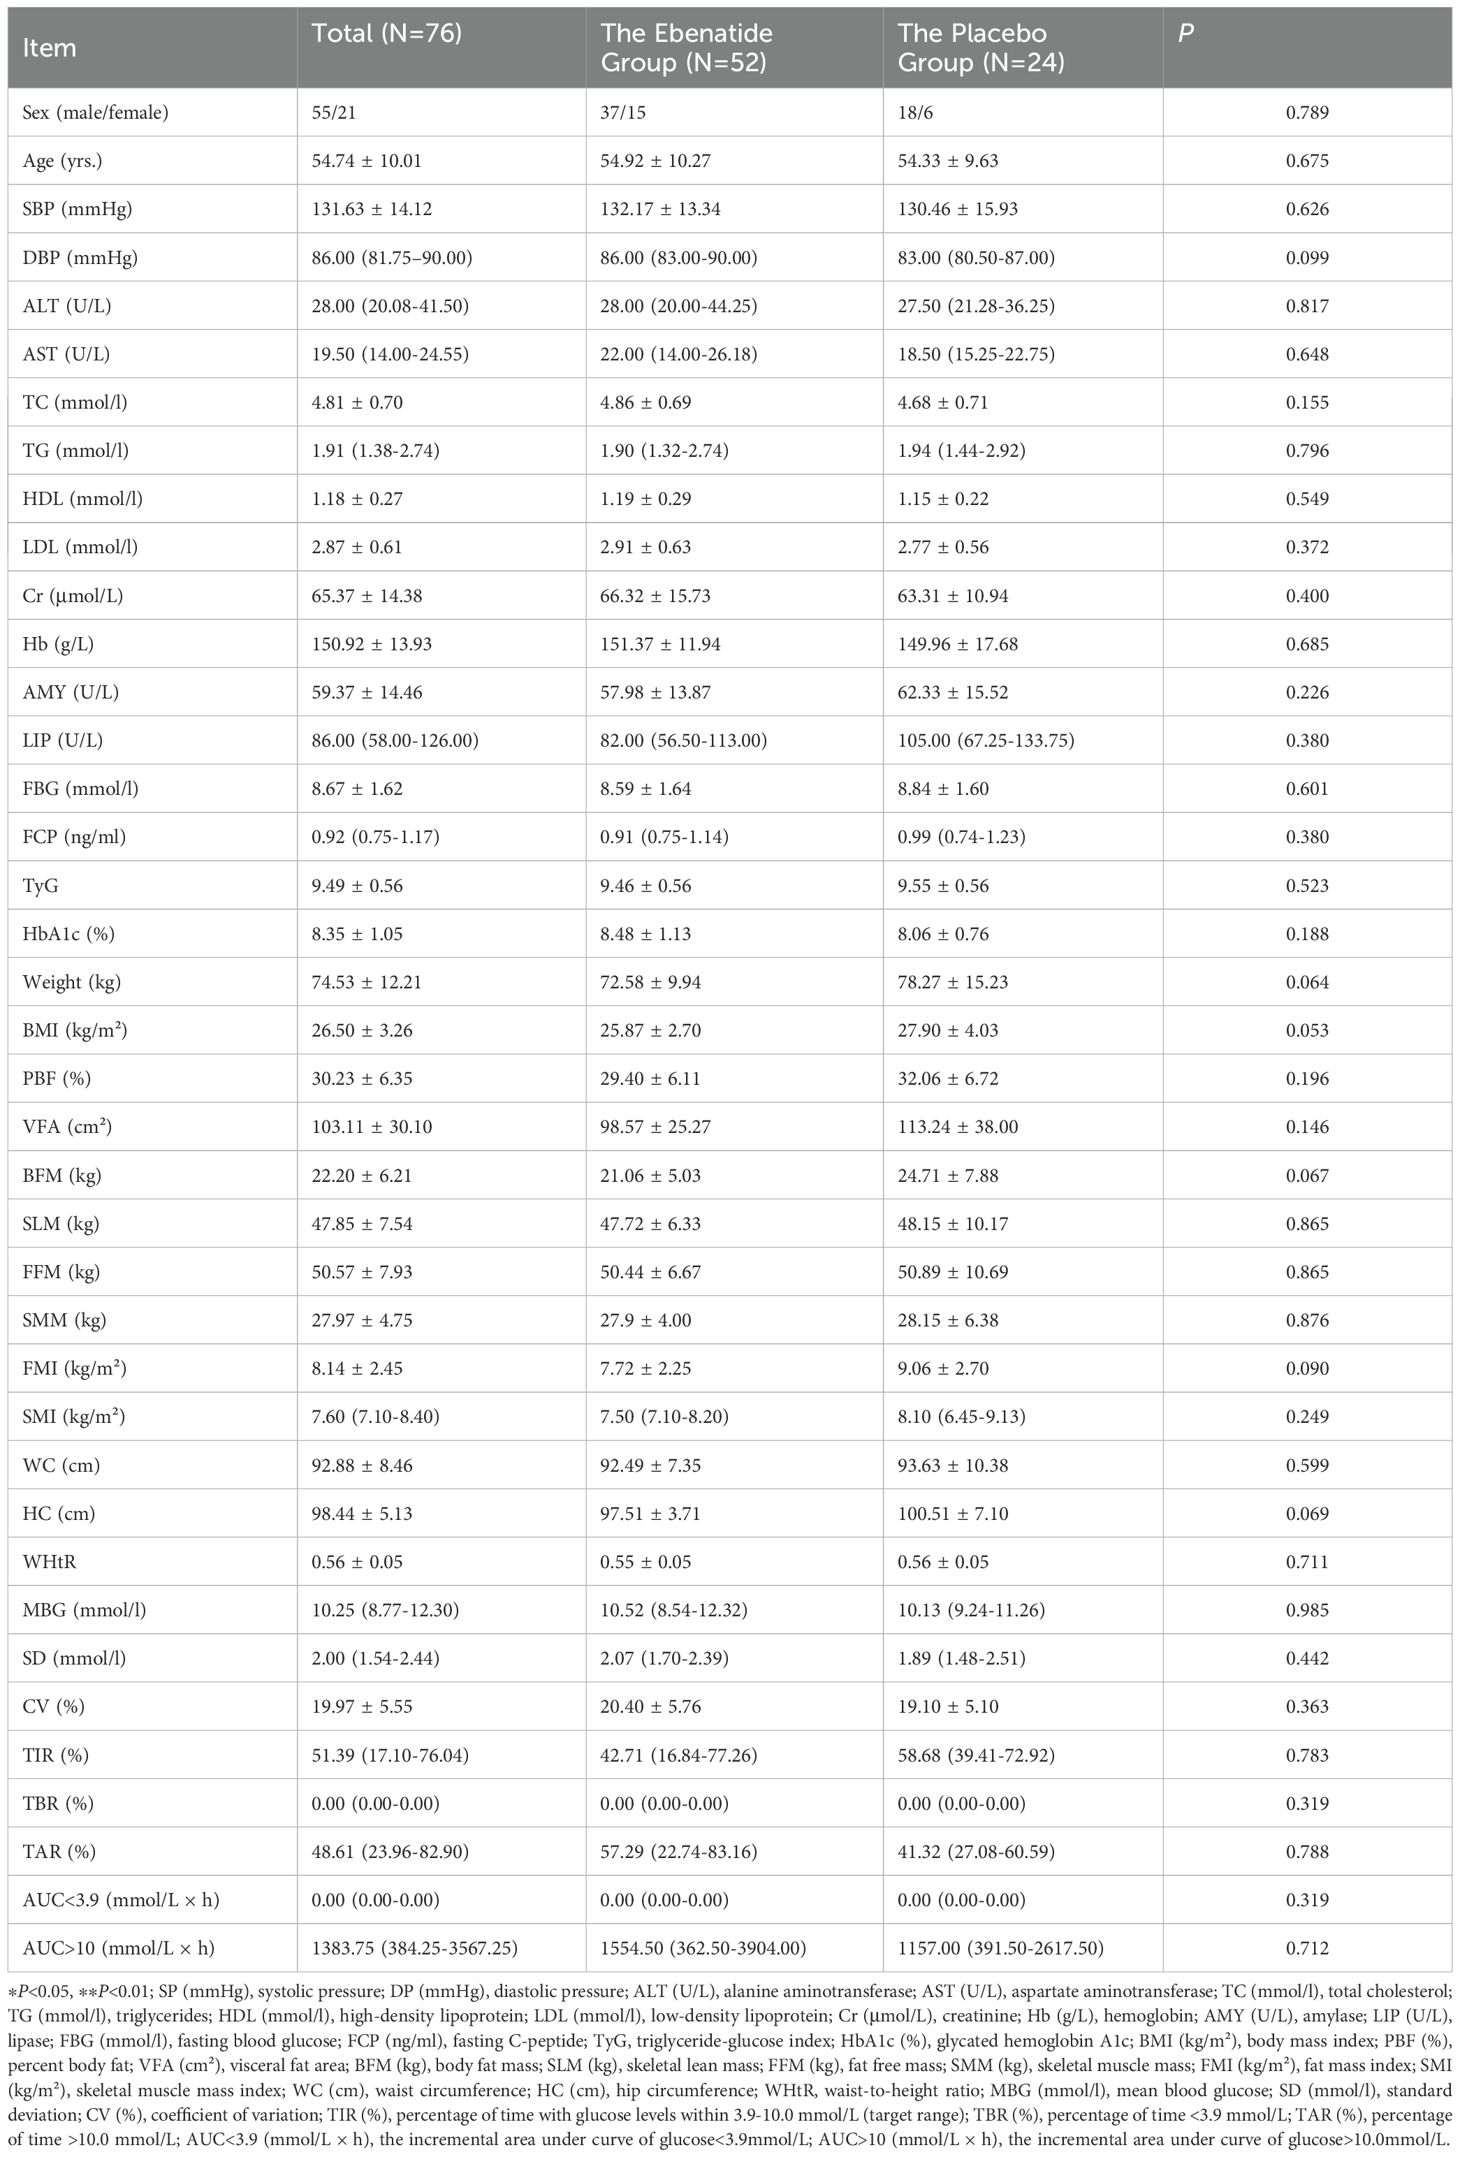
Table 1. Baseline characteristics of the patients.
3.1 Effects of Ebenatide on glycemic metabolism
In the Ebenatide group, significant reductions were observed at Week 24 compared to baseline in both FBG (8.59 ± 1.64 vs. 7.94 ± 1.50 mmol/L, P = 0.025) and HbA1c (8.48 ± 1.13% vs. 7.32 ± 0.89%, P < 0.001). Meanwhile, the placebo group also demonstrated improvement in glycemic control, with a decrease in HbA1c (8.06 ± 0.76% vs. 7.47 ± 0.69%, P = 0.002). The reduction in HbA1c was significantly greater in the Exenatide group compared to the placebo group (mean difference = 0.57% [95% CI: 0.14 to 1.04], P = 0.011) (Figure 3).
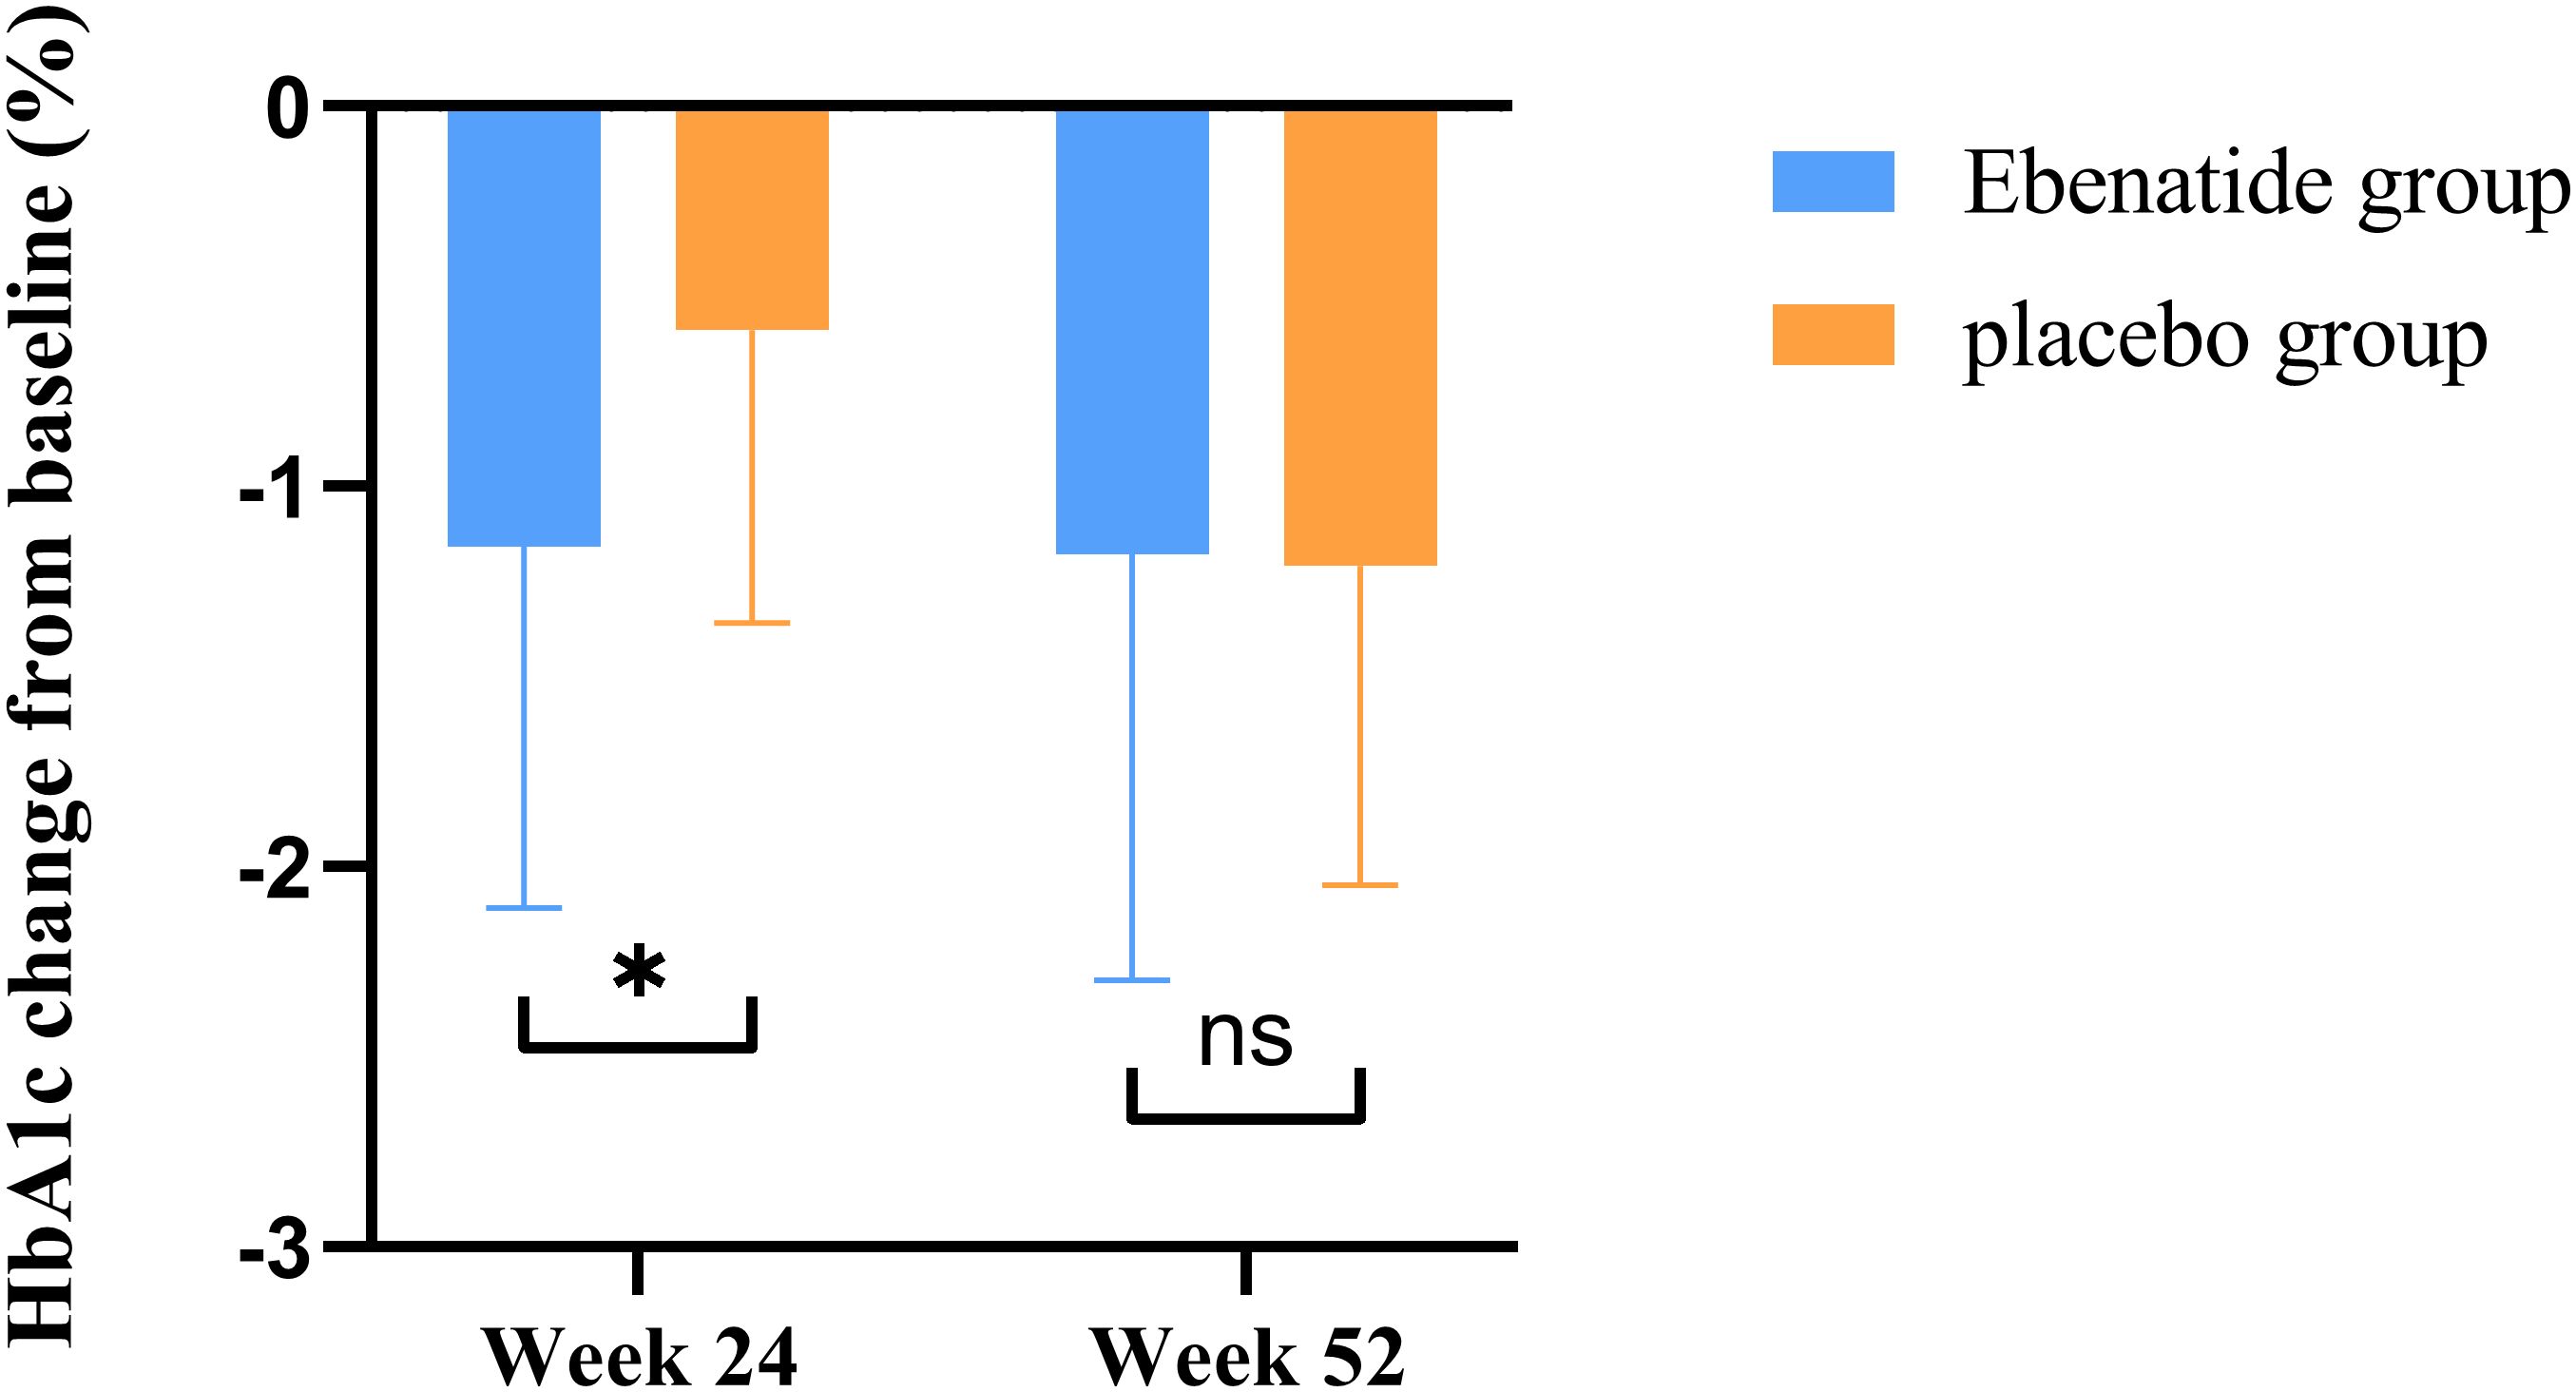
Figure 3. Changes in HbA1c from baseline in the Ebenatide group versus placebo group after treatment. Comparison of the magnitude of HbA1c reduction from baseline between the Ebenatide and placebo groups. *P<0.05; ns, not statistically significant between groups.
After 52 weeks of treatment, the Ebenatide group maintained sustained reductions in HbA1c compared to baseline (8.48 ± 1.13% vs. 7.30 ± 0.91%, P < 0.001), the reduction magnitude plateaued after Week 24. The placebo group similarly showed significant HbA1c decreases at Week 52 versus both baseline and Week 24 measurements (baseline: 8.06 ± 0.76% vs. 24 weeks: 7.47 ± 0.69% vs. 52 weeks: 6.85 ± 0.67%; P < 0.001). The placebo group demonstrated more pronounced reductions in both FBG and HbA1c from Week 24 compared to the Ebenatide group during the same period (all P < 0.05).
Using HbA1c <7% as the glycemic target criterion, significant differences in achievement rates were observed between the Ebenatide and placebo groups. At Week 24, the target achievement rate in the Ebenatide group was significantly higher than that in the placebo group (37% vs. 17%). By Week 52, the Ebenatide group maintained its achievement rate at 37%, while the placebo group showed a marked increase to 58% (Table 2).
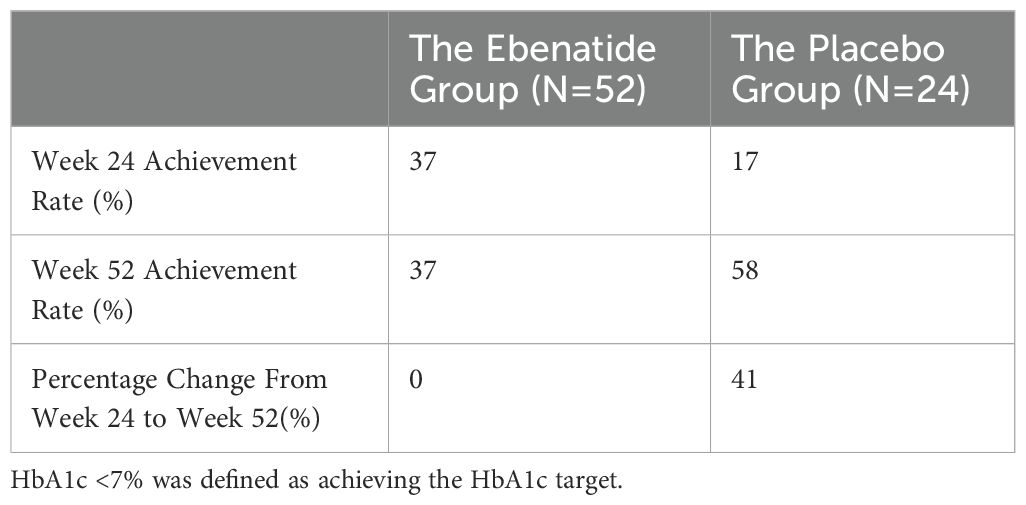
Table 2. HbA1c target achievement in the Ebenatide group versus placebo group (n=52).
By Week 24, the Ebenatide group exhibited a reduction in TyG compared to baseline, though this change did not reach statistical significance. At Week 52, TyG showed significant decreases relative to both baseline and the 24th week in the Ebenatide group (baseline: 9.46 ± 0.56 vs. 24 weeks: 9.28 ± 0.60 vs. 52 weeks: 8.76 ± 0.62; P < 0.001). Similarly, in the placebo group at the 52nd week, TyG demonstrated significant reductions versus baseline and the 24th week measurements (baseline: 9.55 ± 0.56 vs. 24 weeks: 9.33 ± 0.47 vs. 52 weeks: 8.69 ± 0.43; P < 0.001). Detailed results are shown in Table 3.
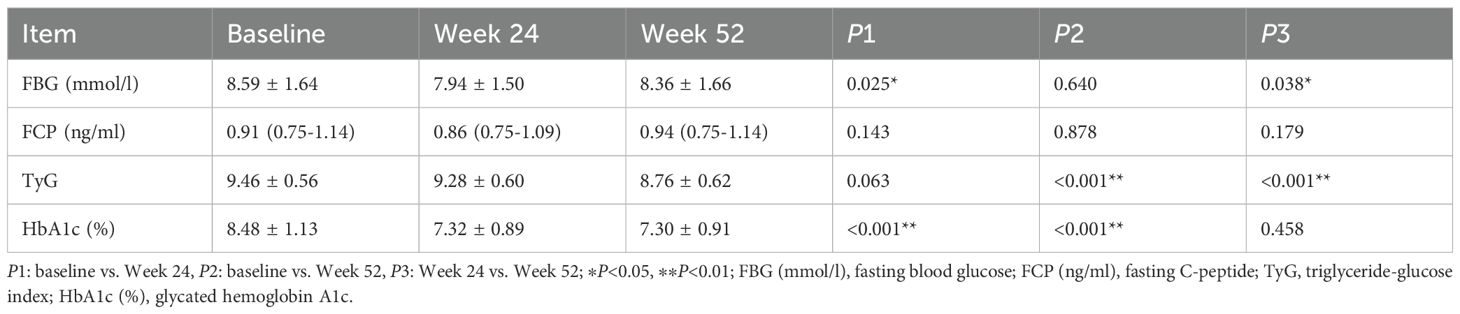
Table 3. Comparison of glucose metabolism parameters before and after treatment in the Ebenatide group (n=52).
3.2 Effects of Ebenatide on CGM parameters
After 24 weeks of treatment, the Ebenatide group exhibited a significant increase in TIR compared to baseline (42.71% [16.84-77.26] vs. 81.94% [63.19-97.92], P < 0.001). In contrast, while the placebo group demonstrated improvement in TIR, change did not reach statistical significance. The Ebenatide group showed superior improvement in TIR relative to the placebo group (mean difference = -16.92% [95% CI: -32.27 to -1.57], P = 0.031).
By Week 52, the Exenatide group maintained higher TIR versus baseline (42.71% [16.84-77.26] vs. 91.67% [77.43-97.21], P <0.001), with no significant additional gain after Week 24. The placebo group demonstrated significant TIR improvements at Week 52 versus both baseline and Week 24 measurements (baseline: 58.68% [39.41-72.92] vs. 24 weeks: 70.49% [60.76-83.33] vs. 52 weeks: 98.61% [81.94-100.00]; P < 0.05). However, no statistically significant between-group differences in TIR were observed at Week 52.
After 24 weeks of treatment, the Ebenatide group showed significant reductions from baseline in MBG, SD, TAR, and AUC >10 (all P < 0.05). In contrast, the placebo group demonstrated improvement only in MBG (P < 0.05) without significant changes in other metrics. Comparative analysis revealed that the improvement in TAR was significantly greater in the Ebenatide group than in the placebo group (P = 0.024). After 52 weeks, the Ebenatide group exhibited significant reductions from baseline in MBG, SD, TAR, and AUC>10 (all P < 0.001), with no statistically significant differences compared to Week 24 values. The placebo group showed significant improvements in MBG and TAR versus both baseline and Week 24 measurements (both P < 0.01). However, no significant between-group differences were observed for other CGM parameters at Week 52.
Throughout the treatment period, both the Ebenatide and placebo groups maintained an undetectable TBR and AUC<3.9.
The 24-hour glucose profiles demonstrated that the Ebenatide group achieved significant reductions in hourly glucose levels at both Week 24 and Week 52 compared to baseline (all P < 0.01), with particularly pronounced decreases during postprandial periods. In the placebo group, glucose-lowering effects were more marked at Week 52 than Week 24, with statistically significant reductions observed specifically during post-lunch (11:00-13:00, P < 0.01) and post-dinner (20:00-24:00, P < 0.05) intervals (Figures 4, 5). Detailed results are shown in Table 4.
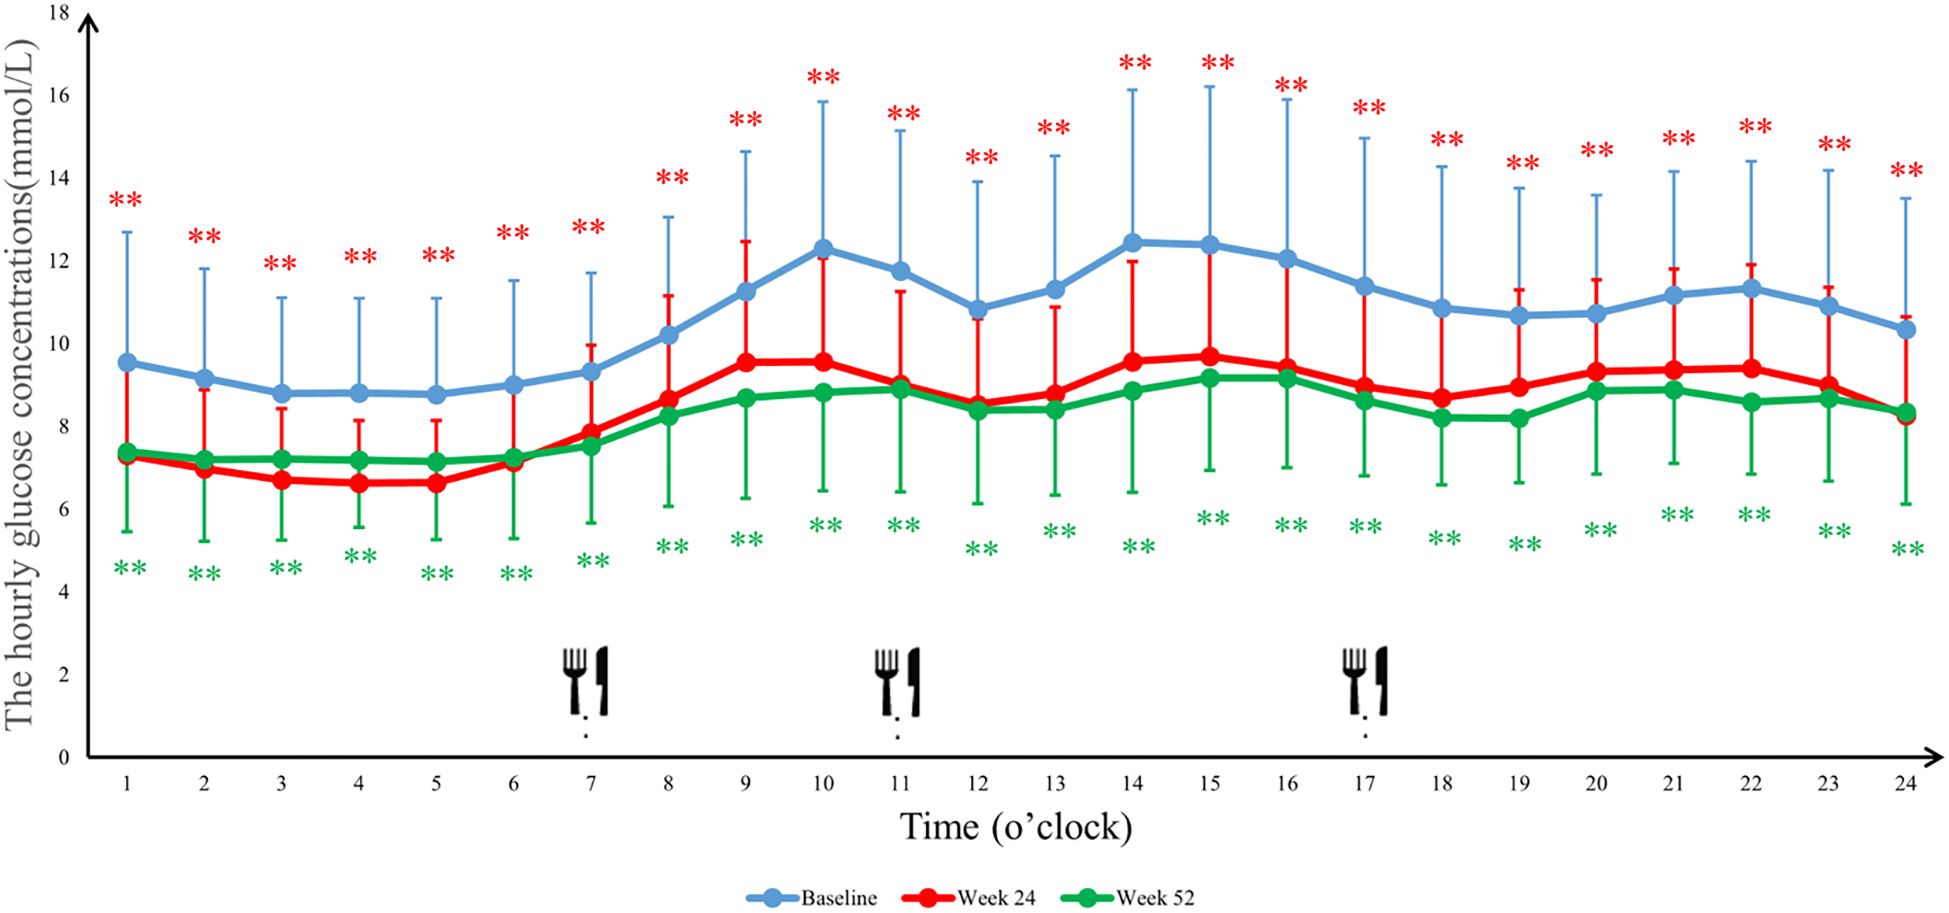
Figure 4. The average blood glucose concentrations per hour in the Ebenatide group. 24-h continuous glucose monitoring (CGM) profiles of the Ebenatide group at baseline, Week 24, and Week 52. Data are presented as mean ± SD. Meal times were 07:00, 11:00, and 17:00 for breakfast, lunch, and dinner. ∗P<0.05, ∗∗P<0.01.
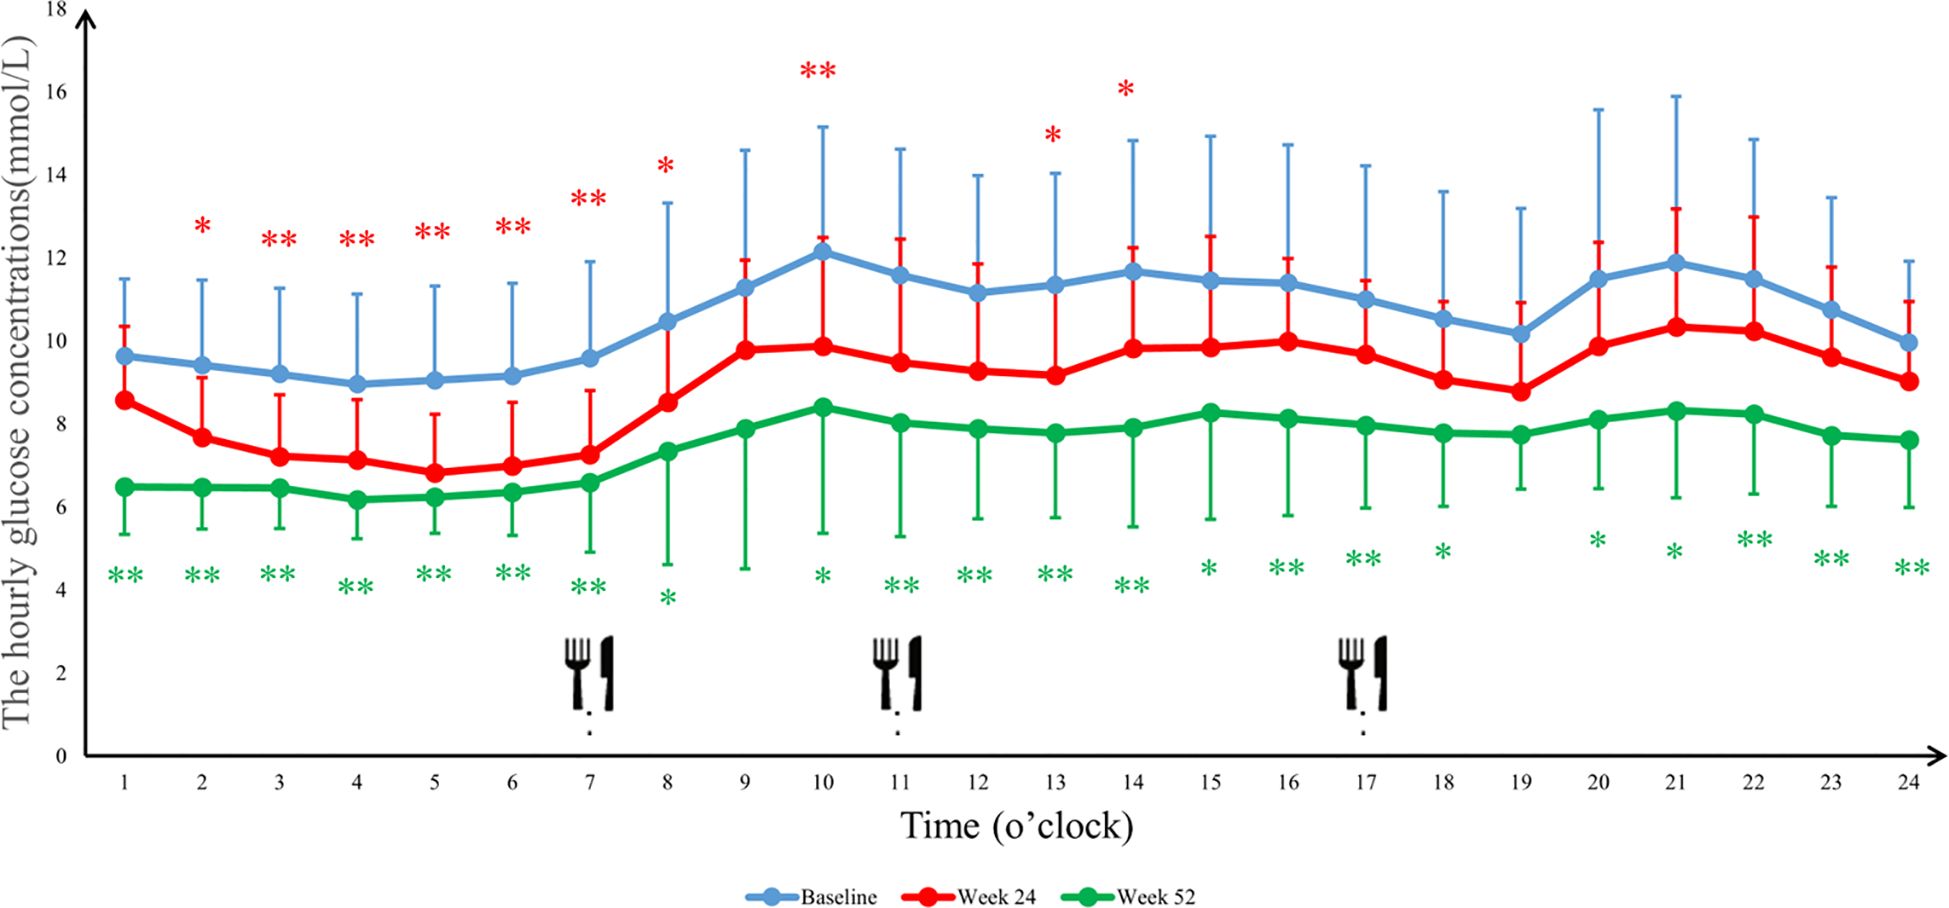
Figure 5. The average blood glucose concentrations per hour in the placebo group. 24-h continuous glucose monitoring (CGM) profiles of the placebo group at baseline, Week 24, and Week 52. Data are presented as mean ± SD. Meal times were 07:00, 11:00, and 17:00 for breakfast, lunch, and dinner. ∗P<0.05, ∗∗P<0.01.
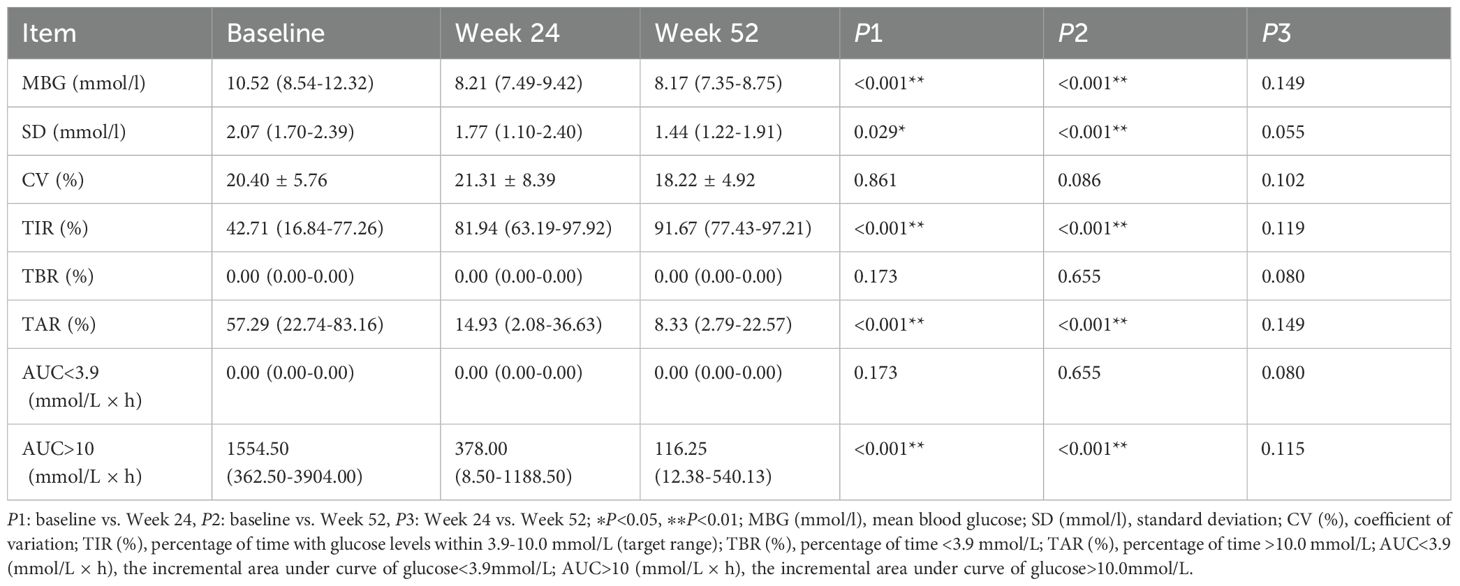
Table 4. Comparison of CGM parameters before and after treatment in the Ebenatide group (n=50).
3.3 Effects of Ebenatide on body composition parameters
After 24 weeks of treatment, the Ebenatide group exhibited significant reductions from baseline in body weight, BMI, percent body fat (PBF), visceral fat area (VFA), body fat mass (BFM), fat mass index (FMI), WC, and WHtR (all P < 0.05). No significant changes from baseline were observed in skeletal lean mass (SLM), fat free mass (FFM), skeletal muscle mass (SMM), or skeletal muscle mass index (SMI) in either the Ebenatide or placebo groups, and no statistically significant differences between the two groups.
After 52 weeks of treatment, the Ebenatide group maintained significant reductions from baseline in body weight, WC, and WHtR (all P < 0.05). However, no statistically significant differences were observed for BMI, PBF, VFA, BFM, or FMI compared to baseline, though BMI continued to show a downward trend, while PBF, VFA, BFM, and FMI exhibited mild increases relative to Week 24 measurements. Between Week 24 and Week 52, the Ebenatide group demonstrated significant decreases in FFM, SMM, and SMI (all P < 0.05), though these parameters did not differ significantly from baseline levels. Similarly, the placebo group also showed significant reductions in SLM, FFM, and SMM (all P < 0.05). Detailed results are shown in Table 5.
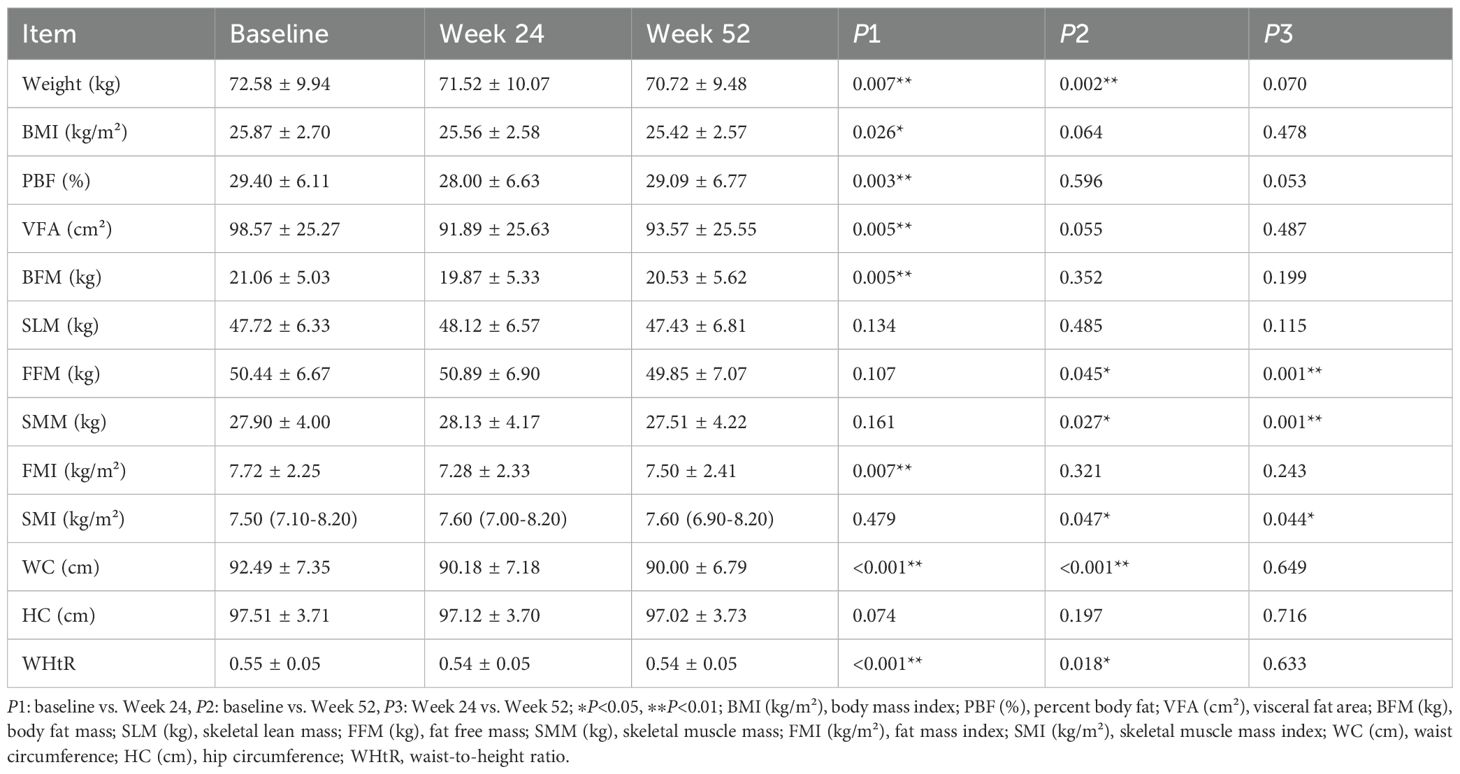
Table 5. Comparison of body composition parameters before and after treatment in the Ebenatide group (n=51).
3.4 Effects of Ebenatide on conventional metabolic parameters
After 24 weeks of treatment, the Ebenatide group demonstrated significant reductions from baseline in SBP, DBP, and hemoglobin levels, along with significant increases in serum amylase and lipase levels (all P < 0.05). These trends in blood pressure and hemoglobin persisted after 52 weeks (all P < 0.05 versus baseline), while the elevations in serum amylase and lipase remained significantly higher than baseline at both time points (both P < 0.05). At Week 52, the placebo group showed reduced SBP, DBP and TC, but increased serum lipase and amylase versus baseline. Compared to Week 24, further decreases were seen in SBP and TC, while only serum amylase increased. All these changes reached statistical significance (all P < 0.05). Detailed results are shown in Table 6.
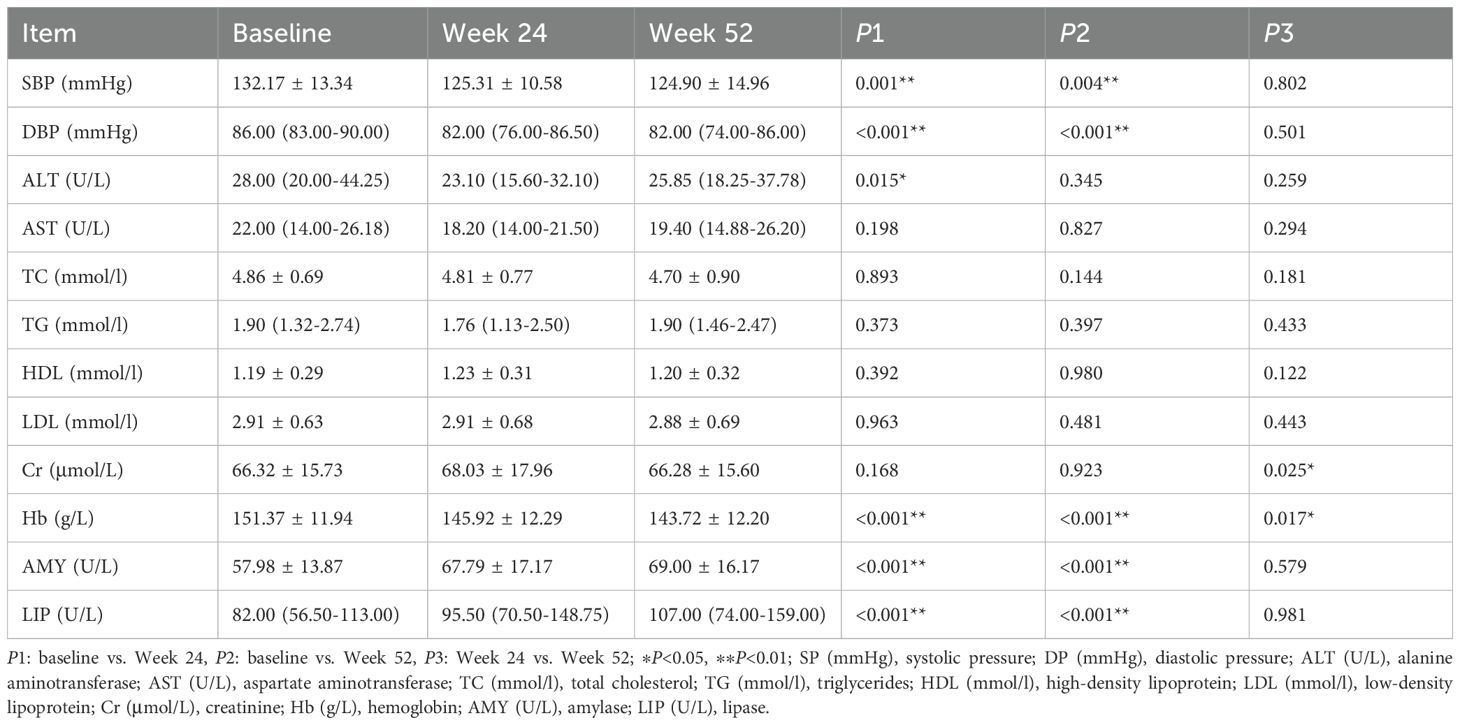
Table 6. Comparison of conventional metabolic parameters before and after treatment in the Ebenatide group (n=52).
4 Discussion
This study demonstrated that Ebenatide showed significant and sustained glucose-lowering effects. Although no further reduction in HbA1c was observed between Week 24 and Week 52, CGM revealed further improvement in TIR, indicating that long-term Ebenatide treatment could progressively enhance TIR. The CGM results demonstrated that Ebenatide treatment reduced glycemic variability, with hourly glucose declines particularly prominent in postprandial glucose. Previous studies have shown that long-term glycemic variability is strongly associated with an increased risk of stroke and cardiovascular events in T2DM patients (16, 17). Iatrogenic hypoglycemia may contribute to emotional burden (18), and is linked to falls and cognitive impairment, while hypoglycemia in T2DM patients is associated with higher cardiovascular event rates (19). No hypoglycemic episodes occurred during Ebenatide treatment.
In recent years, TyG has gained increasing recognition for its role in assessing insulin resistance and predicting glycemic control in T2DM. Elevated TyG levels have been consistently associated with higher risks of diabetic kidney disease, coronary artery disease, heart failure, atrial fibrillation, and ischemic stroke (12, 13, 20, 21). The present study demonstrates that Ebenatide treatment produces sustained reductions in TyG, with progressively enhanced effects over time. Notably, statistically significant differences in TyG were observed between baseline and Week 52, indicating that Ebenatide’s beneficial effects on insulin resistance intensify with prolonged administration. These findings suggest that extended Ebenatide treatment could provide durable improvements in insulin resistance, though longer-term studies are needed to fully characterize these sustained metabolic benefits.
GLP-1 RAs demonstrate heterogeneous glycemic efficacy across clinical trials. In our study, Ebenatide achieved a mean HbA1c reduction of 1.18% at Week 52. For context, other GLP-1RAs reported the following HbA1c changes in separate trials: Exenatide (Δ -0.81%) (22), Polyethylene Glycol Loxenatide (Δ -1.01%) (23), Semaglutide (Δ -1.09% to -1.59%) (24), and Tirzepatide (Δ -1.60% to -1.96%) (24).
Numerous studies have demonstrated that Tirzepatide exhibits superior weight-loss efficacy compared to Semaglutide (25), with optimal performance in reducing both BMI and waist circumference (19). Although Ebenatide’s weight-loss effect is not as pronounced as above two agents, it shows significant advantages over Loxenatide (22, 26), which is a homologue of Ebenatide with inferior weight-loss outcomes. Body composition analysis revealed that Ebenatide-treated patients exhibited marked reductions in adiposity metrics as early as 24 weeks of treatment. These findings not only corroborate Ebenatide’s effectiveness in weight management but also highlight its positive role in improving fat distribution, particularly in reducing visceral adipose tissue. Excessive adipose tissue, especially visceral adipose tissue, exacerbates insulin resistance and accelerates T2DM progression (27). Evidence indicates positive correlations between HbA1c/FBG and obesity-related indices (28), suggesting that Ebenatide may confer dual benefits via direct glucose-lowering and indirect adiposity-modifying mechanisms. However, after 52 weeks, minor rebounds in some adiposity parameters were observed, potentially reflecting the development of tolerance with prolonged Ebenatide use. The phenomenon consistent with prior reports of tolerance induction during long-term therapy with other extended-action GLP-1RAs (29).
Diabetes and sarcopenia mutually exacerbate each other thus forming a vicious cycle. The reduction in muscle mass increases the risk of various diabetic complications, including diabetic nephropathy and peripheral neuropathy (30–32). We observed preserved muscle-related parameters (FFM, SMM, and SMI) after 24 weeks of treatment, while these indices demonstrated decline at Week 52. These findings suggest that short-term Ebenatide treatment (≤24 weeks) has minimal impact on muscle mass, whereas prolonged administration (52 weeks) may exert potentially adverse effects on muscular composition. This aligns with a previous study demonstrating that Liraglutide treatment reduced both lean body mass and adiposity in patients (33). However, another study found that Semaglutide preserved muscle mass to some extent while reducing fat mass (34). Weight loss surgery is frequently associated with reductions in lean body mass, FFM, and SMM (35). In the present study, the observed decline in muscle mass may similarly stem from energy metabolism dysregulation secondary to appetite suppression and reduced caloric intake. The detailed mechanisms underlying these changes in muscle-related parameters require further investigation.
Our study demonstrated significant reductions in both systolic and diastolic blood pressure from baseline at Week 24 and Week 52 with Ebenatide treatment. Studies have identified coefficients of variation for SBP, DBP, FBG, and HbA1c as important predictors of stroke, cardiovascular events, and related mortality (36). The concurrent blood pressure-lowering and glucose-lowering effects of Ebenatide suggest its potential cardioprotective benefits through multiple mechanisms.
Additionally, Ebenatide treatment exhibited measurable effects on serum amylase elevation, lipase elevation, and hemoglobin reduction. Although no cases of pancreatitis or anemia diagnosed, considered pancreatitis has been frequently reported as a GLP-1RAs-associated adverse drug reaction (37), regular monitoring remains essential to ensure treatment safety. The observed hemoglobin reduction represents an uncommon finding among GLP-1RAs, warranting further investigation into Ebenatide-specific mechanisms affecting hemoglobin levels.
Studies have identified gastrointestinal reactions as frequent adverse effects of GLP-1RAs treatment, with nausea, vomiting, diarrhea, and constipation being the most commonly reported (38). During the study, patients in Ebenatide group experienced mild-to-moderate gastrointestinal reactions in the first 24 weeks of treatment, primarily self-limiting nausea (9.6%) and vomiting (5.8%), which is consistent with the GLP-1 receptor agonist class. These symptoms showed gradual amelioration with prolonged treatment duration. Further studies with larger sample sizes are required to better characterize the gastrointestinal tolerability profile of Ebenatide.
Collectively, Ebenatide demonstrates favorable glycemic control and weight reduction effects among GLP-1 RAs, with additional blood pressure-lowering benefits not consistently observed with other agents in this class. Its safety profile is characterized by manageable gastrointestinal adverse events, consistent with the established tolerability profile of GLP-1-based therapies. However, these numerical differences must be interpreted with caution due to variations in trial designs, and the relative efficacy ranking remains to be validated in head-to-head trials.
The placebo group also exhibited improved glycemic control and reductions in body weight and fat mass prior to drug administration, which may be attributed to strict dietary and exercise interventions. As a guideline-recommended treatment strategy, the efficacy of lifestyle modifications (including dietary control and physical activity) in diabetes management has been well documented in multiple clinical studies (39, 40).
Furthermore, we separately analyzed data from the Ebenatide monotherapy group and the Ebenatide+metformin group. The overall findings were consistent with the total population results. Due to its smaller sample size, certain outcomes in the Ebenatide+metformin group demonstrated only directional trends without reaching statistical significance. These observations warrant further investigation with larger-scale clinical trials for definitive evaluation.
5 Conclusion
Ebenatide treatment for 24 weeks significantly improved multiple metabolic parameters including HbA1c, TIR, TyG, weight, WC, and WHtR. These therapeutic benefits were sustained for at least 52 weeks. However, close monitoring of serum amylase, lipase, hemoglobin levels, and muscle mass is recommended during treatment.
Data availability statement
The original contributions presented in the study are included in the article/supplementary material, further inquiries can be directed to the corresponding authors.
Ethics statement
The studies involving humans were approved by the Ethics Committee of Nanjing First Hospital, Nanjing Medical University. The studies were conducted in accordance with the local legislation and institutional requirements. The participants provided their written informed consent to participate in this study. Written informed consent was obtained from the individual(s) for the publication of any potentially identifiable images or data included in this article.
Author contributions
C-lX: Writing – review & editing, Data curation, Formal Analysis, Writing – original draft. X-cK: Data curation, Project administration, Writing – review & editing. X-mL: Project administration, Data curation, Writing – review & editing. X-hX: Writing – review & editing, Project administration. B-lL: Formal Analysis, Data curation, Project administration, Writing – review & editing. J-hM: Writing – review & editing, Project administration.
Funding
The author(s) declare that financial support was received for the research and/or publication of this article. The study and article processing charges were supported by Nanjing Municipal Health Commission (Project No. ZKX22038).
Conflict of interest
The authors declare that the research was conducted in the absence of any commercial or financial relationships that could be construed as a potential conflict of interest.
Generative AI statement
The author(s) declare that no Generative AI was used in the creation of this manuscript.
Publisher’s note
All claims expressed in this article are solely those of the authors and do not necessarily represent those of their affiliated organizations, or those of the publisher, the editors and the reviewers. Any product that may be evaluated in this article, or claim that may be made by its manufacturer, is not guaranteed or endorsed by the publisher.
Supplementary material
The Supplementary Material for this article can be found online at: https://www.frontiersin.org/articles/10.3389/fendo.2025.1622526/full#supplementary-material
References
1. Li YZ, Teng D, Shi XG, Qin G, Qin Y, Quan H, et al. Prevalence of diabetes recorded in mainland China using 2018 diagnostic criteria from the American Diabetes Association: national cross sectional study. BMJ (Clinical Res ed). (2020) 369:m997. doi: 10.1136/bmj.m997
2. Su B, Wang Y, Dong Y, Hu G, Xu Y, Peng X, et al. Trends in diabetes mortality in urban and rural China, 1987-2019: A joinpoint regression analysis. Front Endocrinol (Lausanne). (2021) 12:777654. doi: 10.3389/fendo.2021.777654
3. Douros JD, Flak JN, and Knerr PJ. The agony and the efficacy: central mechanisms of GLP-1 induced adverse events and their mitigation by GIP. Front Endocrinol (Lausanne). (2025) 16:1530985. doi: 10.3389/fendo.2025.1530985
4. Pedrosa MR, Franco DR, Gieremek HW, Vidal CM, Bronzeri F, de Cassia Rocha A, et al. GLP-1 agonist to treat obesity and prevent cardiovascular disease: what have we achieved so far? Curr Atheroscl Rep. (2022) 24:867–84. doi: 10.1007/s11883-022-01062-2
5. Rolek B, Haber M, Gajewska M, Rogula S, Pietrasik A, and Gąsecka A. SGLT2 inhibitors vs. GLP-1 agonists to treat the heart, the kidneys and the brain. J Cardiovasc Dev disease. (2023) 10(8):322. doi: 10.3390/jcdd10080322
6. Danne T, Nimri R, Battelino T, Bergenstal RM, Close KL, DeVries JH, et al. International consensus on use of continuous glucose monitoring. Diabetes Care. (2017) 40:1631–40. doi: 10.2337/dc17-1600
7. Yoo JH and Kim JH. Time in range from continuous glucose monitoring: A novel metric for glycemic control. Diabetes Metab J. (2020) 44:828–39. doi: 10.4093/dmj.2020.0257
8. Rodríguez Jiménez B, Rodríguez de Vera Gómez P, Belmonte Lomas S, Mesa Díaz ÁM, Caballero Mateos I, Galán I, et al. Transforming body composition with semaglutide in adults with obesity and type 2 diabetes mellitus. Front Endocrinol (Lausanne). (2024) 15:1386542. doi: 10.3389/fendo.2024.1386542
9. Zhang FL, Ren JX, Zhang P, Jin H, Qu Y, Yu Y, et al. Strong association of waist circumference (WC), body mass index (BMI), waist-to-height ratio (WHtR), and waist-to-hip ratio (WHR) with diabetes: A population-based cross-sectional study in jilin province, China. J Diabetes Res. (2021) 2021:8812431. doi: 10.1155/2021/8812431
10. Ke JF, Wang JW, Lu JX, Zhang ZH, Liu Y, and Li LX. Waist-to-height ratio has a stronger association with cardiovascular risks than waist circumference, waist-hip ratio and body mass index in type 2 diabetes. Diabetes Res Clin practice. (2022) 183:109151. doi: 10.1016/j.diabres.2021.109151
11. Wang S, Zhang X, Keerman M, Guo H, He J, Maimaitijiang R, et al. Impact of the baseline insulin resistance surrogates and their longitudinal trajectories on cardiovascular disease (coronary heart disease and stroke): a prospective cohort study in rural China. Front Endocrinol (Lausanne). (2023) 14:1259062. doi: 10.3389/fendo.2023.1259062
12. Lv L, Zhou Y, Chen X, Gong L, Wu J, Luo W, et al. Relationship between the tyG index and diabetic kidney disease in patients with type-2 diabetes mellitus. Diabetes Metab syndrome obesity: Targets Ther. (2021) 14:3299–306. doi: 10.2147/DMSO.S318255
13. Nayak SS, Kuriyakose D, Polisetty LD, Patil AA, Ameen D, Bonu R, et al. Diagnostic and prognostic value of triglyceride glucose index: a comprehensive evaluation of meta-analysis. Cardiovasc diabetology. (2024) 23:310. doi: 10.1186/s12933-024-02392-y
14. Sun Y and Hu Y. Association of triglyceride-glucose-body mass index with all-cause mortality among individuals with cardiovascular disease: results from NHANES. Front Endocrinol (Lausanne). (2025) 16:1529004. doi: 10.3389/fendo.2025.1529004
15. American Diabetes Association4. Lifestyle management: standards of medical care in diabetes-2018. Diabetes Care. (2018) 41:S38–s50. doi: 10.2337/dc18-S004
16. Ren X, Wang Z, and Guo C. Long-term glycemic variability and risk of stroke in patients with diabetes: a meta-analysis. Diabetol Metab Syndr. (2022) 14:6. doi: 10.1186/s13098-021-00770-0
17. Wang T, Zhang X, and Liu J. Long-term glycemic variability and risk of cardiovascular events in type 2 diabetes: A meta-analysis. Hormone Metab Res = Hormon- und Stoffwechselforschung = Hormones metabolisme. (2022) 54:84–93. doi: 10.1055/a-1730-5029
18. Iwahori T, Snoek F, Nagai Y, Spaepen E, Mitchell BD, and Peyrot M. Conversations and reactions around severe hypoglycemia (CRASH): Japan results from a global survey of people with T1DM or insulin-treated T2DM and caregivers. Diabetes therapy: research Treat Educ Diabetes related Disord. (2022) 13:517–33. doi: 10.1007/s13300-022-01211-5
19. Galdón Sanz-Pastor A, Justel Enríquez A, Sánchez Bao A, and Ampudia-Blasco FJ. Current barriers to initiating insulin therapy in individuals with type 2 diabetes. Front Endocrinol (Lausanne). (2024) 15:1366368. doi: 10.3389/fendo.2024.1366368
20. Yang Y, Huang X, Wang Y, Leng L, Xu J, Feng L, et al. The impact of triglyceride-glucose index on ischemic stroke: a systematic review and meta-analysis. Cardiovasc diabetology. (2023) 22:2. doi: 10.1186/s12933-022-01732-0
21. Zhang F and Hou X. Association between the triglyceride glucose index and heart failure: NHANES 2007-2018. Front Endocrinol (Lausanne). (2023) 14:1322445. doi: 10.3389/fendo.2023.1322445
22. Yao H, Zhang A, Li D, Wu Y, Wang CZ, Wan JY, et al. Comparative effectiveness of GLP-1 receptor agonists on glycaemic control, body weight, and lipid profile for type 2 diabetes: systematic review and network meta-analysis. BMJ (Clinical Res ed). (2024) 384:e076410. doi: 10.1136/bmj-2023-076410
23. Liu Y, Ma W, Fu H, Zhang Z, Yin Y, Wang Y, et al. Efficacy of polyethylene glycol loxenatide for type 2 diabetes mellitus patients: a systematic review and meta-analysis. Front Pharmacol. (2024) 15:1235639. doi: 10.3389/fphar.2024.1235639
24. Karagiannis T, Malandris K, Avgerinos I, Stamati A, Kakotrichi P, Liakos A, et al. Subcutaneously administered tirzepatide vs semaglutide for adults with type 2 diabetes: a systematic review and network meta-analysis of randomised controlled trials. Diabetologia. (2024) 67:1206–22. doi: 10.1007/s00125-024-06144-1
25. Frías JP, Davies MJ, Rosenstock J, Pérez Manghi FC, Fernández Landó L, Bergman BK, et al. Tirzepatide versus semaglutide once weekly in patients with type 2 diabetes. New Engl J Med. (2021) 385:503–15. doi: 10.1056/NEJMoa2107519
26. Salamah HM, Marey A, Elsayed E, Hasan MT, Mahmoud A, Abualkhair KA, et al. Efficacy and safety of polyethylene glycol loxenatide in type 2 diabetic patients: a systematic review and meta-analysis of randomized controlled trials. Sci Rep. (2023) 13:19041. doi: 10.1038/s41598-023-46274-x
27. Zhu J and Wilding JPH. Body fat depletion: the yin paradigm for treating type 2 diabetes. Curr Atheroscl Rep. (2024) 26:1–10. doi: 10.1007/s11883-023-01181-4
28. Li S, Li S, Ding J, and Zhou W. Visceral fat area and body fat percentage measured by bioelectrical impedance analysis correlate with glycometabolism. BMC endocrine Disord. (2022) 22:231. doi: 10.1186/s12902-022-01142-z
29. Nauck MA, Quast DR, Wefers J, and Meier JJ. GLP-1 receptor agonists in the treatment of type 2 diabetes - state-of-the-art. Mol Metab. (2021) 46:101102. doi: 10.1016/j.molmet.2020.101102
30. Hou Y, Xiang J, Wang B, Duan S, Song R, Zhou W, et al. Pathogenesis and comprehensive treatment strategies of sarcopenia in elderly patients with type 2 diabetes mellitus. Front Endocrinol (Lausanne). (2023) 14:1263650. doi: 10.3389/fendo.2023.1263650
31. Lin X, Chen Z, Huang H, Zhong J, and Xu L. Diabetic kidney disease progression is associated with decreased lower-limb muscle mass and increased visceral fat area in T2DM patients. Front Endocrinol (Lausanne). (2022) 13:1002118. doi: 10.3389/fendo.2022.1002118
32. Fang Y, Yuan X, Zhang Q, Liu J, Yao Q, and Ye X. Causality between sarcopenia and diabetic neuropathy. Front Endocrinol (Lausanne). (2024) 15:1428835. doi: 10.3389/fendo.2024.1428835
33. Silver HJ, Olson D, Mayfield D, Wright P, Nian H, Mashayekhi M, et al. Effect of the glucagon-like peptide-1 receptor agonist liraglutide, compared to caloric restriction, on appetite, dietary intake, body fat distribution and cardiometabolic biomarkers: A randomized trial in adults with obesity and prediabetes. Diabetes Obes Metab. (2023) 25:2340–50. doi: 10.1111/dom.15113
34. Ozeki Y, Masaki T, Kamata A, Miyamoto S, Yoshida Y, Okamoto M, et al. The effectiveness of GLP-1 receptor agonist semaglutide on body composition in elderly obese diabetic patients: A pilot study. Medicines (Basel Switzerland). (2022) 9(9):47. doi: 10.3390/medicines9090047
35. Nuijten MAH, Eijsvogels TMH, Monpellier VM, Janssen IMC, Hazebroek EJ, and Hopman MTE. The magnitude and progress of lean body mass, fat-free mass, and skeletal muscle mass loss following bariatric surgery: A systematic review and meta-analysis. Obes Rev. (2022) 23:e13370. doi: 10.1111/obr.13370
36. Lin CC, Li CI, Juan YL, Liu CS, Lin CH, Yang SY, et al. Joint effect of blood pressure and glycemic variation on the risk of cardiovascular morbidity and mortality in persons with type 2 diabetes. Metabolism: Clin experimental. (2022) 136:155308. doi: 10.1016/j.metabol.2022.155308
37. Shetty R, Basheer FT, Poojari PG, Thunga G, Chandran VP, and Acharya LD. Adverse drug reactions of GLP-1 agonists: A systematic review of case reports. Diabetes Metab syndrome. (2022) 16:102427. doi: 10.1016/j.dsx.2022.102427
38. Moiz A, Filion KB, Toutounchi H, Tsoukas MA, Yu OHY, Peters TM, et al. Efficacy and safety of glucagon-like peptide-1 receptor agonists for weight loss among adults without diabetes: A systematic review of randomized controlled trials. Ann Internal Med. (2025) 178:199–217. doi: 10.7326/ANNALS-24-01590
39. Łuniewski M, Matyjaszek-Matuszek B, and Lenart-Lipińska M. Diagnosis and non-invasive treatment of obesity in adults with type 2 diabetes mellitus: A review of guidelines. J Clin Med. (2023) 12(13):4431. doi: 10.3390/jcm12134431
40. Yu P, Zhu Z, He J, Gao B, Chen Q, Wu Y, et al. Effects of high-intensity interval training, moderate-intensity continuous training, and guideline-based physical activity on cardiovascular metabolic markers, cognitive and motor function in elderly sedentary patients with type 2 diabetes (HIIT-DM): a protocol for a randomized controlled trial. Front Aging Neurosci. (2023) 15:1211990. doi: 10.3389/fnagi.2023.1211990
Keywords: Ebenatide, type 2 diabetes mellitus, GLP-1, continuous glucose monitoring, body fat
Citation: Xu C-l, Kong X-c, Liu X-m, Xu X-h, Liu B-l and Ma J-h (2025) Effect of Ebenatide on glycemic metabolism and body fat in patients with type 2 diabetes mellitus. Front. Endocrinol. 16:1622526. doi: 10.3389/fendo.2025.1622526
Received: 03 May 2025; Accepted: 29 May 2025;
Published: 18 June 2025.
Edited by:
Yun Shen, Pennington Biomedical Research Center, United StatesReviewed by:
Luqin Gan, Rice University, United StatesChunyi Zhang, University of Texas MD Anderson Cancer Center, United States
Sanchit Dhankhar, Chitkara University, India
Copyright © 2025 Xu, Kong, Liu, Xu, Liu and Ma. This is an open-access article distributed under the terms of the Creative Commons Attribution License (CC BY). The use, distribution or reproduction in other forums is permitted, provided the original author(s) and the copyright owner(s) are credited and that the original publication in this journal is cited, in accordance with accepted academic practice. No use, distribution or reproduction is permitted which does not comply with these terms.
*Correspondence: Bing-li Liu, bGl1YmluZ2xpODhAMTYzLmNvbQ==; Jian-hua Ma, bWFqaWFuaHVhQGNoaW5hLmNvbQ==