 Jing Tan1†
 Xiaojuan Yao
- 1Department of Endocrine, Wuxi People’s Hospital, The Affiliated Wuxi People’s Hospital of Nanjing Medical University and Wuxi Medical Center, Nanjing Medical University, Wuxi, China
- 2Department of Clinical Nursing, School of Nursing Nanjing Medical University, Nanjing, China
- 3Department of Internal Medicine Ward, Wuxi People’s Hospital, The Affiliated Wuxi People’s Hospital of Nanjing Medical University and Wuxi Medical Center Nanjing Medical University, Wuxi, China
- 4Department of Health Management Center, Wuxi People’s Hospital, The Affiliated Wuxi People’s Hospital of Nanjing Medical University and Wuxi Medical Center, Nanjing Medical University, Wuxi, China
- 5Department of Emergency Medicine, Wuxi People’s Hospital, The Affiliated Wuxi People’s Hospital of Nanjing Medical University and Wuxi Medical Center, Nanjing Medical University, Wuxi, China
Background: Diabetes and prediabetes in the young and middle-aged population represent a significant public health challenge in China. In recent years, the prevalence of diabetes has gradually increased within this group. This study aims to evaluate the prevalence of diabetes and prediabetes in a health check-up population of young and middle-aged individuals, and to analyze the key factors influencing the new onset of diabetes. The study provides data support for the early prevention of diabetes.
Method: This study used retrospective cohort analyses to examine the data from the physical examination centers of three hospitals in Wuxi, China, for the population aged 18–59 from 2018 to 2023. Analyzing the changes in the prevalence of diabetes and prediabetes in the population. Single-factor analysis was used to examine differences in basic characteristics and laboratory indicators between individuals who developed diabetes and those who did not within five years. A multifactorial logistic regression model (MLR model), Cox proportional hazards model (Cox model), and generalized estimating equation (GEE) model were employed to analyze the factors associated with the development of diabetes. ROC curves were used to evaluate the performance of these three models. Finally, a nomogram was constructed to predict the risk of developing diabetes in the next five years.
Results: From 2018 to 2023, the number of diabetes cases increased year by year, with the highest increase of 1.39% observed between 2020 and 2021. New-onset diabetes patients had poorer lifestyle and health profiles compared to those without new-onset diabetes. New-onset diabetes group also had worse metabolic and inflammatory profiles (P < 0.05), with significantly lower eGFR (P = 0.027). The AUC values for all three models were 0.64, with the GEE model performing best in Youden index (0.237), the Cox model in sensitivity (0.577), and the MLR model in specificity (0.776). The most significant factors identified were NLR, FBG, Cr, BMI, and exercise habits. The nomogram built using these five factors showed good predictive performance with AUC values of 0.705 and 0.666 in the training and test sets, respectively.
Conclusion: The significant factors influencing the onset of diabetes include NLR, FPG, Cr, BMI, and exercise habits. The nomogram can effectively predict the risk of diabetes in the next five years, providing a powerful tool for early intervention. Future research could explore the interactions among these factors and validate the model’s applicability in different populations.
1 Introduction
Diabetes Mellitus (DM) is a chronic disease with a growing prevalence, posing a significant health burden, especially among young and middle-aged individuals (1, 2). DM is associated with high disability and mortality rates, and, despite advancements in treatment, there is currently no cure (3). In 2021, approximately 536.6 million people aged 20–79 worldwide had diabetes, and this number is projected to reach 783.2 million by 2045, with higher prevalence in urban and high-income regions (4). With improvements in living standards, dietary patterns in the country have shifted to high sugar, high fat, and high-energy foods, while the widespread use of mechanization and automation has led to reduced physical activity and exercise, contributing to the annual rise in the incidence and number of diabetes patients in China (5).
Middle-aged and young patients have become an important and often overlooked group among those with type 2 diabetes mellitus (T2DM) (6, 7). As the backbone of society and family, they face high life and work pressures, heavy psychological burdens, and often neglect their own health. With relatively low self-management abilities and insufficient role management, they are at a higher risk of accelerated complications and worsened psychological disorders. Therefore, early screening of individuals at risk for prediabetes and the implementation of targeted preventive measures during the early stages of the disease are crucial for reducing both the incidence of diabetes and its associated societal burden.
Prediabetes (PDM) is a condition in which blood glucose levels are higher than normal but below the diagnostic threshold for diabetes (8, 9). In China, the prevalence of prediabetes among adults ranges from 35.7% to 50.1%. The prediabetes population serves as the “reserve force” for diabetes, with the risk of progression to diabetes being 2.7 times higher than that of the general population. It is estimated that 5% to 10% of prediabetic individuals will develop type 2 diabetes each year (10, 11). However, this stage is reversible, and early intervention can effectively delay or even prevent the onset of diabetes. Therefore, the development and validation of risk prediction models is crucial. By identifying high-risk populations early, these models can provide the basis for precise interventions and personalized management, helping to reduce the incidence of diabetes and its related complications. Additionally, predictive models help optimize the allocation of public health resources, prioritize high-risk groups, enhance diagnostic and treatment efficiency, reduce the burden on the healthcare system, and ultimately improve overall health outcomes.
A comprehensive assessment of diabetes onset risk involves evaluating biomarkers related to glucose metabolism, lipid metabolism, inflammation, and organ function. Fasting plasma glucose (FPG), glycated hemoglobin (HbA1c), and fasting insulin (FI) directly reflect blood glucose control. Total cholesterol (TC) and low-density lipoprotein (LDL) reflect lipid metabolism, with lipid imbalance being an important risk factor for diabetes (12, 13). Hypertension is closely related to diabetes and insulin resistance, making blood pressure a key indicator for diabetes prediction (14). Elevated total bilirubin is associated with insulin resistance and diabetes, possibly reflecting liver damage or oxidative stress (15). Declining kidney function significantly increases the risk of diabetes, and estimated glomerular filtration rate (eGFR) is an important indicator for assessing kidney function (16). Finally, white blood cell count (WBC), neutrophil-to-lymphocyte ratio (NLR), and platelet-to-lymphocyte ratio (PLR) reflect the inflammatory status, with chronic low-grade inflammation being a significant pathological mechanism of diabetes (17, 18).
At present, there have been many studies on the risk factors for the onset or prevalence of diabetes (19, 20), but most of the results are based on cross-sectional surveys, which have weak causal demonstration strength (21, 22). A small number of cohort studies, with small sample sizes, have not fully considered the annual changes in the prevalence of diabetes. To address this limitation, we explored the factors associated with the onset of new diabetes within 1, 3, and 5 years through the generalized estimating equations (GEE) model. This dynamic study approach enhanced the accuracy and generalizability of the results. The purpose of this study is to analyze the data from the physical examination centers of three hospitals in Wuxi, China, from 2018 to 2023, explore the changes in the prevalence of diabetes and prediabetes among young and middle-aged individuals, build prediction models for diabetes incidence, and evaluate the prediction performance of different models.
2 Materials and methods
2.1 Study design and data sources
The study population comes from the health examination databases of three hospitals in Wuxi, China, covering individuals aged 18–59 years from 2018 to 2023. The database used in this study is a relational database based on Structured Query Language (SQL). The data includes basic information such as: outpatient number (unique code), gender, age, region, marital status, occupation, etc. Disease diagnosis: the prevalence of major diseases in the examined individuals and their corresponding International Classification of Diseases (ICD), and whether the disease was newly diagnosed in the current year’s health examination. Disease treatment: whether the major disease in the examined individuals had been treated. Physical examination and laboratory indicators: physical examination includes height, weight, heart rate, systolic pressure, and diastolic pressure. Laboratory indicators include blood glucose, lipid profile, liver function, kidney function, and others. Inclusion criteria: 1) Aged 18 to 59 years; 2) Underwent physical examinations in three hospitals between 2018 and 2023 and provided complete clinical and laboratory data. Exclusion criteria: 1) Severe systemic diseases such as advanced cancer or major immune deficiency disorders; 2) Severe liver or kidney dysfunction; 3) Severe psychiatric disorders or poor compliance; 4) Missing key data, such as diabetes status.
According to the standards of the World Health Organization (WHO) and the American Diabetes Association (ADA), diabetes is diagnosed if the random venous plasma glucose concentration is ≥11.1 mmol/L, fasting blood glucose concentration is ≥7.0 mmol/L, or the 2-hour post-glucose load blood glucose concentration is ≥11.1 mmol/L. Patients who were not diagnosed with diabetes at the start of the study but were first diagnosed with diabetes during the follow-up period are defined as having “new-onset diabetes”.
2.2 Data collection and laboratory standardization
All participants were screened and data was collected by trained professionals following a unified protocol. The information was stored and managed through a centralized electronic health record system. The laboratories in all three hospitals used the same testing equipment and methods, and employed standardized reagents and procedures. To ensure consistency and reliability of the laboratory data, regular equipment calibration and quality control were conducted. Additionally, all three hospitals adhered to the same diagnostic criteria for diabetes.
2.3 Prevalence analysis
Evaluating the changes in the prevalence of diabetes and prediabetes in different years from 2018 to 2023. The prevalence rate was calculated by dividing the number of newly diagnosed diabetes cases and individuals already diagnosed with diabetes by the total number of individuals.
2.4 Retrospective cohort analysis
In analyzing newly developed diabetes, individuals who already had diabetes in 2018 were excluded. Differences in baseline characteristics and laboratory indicators between individuals with newly developed diabetes and those without within 5 years were compared. For continuous variables, normality testing is conducted prior to univariate analysis. If the data follow a normal distribution, a t-test is used; otherwise, the Mann-Whitney U test is applied. For categorical variables, the chi-square test is used. We conducted multicollinearity analysis on the explanatory variables in the models by calculating the variance inflation factor (VIF) for each variable. The dataset was split into a training set and a testing set in a 7:3 ratio. In the training set, multivariate logistic regression (MLR model), Cox proportional hazard models (Cox model), and generalized estimation equation models (GEE model) were used for further analysis to assess the independent effects of various factors on the new onset of diabetes. Multivariate Logistic Regression (MLR): This model is suitable for analyzing binary outcome variables and can effectively assess the independent effects of various factors on the onset of new diabetes, providing the corresponding odds ratios (ORs). It is the primary model used in this study for analyzing new-onset diabetes. Cox Proportional Hazards Model: Considering that the onset of diabetes has a time-dependent characteristic, the Cox model is used for survival analysis to explore risk factors for new-onset diabetes over different time periods. It accounts for the timing of the event occurrence and potential time effects. Generalized Estimating Equation (GEE): GEE is particularly suited for handling repeated measures data or correlated observations. In this study, data on diabetes diagnoses at multiple time points (1 year, 3 years, and 5 years) for the same patients were collected. Therefore, the GEE model can effectively account for the correlation within these data and provide robust estimates. By integrating these three models, we can comprehensively evaluate the factors influencing the onset of new diabetes from multiple perspectives, ensuring the applicability of the results. Receiver operating characteristic (ROC) curve analysis was used to evaluate the predictive performance of the multivariate models, and the performance of the models was compared in terms of sensitivity, specificity, and Youden index. A nomogram for predicting the risk of diabetes in the next five years was constructed based on significant influencing factors in the training set and validated in the testing set. All analyses were conducted using R 4.4.0. The research flowchart is shown in Supplementary Figure 1.
3 Results
3.1 Trend of diabetes and prediabetes prevalence among young and middle-aged health checkup population from 2018 to 2023
The results show that from 2018 to 2023, the number of individuals diagnosed with diabetes and prediabetes has shown a gradual increase year by year, with the largest rise occurring between 2020 and 2021 (Figure 1).
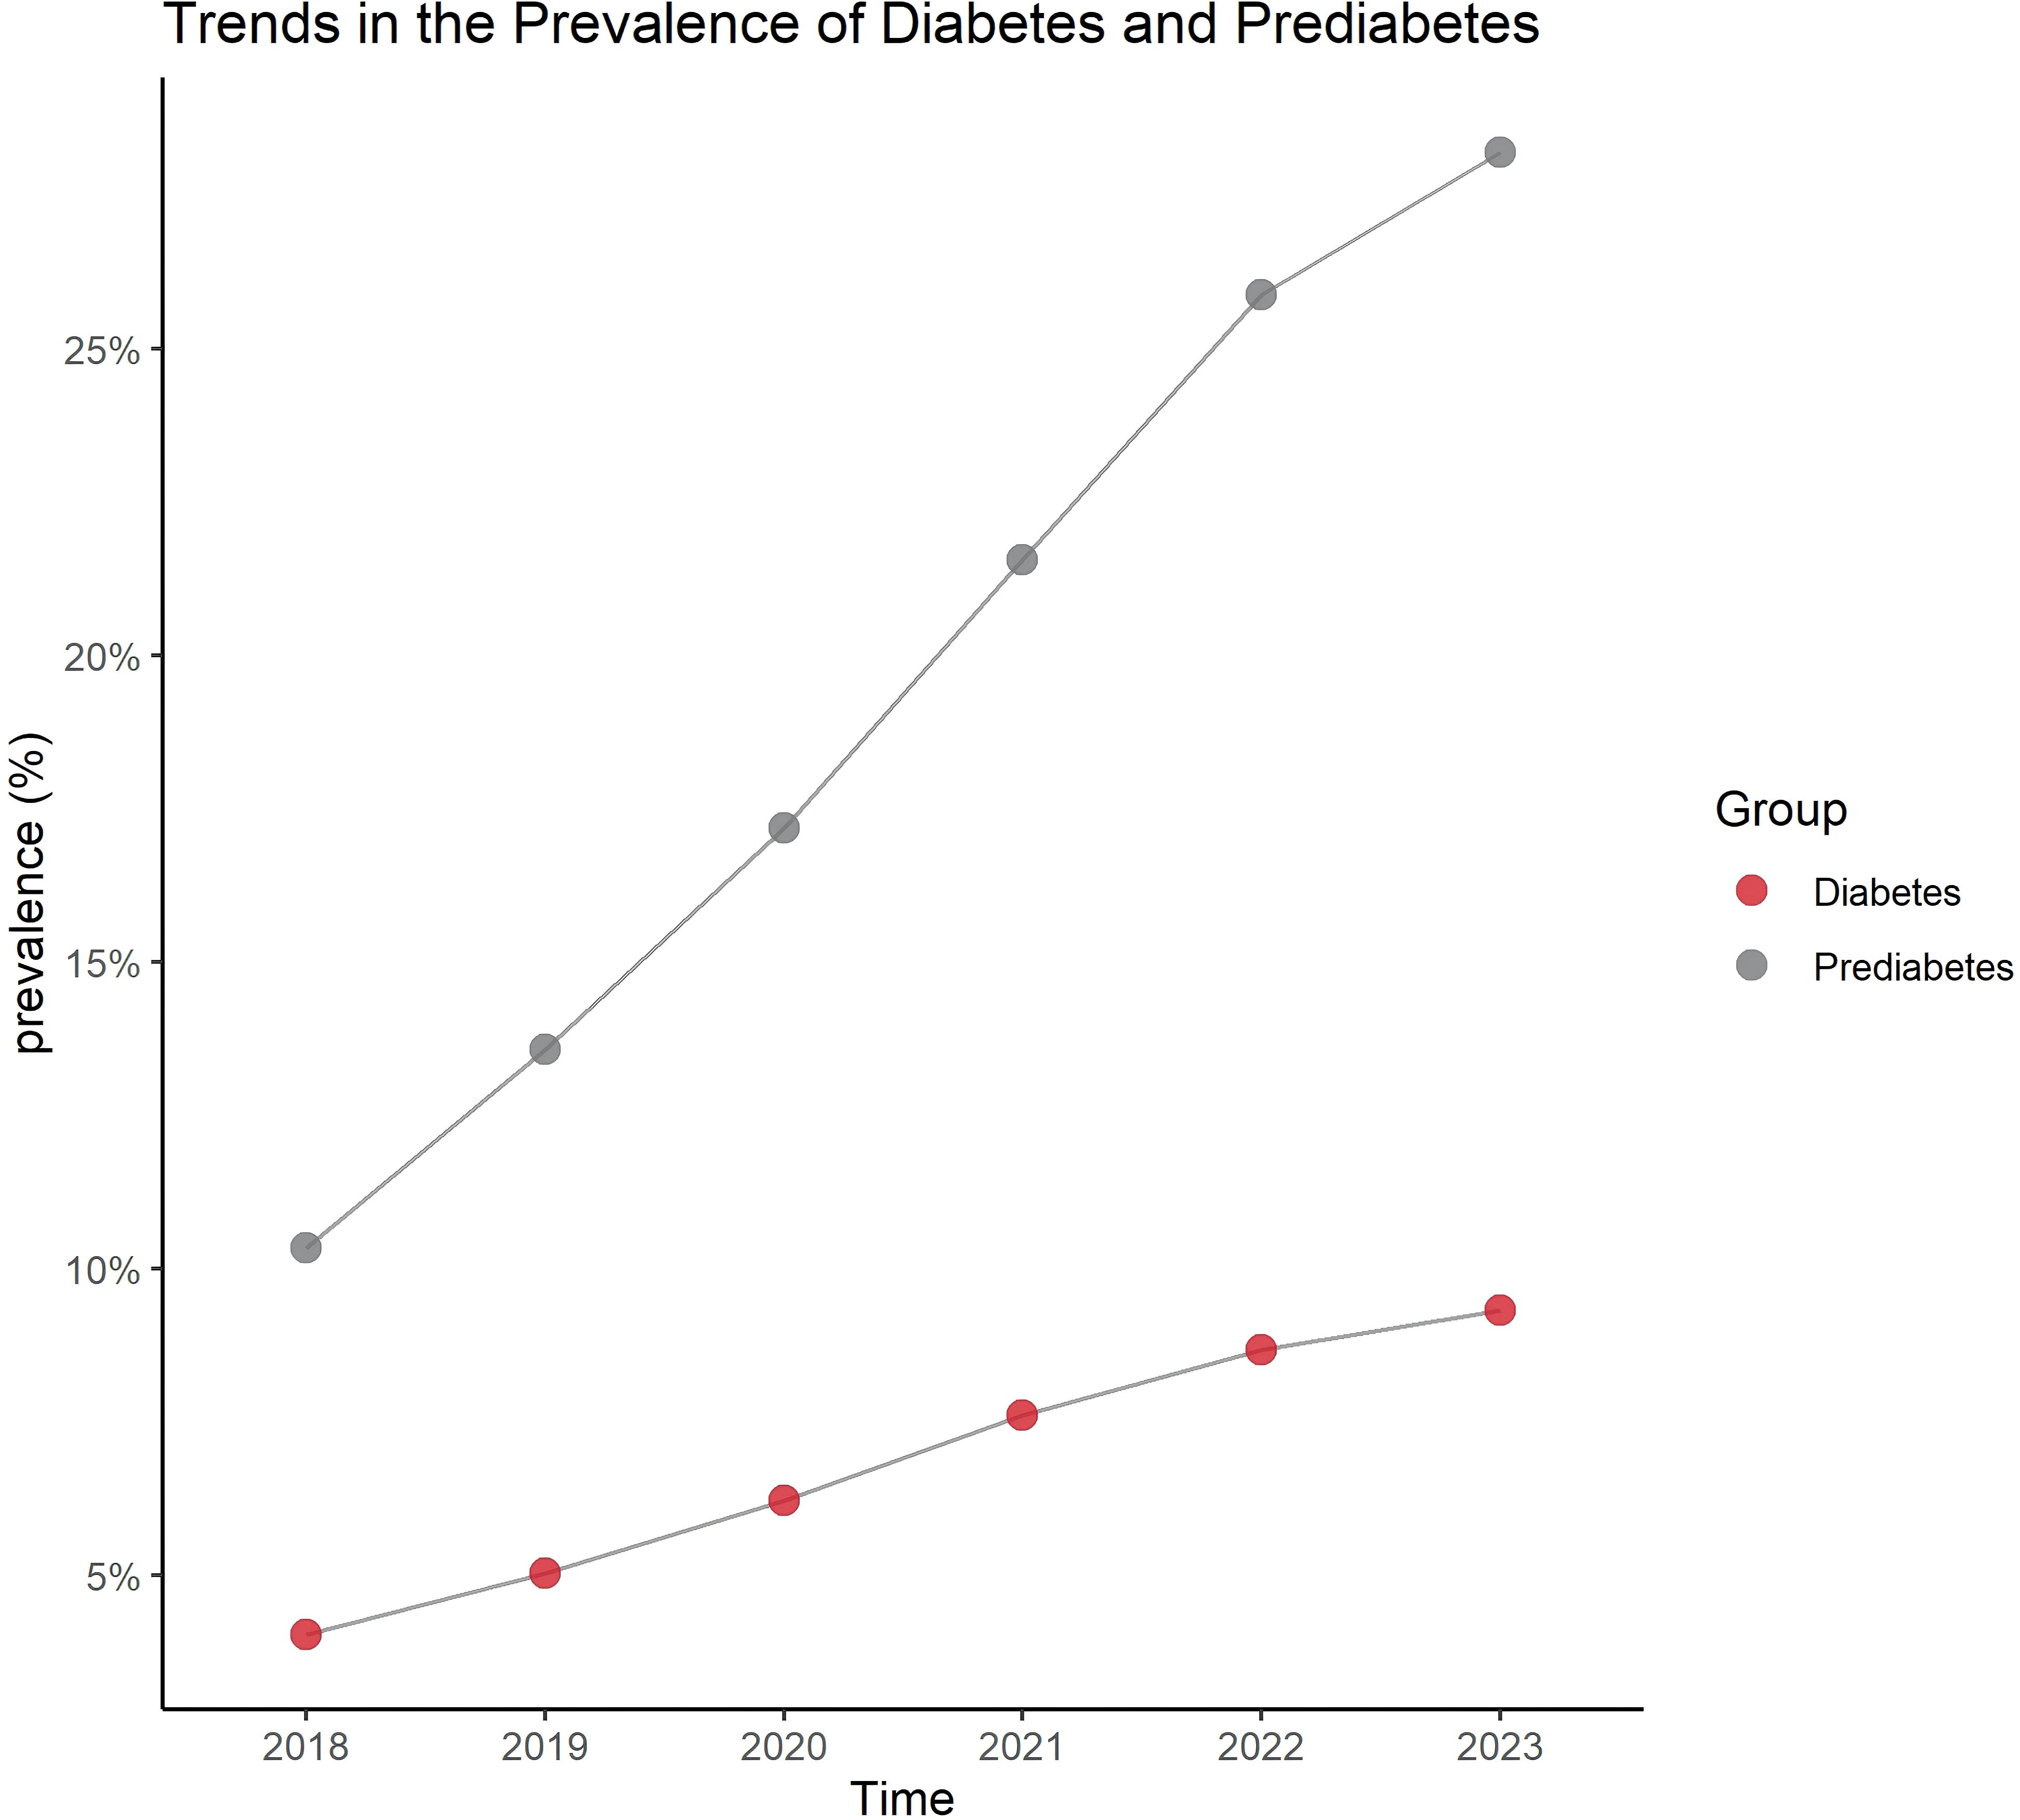
Figure 1. Trend of diabetes and prediabetes prevalence from 2018 to 2023.
3.2 Baseline characteristic differences between newly diagnosed diabetes patients and non-newly diagnosed diabetes patients over 5 years
A total of 450 new cases were identified within the 5-year period. The age range of the entire population was 18–59 years. Male patients accounted for 52.08%, and female patients accounted for 47.92%. The BMI was 26.6 (17.3-35.9), with the BMI of newly diagnosed diabetes patients being 26.7 (17.3-35.9) and that of non-newly diagnosed patients being 25.8 (17.4-35.9). The p-value was 0.0415, indicating that the BMI of newly diagnosed diabetes patients was significantly higher than that of non-newly diagnosed patients. Among the patients, 40.41% were manual laborers, 37.85% were intellectual laborers, and 21.73% were service workers. Patients with a family history of diabetes accounted for 21.67%. Those with a history of cardiovascular disease accounted for 3.3%, while those with a history of kidney disease accounted for 0.78%. Low-income patients accounted for 46.92%, moderate-income patients accounted for 41.17%, and high-income patients accounted for 11.9%. Urban residents accounted for 77.57%, while rural residents accounted for 22.43%. The p-value was 0.0064, indicating that 82.89% of newly diagnosed diabetes patients were urban residents, which was significantly higher than the 77.26% of non-newly diagnosed patients. Mild smokers accounted for 68.29%, moderate smokers accounted for 29.5%, and heavy smokers accounted for 2.21%. Mild drinkers accounted for 67.72%, moderate drinkers accounted for 30.62%, and heavy drinkers accounted for 1.65%. 48.06% of patients exercised regularly, 30.24% exercised occasionally, and 21.7% were inactive. The p-value was 0.0138, indicating that a higher proportion of newly diagnosed diabetes patients (25.56%) were inactive compared to non-newly diagnosed patients (Table 1).
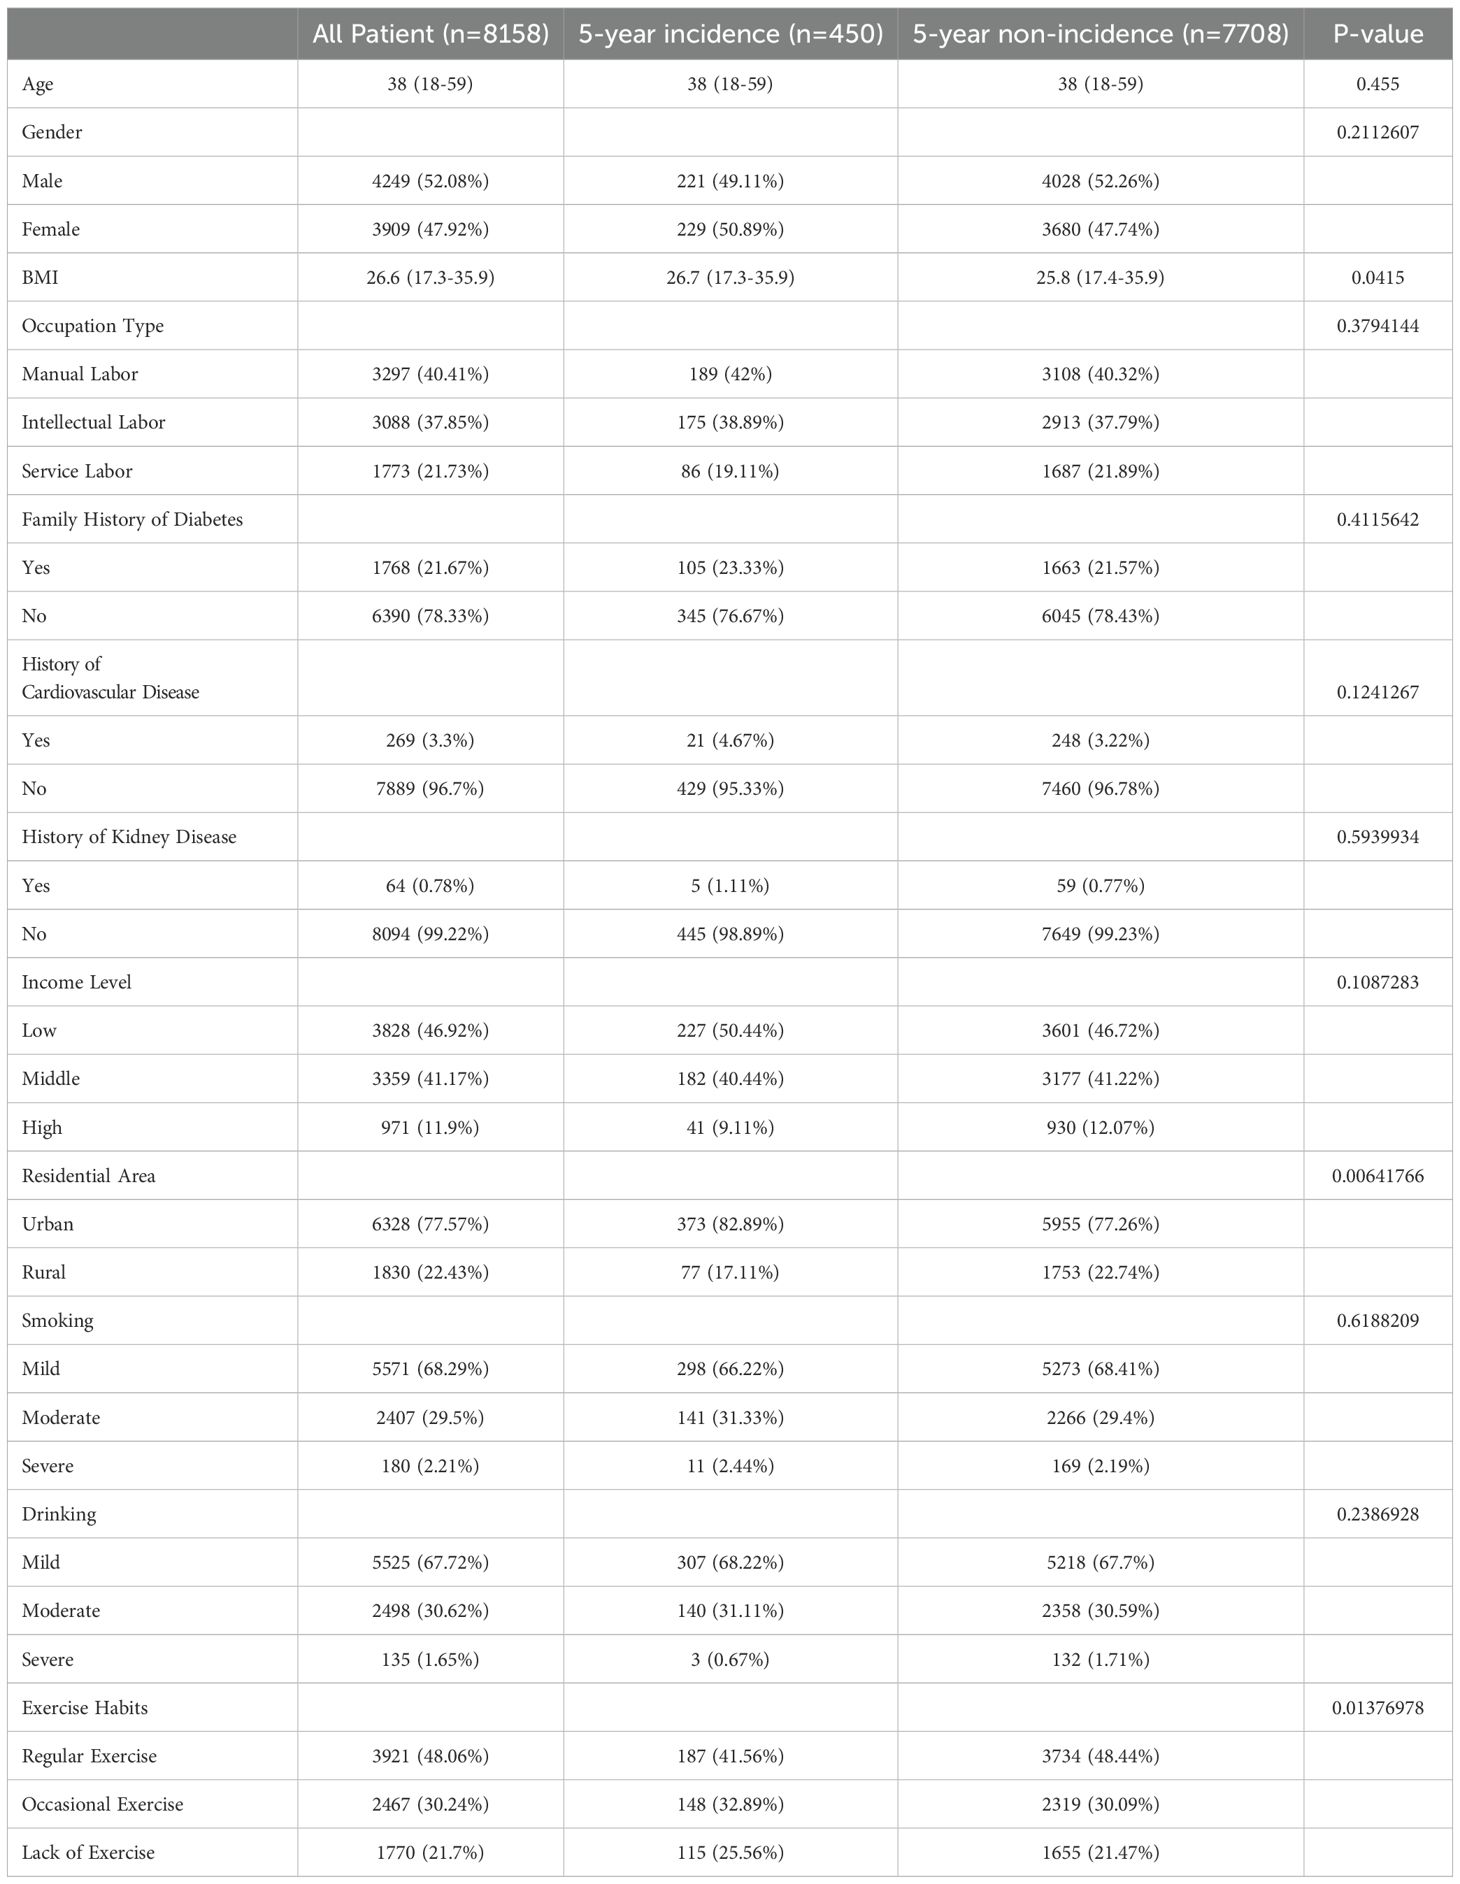
Table 1. Baseline characteristics differences between newly diagnosed diabetes patients and non-newly diagnosed patients within 5 years.
3.3 Laboratory indicator differences between newly diagnosed diabetes patients and non-newly diagnosed diabetes patients over 5 years
There were no significant differences in waist circumference, systolic blood pressure, diastolic blood pressure, low-density lipoprotein, or high-density lipoprotein between the two groups. The newly diagnosed diabetes group showed significantly higher levels of fasting blood glucose, glycated hemoglobin, total cholesterol, triglycerides, fasting insulin, total bilirubin, serum creatinine, white blood cell count, neutrophil/lymphocyte ratio, and platelet/lymphocyte ratio compared to the non-newly diagnosed group (P < 0.05). In contrast, the estimated glomerular filtration rate was significantly lower in the newly diagnosed group (P < 0.05) (Table 2).
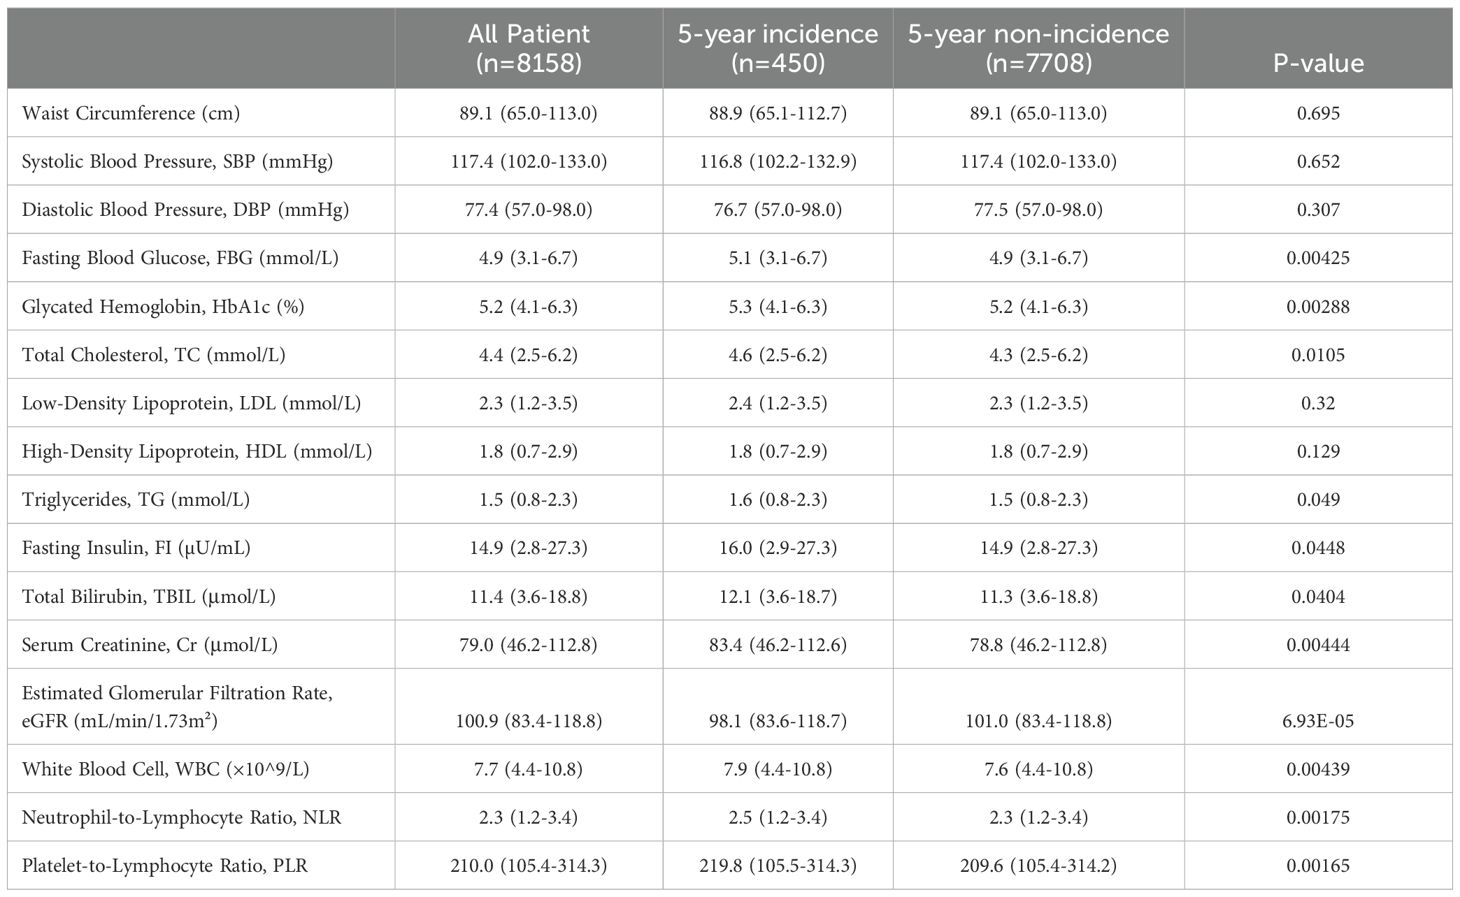
Table 2. Laboratory indicator differences between newly diagnosed diabetes patients and non-newly diagnosed patients within 5 years.
3.4 Multivariable logistic regression model, Cox proportional hazards model, and generalized estimating equations to evaluate factors influencing new-onset diabetes within 5 years
The VIF for all explanatory variables was less than 5 (Supplementary Table 1), indicating that there is no significant multicollinearity problem between the variables. Therefore, we can conclude that the explanatory variables in our models are not subject to multicollinearity, ensuring the stability of the estimation results. In the training set, we conducted further multivariable analysis of the significant factors identified in Sections 3.1 and 3.2. The results showed that in the MLR model, body mass index (BMI, OR=1.016, 95% CI: 1.005-1.027, p=0.004), fasting plasma glucose (FPG, OR=1.009, 95% CI: 1.003-1.014, p=0.003), fasting insulin (FI, OR=1.001, 95% CI: 1.000-1.002, p=0.024), creatinine (Cr, OR=1.000, 95% CI: 1.000-1.001, p=0.006), white blood cell count (WBC, OR=1.004, 95% CI: 1.000-1.007, p=0.026), neutrophil-to-lymphocyte ratio (NLR, OR=1.015, 95% CI: 1.006-1.025, p=0.001), and residential area (OR=1.018, 95% CI: 1.004-1.032, p=0.014) were significantly positively associated with the risk of new-onset diabetes. The higher the levels of these factors, the higher the risk of diabetes. Estimated glomerular filtration rate (eGFR, OR=0.999, 95% CI: 0.999-1.000, p=0.027) and exercise habits (OR=0.992, 95% CI: 0.985-0.999, p=0.028) were significantly negatively associated with the occurrence of diabetes, suggesting that higher eGFR and regular exercise may reduce the risk of new-onset diabetes. In the Cox model, BMI (HR=1.162, 95% CI: 1.052-1.284, p=0.003), FPG (HR=1.179, 95% CI: 1.058-1.313, p=0.003), FI (HR=1.019, 95% CI: 1.003-1.035, p=0.022), Cr (HR=1.008, 95% CI: 1.003-1.014, p=0.005), WBC (HR=1.071, 95% CI: 1.008-1.138, p=0.028), NLR (HR=1.339, 95% CI: 1.120-1.602, p=0.001), and residential area (HR=1.459, 95% CI: 1.080-1.972, p=0.014) were significant positive risk factors for new-onset diabetes, indicating that these factors may increase the risk of developing diabetes. eGFR (HR=0.988, 95% CI: 0.977-0.999, p=0.029) and exercise habits (HR=0.854, 95% CI: 0.744-0.981, p=0.025) were significant negative risk factors for new-onset diabetes, suggesting that higher eGFR and regular exercise may reduce the risk. In the GEE model, BMI (estimate = 0.019, P < 0.001), FPG (estimate = 0.158, P < 0.001), HbA1c (estimate = 0.221, P < 0.001), TC (estimate = 0.120, P < 0.001), FI (estimate = 0.012, P = 0.017), TBIL (estimate = 0.022, P = 0.007), Cr (estimate = 0.008, P < 0.001), WBC (estimate = 0.061, P < 0.001), NLR (estimate = 0.233, P < 0.001), and PLR (estimate = 0.002, P < 0.001) were all positively correlated with the risk of new-onset diabetes. eGFR (estimate = -0.017, P < 0.001) and exercise habits (estimate = -0.195, P < 0.001) were negatively correlated with the risk of new-onset diabetes (Table 3).
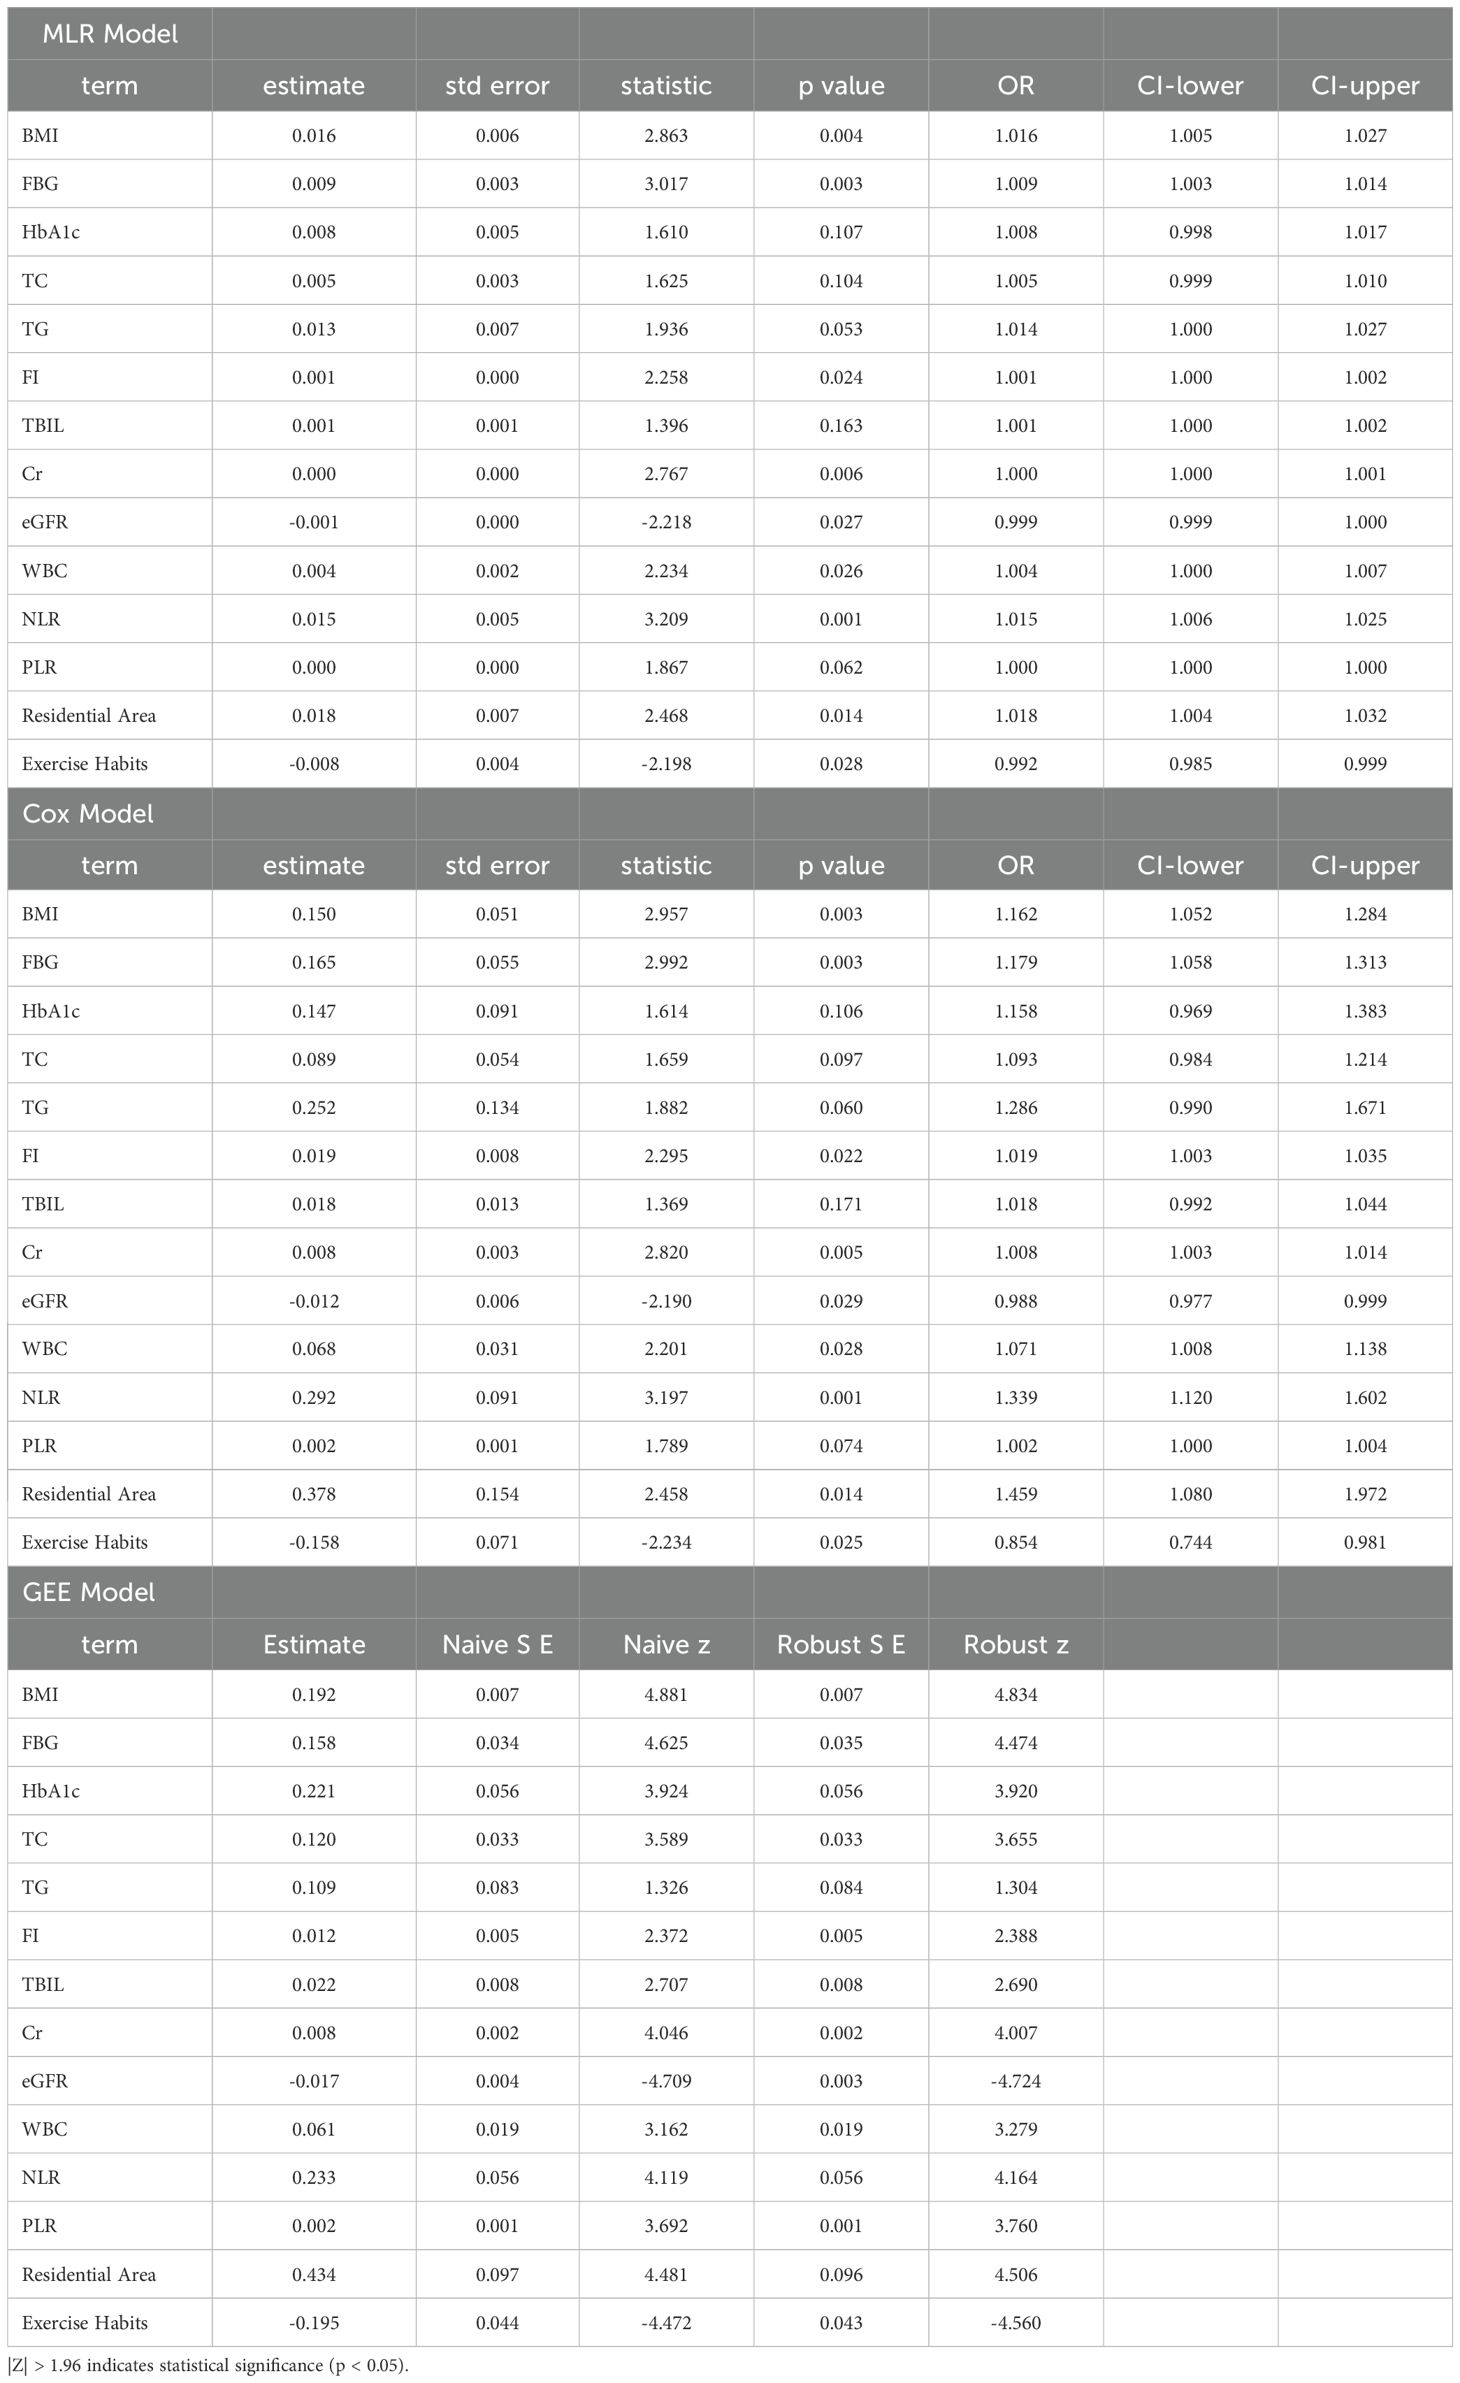
Table 3. Logistic regression, cox proportional hazards model, and generalized estimating equations to assess factors influencing the 5-year incidence of newly diagnosed diabetes.
3.5 Model performance evaluation and selection of significant risk factors
We evaluated the performance of the three models above using ROC curves. All three models had AUC values close to 0.64. The 95% confidence intervals of AUC for the MLR and Cox models ranged from 0.610 to 0.674, while the GEE model ranged from 0.623 to 0.662. In terms of the Youden index, the GEE model performed the best, reaching 0.237. For sensitivity, the Cox model performed the best (0.577), while for specificity, the MLR model had the highest performance (0.776). The GEE model performed relatively well in balancing sensitivity and specificity, while the MLR model had the best specificity, and the Cox model had the best sensitivity. We selected the five most significant factors from the three models, which were NLR, FPG, Cr, BMI, and Exercise Habits (Table 4) (Figures 2A-C).
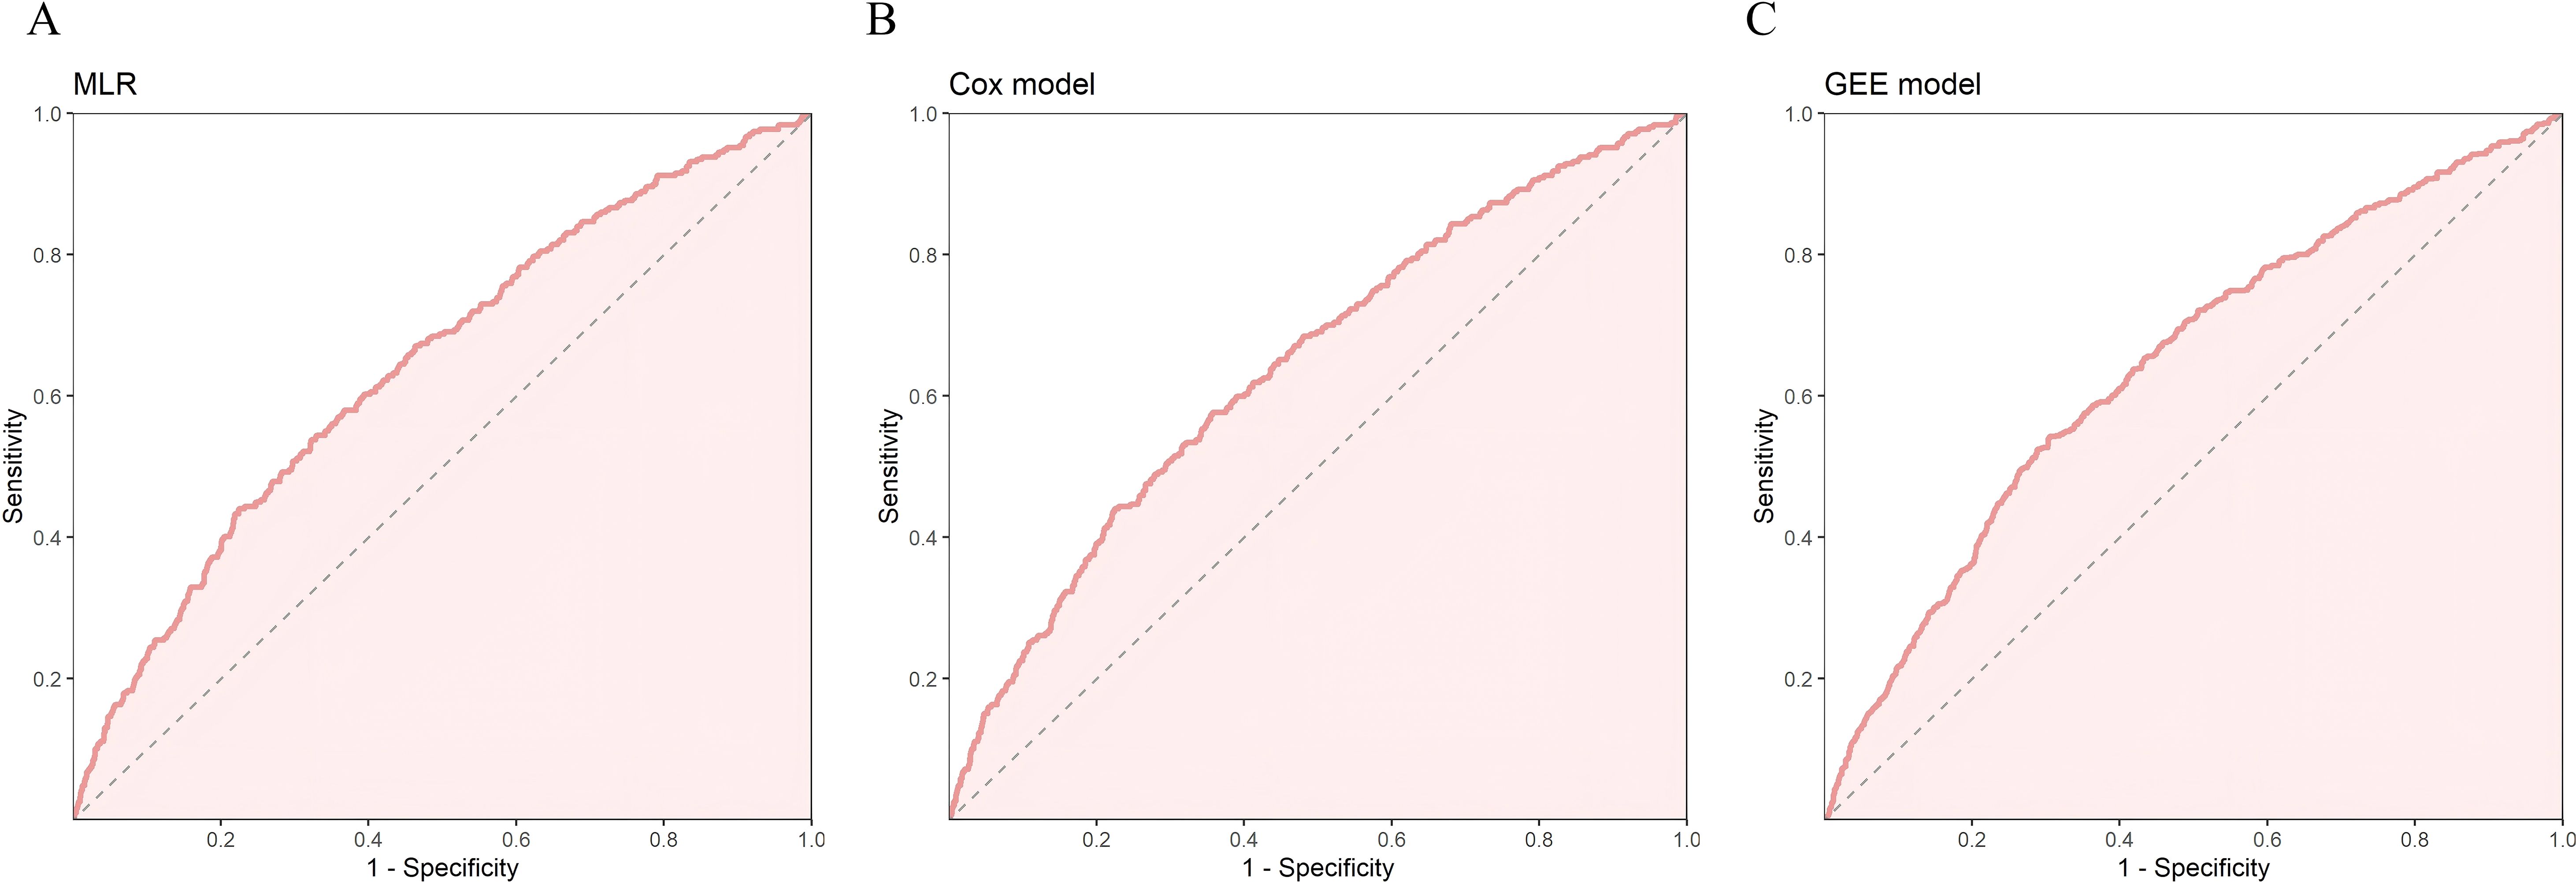
Figure 2. In the training set, (A) ROC curve of MLR, (B) ROC curve of Cox risk model, (C) ROC curve of Generalized Estimating Equations (GEE).
3.6 Nomogram construction and evaluation
We constructed a nomogram in the training set based on the five most significant factors and validated it in the test set. Using these indicators, the probability of a patient developing diabetes within the next 5 years can be predicted. For example, in the training set, the patient’s total score is 342, and the probability of developing diabetes is 65.1% (Figures 3A, B). The AUC of the nomogram model in the training set is 0.705, and the calibration curve is close to the ideal 45-degree diagonal, demonstrating a robust predictive ability. Similarly, the AUC and calibration curve of the nomogram in the test set also show good predictive ability (Table 4) (Figures 4A-D).
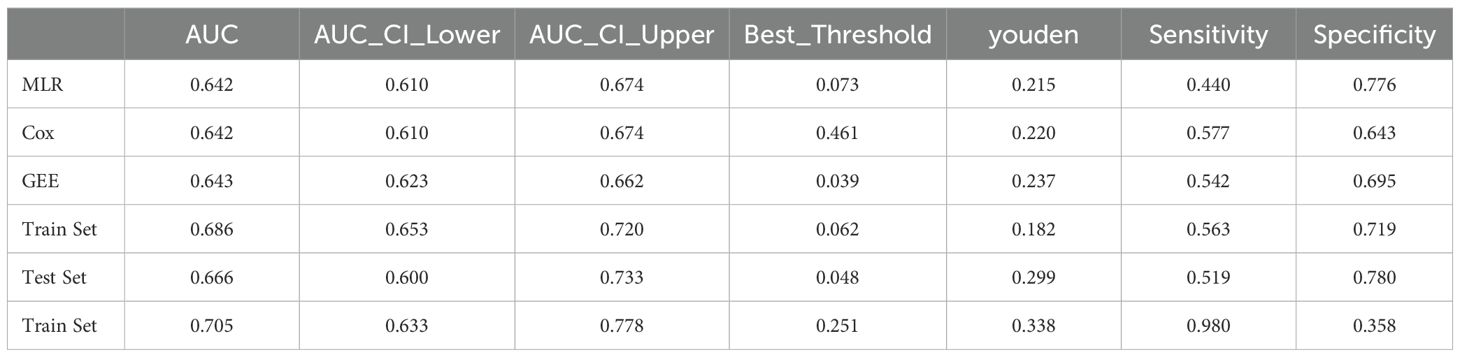
Table 4. ROC curve parameters.
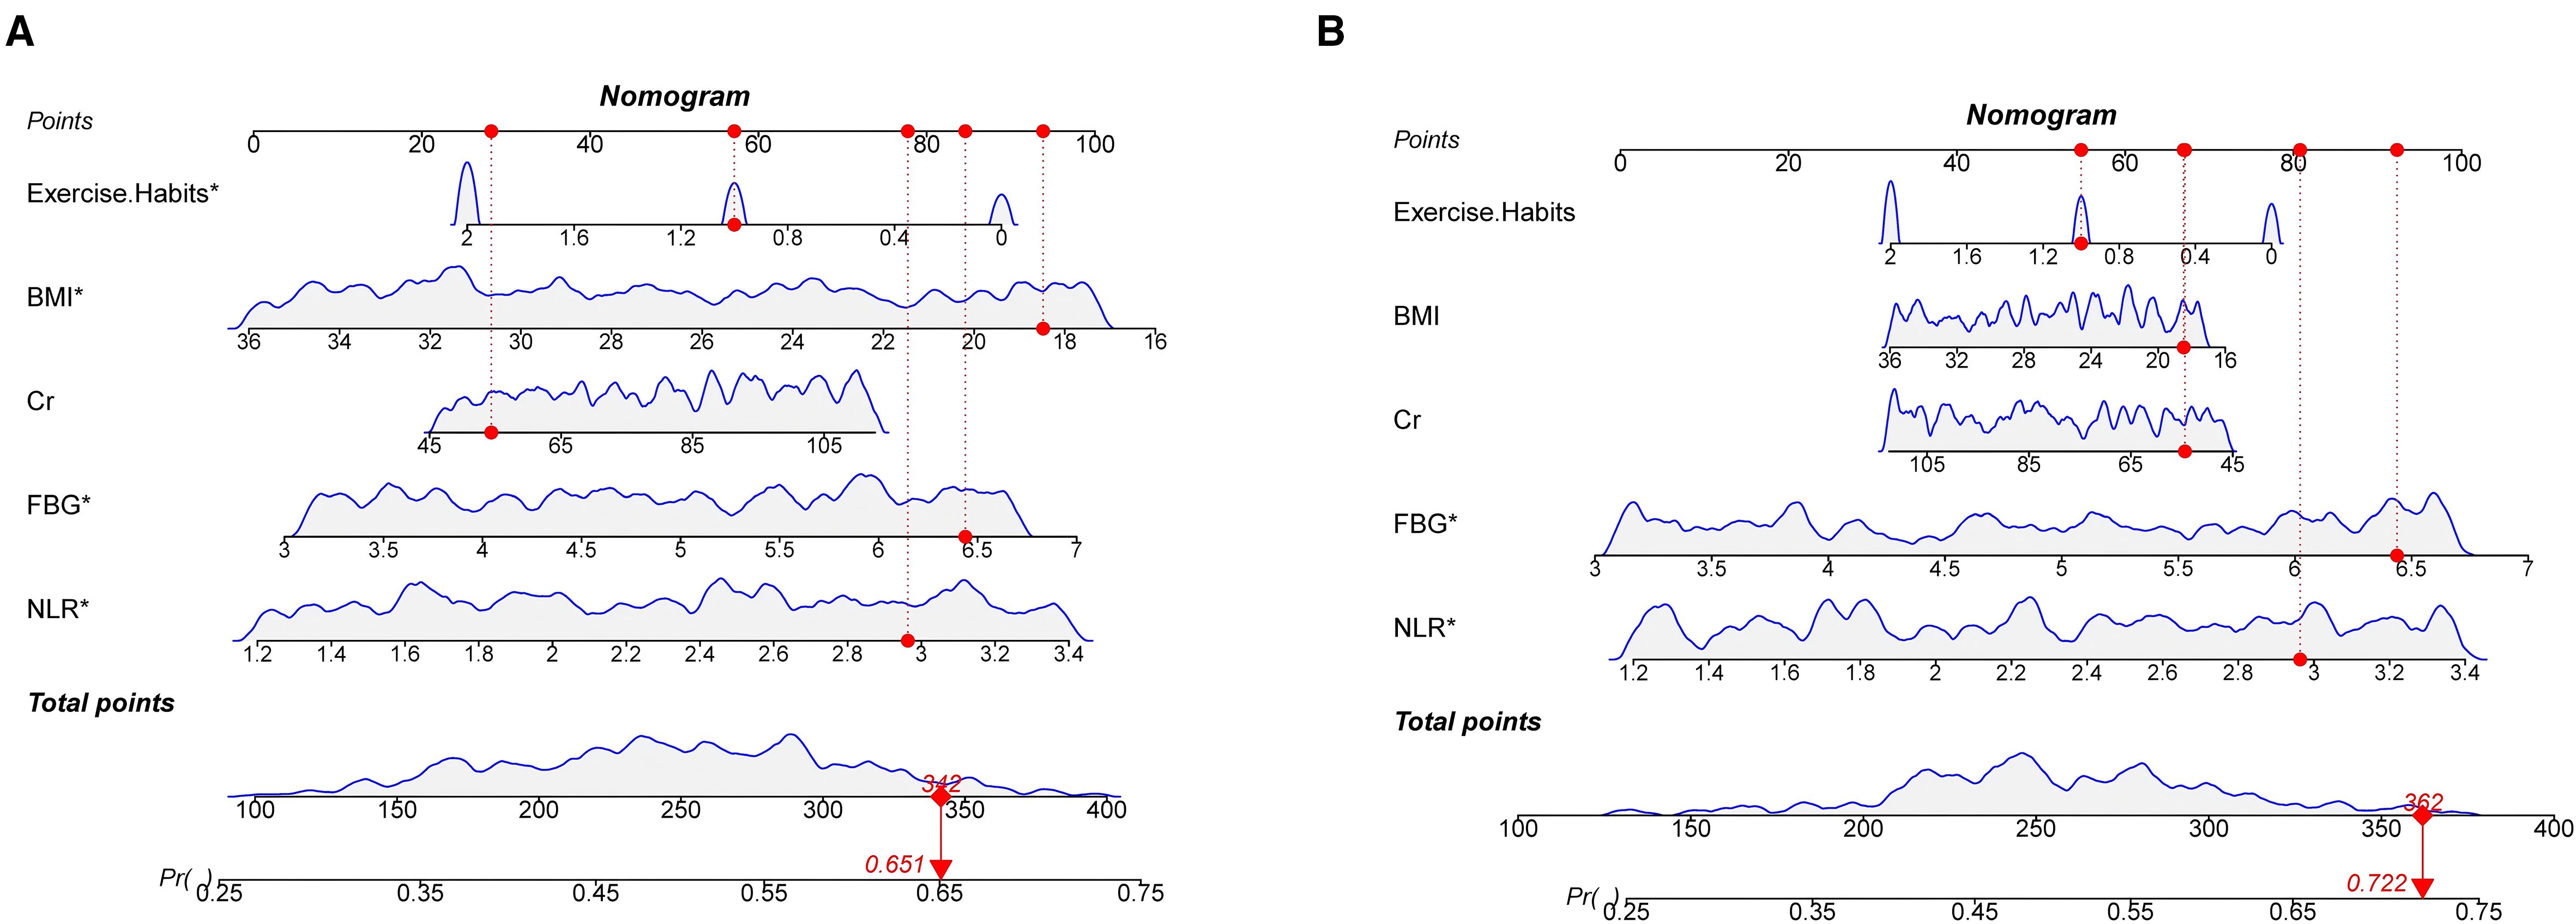
Figure 3. (A) Nomogram of the training set and (B) Nomogram of the test set.
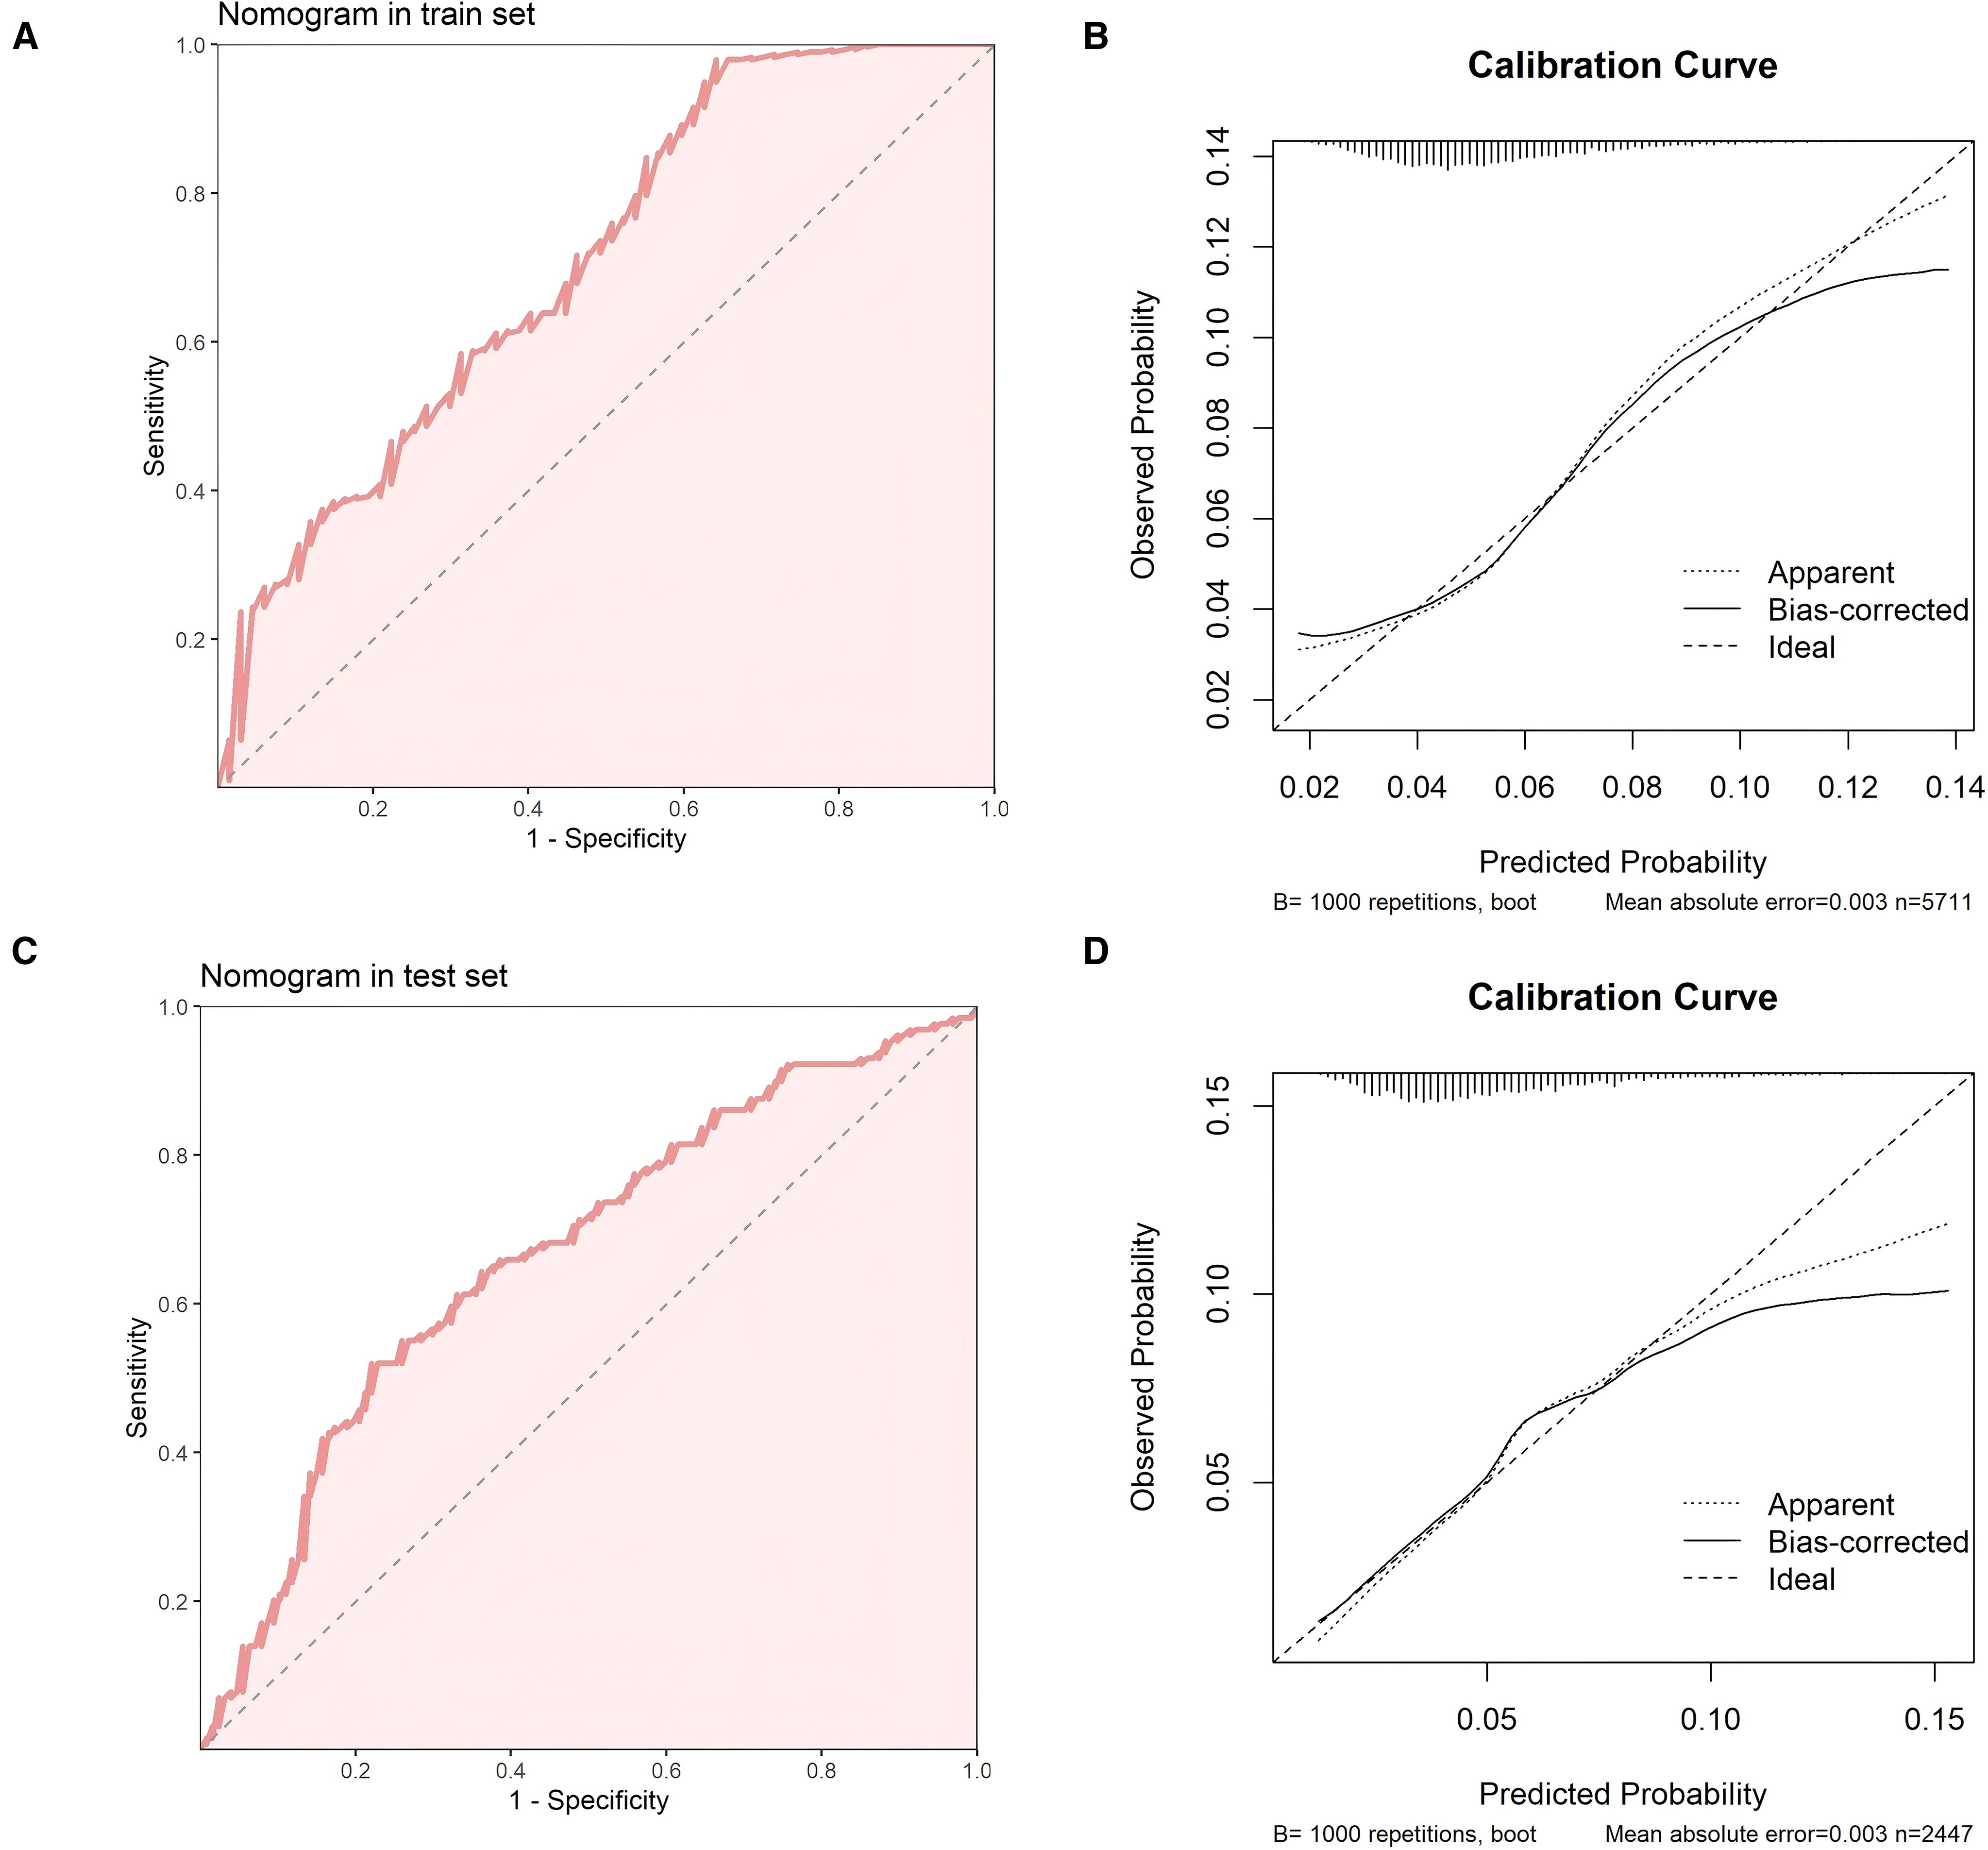
Figure 4. (A) ROC curve of the nomogram in the training set (B) Calibration curve of the nomogram in the training set. (C) ROC curve of the nomogram in the test set (D) Calibration curve of the nomogram in the test set.
4 Discussion
Prevalence analysis indicates that the incidence of newly diagnosed diabetes in 2020–2021 was higher than in the previous two years, which may be related to various social factors, most notably the impact of the COVID-19 pandemic. The peak of the pandemic occurred during 2020 and 2021, bringing multiple pressures—social, economic, and psychological—to people, thereby influencing their lifestyles. During this period, many people chose to stay at home, reducing daily activities and leading to unhealthy routines. Some individuals also developed mental health issues such as anxiety and depression, which could cause metabolic disorders and indirectly increase the risk of diabetes.
NLR, as a simple indicator of the body’s inflammatory state, primarily reflects immune inflammation, which plays a crucial role in the development of diabetes (23). Chronic low-grade inflammation is considered an important mechanism for the occurrence and progression of diabetes, possibly by weakening the insulin sensitivity of insulin target tissues (such as adipose tissue, muscle, and liver), leading to insulin resistance (IR) (24). In addition, inflammation activates several signaling pathways (such as NF-κB), inhibiting insulin signal transduction. Similarly, the increase in PLR reflects a systemic inflammatory state, with increased pro-inflammatory cytokines (such as IL-6 and TNF-α) interfering with insulin signaling pathways, promoting IR (25). The increase in platelet count in PLR suggests platelet activation, releasing pro-inflammatory mediators (such as CD40L, P-selectin) (26), exacerbating endothelial inflammation and oxidative stress, further promoting IR. The decrease in lymphocytes may reflect immune regulation abnormalities, and some studies have shown that the lack of regulatory T cells can induce IR (27). FPG, which is measured after at least 8 hours of fasting, is a key diagnostic criterion for diabetes, with levels greater than 7.0 mmol/L indicating the presence of diabetes. Cr is a waste product generated by muscle metabolism, often associated with kidney function impairment (28). Elevated Cr levels may indicate some degree of kidney dysfunction, which is often subtle and not easily detected. Since the kidneys play a critical role in insulin metabolism, kidney dysfunction means insulin is not fully metabolized, leading to elevated insulin levels and increased risk of metabolic disorders. High BMI, or obesity, is closely linked to the onset of diabetes (29). Extensive research has shown that abdominal obesity leads to the secretion of various hormones and cytokines, which induce chronic low-grade systemic inflammation, thus increasing the risk of insulin resistance (30). Adipose tissue significantly affects glucose metabolism; fat cells participate in the storage and metabolism of fatty acids, and the more fat cells there are, the higher the concentration of fatty acids in the blood. These fatty acids interfere with insulin action, leading to insulin resistance (31), which, if persistent, is likely to develop into diabetes. We also found that exercise habits are closely related to diabetes; the diabetes incidence rate is significantly higher in individuals who lack physical activity. This may be because exercise promotes the utilization and transport of blood glucose, and both aerobic exercise and strength training help muscle cells absorb glucose. Regular exercise can effectively reduce body fat and enhance insulin responsiveness, allowing cells to use insulin more efficiently to absorb glucose, thus lowering the risk of diabetes (32). Regular exercise also helps regulate hormone balances closely related to diabetes, such as leptin and adrenaline, further reducing the risk of diabetes.
The innovation of this study lies in the use of multiple multivariate analysis methods, including multivariate logistic regression, Cox proportional hazards model, and generalized estimating equations. The combination of these methods not only enhances the reliability and validity of the results but also provides scientific evidence for early prevention and intervention of diabetes. It allows for a multidimensional exploration of the pathogenesis of diabetes and offers a reference for disease prevention.
This study also has some limitations. Firstly, the data were only from Wuxi, China, which introduces regional bias, and thus the findings may not be widely generalizable to other regions or different age and ethnic groups. Secondly, as a retrospective study, there may be some selection bias in the data. Additionally, the study did not include all potential factors that could affect the incidence of diabetes. Finally, some variables, such as smoking, alcohol consumption, and physical activity habits, relied on self-reports from patients, which could be influenced by recall bias or social desirability bias. Although factors such as gender did not show significant effects in this study, future research could further explore their potential impact on the incidence of diabetes. Additionally, gender differences may vary across different regions or ethnic groups, and these factors should be considered in future studies.
The nomogram developed in this study is an effective tool for predicting the risk of future diabetes onset. This model can provide scientific evidence for public health decision-making, particularly in early intervention and personalized management. Clinically, based on this model, doctors can accurately identify high-risk populations in advance and implement early intervention measures, thereby delaying or preventing the onset of diabetes. In the future, the model can be further validated for its applicability and robustness in different regions, ethnic groups, and age cohorts. Furthermore, with technological advancements, the model can be optimized by integrating more clinical, genetic, and environmental factors to improve predictive accuracy. In-depth exploration of the mechanisms of new-onset diabetes, especially the interactions between different factors, will help identify early signals of diabetes more precisely. Combining big data and artificial intelligence technologies, future research could explore how to better apply such predictive tools in daily health management, thereby improving the overall level of public health management.
5 Conclusion
This study shows that the incidence of newly diagnosed diabetes was highest between 2020 and 2021 during the period from 2018 to 2023. Significant factors influencing the onset of diabetes include NLR, FPG, Cr, BMI, and exercise habits. The nomogram constructed based on these factors demonstrates good predictive ability.
Data availability statement
The raw data supporting the conclusions of this article will be made available by the authors, without undue reservation.
Ethics statement
The studies involving humans were approved by The Affiliated Wuxi People’s Hospital of Nanjing Medical University and Wuxi Medical Center Nanjing Medical University. The studies were conducted in accordance with the local legislation and institutional requirements. Written informed consent for participation was not required from the participants or the participants’ legal guardians/next of kin in accordance with the national legislation and institutional requirements.
Author contributions
JT: Conceptualization, Data curation, Methodology, Resources, Software, Validation, Visualization, Writing – original draft. MC: Conceptualization, Data curation, Methodology, Resources, Software, Validation, Visualization, Writing – original draft. YL: Conceptualization, Supervision, Writing – original draft. XS: Formal analysis, Methodology, Visualization, Writing – original draft. CC: Data curation, Investigation, Writing – original draft. ND: Validation, Visualization, Writing – original draft. YY: Writing – original draft. XY: Project administration, Writing – review & editing.
Funding
The author(s) declare financial support was received for the research and/or publication of this article. This study was supported by the National Natural Science Foundation of China(NO. 82204167) and Scientific Research Program of Wuxi health Commission(NO. M202313).
Conflict of interest
The authors declare that the research was conducted in the absence of any commercial or financial relationships that could be construed as a potential conflict of interest.
Generative AI statement
The author(s) declare that no Generative AI was used in the creation of this manuscript.
Any alternative text (alt text) provided alongside figures in this article has been generated by Frontiers with the support of artificial intelligence and reasonable efforts have been made to ensure accuracy, including review by the authors wherever possible. If you identify any issues, please contact us.
Publisher’s note
All claims expressed in this article are solely those of the authors and do not necessarily represent those of their affiliated organizations, or those of the publisher, the editors and the reviewers. Any product that may be evaluated in this article, or claim that may be made by its manufacturer, is not guaranteed or endorsed by the publisher.
Supplementary material
The Supplementary Material for this article can be found online at: https://www.frontiersin.org/articles/10.3389/fendo.2025.1626925/full#supplementary-material
Supplementary Figure 1 | The research flowchart.
References
1. American Diabetes Association. Diagnosis and classification of diabetes mellitus. Diabetes Care. (2011) 34 Suppl 1:S62–9. doi: 10.2337/dc11-S062
2. Sen S and Chakraborty R. Treatment and diagnosis of diabetes mellitus and its complication: advanced approaches. Mini Rev Med Chem. (2015) 15:1132–3. doi: 10.2174/138955751514151006154616
3. Ceriello A and Prattichizzo F. Variability of risk factors and diabetes complications. Cardiovasc Diabetol. (2021) 20:1. 101. doi: 10.1186/s12933-021-01289-4
4. Sun H, Saeedi P, Karuranga S, Pinkepank M, Ogurtsova K, Duncan BB, et al. IDF Diabetes Atlas: Global, regional and country-level diabetes prevalence estimates for 2021 and projections for 2045. Diabetes Res Clin Pract. (2022) 183:109119. doi: 10.1016/j.diabres.2021.109119
5. Zuo H, Shi Z, and Hussain A. Prevalence, trends and risk factors for the diabetes epidemic in China: a systematic review and meta-analysis. Diabetes Res Clin Pract. (2014) 104:63–72. doi: 10.1016/j.diabres.2014.01.002
6. Lascar N, Brown J, Pattison H, Barnett AH, Bailey CJ, and Bellary S. Type 2 diabetes in adolescents and young adults. Lancet Diabetes Endocrinol. (2018) 6:1. 69–80. doi: 10.1016/s2213-8587(17)30186-9
7. Strati M, Moustaki M, Psaltopoulou T, Vryonidou A, and Paschou SA. Early onset type 2 diabetes mellitus: an update. Endocrine. (2024) 85:3. 965–978. doi: 10.1007/s12020-024-03772-w
8. Khan RMM, Chua ZJY, Tan JC, Yang Y, Liao Z, and Zhao Y. From pre-diabetes to diabetes: diagnosis, treatments and translational research. Medicina (Kaunas). (2019) 55:9. doi: 10.3390/medicina55090546
9. Echouffo-Tcheugui JB, Perreault L, Ji L, and Dagogo-Jack S. Diagnosis and management of prediabetes: A review. Jama. (2023) 329:14. 1206–1216. doi: 10.1001/jama.2023.4063
10. Duan D, Kengne AP, and Echouffo-Tcheugui JB. Screening for diabetes and prediabetes. Endocrinol Metab Clin North Am. (2021) 50:3. 369–385. doi: 10.1016/j.ecl.2021.05.002
11. Satman I. Prediabetes and diabetes: main characteristics. Pol Arch Intern Med. (2023) 133:3. doi: 10.20452/pamw.16469
12. Hu X, Liu Q, Guo X, Wang W, Yu B, Liang B, et al. The role of remnant cholesterol beyond low-density lipoprotein cholesterol in diabetes mellitus. Cardiovasc Diabetol. (2022) 21:1. doi: 10.1186/s12933-022-01554-0
13. Rivas-Urbina A, Benitez S, Perez A, and Sanchez-Quesada JL. Modified low-density lipoproteins as biomarkers in diabetes and metabolic syndrome. Front Biosci (Landmark Ed). (2018) 23:7. 1220–1240. doi: 10.2741/4640
14. Sowers JR, Levy J, and Zemel MB. Hypertension and diabetes. Med Clin North Am. (1988) 72:6. 1399–414. doi: 10.1016/s0025-7125(16)30714-3
15. Zhang J, Zhang YF, Hu CY, Zhang Y, Qi HY, Lin L, et al. Serum total bilirubin and risk of progressing diabetes: A prospective cohort study. BioMed Environ Sci. (2021) 34:8. 632–636. doi: 10.3967/bes2021.087
16. Jung CY and Yoo TH. Pathophysiologic mechanisms and potential biomarkers in diabetic kidney disease. Diabetes Metab J. (2022) 46:2. 181–197. doi: 10.4093/dmj.2021.0329
17. Esser N, Legrand-Poels S, Piette J, Scheen AJ, and Paquot N. Inflammation as a link between obesity, metabolic syndrome and type 2 diabetes. Diabetes Res Clin Pract. (2014) 105:2. 141–50. doi: 10.1016/j.diabres.2014.04.006
18. Duncan BB and Schmidt MI. The epidemiology of low-grade chronic systemic inflammation and type 2 diabetes. Diabetes Technol Ther. (2006) 8:1. 7–17. doi: 10.1089/dia.2006.8.7
19. Deberneh HM and Kim I. Prediction of type 2 diabetes based on machine learning algorithm. Int J Environ Res Public Health. (2021) 18:6. doi: 10.3390/ijerph18063317
20. Radziuk J. Prediction of incident diabetes risk and structural equation modelling. Am J Med Sci. (2022) 364:3. 249–250. doi: 10.1016/j.amjms.2022.05.007
21. Wang S, Chen R, Wang S, Kong D, Cao R, Lin C, et al. Comparative study on risk prediction model of type 2 diabetes based on machine learning theory: a cross-sectional study. BMJ Open. (2023) 13:8. e069018. doi: 10.1136/bmjopen-2022-069018
22. Zong GW, Wang WY, Zheng J, Zhang W, Luo W-M, Fang Z-Z, et al. A metabolism-based interpretable machine learning prediction model for diabetic retinopathy risk: A cross-sectional study in chinese patients with type 2 diabetes. J Diabetes Res. (2023) 2023:3990035. doi: 10.1155/2023/3990035
23. Zahorec R. Neutrophil-to-lymphocyte ratio, past, present and future perspectives. Bratisl Lek Listy. (2021) 122:7. 474–488. doi: 10.4149/bll_2021_078
24. Chen Y, Huang R, Mai Z, Chen H, Zhang J, Zhao L, et al. Association between systemic immune-inflammatory index and diabetes mellitus: mediation analysis involving obesity indicators in the NHANES. Front Public Health. (2023) 11:1331159. doi: 10.3389/fpubh.2023.1331159
25. Rodríguez-Rodríguez E, Salas-González MD, Ortega RM, and López-Sobaler AM. Leukocytes and neutrophil-lymphocyte ratio as indicators of insulin resistance in overweight/obese school-children. Front Nutr. (2021) 8:811081. doi: 10.3389/fnut.2021.811081
26. Davì G and Ferroni P. CD40-CD40L interactions in platelet activation. Thromb Haemost. (2005) 93:6. 1011–2. doi: 10.1160/th05-04-0270
27. Liu L, Hu J, Wang Y, Lei H, and Xu D. The role and research progress of the balance and interaction between regulatory T cells and other immune cells in obesity with insulin resistance. Adipocyte. (2021) 10:1. 66–79. doi: 10.1080/21623945.2021.1876375
28. Delanaye P, Cavalier E, Maillard N, Krzesinski J-M, Mariat C, Cristol J-P, et al. Creatinine: past and present. Ann Biol Clin (Paris). (2010) 68:5. 531–43. doi: 10.1684/abc.2010.0479
29. Ruze R, Liu T, Zou X, Song J, Chen Y, Xu R, et al. Obesity and type 2 diabetes mellitus: connections in epidemiology, pathogenesis, and treatments. Front Endocrinol (Lausanne). (2023) 14:1161521. doi: 10.3389/fendo.2023.1161521
30. Boutari C, DeMarsilis A, and Mantzoros CS. Obesity and diabetes. Diabetes Res Clin Pract. (2023) 202:110773. doi: 10.1016/j.diabres.2023.110773
31. Rachek LI. Free fatty acids and skeletal muscle insulin resistance. Prog Mol Biol Transl Sci. (2014) 121:267–92. doi: 10.1016/b978-0-12-800101-1.00008-9
Keywords: diabetes, prediabetes, predictive model, nomogram, generalized estimating equations
Citation: Tan J, Chen M, Lei Y, Shi X, Cao C, Du N, Yao Y and Yao X (2025) Prevalence of diabetes and prediabetes among working-age adults and influencing factors of new-onset diabetes: a five-year cohort study (2018–2023). Front. Endocrinol. 16:1626925. doi: 10.3389/fendo.2025.1626925
Received: 19 May 2025; Accepted: 11 August 2025;
Published: 17 September 2025.
Edited by:
Pedro Alexandre Duarte-Mendes, Polytechnic Institute of Castelo Branco, PortugalReviewed by:
Miguel Jacinto, Polytechnic Institute of Leiria, PortugalFernanda M. Silva, University of Coimbra, Portugal
Copyright © 2025 Tan, Chen, Lei, Shi, Cao, Du, Yao and Yao. This is an open-access article distributed under the terms of the Creative Commons Attribution License (CC BY). The use, distribution or reproduction in other forums is permitted, provided the original author(s) and the copyright owner(s) are credited and that the original publication in this journal is cited, in accordance with accepted academic practice. No use, distribution or reproduction is permitted which does not comply with these terms.
*Correspondence: Xiaojuan Yao, WVlZMjAwMDAxMkAxMjYuY29t
†These authors have contributed equally to this work and share first authorship