 Ruixue Sun1†
 Cheng Fu
 Yuzhan Lin
- 1Department of Clinical Laboratory, The Third Affiliated Hospital of Wenzhou Medical University, Ruian, Zhejiang, China
- 2Hospital Infection Management Department (Public Health Department), The Third Affiliated Hospital of Wenzhou Medical University, Ruian, Zhejiang,, China
- 3Information Department, Ruian Traditional Chinese Medicine Hospital, Ruian, Zhejiang, China
- 4Department of Clinical Laboratory, Ruian Traditional Chinese Medicine Hospital, Ruian, Zhejiang, China
Background: The triglyceride-glucose (TyG) index is a surrogate marker of insulin resistance and has been associated with incident hypertension. However, evidence regarding sex-specific differences in this association remains limited. This study aimed to investigate whether sex modifies the association between the TyG index and incident hypertension in the general population.
Methods: We conducted a retrospective cohort study involving 3,465 employees who underwent annual health check-ups in 2021 at the Third Affiliated Hospital of Wenzhou Medical University, with follow-up until December 2024. Participants with hypertension at baseline were excluded. The TyG index was calculated as ln [fasting triglycerides (mg/dL) × fasting glucose (mg/dL)/2]. Cox proportional hazards models and restricted cubic spline (RCS) analyses were used to evaluate the association between TyG index and incident hypertension across sex-specific subgroups. Sensitivity analyses tested robustness.
Results: The incidence of hypertension increased across TyG quartiles in both sexes (p < 0.01). In women, the highest TyG quartile was associated with a significantly higher hypertension risk (HR = 1.82, 95% CI: 1.06–3.13). In men, the association was attenuated after adjustment. The results of the RCS analysis revealed that when TyG levels were high, the risk of hypertension was greater in men than in women. This conclusion was partially validated by the findings from the sensitivity analyses.
Conclusions: In this retrospective cohort study based on annual health check-up data from hospital employees, we found that the TyG index may be positively associated with the risk of new-onset hypertension, with differences observed between sexes. Further research is needed to validate these findings and address potential confounding and concerns about generalizability.
Introduction
Hypertension is one of the most widespread chronic conditions globally and remains a leading contributor to cardiovascular morbidity and mortality (1). According to the World Health Organization, approximately 1.28 billion adults aged 30 to 79 had hypertension in 2019, with fewer than one in five achieving adequate blood pressure control (2). In China, the prevalence of hypertension among community-dwelling adults aged 35 to 75 has reached 44.7% (age- and sex-standardized rate: 37.2%), affecting nearly half of the adult population, with a rising trend (3). More concerningly, recent epidemiological studies have reported an increasing trend in early-onset hypertension, with rising detection rates among young adults and the working population (4, 5). The rising incidence of hypertension among younger individuals highlights the importance of early detection and intervention during the prehypertensive or normotensive stages to prevent irreversible vascular damage and reduce long-term cardiovascular risk. Therefore, research on new-onset hypertension, particularly the early identification of high-risk individuals, is urgently needed.
Insulin resistance (IR) is considered both a pathogenic factor and an early predictor of hypertension (6). However, the clinical application of gold-standard methods, such as the hyperinsulinemic-euglycemic clamp test, is limited due to their complexity and invasiveness (7). The triglyceride-glucose (TyG) index, derived from fasting triglyceride and fasting glucose levels, has emerged as a simple and reliable surrogate marker of IR (8). Previous studies have shown that the TyG index is associated with elevated blood pressure and the development of hypertension. Individuals with higher TyG levels have a 1.51-fold increased risk of developing hypertension compared to those with lower levels (2). Additionally, longitudinal increases in TyG levels are also linked to elevated blood pressure and incident hypertension (9).
However, evidence regarding sex-specific differences in the association between the TyG index and new-onset hypertension remains limited, and findings across studies are inconsistent, with some reporting no sex differences (10–13) and one study suggesting the presence of differences (14). Moreover, these studies either conducted subgroup analyses using generalized linear models (10–13), or observed such differences only in populations aged over 40 years (14). Therefore, this study aims to examine sex-specific differences in the association between the TyG index and new-onset hypertension using longitudinal data from annual health check-ups of employees at the Health Examination Center of the Third Affiliated Hospital of Wenzhou Medical University.
Methods
Study population and ethics
Baseline was defined as the period from January 1 to December 31, 2021, during which all employees of the Third Affiliated Hospital of Wenzhou Medical University (Ruian People’s Hospital) underwent annual health examinations. All participants completed baseline questionnaires, physical examinations, and blood tests. A total of 3,465 individuals participated in the annual health check-ups in 2021. Participants were followed longitudinally from baseline in 2021 through December 31, 2024.
The exclusion criteria were as follows (1): participants without blood test data at baseline (2); those with pre-existing hypertension at baseline; and (3) those with unclear hypertension status during follow-up.
This study was approved by the Ethics Committee of the Third Affiliated Hospital of Wenzhou Medical University. Because the study was retrospective and the data were anonymized, the ethics committee waived written informed consent (Ethics approval number, YJ2025062).
Definition of hypertension and new-onset hypertension
Hypertension was defined as meeting at least one of the following criteria (1): systolic blood pressure (SBP) ≥140 mmHg or diastolic blood pressure (DBP) ≥90 mmHg (2); use of antihypertensive medication; or (3) self-reported physician diagnosis of hypertension (15).
New-onset hypertension was defined as the development of hypertension during follow-up among participants who were normotensive at baseline. The occurrence of hypertension during follow-up was determined based on blood pressure measurements, medication records, and self-reported diagnoses. At each follow-up visit, the diagnosis of hypertension was based on the same three criteria described above. The date of blood pressure measurement, medication initiation, or self-report was recorded and used to calculate follow-up time. For participants who did not develop hypertension during follow-up, the follow-up duration was calculated as the time between baseline and the last available follow-up visit (9).
Calculation of TyG index
The TyG index was calculated using the formula: TyG index = ln [fasting triglycerides (mg/dL) × fasting glucose (mg/dL)/2]
Collection and definition of covariates
Baseline data were collected through comprehensive health examinations and included the following components: Demographic information included age, sex, marital status, family history of hypertension or diabetes, and department affiliation. Physical examination data included height, weight, body mass index (BMI), waist circumference, systolic blood pressure (SBP), and diastolic blood pressure (DBP). Laboratory results included complete blood count and biochemical tests, such as fasting plasma glucose, triglycerides (TG), total cholesterol (TC), high-density lipoprotein cholesterol (HDL-C), and low-density lipoprotein cholesterol (LDL-C).
Blood pressure was measured using an automated electronic sphygmomanometer after participants had rested in a seated position for at least 5 minutes. Personal and family histories of hypertension and diabetes were obtained via standardized questionnaires. Medication history was obtained from the hospital’s Health Information System (HIS); participants with records of antihypertensive drug use were considered to have received antihypertensive treatment. Marital status was self-reported and categorized as married or unmarried. Departments were classified according to their functional nature into clinical, medical technology, administrative, pharmacy, and retired groups. BMI was calculated as weight in kilograms divided by height in meters squared (kg/m²). Biochemical measurements were performed using fasting venous blood samples collected in yellow-top vacuum tubes after an overnight fast of at least 8 hours. Whole blood samples were centrifuged within 2 hours at 4°C using a refrigerated centrifuge at 1000–1200 ×g for 10–15 minutes to separate the serum (16).
Statistical analysis
All analyses were conducted using R software (version 4.2.2; http://www.R-project.org, The R Foundation) and EmpowerStats (version 4.2; http://www.empowerstats.com, X&Y Solutions, Inc.).
Continuous variables were expressed as mean ± standard deviation (SD) or median with interquartile range (IQR), depending on their distribution. Categorical variables were presented as frequencies and percentages. For comparisons of continuous variables across four groups, one-way analysis of variance (ANOVA) was used if the data were normally distributed; otherwise, the Kruskal–Wallis test was applied. Categorical variables were compared using the chi-square test; if the expected cell count was less than 10, Fisher’s exact test was used instead. Cox proportional hazards models were used to evaluate the association between the TyG index and the risk of new-onset hypertension. Covariates were selected based on previously published literature (9, 17), and multivariable models were constructed to adjust for potential confounding factors. Regression results were presented as unadjusted, partially adjusted, and fully adjusted models (18). Restricted cubic spline (RCS) curves were used to examine potential nonlinear associations between the TyG index and the risk of new-onset hypertension in the overall population as well as in sex-specific subgroups, with log(HR) plotted on the Y-axis (19). To verify the stability of the results, a sensitivity analysis was performed in which RCS curves were analyzed separately in people who were not retired, were of Han ethnicity, and were not diabetic at baseline.
Results
Baseline characteristics of participants
Figure 1 presents the flowchart of participant enrollment. Among the 3,465 employees who underwent annual health examinations in 2021, a total of 2,643 participants were included in the final analysis after applying exclusion criteria. Baseline characteristics stratified by TyG quartiles and sex are shown in Table 1. In both women and men, higher TyG levels were associated with older age, higher BMI, and elevated blood pressure (p < 0.001). Additionally, higher levels of glucose, triglycerides, uric acid, and liver enzymes were observed in participants with higher TyG levels (p < 0.001). The incidence of new-onset hypertension increased significantly across TyG quartiles, rising from 9.3% to 18.5% in women (p < 0.001) and from 11.8% to 29.2% in men (p = 0.007). As TyG levels increased, HDL-C levels decreased while LDL-C levels increased.
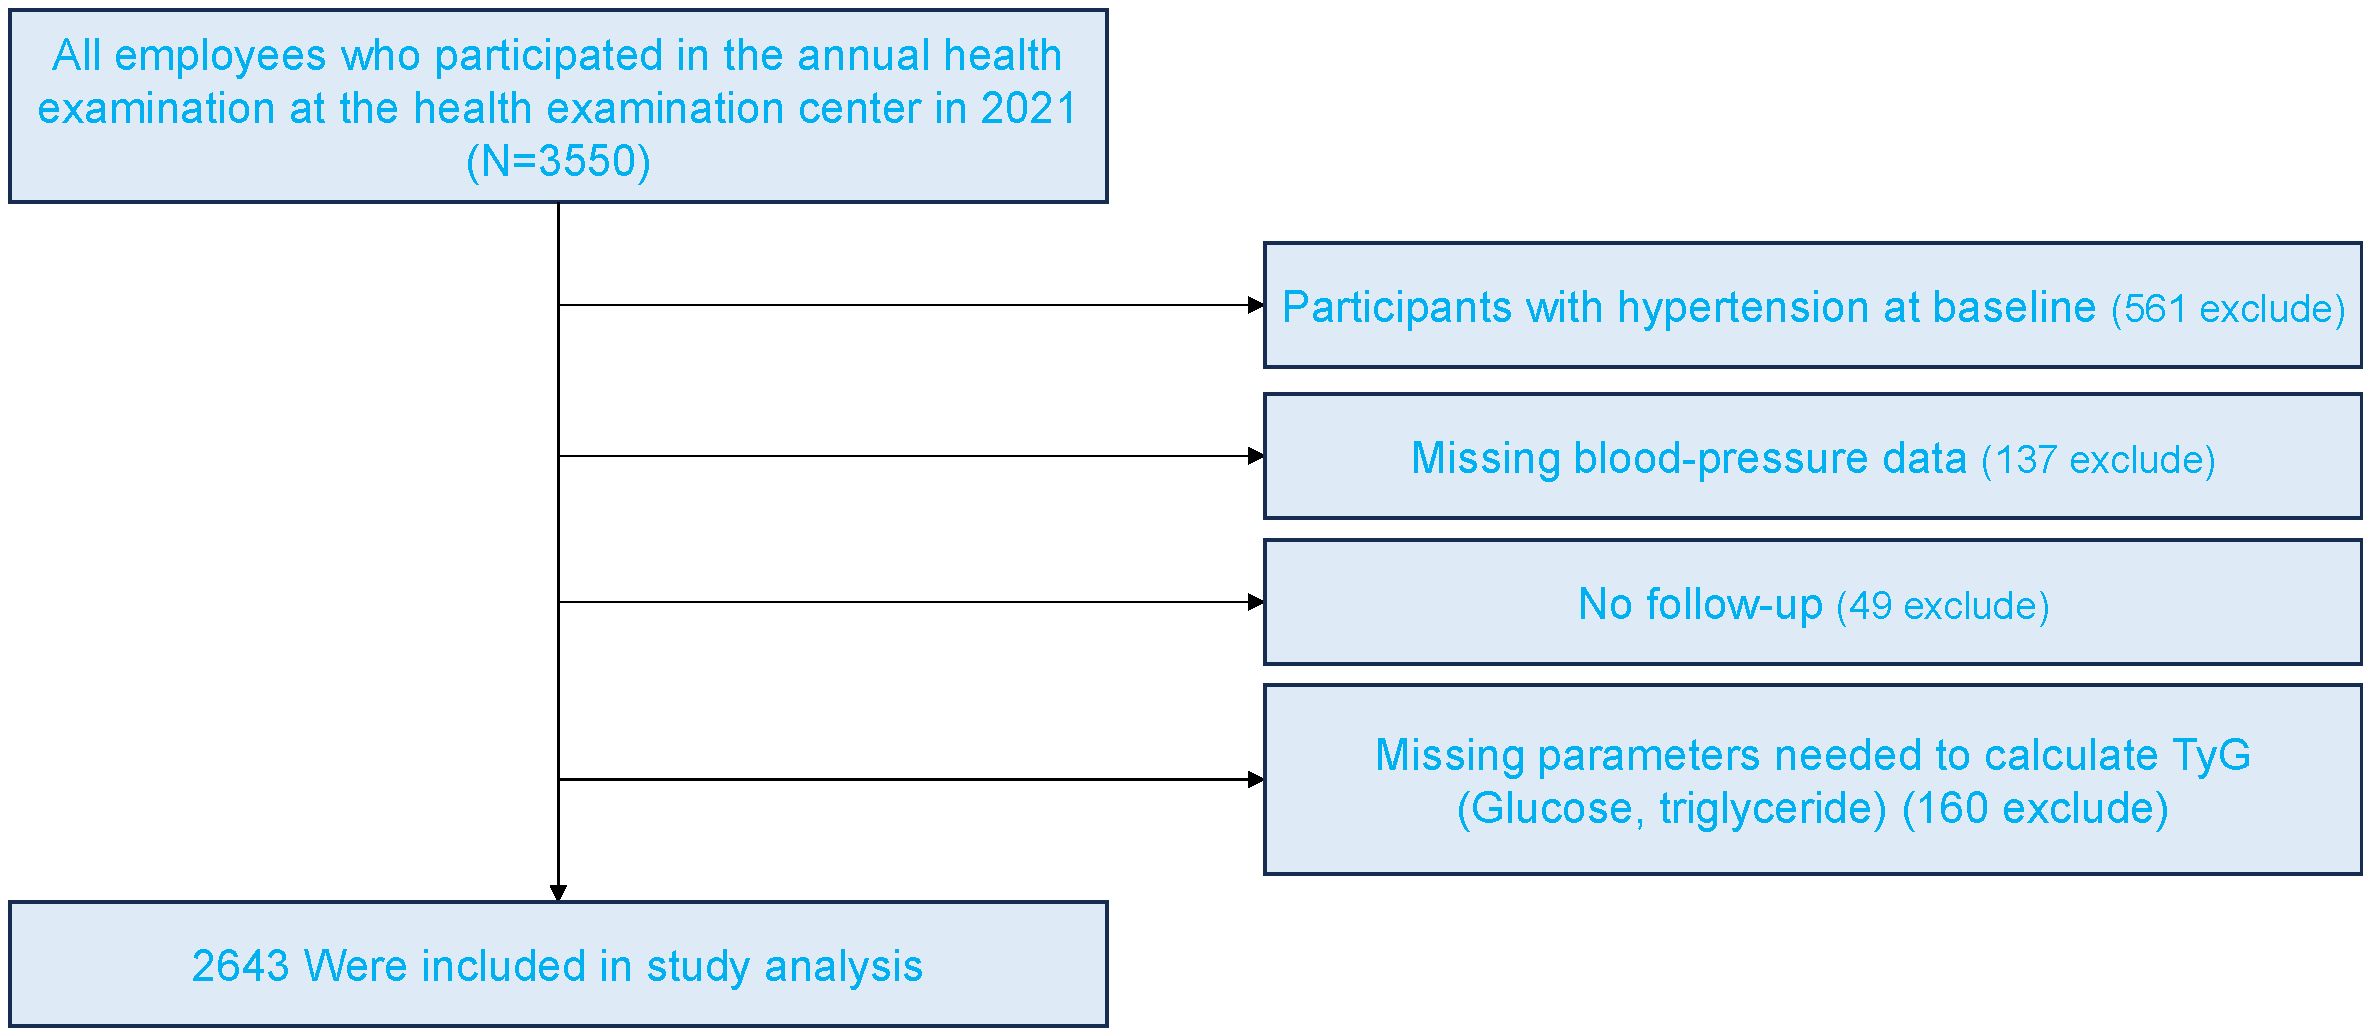
Figure 1. Flowchart of the study population.
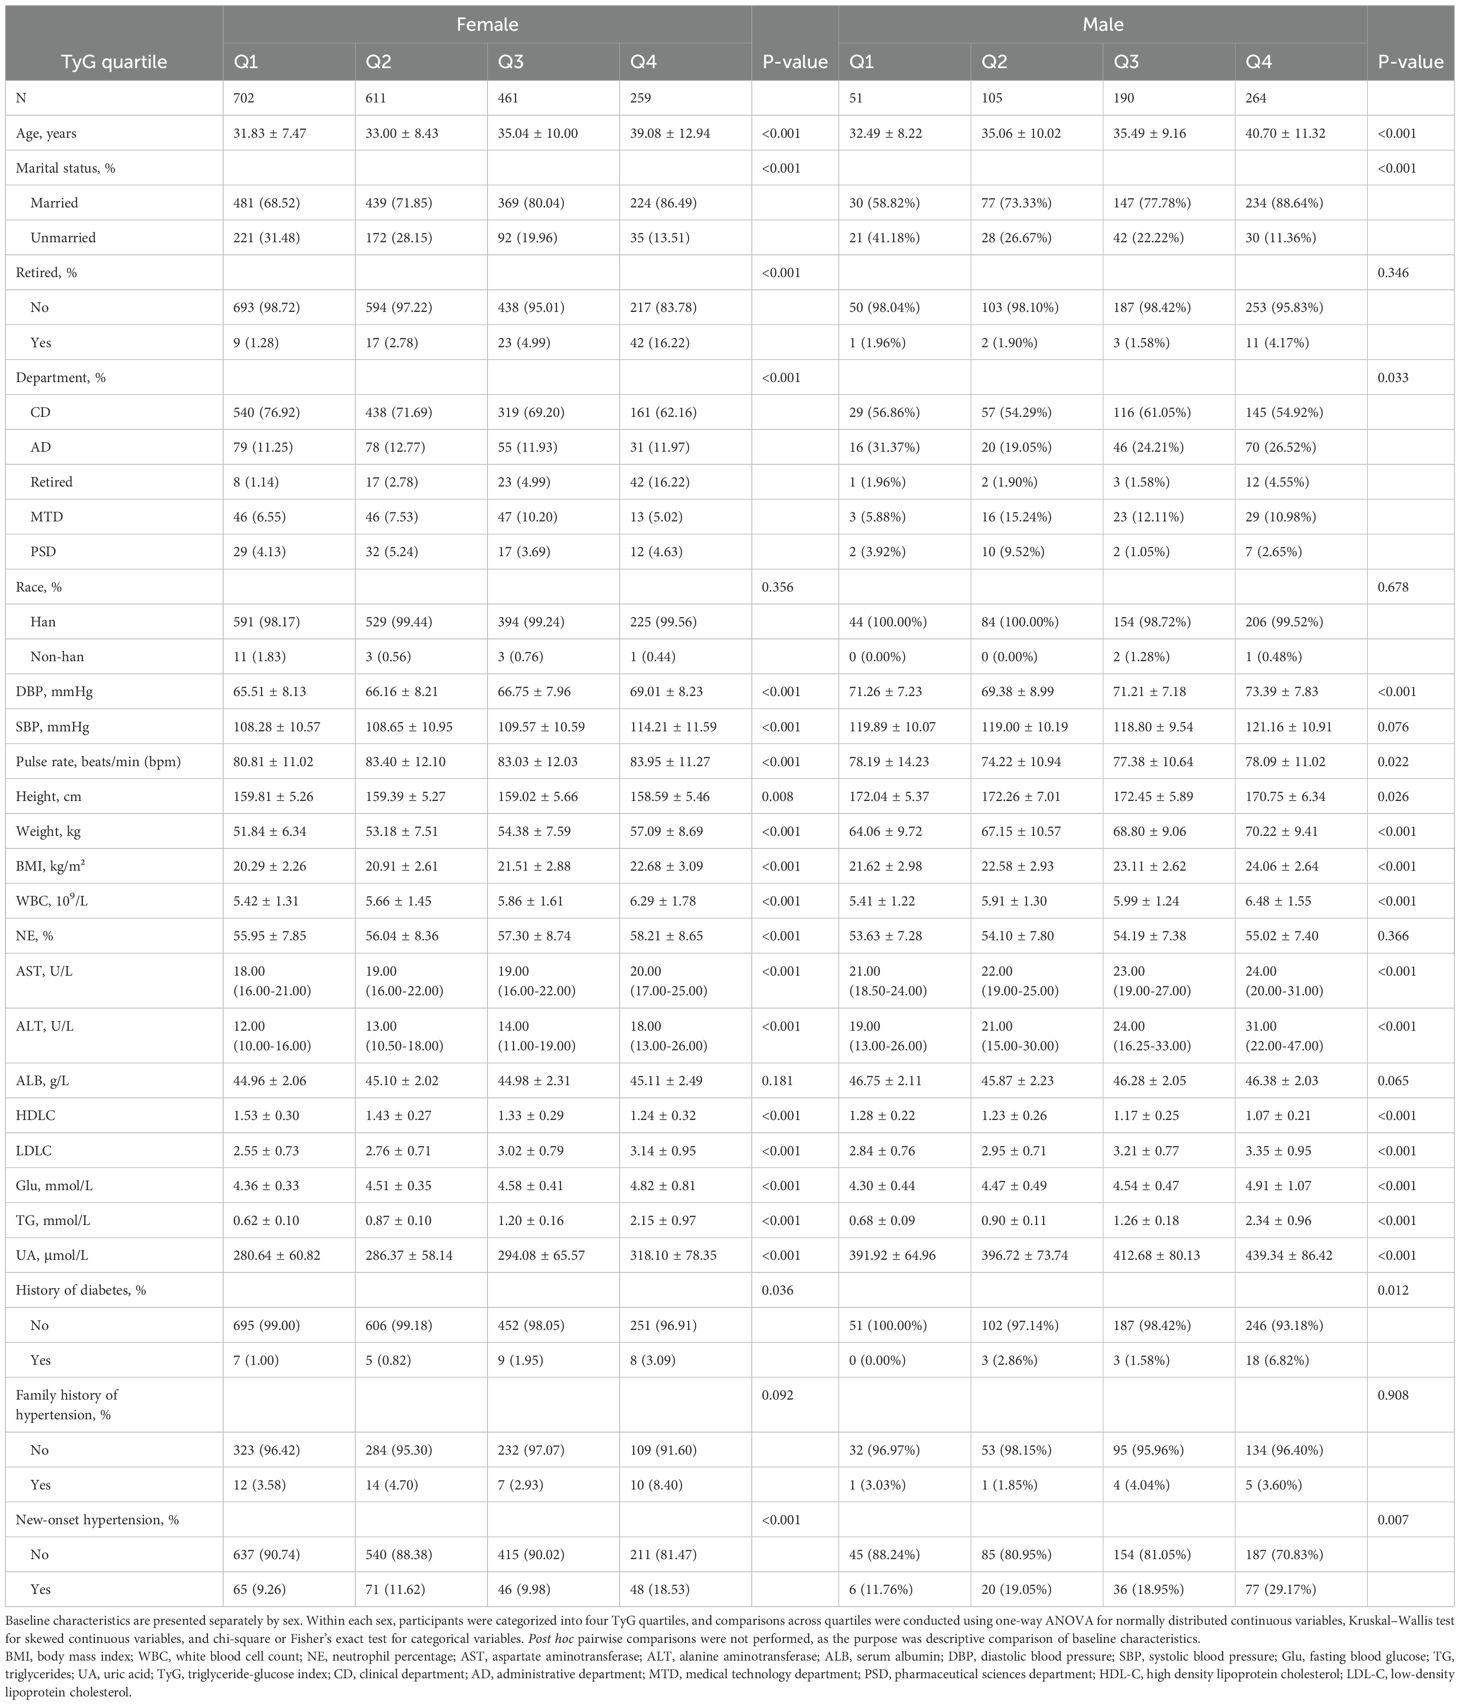
Table 1. Baseline characteristics of participants (N =2643).
Association of TyG index with incident hypertension in sex-specific subgroups
Table 2 presents the results of the Cox regression analysis. In the unadjusted model, higher TyG index levels were associated with an increased risk of new-onset hypertension in both men and women. Among women, the highest TyG quartile (Q4) was significantly associated with an increased risk of hypertension compared to the lowest quartile (Q1) in the unadjusted model (HR = 2.16, 95% CI: 1.49–3.14, P < 0.0001), and the association remained significant after full adjustment (HR = 1.82, 95% CI: 1.06–3.13, P = 0.0307). In men, a significant association was also observed in the unadjusted model (Q4 vs. Q1: HR = 3.05, 95% CI: 1.33–7.01, P = 0.0085), but it was no longer significant after full adjustment. In the overall population, a significant positive association between the TyG index and hypertension was observed in the unadjusted model, but the association was not significant in the fully adjusted model.
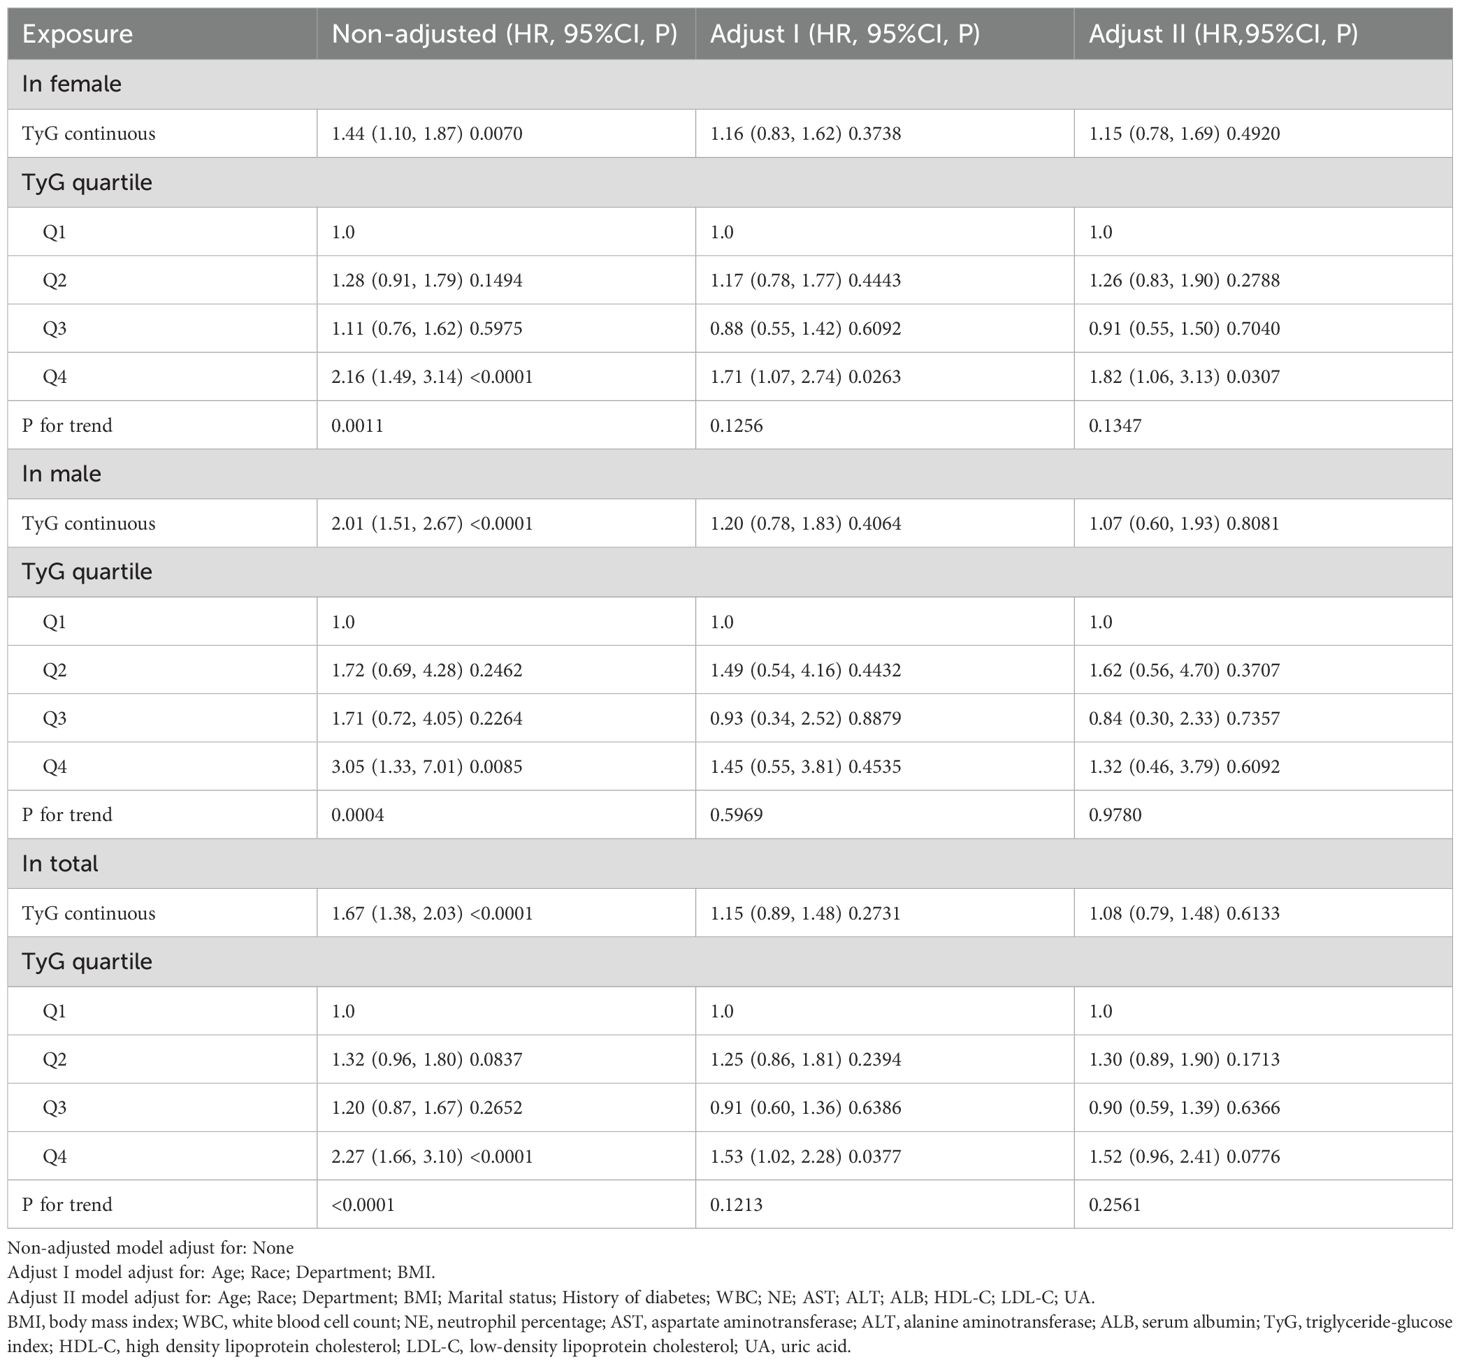
Table 2. Associations between TyG index and new-onset hypertension.
Figure 2 illustrates the association between the TyG index and the risk of new-onset hypertension using a RCS model. In the overall population, a nonlinear positive relationship was observed between the TyG index and the risk of new-onset hypertension. In Figure 2B, stratified analyses by sex showed that the risk of new-onset hypertension increased with rising TyG levels in both men and women. However, the risk of hypertension differed between sexes at different TyG levels, with men exhibiting a greater risk than women when the TyG index reached higher levels.
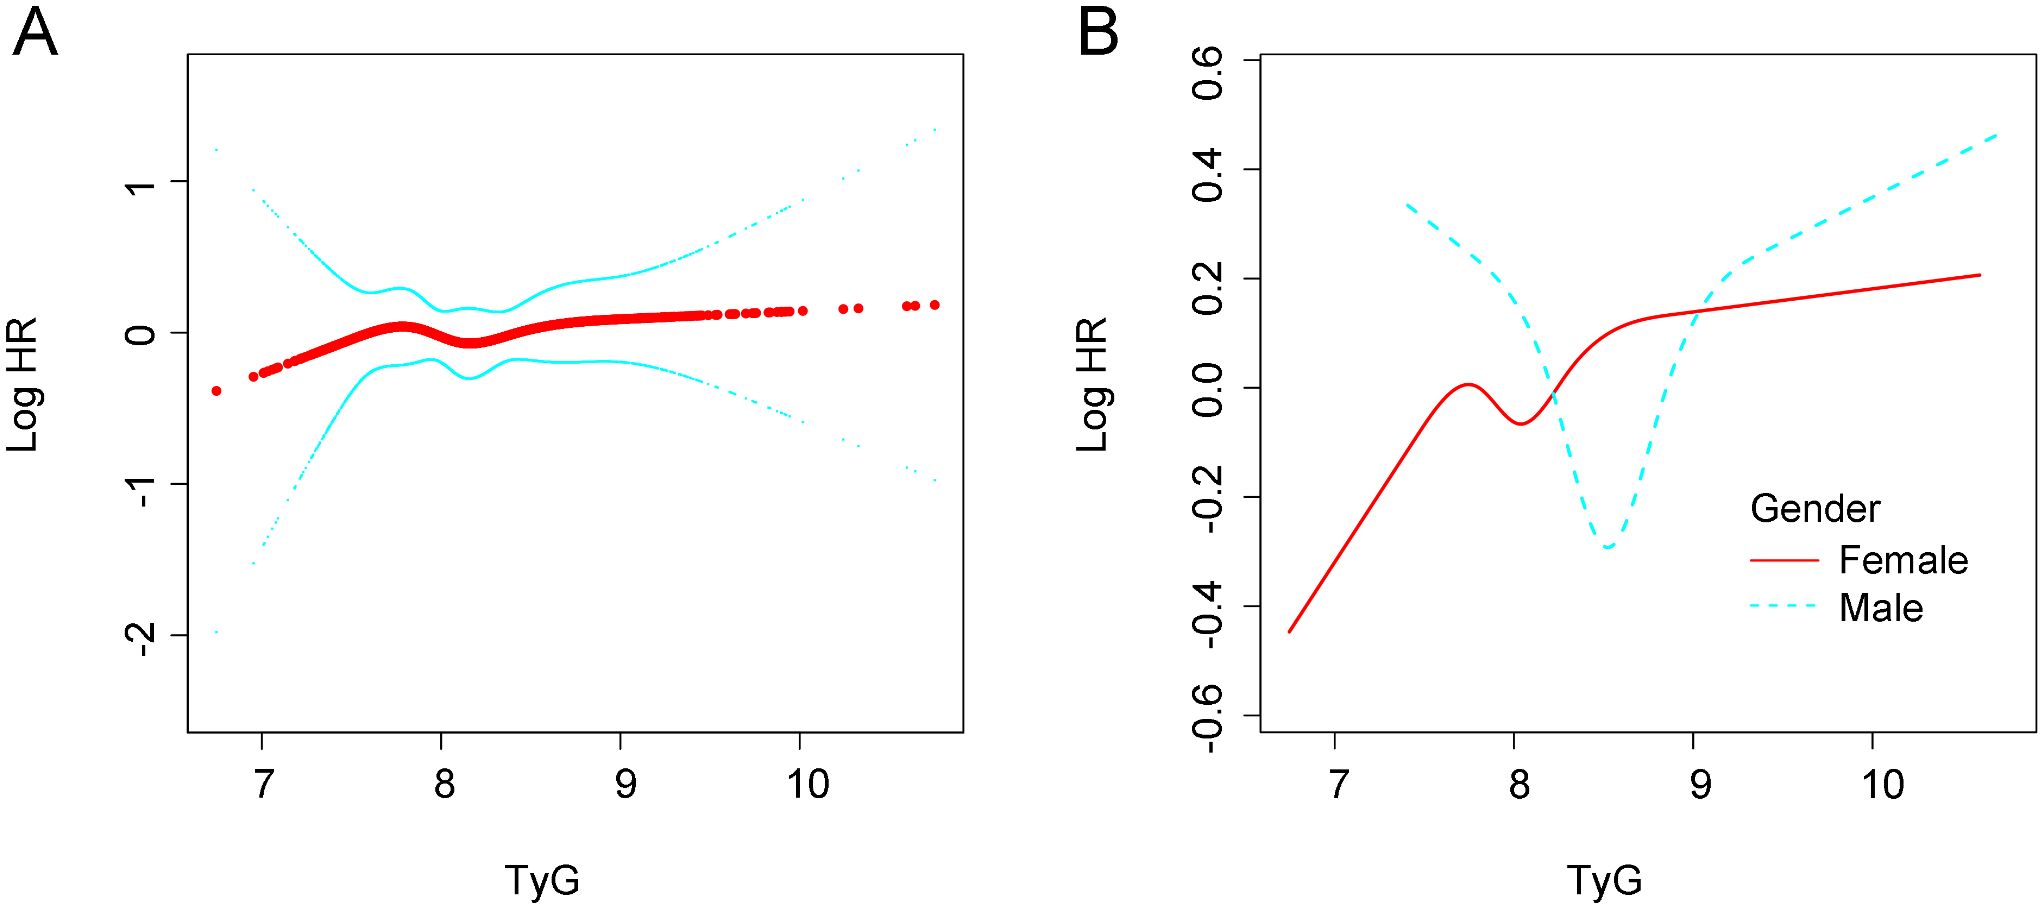
Figure 2. Association between TyG and new-onset hypertension. (A) in the general population. (B) In different gender groups. All analyses were adjusted for confounding factors including. Age; ARace; Department; BMI; Marital status; History of diabetes; WBC; NE; AST; ALT; ALB; HDL-C; LDL-C; UA. BMI, body mass index; WBC, white blood cell count; NE, neutrophil percentage; AST, aspartate aminotransferase; ALT, alane aminotransferase; ALB, serum neutrophil perecntage; AST, aspartate aminotransferase; ALT, alane aminotransferase; ALB, serum albumin; TyG, tryglyceride-fglucose index; HDL-C, High density liproprotein cholesterol; LDL-C, Low-density lipoprotein cholesterol; UA, uric acid.
Sensitivity analysis
Stratified analyses using the RCS model were performed in the non-retired population, Han Chinese participants, and individuals without diabetes at baseline (Figure 3). In all these subgroups, sex differences were observed in the association between TyG levels and new-onset hypertension. Among Han participants and those without baseline diabetes, women had a lower incidence of hypertension than men when TyG levels were high. However, this pattern was not observed in the non-retired population.
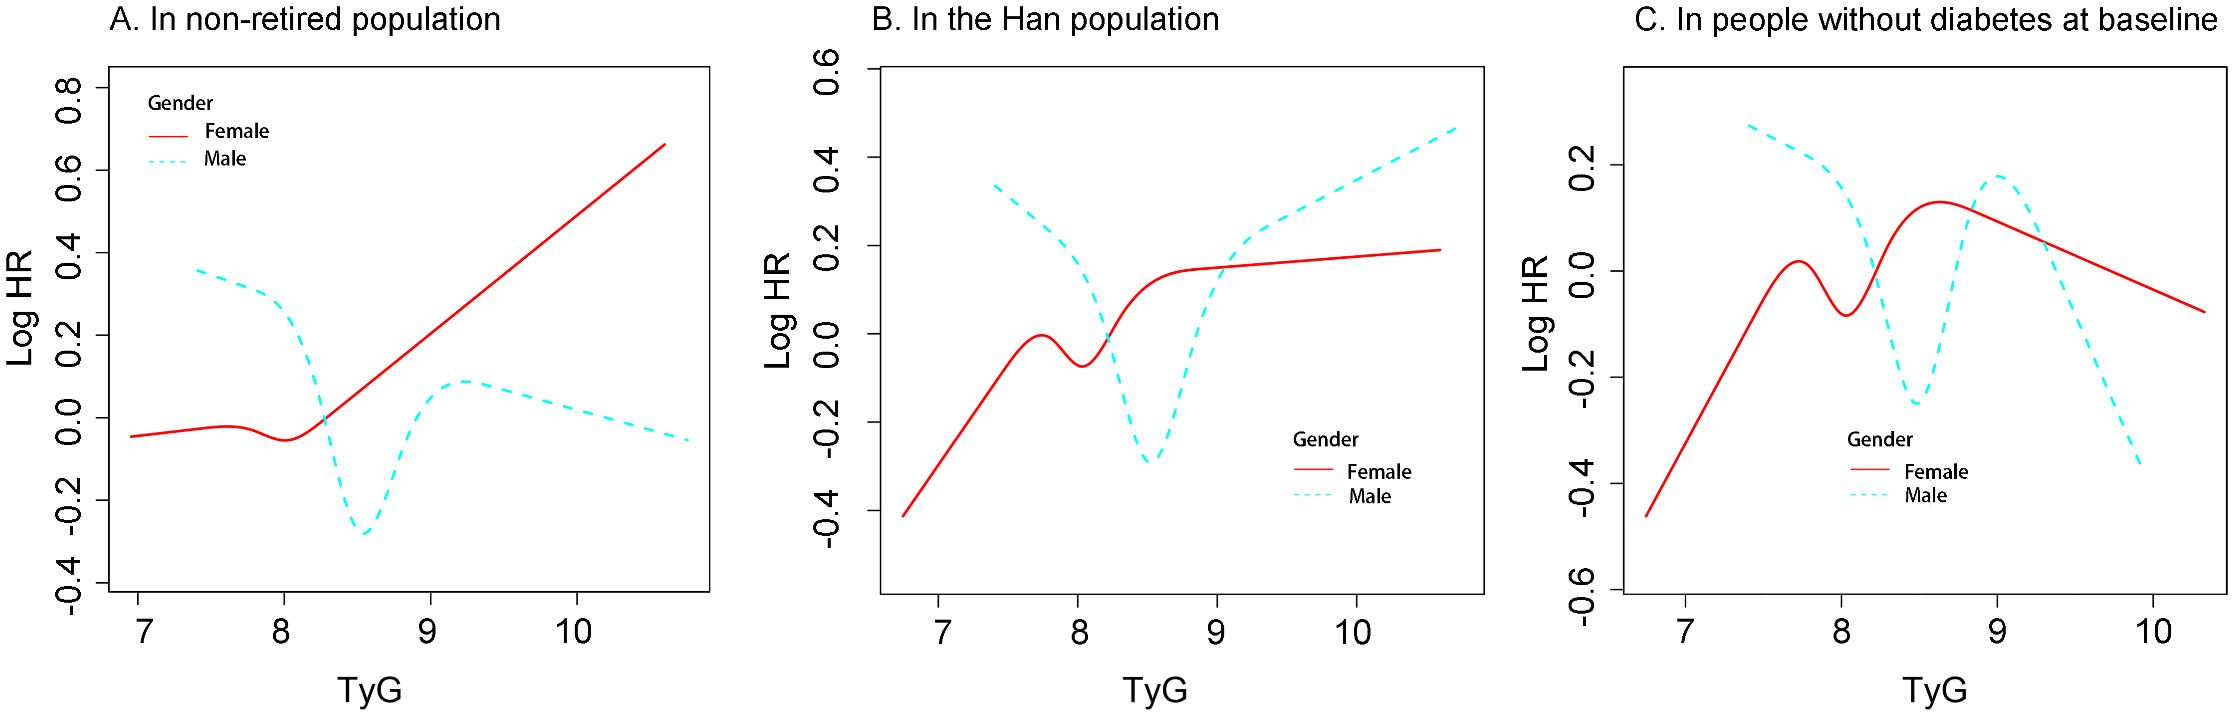
Figure 3. The associatioon between TyG and new-onset hypertension differed by gender in different population (A) In non-retired popultaion. (B) in the Han population. (C) In people without diabetes at baseline. Restricted cubic spline analysis was used to construct stratification curves, and all analyses were adjusted for confounding factors. Including: Age : Race; Department; BMI;Marital status; History of diabtes; WBC; NE; AST; ALT; ALB; HDL-C; LDL-C; UA (Excluding the variable of restricted poplulation) BMI, body mass index; WBC, white blood cell count; NE, Neutrophil percentage; AST, aspartate aminotransferase; ALT, alanine amonitransferase; ALB,serum albumin; TyG, triglyceride-glucose index; HDL-C, High density lipoprotein cholesterol; LDC-C, low density lipoprotein cholesterol; UA, Uric acid.
Discussion
In this retrospective cohort study based on annual health check-up data of hospital employees, we found that higher TyG index levels were significantly associated with an increased risk of new-onset hypertension, and this association differed by sex. To our knowledge, this is the first study to investigate sex-specific differences in the association between the TyG index and incident hypertension.
Previous studies have also confirmed a positive association between the TyG index and new-onset hypertension. For example, Wang et al. (9) reported that baseline TyG levels were positively associated with new-onset hypertension. Each one-unit increase in TyG was associated with a 21% higher risk of hypertension (HR = 1.21, 95% CI: 1.13–1.29). Similarly, a 9-year cohort study by Zheng et al. (20) reported consistent findings, with participants in the highest TyG quartile having a significantly higher risk of hypertension compared to those in the lowest quartile (Q4 vs. Q1: HR = 1.53, 95% CI: 1.07–2.19). In addition, Gao et al. (11) and Liu et al. (10) analyzed two large nationwide datasets with representative Chinese populations—the CHNS and CHARLS—and reported similar results. Similar associations were also observed in studies conducted among Singaporean (21) and Spanish (13) populations. In the two studies based on nationwide Chinese population data, generalized linear models were used for subgroup analyses by sex. No significant sex differences were observed (CHARLS: male HR = 1.17, female HR = 1.20; CHNS: male HR = 1.27, female HR = 1.35). In our study, Cox regression analysis showed that the HR for women (1.18) was slightly higher than that for men (1.01), which is consistent with previous findings. Using RCS, we found a sex difference in the association between TyG levels and new-onset hypertension. Among individuals with higher TyG levels, women had a lower risk of hypertension compared to men. Our study also collected information on participants’ departments and adjusted for this variable in the analysis. This is a strength of our study, as in Chinese hospitals, different departments are often associated with distinct work patterns and lifestyle behaviors (22, 23). A recent meta-analysis concluded that the association between TyG and new-onset hypertension is not affected by sex (2). This conclusion is controversial compared to our findings. Since our data are derived from a single-center study, additional evidence is needed to further explore sex differences and support our observations.
In the sensitivity analyses, we found significant differences in the risk of new-onset hypertension between men and women as TyG levels increased across different subpopulations. Among Han participants and those without diabetes at baseline, women had a lower risk of developing hypertension than men at higher TyG levels. However, this pattern was not observed in the non-retired population. Considering that our study population consisted of hospital employees from various clinical and administrative departments, female healthcare workers may experience greater occupational stress, particularly nurses. Factors such as night shifts and heavy workloads may increase the risk of metabolic disorders and elevated blood pressure in this group (24). In addition, women often bear additional family responsibilities in society (25), which may partially explain our findings. However, further studies are needed to support this hypothesis.
Several potential pathophysiological mechanisms may explain the association between the TyG index and hypertension. The TyG index is widely recognized as a surrogate marker of insulin resistance (26), which influences blood pressure through multiple pathways. For example, IR can lead to endothelial dysfunction by reducing nitric oxide production, which impairs vasodilation and increases peripheral vascular resistance (27). Additionally, IR activates the sympathetic nervous system through both central and peripheral mechanisms, leading to increased heart rate and vasoconstriction (28). It also promotes renal sodium reabsorption, resulting in fluid retention and increased blood volume (29). Moreover, individuals with elevated TyG levels often exhibit chronic low-grade inflammation and sustained oxidative stress, which contribute to atherosclerosis and vascular remodeling (30), further increasing blood pressure.
In our study, the risk of new-onset hypertension tended to stabilize in women with higher TyG levels compared to men. We speculate that this phenomenon may be attributed to the protective effects of estrogen on lipid metabolism, insulin resistance, and cardiovascular as well as blood pressure regulation. Estrogen has been shown in multiple studies to enhance insulin sensitivity by promoting glucose uptake in peripheral tissues and suppressing hepatic gluconeogenesis, thereby lowering blood glucose levels (31). It also mobilizes systemic fat stores and reduces visceral fat accumulation (32). In addition, estrogen downregulates hepatic angiotensinogen synthesis, thereby inhibiting the renin–angiotensin–aldosterone system, reducing vasoconstriction and sodium retention (33). Estrogen also inhibits both central and peripheral sympathetic nervous system activity, leading to reduced norepinephrine release and vascular tone, which ultimately lowers blood pressure (34). Furthermore, estrogen enhances endothelial function and vasodilation by activating endothelial nitric oxide synthase and promoting nitric oxide production (35). Beyond blood pressure regulation, estrogen also exerts significant anti-inflammatory and antioxidant effects. Estrogen suppresses the expression of pro-inflammatory cytokines such as tumor necrosis factor-α, interleukin-6, and C-reactive protein (36), while upregulating anti-inflammatory cytokines like interleukin-10 (37), thereby modulating and reducing systemic inflammation.
This study also has several limitations. First, the data were obtained from a single center and included only hospital employees undergoing annual health examinations, which may limit the generalizability of our findings to other populations. Second, although we adjusted for multiple confounders as much as possible, unmeasured confounding remains due to the retrospective nature of this study. Variables such as smoking, alcohol consumption, sleep apnea, sleep quality, dietary habits, and physical activity were not collected. Therefore, we collected other variables to partially account for relevant confounding factors. For example, we collected information on participants’ clinical department to serve as a proxy for occupational stress. However, residual confounding cannot be completely eliminated. Third, due to the observational nature of this study, we can only establish an association between the TyG index and new-onset hypertension, rather than causality. Fourth, we analyzed only baseline TyG levels and did not assess the potential impact of longitudinal changes in TyG on hypertension risk. Further studies are warranted to explore this issue.
Conclusions
In this retrospective cohort study based on annual health check-up data from hospital employees, we found that the TyG index may be positively associated with the risk of new-onset hypertension, and this association may be nonlinear. Moreover, our analysis suggested that at higher TyG levels, men had a greater risk of developing hypertension compared to women. Further studies are needed to address potential confounding and improve the generalizability of these findings.
Data availability statement
The raw data supporting the conclusions of this article will be made available by the authors, without undue reservation.
Ethics statement
The studies involving humans were approved by the Ethics Committee of the Third Affiliated Hospital of Wenzhou Medical University. The studies were conducted in accordance with the local legislation and institutional requirements. The ethics committee/institutional review board waived the requirement of written informed consent for participation from the participants or the participants’ legal guardians/next of kin because the study was retrospective and the data were anonymized, the ethics committee waived written informed consent (Ethics approval number, YJ2025062).
Author contributions
RS: Writing – review & editing. JC: Writing – review & editing. SY: Writing – review & editing. JQ: Writing – original draft. CF: Writing – review & editing. YL: Writing – review & editing, Writing – original draft.
Funding
The author(s) declare that no financial support was received for the research and/or publication of this article.
Acknowledgments
The authors thank the field investigators for their contribution and the participants for their cooperation.
Conflict of interest
The authors declare that the research was conducted in the absence of any commercial or financial relationships that could be construed as a potential conflict of interest.
Generative AI statement
The author(s) declare that no Generative AI was used in the creation of this manuscript.
Publisher’s note
All claims expressed in this article are solely those of the authors and do not necessarily represent those of their affiliated organizations, or those of the publisher, the editors and the reviewers. Any product that may be evaluated in this article, or claim that may be made by its manufacturer, is not guaranteed or endorsed by the publisher.
References
1. Al-Makki A, DiPette D, Whelton PK, Murad MH, Mustafa RA, Acharya S, et al. Hypertension pharmacological treatment in adults: A world health organization guideline executive summary. Hypertension. (2022) 79:293–301. doi: 10.1161/HYPERTENSIONAHA.121.18192
2. Yang C, Song Y, and Wang P. Relationship between triglyceride-glucose index and new-onset hypertension in general population-a systemic review and meta-analysis of cohort studies. Clin Exp Hypertens. (2024) 46:2341631. doi: 10.1080/10641963.2024.2341631
3. Lu J, Lu Y, Wang X, Li X, Linderman GC, Wu C, et al. Prevalence, awareness, treatment, and control of hypertension in China: data from 1·7 million adults in a population-based screening study (China PEACE Million Persons Project). Lancet. (2017) 390:2549–58. doi: 10.1016/S0140-6736(17)32478-9
4. Suvila K, Lima JAC, Cheng S, and Niiranen TJ. Clinical correlates of early-onset hypertension. Am J Hypertens. (2021) 34:915–8. doi: 10.1093/ajh/hpab066
5. Fang Y, Xie H, and Fan C. Association of hypertension with helicobacter pylori: A systematic review and meta−analysis. PloS One. (2022) 17:e0268686. doi: 10.1371/journal.pone.0268686
6. Tagi VM, Mainieri F, and Chiarelli F. Hypertension in patients with insulin resistance: etiopathogenesis and management in children. Int J Mol Sci. (2022) 23:10. doi: 10.3390/ijms23105814
7. Muniyappa R, Lee S, Chen H, and Quon MJ. Current approaches for assessing insulin sensitivity and resistance in vivo: advantages, limitations, and appropriate usage. Am J Physiol Endocrinol Metab. (2008) 294:E15–26. doi: 10.1152/ajpendo.00645.2007
8. Guo Y, Zhao J, Zhang Y, Wu L, Yu Z, He D, et al. Triglyceride glucose index influences platelet reactivity in acute ischemic stroke patients. BMC Neurol. (2021) 21:409. doi: 10.1186/s12883-021-02443-x
9. Wang D, Li W, Zhou M, Ma J, Guo Y, Yuan J, et al. Association of the triglyceride-glucose index variability with blood pressure and hypertension: a cohort study. QJM. (2024) 117:277–82. doi: 10.1093/qjmed/hcad252
10. Liu T, Xuan H, Yin J, Wang L, Wang C, Xu X, et al. Triglyceride glucose index increases significantly risk of hypertension development in chinese individuals aged ≥45 years old: analysis from the China health and retirement longitudinal study. J Multidiscip Healthc. (2023) 16:63–73. doi: 10.2147/JMDH.S391905
11. Gao Q, Lin Y, Xu R, Luo F, Chen R, Li P, et al. Positive association of triglyceride-glucose index with new-onset hypertension among adults: a national cohort study in China. Cardiovasc Diabetol. (2023) 22:58. doi: 10.1186/s12933-023-01795-7
12. Zhao Y, Yang X, Wu Y, Huang H, Hu F, Zhang M, et al. Association of triglyceride-glucose index and its 6-year change with risk of hypertension: A prospective cohort study. Nutr Metab Cardiovasc Dis. (2023) 33:568–76. doi: 10.1016/j.numecd.2022.12.001
13. Sánchez-Íñigo L, Navarro-González D, Pastrana-Delgado J, Fernández-Montero A, and Martínez JA. Association of triglycerides and new lipid markers with the incidence of hypertension in a Spanish cohort. J Hypertens. (2016) 34:1257–65. doi: 10.1097/HJH.0000000000000941
14. Lee JH, Heo S-J, and Kwon Y-J. Sex-specific comparison between triglyceride glucose index and modified triglyceride glucose indices to predict new-onset hypertension in middle-aged and older adults. J Am Heart Assoc. (2023) 12:e030022. doi: 10.1161/JAHA.123.030022
15. Zhang Y, Zhang W, and Liu L. Comments on 2018 ESC/ESH hypertension guidelines: chinese perspective. Circ Res. (2019) 124:978–80. doi: 10.1161/CIRCRESAHA.119.314997
16. Xu M, Xu K, Lin W, Sun R, Yan S, Chen X, et al. Sex-specific differences in the relationship between fasting plasma glucose and carotid plaque in a cardiovascular high-risk population: a cross-sectional study. Front Endocrinol (Lausanne). (2025) 16:1478640. doi: 10.3389/fendo.2025.1478640
17. Li W, Yi G, Chen Z, Wu J, Lu Z, Liang J, et al. Association of occupational noise exposure, bilateral hearing loss with hypertension among Chinese workers. J Hypertens. (2021) 39:643–50. doi: 10.1097/HJH.0000000000002696
18. Vandenbroucke JP, Ev E, DG A, PC G, CD M, SJ P, et al. Strengthening the reporting of observational studies in epidemiology (STROBE): explanation and elaboration. Вопросы Современной Педиатрии. (2022) 21:173–208. doi: 10.1371/journal.pmed.0040297
19. Garzotto M, Beer TM, Hudson RG, Peters L, Hsieh Y-C, Barrera E, et al. Improved detection of prostate cancer using classification and regression tree analysis. J Clin Oncol. (2005) 23:4322–9. doi: 10.1200/JCO.2005.11.136
20. Zheng R and Mao Y. Triglyceride and glucose (TyG) index as a predictor of incident hypertension: a 9-year longitudinal population-based study. Lipids Health Dis. (2017) 16:175. doi: 10.1186/s12944-017-0562-y
21. Khoo JK, Low S, Irwan B, Tang JI, Sum CF, Subramaniam T, et al. The role of triglyceride-glucose index in the prediction of the development of hypertension - findings from a community cohort in Singapore. J ASEAN Fed Endocr Soc. (2023) 38:62–7. doi: 10.15605/jafes.038.01.09
22. Gong Y, Han T, Chen W, Dib HH, Yang G, Zhuang R, et al. Prevalence of anxiety and depressive symptoms and related risk factors among physicians in China: a cross-sectional study. PloS One. (2014) 9:e103242. doi: 10.1371/journal.pone.0103242
23. Tsou M-T, Pai T-P, Chiang T-M, Huang W-H, Lin H-M, and Lee S-C. Burnout and metabolic syndrome among different departments of medical center nurses in Taiwan-Cross-sectional study and biomarker research. J Occup Health. (2021) 63:e12188. doi: 10.1002/1348-9585.12188
24. Sooriyaarachchi P, Jayawardena R, Pavey T, and King NA. Shift work and the risk for metabolic syndrome among healthcare workers: A systematic review and meta-analysis. Obes Rev. (2022) 23:e13489. doi: 10.1111/obr.13489
25. Artazcoz L, Borrell C, Cortès I, Escribà-Agüir V, and Cascant L. Occupational epidemiology and work related inequalities in health: a gender perspective for two complementary approaches to work and health research. J Epidemiol Community Health. (2007) 61 Suppl 2::ii39–ii45. doi: 10.1136/jech.2007.059774
26. Nandhini ST. Association of triglyceride–glucose index (TyG index) with hbA1c and insulin resistance in type 2 diabetes mellitus. Maedica – A J Clin Med. (2021) 16:375–81. doi: 10.26574/maedica.2021.16.3.375
27. Karaca Ü, Schram MT, Houben AJHM, Muris DMJ, and Stehouwer CDA. Microvascular dysfunction as a link between obesity, insulin resistance and hypertension. Diabetes Res Clin Pract. (2014) 103:382–7. doi: 10.1016/j.diabres.2013.12.012
28. MRd S, DM V, IS A, MJ O, Linhares D, Nevès N, et al. Interplay between sympathetic nervous system and inflammation in aseptic loosening of hip joint replacement. Sci Rep. (2018) 8:16044. doi: 10.1038/s41598-018-33360-8
29. Pöyhönen-Alho M, Viitasalo M, Nicholls MG, Lindström B, Väänänen H, and Kaaja R. Imbalance of the autonomic nervous system at Night in women with gestational diabetes. Diabetic Med. (2010) 27:988–94. doi: 10.1111/j.1464-5491.2010.03062.x
30. Bonomini F, Rodella LF, and Rezzani R. Metabolic syndrome, aging and involvement of oxidative stress. Aging Disease. (2015) 6:109. doi: 10.14336/AD.2014.0305
31. Barros RPA and Gustafsson J. Estrogen receptors and the metabolic network. Cell Metab. (2011) 14:289–99. doi: 10.1016/j.cmet.2011.08.005
32. Zhu L, Martinez MN, Emfinger CH, Palmisano BT, and Stafford JM. Estrogen signaling prevents diet-induced hepatic insulin resistance in male mice with obesity. Am J Physiol Endocrinol Metab. (2014) 306:E1188–E97. doi: 10.1152/ajpendo.00579.2013
33. Colafella KMM and Denton KM. Sex-specific differences in hypertension and associated cardiovascular disease. Nat Rev Nephrol. (2018) 14:185–201. doi: 10.1038/nrneph.2017.189
34. Young BE, Kissell CE, Vranish JR, Stephens BY, Holwerda SW, and Fadel PJ. Sex differences in sympathetic transduction in black and white adults: implications for racial disparities in hypertension and cardiovascular disease risk. Am J Physiol Heart Circ Physiol. (2024) 327:H672–H80. doi: 10.1152/ajpheart.00337.2024
35. Chambliss KL and Shaul PW. Estrogen modulation of endothelial nitric oxide synthase. Endocr Rev. (2002) 23:665–86. doi: 10.1210/er.2001-0045
36. Straub RH. The complex role of estrogens in inflammation. Endocr Rev. (2007) 28:521–74. doi: 10.1210/er.2007-0001
Keywords: TyG index, new onset hypertension, sex differences, insulin resistance, cohort study
Citation: Sun R, Cai J, Yan S, Qian J, Fu C and Lin Y (2025) Sex-specific associations between the triglyceride-glucose index and new-onset hypertension in a hospital employee cohort: evidence from longitudinal annual health examinations. Front. Endocrinol. 16:1636890. doi: 10.3389/fendo.2025.1636890
Received: 28 May 2025; Accepted: 22 July 2025;
Published: 08 August 2025.
Edited by:
Ramoji Kosuru, Versiti Blood Research Institute, United StatesReviewed by:
Yuansong Zhuang, Chinese Academy of Medical Sciences and Peking Union Medical College, ChinaRadha Vaddavalli, The Ohio State University, United States
Moses Banyeh, University for Development Studies, Ghana
Copyright © 2025 Sun, Cai, Yan, Qian, Fu and Lin. This is an open-access article distributed under the terms of the Creative Commons Attribution License (CC BY). The use, distribution or reproduction in other forums is permitted, provided the original author(s) and the copyright owner(s) are credited and that the original publication in this journal is cited, in accordance with accepted academic practice. No use, distribution or reproduction is permitted which does not comply with these terms.
*Correspondence: Yuzhan Lin, MTAxNjA5OTA0N0BxcS5jb20=; Cheng Fu, ZnVjaGVuZzk0MDRAMTYzLmNvbQ==
†These authors have contributed equally to this work