 Pei Liu1†
 Yan Peng
- 1School of Clinical Medicine, Shandong Second Medical University, Weifang, Shandong, China
- 2Department of Endocrinology, Linyi People’s Hospital Affiliated to Shandong Second Medical University, Linyi, Shandong, China
Introduction: Hyperuricemia (HUA), an important health concern, is closely associated with insulin sensitivity. The natural log transformation of the glucose disposal rate (loge GDR) is a new model of insulin sensitivity in patients with type 2 diabetes mellitus (T2DM). The association between HUA and insulin resistance has been demonstrated by other insulin resistance indices. However, the correlation between loge GDR and HUA has not been explored. This study explored the interaction between loge GDR and HUA in patients with T2DM.
Methods: This study involved 2,352 patients with T2DM. Biochemical and clinical data were collected. Morning blood samples were collected after an overnight fast for serum uric acid measurement. All the parameters required for loge GDR calculation, including triglycerides, γ-glutamyl transferase, urinary albumin-to-creatinine ratio, and body mass index, were also collected. The correlation between the loge GDR and HUA was analyzed.
Results: Patients with HUA had lower loge GDR values than those without (P< 0.001). HUA prevalence decreased significantly with increasing loge GDR quartiles (P< 0.001). Multivariable regression analysis revealed that loge GDR was independently associated with HUA (odds ratio: 0.279, 95% confidence interval: 0.170–0.459). Loge GDR’s area under the receiver operating characteristic curve (0.706, 95%CI = 0.664-0.747) was superior to other indices.
Discussion: Loge GDR correlates strongly with HUA and demonstrates significant HUA predictive value in patients with T2DM.
1 Introduction
Uric acid is synthesized mainly in the liver, intestines, and vascular endothelium as the end product of an exogenous pool of purines, and endogenously from damaged, dying, and dead cells, whereby nucleic acids, adenine, and guanine are degraded into uric acid (1). Hyperuricemia (HUA), a metabolic syndrome (MetS) caused by disrupted purine metabolism (2), is characterized by a uric acid level of >420 µmol/L in men and >360 µmol/L in women (3). HUA is also an independent risk factor for the development of obesity, chronic kidney disease, hypertension, type 2 diabetes, dyslipidemia, coronary heart disease, and stroke (4). Numerous studies have shown that insulin resistance (IR) has a close physiological and pathological association with HUA (5). IR may contribute to HUA (6), and reducing IR may reduce serum uric acid (SUA) levels and the risk of gout (7, 8). HUA can interfere with insulin signaling and decrease endothelial nitric oxide availability (9), which is considered the primary factor that couples endothelial dysfunction with IR (10). An animal experimental study in Japan found that insulin can promote uric acid reabsorption through urate transporter 1 and ATP-binding cassette subfamily G member 2 (11). Furthermore, HUA and insulin sensitivity are associated with MetS. People with MetS may experience HUA because of IR, fatty liver, and dyslipidemia (12, 13).
However, IR is clinically challenging to identify. Because of its high cost and technical complexity, the hyperinsulinemic euglycemic clamp, which is considered the gold standard for IR identification (14), is not routinely employed in clinical practice. Therefore, many alternative IR indicators based on anthropometric and biochemical parameters have been proposed. Ciardullo et al. recently proposed the natural log transformation of the glucose disposal rate (loge GDR) as an innovative model of IS prediction in individuals with type 2 diabetes mellitus (T2DM). Loge GDR includes common clinical parameters: triglycerides (TG), urinary albumin-to-creatinine ratio (UACR), γ-glutamyl transferase (GGT), and body mass index (BMI), which reflect lipid metabolism, renal function, hepatic function, and body weight-related metabolic risk. They are critical components of HUA pathogenesis and key biomarkers of MetS. MetS and IR are closely associated with HUA. Therefore, as a comprehensive surrogate IS index, we hypothesize that loge GDR may be strongly associated with HUA. Moreover, no studies have confirmed the association between loge GDR and HUA. So this study explored the interaction between loge GDR and HUA in patients with T2DM. This study aimed to evaluate whether loge GDR is independently associated with hyperuricemia in patients with T2DM and to compare its predictive performance with other insulin resistance indices.
2 Materials and methods
Our study involved inpatients with T2DM (age: 18–87 years) at the Department of Endocrinology, Linyi People’s Hospital, from January 2020 to March 2023. Exclusion criteria: (1) incomplete basic clinical data or unclear medical history and (2) comorbidities, including severe infections involving other systems, malignancy, or major organ failure. The HUA group had 336 cases (uric acid: >420 and >360 µmol/L in men and women, respectively), and the non-HUA group had 2016 cases.
Moreover, our analysis included other commonly used indicators of IR indices as covariates, including homeostatic model assessment of insulin resistance (HOMA-IR), triglyceride glucose index (TyG index), triglyceride glucose-body mass index (TyG-BMI), triglyceride/high-density cholesterol-lipoprotein ratio (TG/HDL-c ratio), triglyceride-glucose and gamma-glutamyl transferase (TYG-GGT), triglyceride-glucose-alanine aminotransferase (TyG–ALT), the single-point insulin sensitivity estimator (SPISE), metabolic score for IR (METS-IR), improved triglyceride glucose index (TyGIS), and estimated glucose disposal rate (eGDRBMI). This is because literature indicates a strong positive connection between the other commonly used indicators of IR and HUA among adults. Consequently, we incorporated these markers into our analysis.
2.1 Anthropometric and biochemical measurements
We recorded patient demographics and clinical characteristics, including age, sex, duration of diabetes, height, weight, smoking habit, and alcohol consumption. Blood pressure was measured in duplicate using a validated electronic sphygmomanometer (recording systolic and diastolic blood pressure [SBP/DBP]) after resting in a seated position for ≥5 min in a quiet, temperature-controlled environment. Fasting blood samples were collected in the morning and analyzed for TG, total cholesterol (TC), high-density lipoprotein-cholesterol (HDL-c), low-density lipoprotein-cholesterol (LDL-c), aspartate aminotransferase (AST), alanine aminotransferase (ALT), GGT, fasting blood glucose (FBG), glycosylated hemoglobin (HbA1c, high-performance liquid chromatography), uric acid, and hemoglobin (Hb) using a biochemical autoanalyzer (Cobas c 702, Roche, Germany). UACR was measured using an autoanalyzer (Beckman Coulter AU5821). Fasting serum insulin (FINS) was measured using direct chemiluminescence on a fully automated system (Aptio Automation, Siemens, USA). Bioelectrical impedance analysis (Omron DUALSCAN HDS-2000, Kyoto, Japan) was used to assess visceral fat area (VFA) and subcutaneous fat area (SFA).
1. Parameter calculations (15).
2. (16).
3. (17).
4. (18).
5. (19).
6. (20).
7. (21).
8. (22).
9. (23).
10. (24).
11. (25).
12. (26).
13. (27).
2.2 Statistical analyses
Statistical analyses were conducted using SPSS version 26.0 (SPSS Inc., Chicago, IL, USA). Normally distributed continuous variables, non-normally distributed data, and categorical variables were presented as mean ± standard deviation (SD), median (interquartile range), and frequencies (%). Differences between two groups of normally or non-normally distributed data were compared using independent sample t-tests or Mann–Whitney U tests, respectively. Differences between four or more groups were compared using one-way analysis of variance (ANOVA) for normally distributed data or Kruskal–Wallis tests for non-normally distributed data, with post-hoc multiple comparisons being performed using Student–Newman–Keuls tests where applicable. Chi-square tests were used for all categorical variable comparisons. Logistic regression analysis was used to assess independent HUA correlates. Receiver operating characteristic (ROC) curve analysis was used to evaluate the ability of loge GDR to predict HUA. All statistical tests were two-tailed, with p< 0.05 indicating statistically significant differences.
3 Results
3.1 Baseline clinical and biochemical characteristics
The patients’ clinical and biochemical profiles are presented in Table 1. This study enrolled 2,352 patients (mean age: 57.3 ± 13.2 years). Sex was not significantly different between the two groups (men: 41.3% vs. 41.1%, p > 0.05). Compared with the non-HUA group (n=2,016), age, HDL-c, eGFR, Hb, SPISE, TyGIS, eGDRBMI, and loge GDR were significantly lower in the HUA group (n=336), but BMI, VFA, SFA, TG, FBG, FINS, ALT, AST, GGT, UACR, TyG index, TyG-BMI, TyG-GGT, TyG-ALT, TG/HDL-c ratio, HOMA-IR, and METS-IR were significantly higher (all p< 0.05). Smoking (%), drinking (%), SBP, DBP, TC, LDL-C, duration of diabetes, and HbA1c levels were not significantly different between the two groups (all p > 0.05).
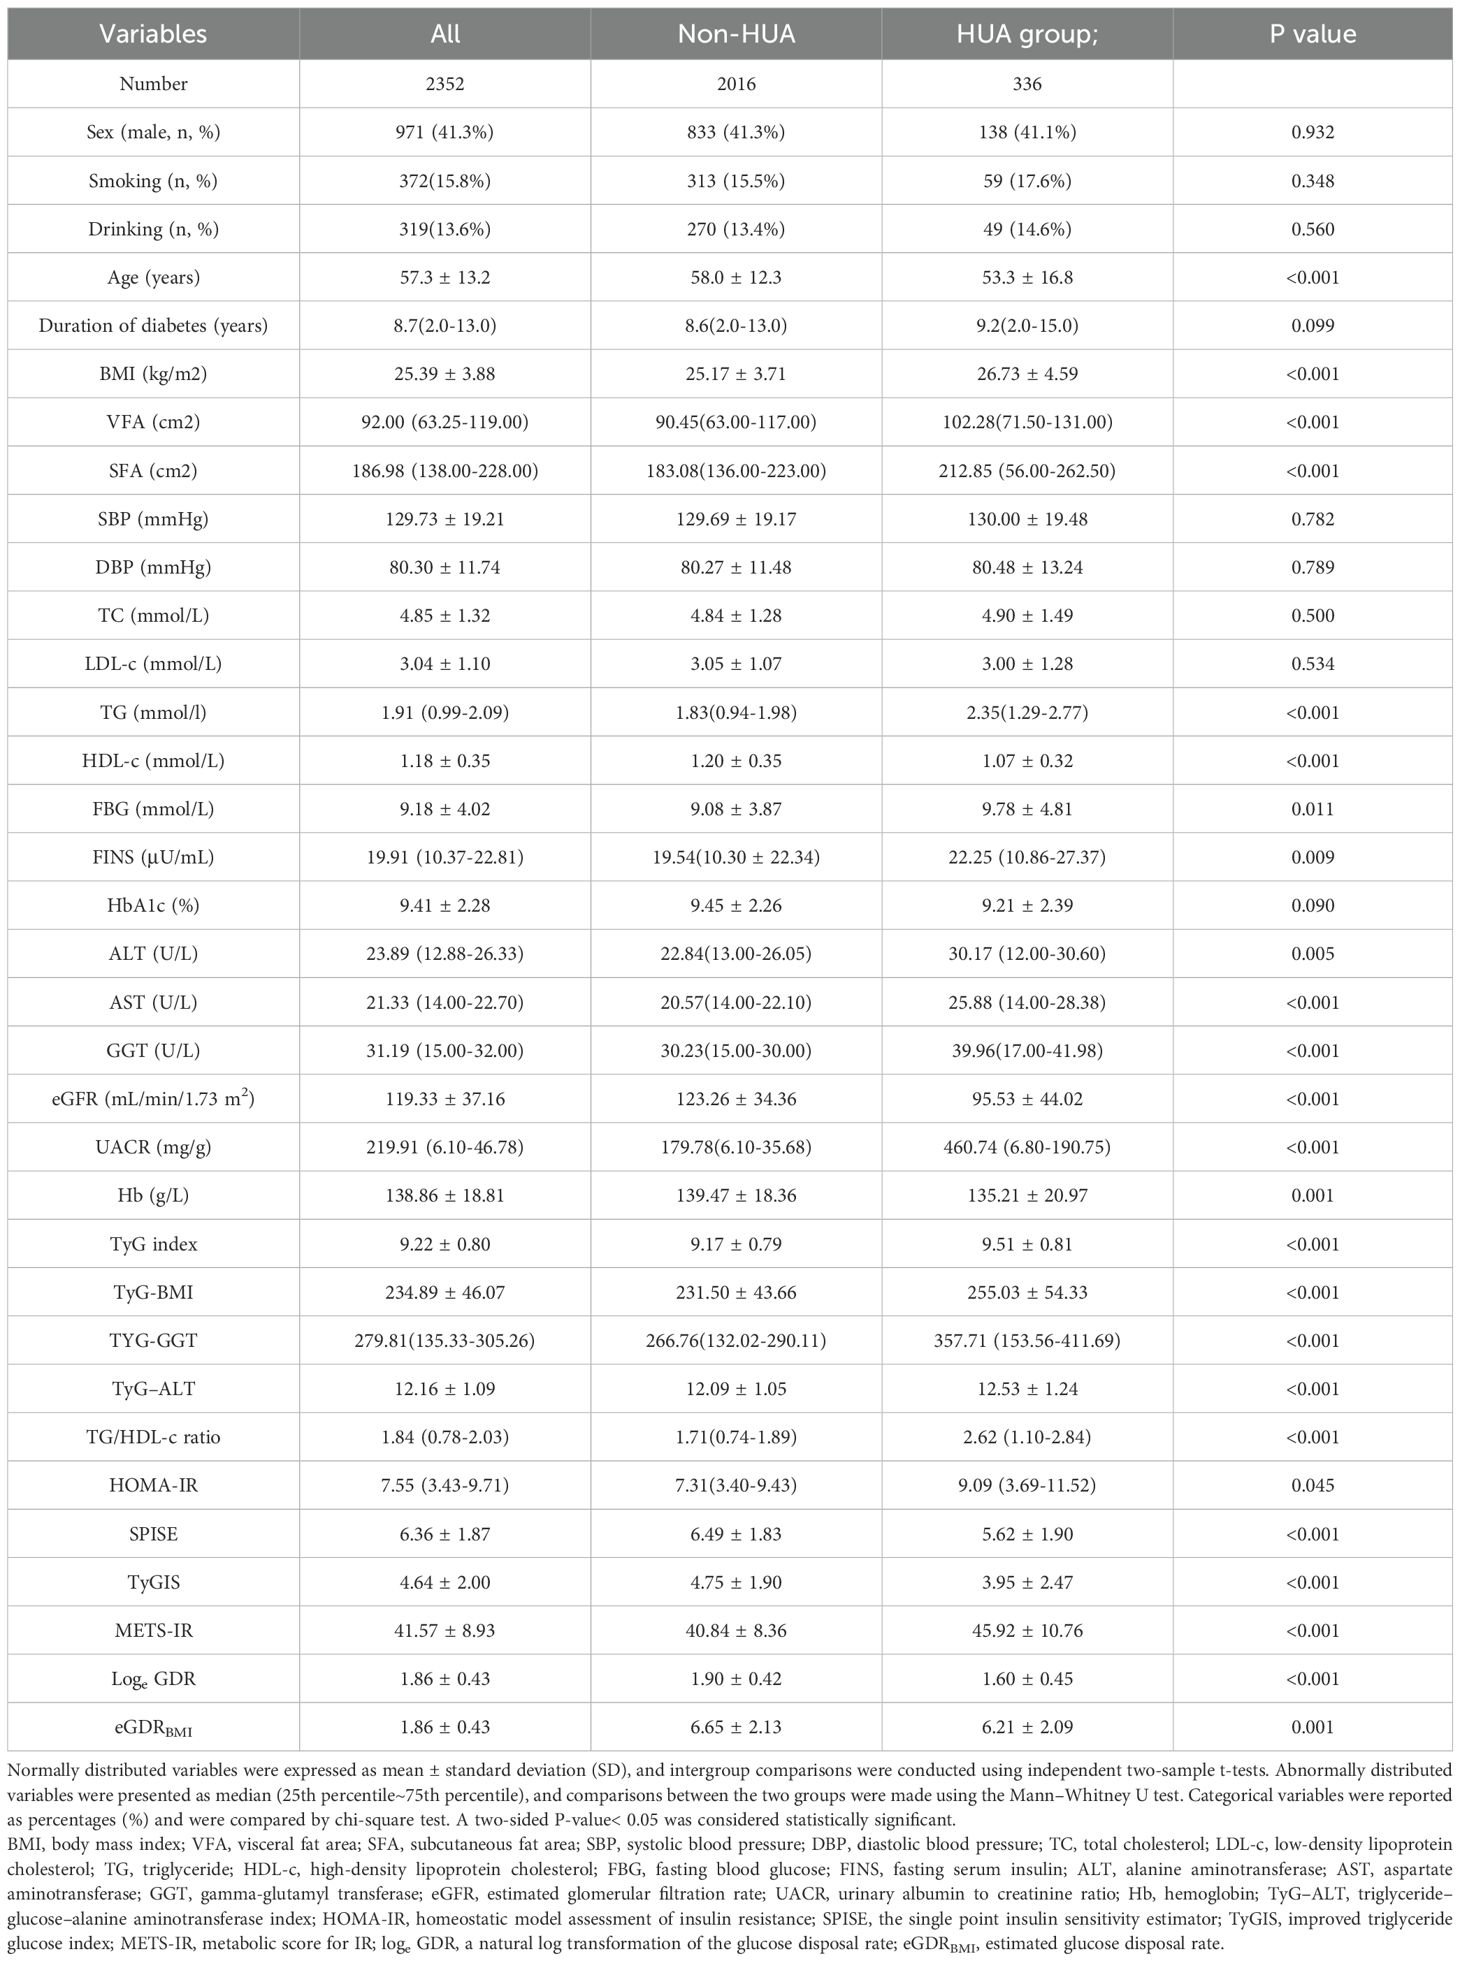
Table 1. Clinical and biochemical characteristics by presence of HUA.
Participants were stratified into four groups based on loge GDR quartiles (Q1–Q4; Table 2). The levels of HDL-c, eGFR, SPISE, and eGDRBMI increased with increasing loge GDR quartiles (all p< 0.001), whereas sex (male, %), smoking (%), drinking (%), age, BMI, VFA, SFA, SBP, DBP, TC, LDL-c, TG, FBG, FINS, HbA1c, ALT, AST, GGT, uric acid, UACR, Hb, TyG index, TyG-BMI, TyG-GGT, TyG-ALT, TG/HDL-c ratio, HOMA-IR, TyGIS, METS-IR, and HUA decreased significantly (all p< 0.001). The duration of diabetes did not differ between the four groups (p = 0.073).We further analyzed the relationship between the incidence of HUA and quartile groups of loge GDR (Figure 1). The results demonstrated a significant inverse trend, with HUA incidence showing a progressive decline across increasing quartiles of loge GDR (P for trend<0.001).
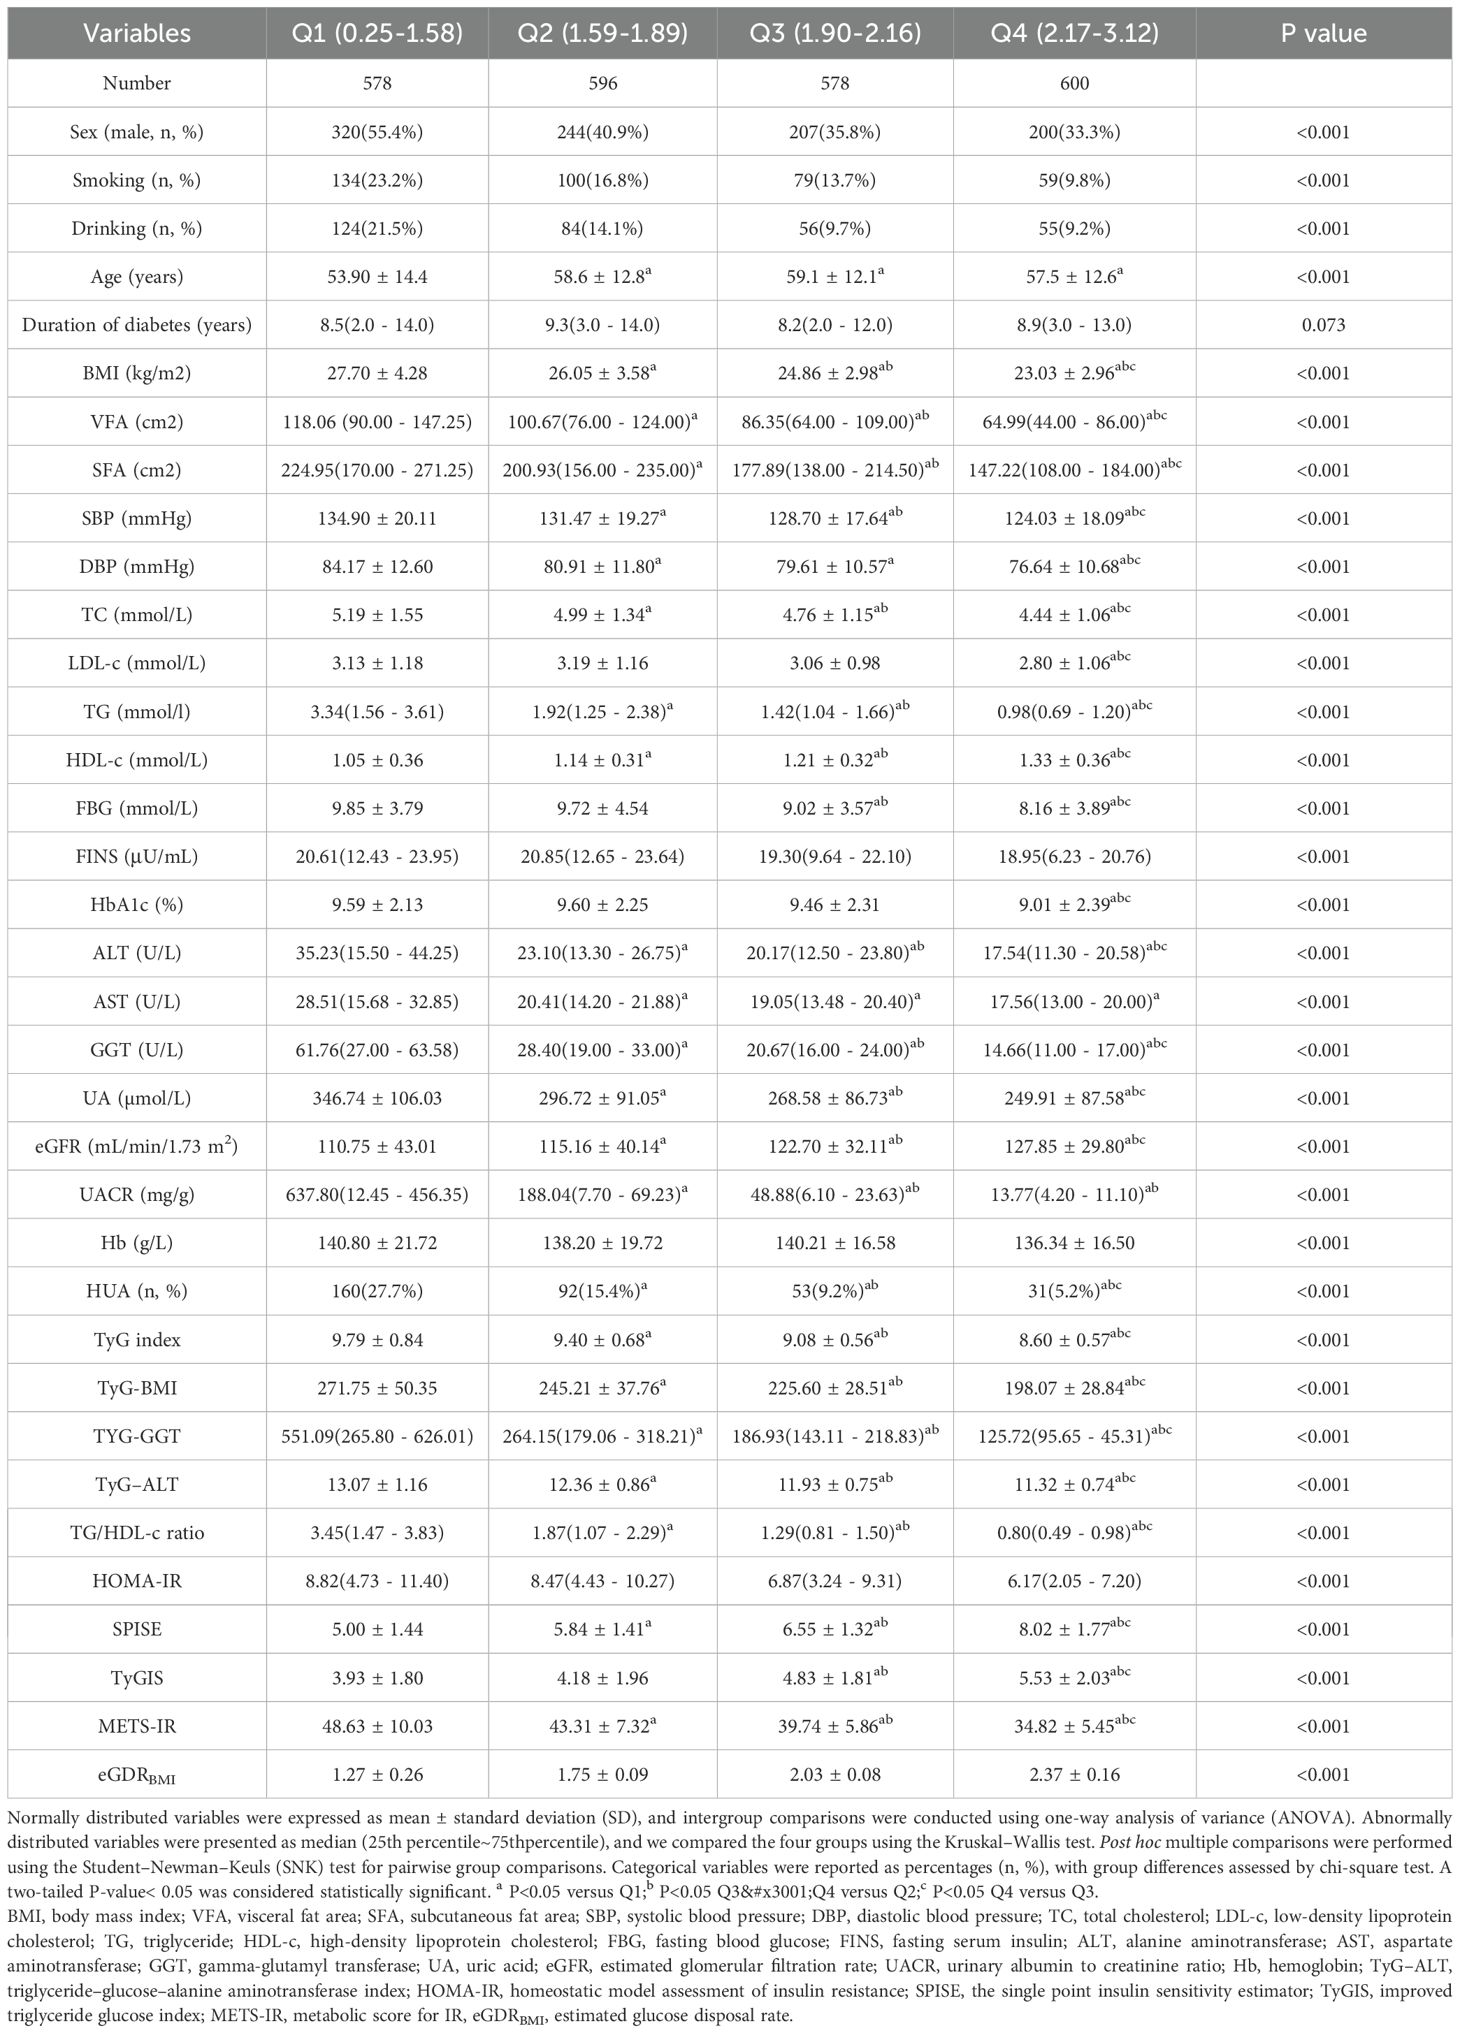
Table 2. Baseline characteristics across quartiles of Loge GDR.
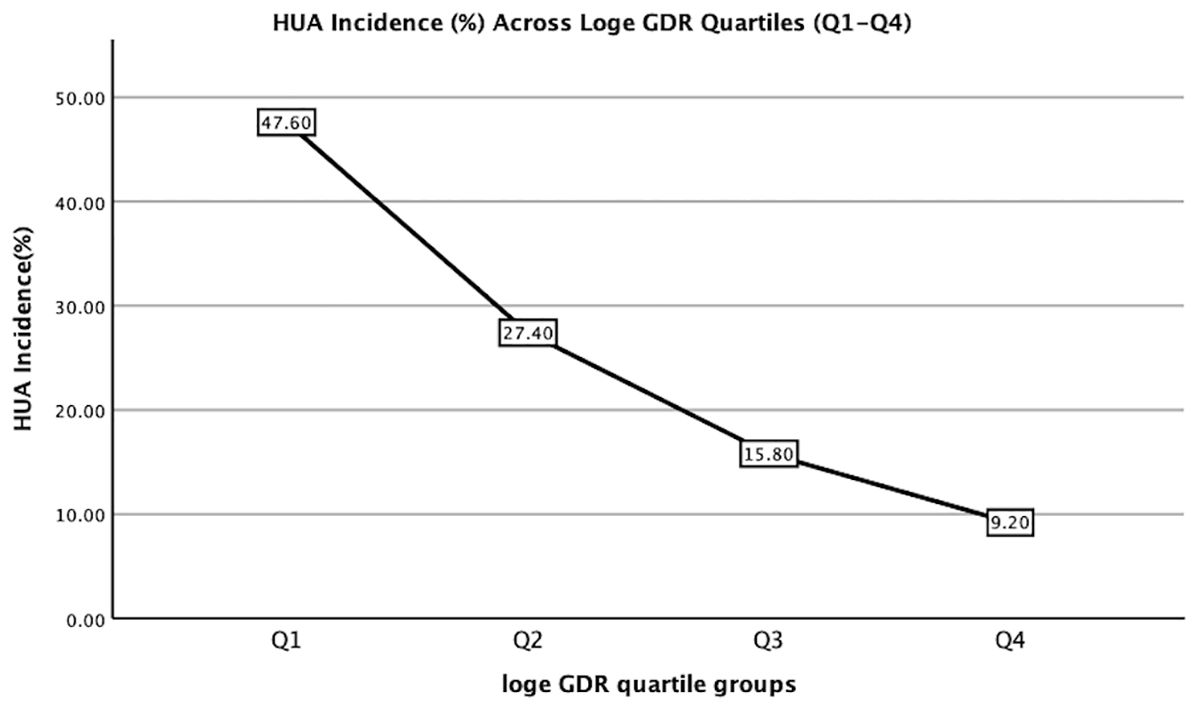
Figure 1. Hyperuricemia incidence (%) across Loge GDR quartiles (Q1:<1.59; Q2: 1.59–1.90; Q3: 1.90–2.17; Q4: ≥2.17). Trend test: P<0.001.
3.2 Univariate regression analysis
Univariate logistic regression analysis was used to identify factors that may be associated with HUA (Table 3). This analysis revealed that BMI, VFA, SFA, TG, FBG, AST, ALT, GGT, UACR, TyG index, TyG-BMI, TyG-GGT, TyG-ALT, TG/HDL-c ratio, HOMA-IR, and METS-IR correlated positively with HUA, whereas age, HDL-c, eGFR, Hb, SPISE, TyGIS, eGDRBMI, and loge GDR were negatively correlated (all p< 0.05). Sex (male, %), smoking (%), drinking (%), duration of diabetes, SBP, DBP, TC, LDL-c, FINS, and HbAIc did not correlate with HUA (all p > 0.05).
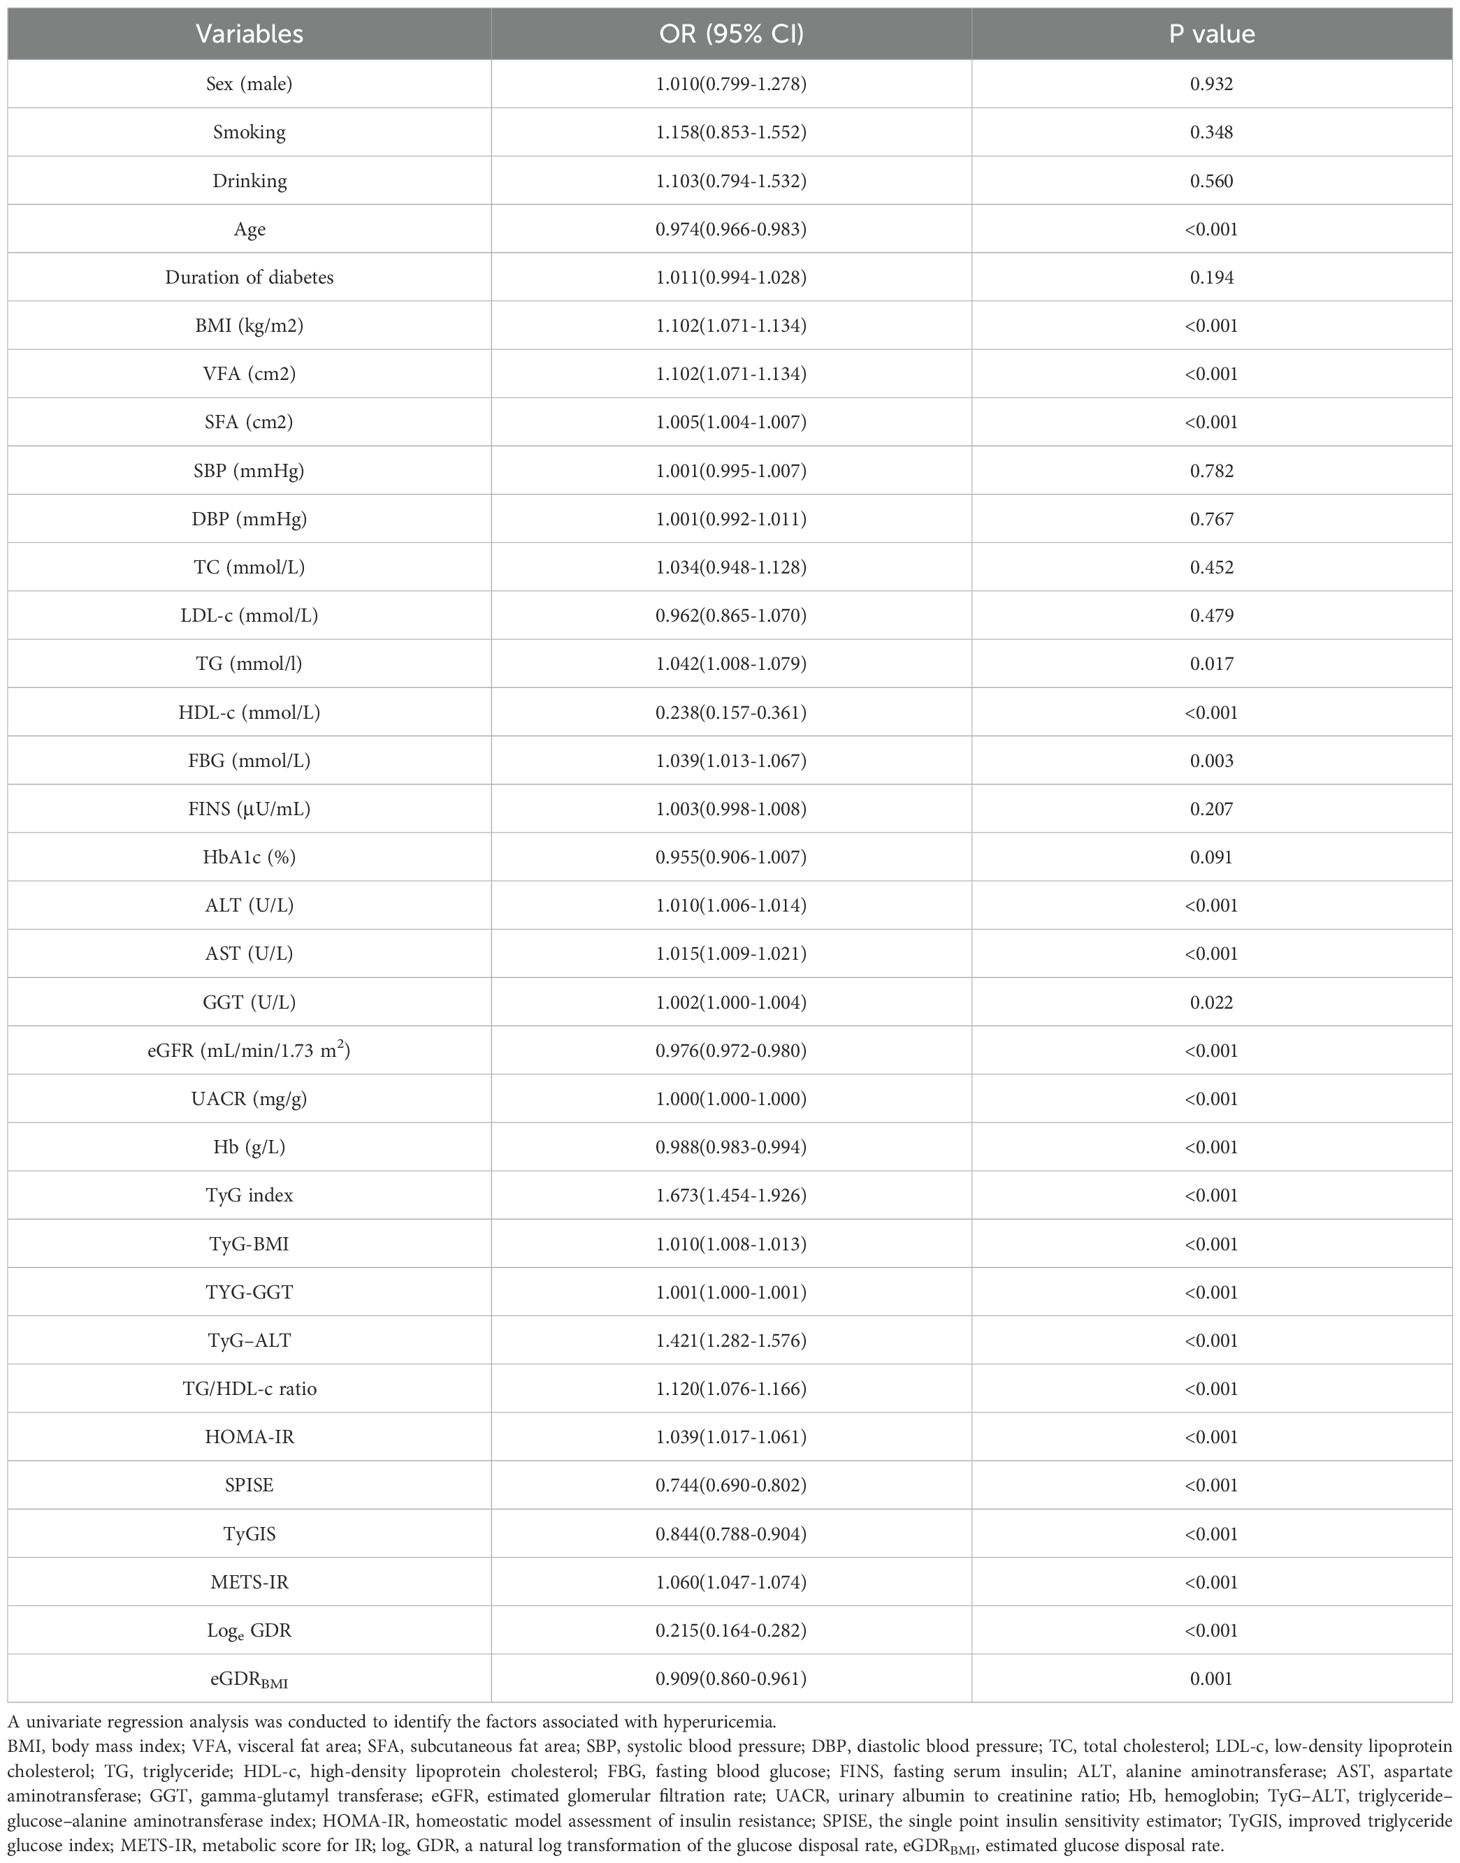
Table 3. Univariate regression analysis for HUA.
3.3 Multivariable regression analysis
Multivariable regression analysis of independent association between age, BMI, VFA, SFA, TG, HDL-c, FBG, FINS, ALT, AST, GGT, eGFR, UACR, Hb, TyG index, TyG-BMI, TYG-GGT, TyG-ALT, TG/HDL-c ratio, HOMA-IR, SPISE, TyGIS, METS-IR, eGDRBMI, and loge GDR revealed that loge GDR (odds ratio [OR]: 0.279, 95% confidence interval [CI]: 0.170–0.459), age (OR: 0.946, 95% CI: 0.930–0.963), AST (OR: 1.013, 95% CI: 1.002–1.023), UACR (OR: 1.000, 95% CI: 1.000–1.000), Hb (OR: 0.981, 95% CI: 0.970–0.992), and eGFR (OR: 0.971, 95% CI: 0.964–0.979) were independently associated with HUA (Table 4).
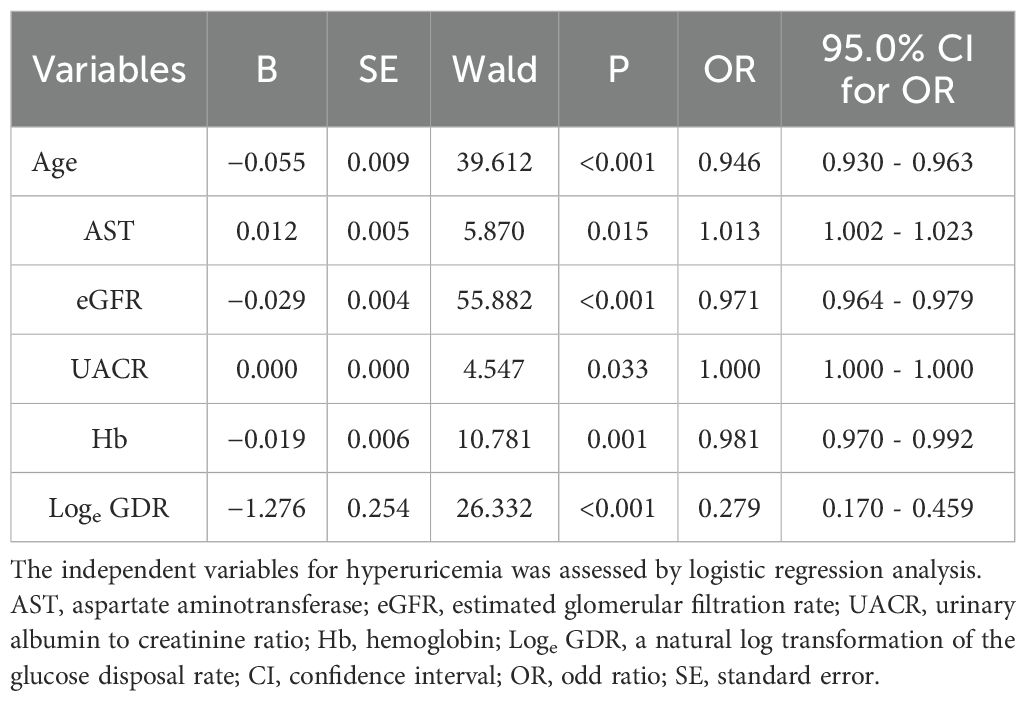
Table 4. The independent variables for HUA.
3.4 Area under the ROC curve analysis
A comparison of the predictive performance of loge GDR with its components (BMI, GGT, UACR, and TG), the aforementioned IR indices (TG/HDL-c ratio, TyG index, TyG-GGT, TyG-BMI, TyG-ALT, HOMA-IR, SPISE, TyGIS, METS-IR, and eGDRBMI), HUA-related common markers (TC, HDL-c, and LDL-c), and regression model variables (age, AST, eGFR, and Hb) revealed that Loge GDR had a superior predictive ability (AUC = 0.706, Table 5). Furthermore, we performed pairwise comparisons of the areas under the ROC curves using the paired-sample design feature in ROC analysis within SPSS version 26. Differential ROC analysis showed that loge GDR was higher than the TG/HDL-c ratio, TG, SPISE, METS-IR, TyG index, TyG-BMI, HDL-c, TyG-ALT, TyG-GGT, UACR, GGT, BMI, TyGIS, age, AST, Hb, HOMA-IR, TC, LDL-c, and eGDRBMI (all p< 0.05). However, the difference between loge GDR and eGFR was not significant (p = 0.936).
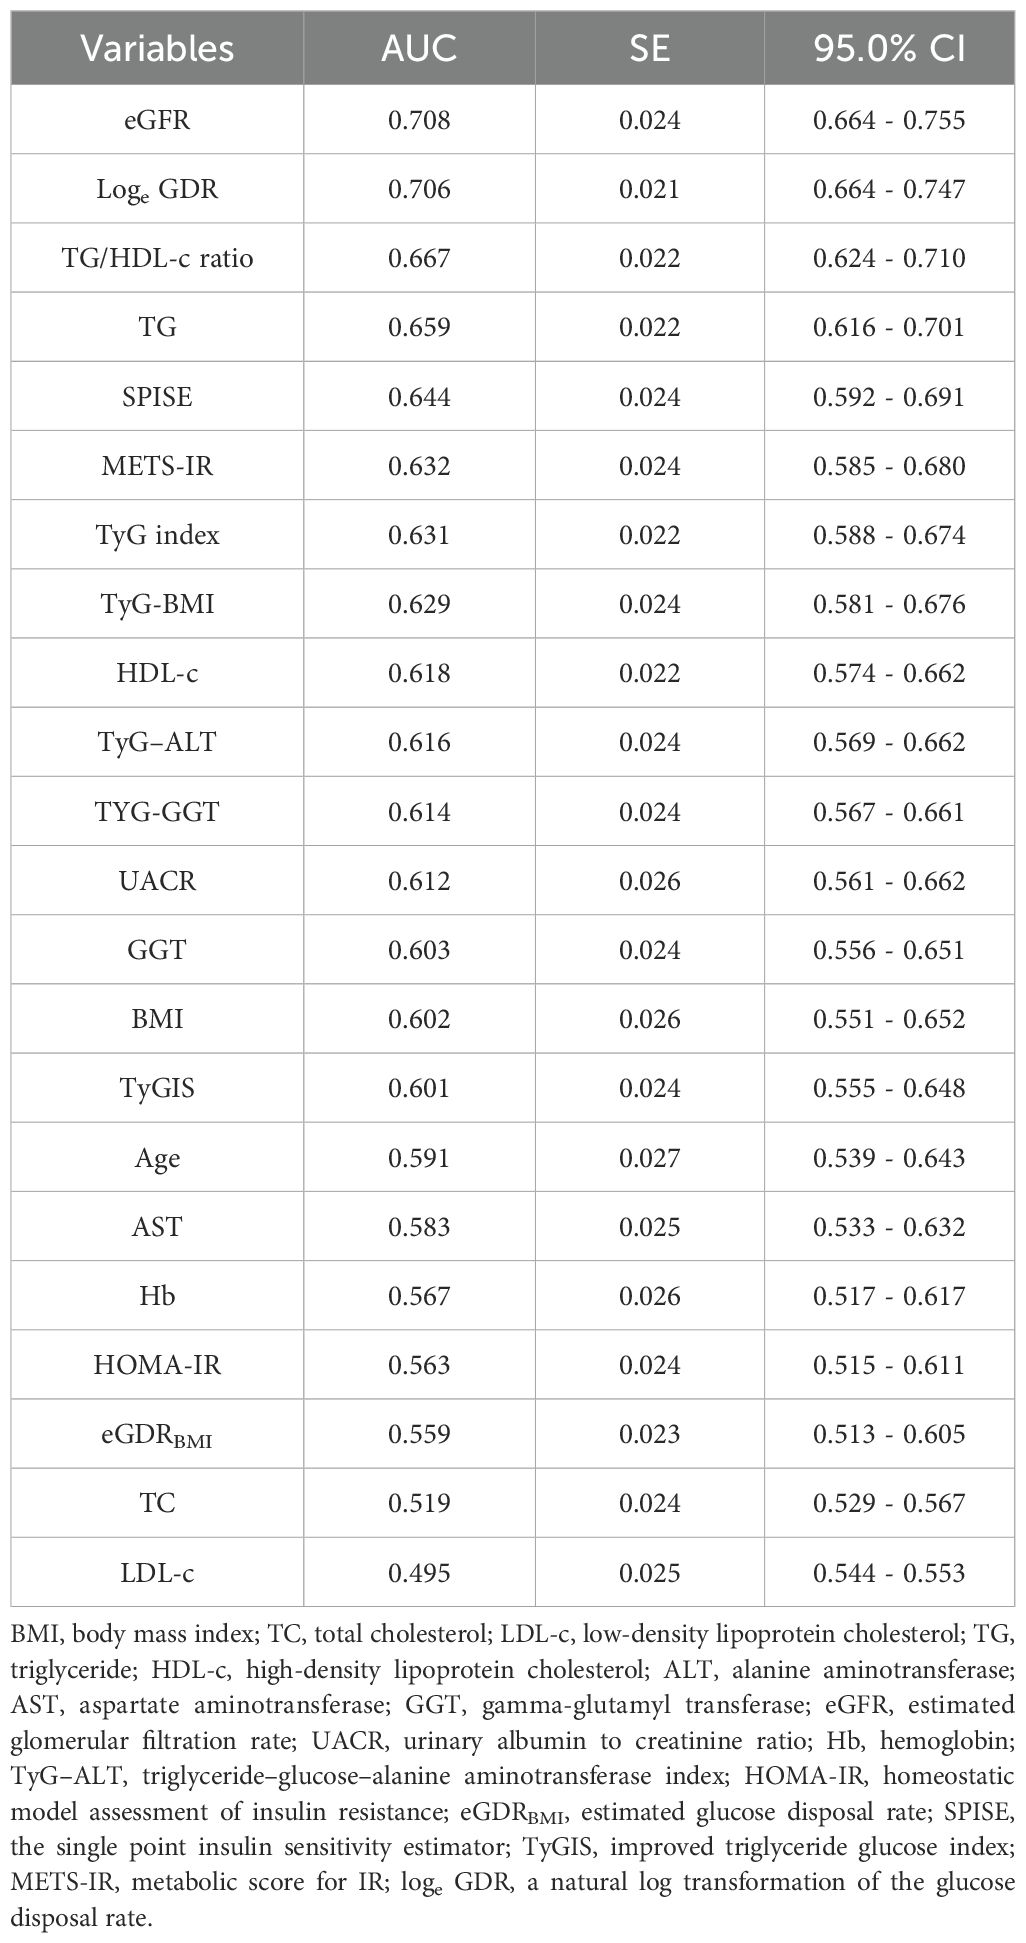
Table 5. Analysis of the areas under the ROC curves for predicting HUA.
3.5 Discussion
This cross-sectional study revealed a significant inverse correlation between loge GDR and HUA prevalence. Our study revealed a significant loge GDR decrease in the group with HUA, and HUA incidence declined progressively with increasing loge GDR quartiles. Multivariable-adjusted regression models confirmed loge GDR as an independent factor associated with HUA.
Our study revealed that loge GDR was significantly associated with the aforementioned IR indices, with these markers decreasing progressively with increasing loge GDR quartiles. Current research indicates a strong association between HUA and IR, with particularly prominent correlations observed with the triglyceride-glucose (TyG) index and TyG-BMI index (17). However, the correlation between loge GDR and HUA has not been previously investigated. Here, we demonstrate an independent association between loge GDR and HUA for the first time.
This study also incorporated other IR indices (TG/HDL-c ratio, TyG index, TyG-GGT, TyG-BMI, TyG-ALT, HOMA-IR, SPISE, TyGIS, METS-IR, and eGDRBMI) and common HUA-related markers (TC, HDL-c, and LDL-c) for comprehensive analysis. Only loge GDR remained in the regression model, demonstrating its status as an independent factor associated with HUA. Area under the ROC curve analysis showed that loge GDR outperformed other variables in HUA prediction in patients with T2DM. These results indicate that this composite index (loge GDR) has significantly superior discriminative ability for HUA.
However, the mechanistic relationship between loge GDR and HUA has not been elucidated. HUA is significantly associated with oxidative stress, MetS, and IR. HUA causes endothelial dysfunction via apoptosis, oxidative stress, and inflammation. However, it interferes with insulin signaling and decreases endothelial nitric oxide availability, resulting in endothelial IR (9), increased expression of urate transporter 1 (URAT1) and glucose transporter 9 (GLUT9), and glycolytic disturbances because of IR may be associated with HUA development in MetS (28). Loge GDR includes the following key metabolic parameters: BMI, GGT, UACR, and TG, which are closely associated with HUA, oxidative stress, and MetS. A growing number of studies have shown a correlation between SUA and hypertriglyceridemia (HTG) (29). Studies have demonstrated a strong positive correlation between SUA and HTG (30). HTG is a core diagnostic criterion for MetS (31). Moreover, apolipoprotein E has been implicated in SUA-induced HTG (32). Apolipoprotein E4 leaves HDL more readily, enhancing the clearance of remnants, whose cholesterol downregulates hepatic LDL receptor expression, thereby increasing plasma LDL levels (33). This process elevates TG via the abovementioned mechanism. Additionally, recent evidence indicates that BMI is an important confounding factor in uric acid and metabolic disease research (34). Increased baseline BMI is significantly associated with higher HUA risk (35), which is partly attributable to obesity-induced IR, which enhances uric acid reabsorption in the proximal renal tubules while reducing uric acid and sodium excretion, leading to HUA (36, 37). However, IR cases have also been reported in individuals with a low BMI and a highly inflammatory state because of mast cell activation associated with very high oxidative stress. Mast cells produce α-melanocyte-stimulating hormone(α-MSH), a hormone that stimulates cortisol production, thereby increasing blood sugar. This causes excessive insulin production and, consequently, IR. Furthermore, GGT is significantly associated with HUA. Oxidative stress and MetS are related to HUA; GGT levels are also associated with MetS and oxidative stress (38). GGT’s physiological role of counteracting oxidative stress by breaking down extracellular glutathione and making its component amino acids available to cells makes it a potential oxidative stress marker (39). Studies show that UACR is significantly associated with increased uric acid. Uric acid was an independent factor for a 1-year increase of UACR [coefficient 4.80 (95% CI: 0.40–9.33) (mg/g) per 1-mg/dL increase in uric acid, P = 0.033] (40). This is probably because HUA plays a pathogenic role in chronic kidney disease development and progression by inducing inflammation, endothelial dysfunction, and activation of the renin–angiotensin system (41, 42). Furthermore, uric acid may increase oxidative stress, leading to mitochondrial dysfunction, proinflammatory cytokine oversecretion, and vascular smooth muscle cell proliferation, leading to renal function impairment (28). Additionally, unlike conventional IR indices, loge GDR innovatively incorporates the UACR. Given the well-established association between UACR and HUA metabolism, combined with our demonstration that UACR is an independent risk factor for HUA, this might be the reason loge GDR exhibits superior HUA prediction. In summary, all stratified loge GDR subgroups demonstrate significant associations with key HUA metabolic pathways.
This study has limitations. Because of its cross-sectional design, it could establish an association between loge GDR and HUA but not a causal relationship. Second, because this study was limited to patients with T2DM, it had a relatively small sample size of HUA cases. Future large-scale prospective studies are needed to further elucidate the relationship between IR and HUA. Moreover, the pathophysiological mechanisms underlying the association between loge GDR and HUA require further investigation.
4 Conclusion
Loge GDR may be a superior HUA predictor and an effective HUA marker in patients with T2DM. However, the underlying mechanisms require further investigation.
Data availability statement
The raw data supporting the conclusions of this article will be made available by the authors, without undue reservation.
Ethics statement
The studies involving humans were approved by Science and Technology Ethics Committee, Linyi People’s Hospital. The studies were conducted in accordance with the local legislation and institutional requirements. The participants provided their written informed consent to participate in this study.
Author contributions
YP: Writing – review & editing, Investigation, Resources, Data curation. PL: Investigation, Data curation, Writing – original draft, Methodology. BJ: Investigation, Funding acquisition, Writing – review & editing, Data curation.
Funding
The author(s) declare financial support was received for the research and/or publication of this article. This study was supported by grants from the Postdoctoral Program of the Affiliated Hospital of Jining Medical University (JYFY322152).
Conflict of interest
The authors declare that the research was conducted in the absence of any commercial or financial relationships that could be construed as a potential conflict of interest.
Generative AI statement
The author(s) declare that no Generative AI was used in the creation of this manuscript.
Any alternative text (alt text) provided alongside figures in this article has been generated by Frontiers with the support of artificial intelligence and reasonable efforts have been made to ensure accuracy, including review by the authors wherever possible. If you identify any issues, please contact us.
Publisher’s note
All claims expressed in this article are solely those of the authors and do not necessarily represent those of their affiliated organizations, or those of the publisher, the editors and the reviewers. Any product that may be evaluated in this article, or claim that may be made by its manufacturer, is not guaranteed or endorsed by the publisher.
References
1. El Ridi R and Tallima H. Physiological functions and pathogenic potential of uric acid: A review. J Adv Res. (2017) 8:487–93. doi: 10.1016/j.jare.2017.03.003
2. Dalbeth N, Gosling AL, Gaffo A, and Abhishek A. Gout. Lancet. (2021) 397:1843–55. doi: 10.1016/S0140-6736(21)00569-9
3. Liu R, Han C, Wu D, Xia X, Gu J, Guan H, et al. Prevalence of hyperuricemia and gout in mainland China from 2000 to 2014: A systematic review and meta-analysis. BioMed Res Int. (2015) 2015:762820. doi: 10.1155/2015/762820
4. Bardin T and Richette P. Impact of comorbidities on gout and hyperuricaemia: an update on prevalence and treatment options. BMC Med. (2017) 15:123. doi: 10.1186/s12916-017-0890-9
5. Li C, Hsieh MC, and Chang SJ. Metabolic syndrome, diabetes, and hyperuricemia. Curr Opin Rheumatol. (2013) 25:210–6. doi: 10.1097/BOR.0b013e32835d951e
6. Liu S, Zhou Z, Wu M, Zhang H, and Xiao Y. Association between the triglyceride glucose index and hyperuricemia in patients with primary hypertension: A cross-sectional study. Int J Endocrinol. (2023) 2023:5582306. doi: 10.1155/2023/5582306
7. McCormick N, O'Connor MJ, Yokose C, Merriman TR, Mount DB, Leong A, et al. Assessing the causal relationships between insulin resistance and hyperuricemia and gout using bidirectional mendelian randomization. Arthritis Rheumatol. (2021) 73:2096–104. doi: 10.1002/art.v73.11
8. Banik SD, Avila-Nava A, Lugo R, Chim Aké R, and Gutiérrez Solis AL. Association between low-grade inflammation and hyperuricemia in adults with metabolic syndrome in yucatán, méxico. Can J Diabetes. (2022) 46:369–74. doi: 10.1016/j.jcjd.2021.11.010
9. Bahadoran Z, Mirmiran P, Kashfi K, and Ghasemi A. Hyperuricemia-induced endothelial insulin resistance: the nitric oxide connection. Pflugers Arch. (2022) 474:83–98. doi: 10.1007/s00424-021-02606-2
10. Cersosimo E and Defronzo RA. Insulin resistance and endothelial dysfunction: the road map to cardiovascular diseases. Diabetes Metab Res Rev. (2006) 22:423–36. doi: 10.1002/dmrr.v22:6
11. Toyoki D, Shibata S, Kuribayashi-Okuma E, Xu N, Ishizawa K, Hosoyamada M, et al. Insulin stimulates uric acid reabsorption via regulating urate transporter 1 and ATP-binding cassette subfamily G member 2. Am J Physiol Renal Physiol. (2017) 313:F826–f34. doi: 10.1152/ajprenal.00012.2017
12. Sun J, Sun M, Su Y, Li M, Ma S, Zhang Y, et al. Mediation effect of obesity on the association between triglyceride-glucose index and hyperuricemia in Chinese hypertension adults. J Clin Hypertens (Greenwich). (2022) 24:47–57. doi: 10.1111/jch.14405
13. Spatola L, Ferraro PM, Gambaro G, Badalamenti S, and Dauriz M. Metabolic syndrome and uric acid nephrolithiasis: insulin resistance in focus. Metabolism. (2018) 83:225–33. doi: 10.1016/j.metabol.2018.02.008
14. Defronzo RA, Tobin JD, and Andres R. Glucose clamp technique: a method for quantifying insulin secretion and resistance. Am J Physiol. (1979) 237:E214–23. doi: 10.1152/ajpendo.1979.237.3.E214
15. Younossi ZM, Golabi P, Price JK, Owrangi S, Gundu-Rao N, Satchi R, et al. The global epidemiology of nonalcoholic fatty liver disease and nonalcoholic steatohepatitis among patients with type 2 diabetes. Clin Gastroenterol Hepatol. (2024) 22:1999–2010.e8. doi: 10.1016/j.cgh.2024.03.006
16. Qiu L, Ren Y, Li J, Li M, Li W, Qin L, et al. Nonlinear association of triglyceride-glucose index with hyperuricemia in US adults: a cross-sectional study. Lipids Health Dis. (2024) 23:145. doi: 10.1186/s12944-024-02146-5
17. Gou R, Dou D, Tian M, Chang X, Zhao Y, Meng X, et al. Association between triglyceride glucose index and hyperuricemia: a new evidence from China and the United States. Front Endocrinol (Lausanne). (2024) 15:1403858. doi: 10.3389/fendo.2024.1403858
18. Jin L, Gu J, Zhang Z, Du CF, Xu FQ, Huang XK, et al. TyG-GGT is a reliable non-invasive predictor of advanced liver fibrosis in overweight or obese individuals. Obes Surg. (2024) 34:1333–42. doi: 10.1007/s11695-024-07139-y
19. Noh ES and Hwang IT. Triglyceride-glucose-alanine aminotransferase index: A noninvasive serum predictor for identifying the severity of pediatric nonalcoholic fatty liver disease. Med (Baltimore). (2024) 103:e38241. doi: 10.1097/MD.0000000000038241
20. Nur Zati Iwani AK, Jalaludin MY, Yahya A, Mansor F, Md Zain F, Hong JYH, et al. TG: HDL-C ratio as insulin resistance marker for metabolic syndrome in children with obesity. Front Endocrinol (Lausanne). (2022) 13:852290. doi: 10.3389/fendo.2022.852290
21. Tahapary DL, Pratisthita LB, Fitri NA, Marcella C, Wafa S, Kurniawan F, et al. Challenges in the diagnosis of insulin resistance: Focusing on the role of HOMA-IR and Tryglyceride/glucose index. Diabetes Metab Syndr. (2022) 16:102581. doi: 10.1016/j.dsx.2022.102581
22. Tantari G, Bassi M, Pistorio A, Minuto N, Napoli F, Piccolo G, et al. SPISE INDEX (Single point insulin sensitivity estimator): indicator of insulin resistance in children and adolescents with overweight and obesity. Front Endocrinol (Lausanne). (2024) 15:1439901. doi: 10.3389/fendo.2024.1439901
23. Salvatori B, Linder T, Eppel D, Morettini M, Burattini L, Göbl C, et al. TyGIS: improved triglyceride-glucose index for the assessment of insulin sensitivity during pregnancy. Cardiovasc Diabetol. (2022) 21:215. doi: 10.1186/s12933-022-01649-8
24. Bello-Chavolla OY, Almeda-Valdes P, Gomez-Velasco D, Viveros-Ruiz T, Cruz-Bautista I, Romo-Romo A, et al. METS-IR, a novel score to evaluate insulin sensitivity, is predictive of visceral adiposity and incident type 2 diabetes. Eur J Endocrinol. (2018) 178:533–44. doi: 10.1530/EJE-17-0883
25. An L, Yu Q, Chen L, Tang H, Liu Y, Yuan Q, et al. The association between the decline of eGFR and a reduction of hemoglobin A1c in type 2 diabetic patients. Front Endocrinol (Lausanne). (2021) 12:723720. doi: 10.3389/fendo.2021.723720
26. Ciardullo S, Dodesini AR, Lepore G, Corsi A, Scaranna C, Perseghin G, et al. Development of a new model of insulin sensitivity in patients with type 2 diabetes and association with mortality. J Clin Endocrinol Metab. (2024) 109:1308–17. doi: 10.1210/clinem/dgad682
27. Liu C, Zhao Q, Ma X, Cheng Y, Sun Y, Zhang D, et al. Prognostic value of estimated glucose disposal rate in patients with non-ST-segment elevation acute coronary syndromes undergoing percutaneous coronary intervention. Rev Cardiovasc Med. (2023) 24:2. doi: 10.31083/j.rcm2401002
28. Yanai H, Adachi H, Hakoshima M, and Katsuyama H. Molecular biological and clinical understanding of the pathophysiology and treatments of hyperuricemia and its association with metabolic syndrome, cardiovascular diseases and chronic kidney disease. Int J Mol Sci. (2021) 22(17):9221. doi: 10.3390/ijms22179221
29. Si SA, Chen MQ, and Zhang GJ. Association of serum uric acid with hypertriglyceridemia in children and adolescents: a cross-sectional study. Lipids Health Dis. (2024) 23:195. doi: 10.1186/s12944-024-02182-1
30. Tan MY, Mo CY, Li F, and Zhao Q. The association between serum uric acid and hypertriglyceridemia: evidence from the national health and nutrition examination survey (2007-2018). Front Endocrinol (Lausanne). (2023) 14:1215521. doi: 10.3389/fendo.2023.1215521
31. Kassi E, Pervanidou P, Kaltsas G, and Chrousos G. Metabolic syndrome: definitions and controversies. BMC Med. (2011) 9:48. doi: 10.1186/1741-7015-9-48
32. Straat ME, Martinez-Tellez B, Nahon KJ, Janssen LGM, Verhoeven A, van der Zee L, et al. Comprehensive (apo)lipoprotein profiling in patients with genetic hypertriglyceridemia using LC-MS and NMR spectroscopy. J Clin Lipidol. (2022) 16:472–82. doi: 10.1016/j.jacl.2022.04.004
33. Marais AD. Apolipoprotein E and atherosclerosis. Curr Atheroscler Rep. (2021) 23:34. doi: 10.1007/s11883-021-00933-4
34. Zhou M, Yang N, Xing X, Chang D, Li J, Deng J, et al. Obesity interacts with hyperuricemia on the severity of non-alcoholic fatty liver disease. BMC Gastroenterol. (2021) 21:43. doi: 10.1186/s12876-021-01615-w
35. Zhou Z, Li K, Li X, Luan R, and Zhou R. Independent and joint associations of body mass index, waist circumference, waist-height ratio and their changes with risks of hyperuricemia in middle-aged and older Chinese individuals: a population-based nationwide cohort study. Nutr Metab (Lond). (2021) 18:62. doi: 10.1186/s12986-021-00590-z
36. Facchini F, Chen YD, Hollenbeck CB, and Reaven GM. Relationship between resistance to insulin-mediated glucose uptake, urinary uric acid clearance, and plasma uric acid concentration. Jama. (1991) 266:3008–11. doi: 10.1001/jama.1991.03470210076036
37. Ter Maaten JC, Voorburg A, Heine RJ, Ter Wee PM, Donker AJ, and Gans RO. Renal handling of urate and sodium during acute physiological hyperinsulinaemia in healthy subjects. Clin Sci (Lond). (1997) 92:51–8. doi: 10.1042/cs0920051
38. Simão AN, Dichi JB, Barbosa DS, Cecchini R, and Dichi I. Influence of uric acid and gamma-glutamyltransferase on total antioxidant capacity and oxidative stress in patients with metabolic syndrome. Nutrition. (2008) 24:675–81. doi: 10.1016/j.nut.2008.03.021
39. Kong AP, Choi KC, Ho CS, Chan MH, Ozaki R, Chan CW, et al. Associations of uric acid and gamma-glutamyltransferase (GGT) with obesity and components of metabolic syndrome in children and adolescents. Pediatr Obes. (2013) 8:351–7. doi: 10.1111/j.2047-6310.2012.00115.x
40. Suzuki K, Konta T, Kudo K, Sato H, Ikeda A, Ichikawa K, et al. The association between serum uric acid and renal damage in a community-based population: the Takahata study. Clin Exp Nephrol. (2013) 17:541–8. doi: 10.1007/s10157-012-0743-y
41. Mallat SG, Al Kattar S, Tanios BY, and Jurjus A. Hyperuricemia, hypertension, and chronic kidney disease: an emerging association. Curr Hypertens Rep. (2016) 18:74. doi: 10.1007/s11906-016-0684-z
Keywords: type 2 diabetes mellitus, hyperuricemia, insulin sensitivity, loge GDR, insulin resistance
Citation: Liu P, Ji B and Peng Y (2025) Correlation between loge GDR and hyperuricemia in patients with type 2 diabetes mellitus: a cross-sectional study. Front. Endocrinol. 16:1637373. doi: 10.3389/fendo.2025.1637373
Received: 29 May 2025; Accepted: 10 September 2025;
Published: 01 October 2025.
Edited by:
Serafino Fazio, Federico II University Hospital, ItalyReviewed by:
Fabrizio Salvucci, Istituto di Medicina Biologica (ImBio), ItalyAntonio Cutruzzolà, Magna Græcia University of Catanzaro, Italy
Copyright © 2025 Liu, Ji and Peng. This is an open-access article distributed under the terms of the Creative Commons Attribution License (CC BY). The use, distribution or reproduction in other forums is permitted, provided the original author(s) and the copyright owner(s) are credited and that the original publication in this journal is cited, in accordance with accepted academic practice. No use, distribution or reproduction is permitted which does not comply with these terms.
*Correspondence: Yan Peng, MTM2NjUzOTkxNDZAMTYzLmNvbQ==
†These authors have contributed equally to this work