 Dung-Huan Liu
 Chih-Sheng Lin
 Pei-Ching Wu
- 1Department of Physical Medicine and Rehabilitation, China Medical University Hospital, Taichung, Taiwan
- 2Department of Physical Therapy, Graduate Institute of Rehabilitation Science, China Medical University, Taichung, Taiwan
- 3Graduate Degree Program of Biomedical Science and Engineering, National Yang Ming Chiao Tung University, Hsinchu, Taiwan
- 4Department of Biological Science and Technology, National Yang Ming Chiao Tung University, Hsinchu, Taiwan
- 5Center for Intelligent Drug Systems and Smart Bio-devices (IDS2B), National Yang Ming Chiao Tung University, Hsinchu, Taiwan
- 6Department of Chinese Medicine, China Medical University Hospital, Taichung, Taiwan
- 7College of Chinese Medicine, China Medical University, Taichung, Taiwan
Objectives: This study compares Osteoporosis Self-Assessment Tool for Asians (OSTA) and Calcaneal Quantitative Ultrasound (QUS) to detect primary osteoporosis among Taiwanese postmenopausal women and assess the consistency between both methods.
Methods: 8,883 postmenopausal women were selected from Taiwan Biobank. Osteoporosis was diagnosed using Dual-energy X-ray absorptiometry (DXA) with T-score≦-2.5 under WHO definition. QUS and OSTA were employed to assess osteoporosis risk, with statistical analyses including receiver operating characteristic curve (ROC) analysis, Delong’s test, and McNemar’s test to compare the performance of both tools. Youden’s J statistic identifies the optimal cut-off values of OSTA and QUS SI. Cohen’s kappa coefficient (k) and Spearman’s rank correlation coefficient (rs) assessed the correlation between OSTA, QUS, and DXA.
Results: QUS outperformed OSTA with superior AUC in primary osteoporosis screening of Taiwanese postmenopausal women under WHO osteoporosis definition (AUC of QUS and OSTA are 0.737 and 0.703; p<0.05). They could independently screen and track the women at primary osteoporosis risk but not replace DXA for osteoporosis diagnosis, because they had a fair agreement of k (0.293~0.342) and a moderate correlation of rs (0.424~0.481) with DXA. They couldn’t screen and track the women at primary osteoporosis risk interchangeably because their agreement is minimal (k=0.197; rs=0.271; p<0.05).
Conclusions: QUS and OSTA are radiation-free, portable, less expensive and time-consuming, and effective screening tools for primary osteoporosis in Taiwanese postmenopausal women, with QUS being the superior method under WHO osteoporosis definition. After further age-stratified analysis for detecting primary osteoporosis in Taiwanese postmenopausal women, QUS outperformed OSTA in those aged 45 - 65, while OSTA outperformed QUS in those aged 66 - 80.
1 Introduction
Osteoporosis is the most common chronic metabolic bone disease, characterized by increased bone fragility, caused by various factors such as menopause, body weight, and aging. It affected people of all ages, genders, and races, especially Caucasians (white race), the elderly, and women. The global population of individuals aged 60 and older is projected to more than double by the year 2050, increasing from 962 million in 2017 to approximately 2.1 billion. By 2100, this demographic is expected to grow to over 3.1 billion, representing a more than threefold increase since 2017 (1). As the population ages and life expectancy increases, osteoporosis is becoming a global epidemic. Based on General Practice Research Database, the lifetime probability of experiencing an osteoporotic fracture in women aged 50 years has risen to 53.2% (2). Osteoporotic fractures are the most common and severe complication of osteoporosis, and the resulting high morbidity and mortality have imposed a massive healthcare burden on individuals, families, and society. It has been reported that by the year 2050, fractures caused by osteoporosis will have doubled and medical costs will skyrocket (3). Identifying people with osteoporosis risk and early interventions is the key to encumbering the progression of osteoporotic fractures, which can reduce hospital admissions, disabilities, mortality, and economic burdens to society (4).
Dual-energy X-ray absorptiometry (DXA) is the gold standard bone mineral density (BMD) examination for the diagnosis of osteoporosis (5). According to World Health Organization (WHO) definition, Osteoporosis is confirmed when a patient’s BMD value is 2.5 standard deviation (SD) lower than the reference value for young white female adults (T-score≦-2.5) (6). Considering the huge bulk, non-portability, professional operation, and high cost, DXA may not be suitable for widespread osteoporosis screening, especially in rural areas. In conjunction with the growth of the elderly population and the prevalence of osteoporosis, DXA will be more competitive. In Taiwan, DXA usage is mostly confined to hospitals, while most community health centers lack the equipment and cannot adequately serve the elderly population. A simple screening tool to detect the population with osteoporosis risk is necessary for clinicians in these areas.
Currently, simple, reliable, and cost-effective screening tools such as Calcaneal Quantitative Ultrasound (QUS) and Osteoporosis Self-Assessment Tool for Asians (OSTA) can quickly and easily identify people at risk of osteoporosis and fracture (7–10). According to WHO, neither OSTA nor QUS diagnoses osteoporosis, but they may have clinical benefits in prioritizing patients at high risk for DXA scanning. Furthermore, they may improve the screening efficiency by reducing the number of otherwise healthy individuals referred.
QUS serves as an alternative method for evaluating bone health and screening for osteoporosis by analyzing the propagation of ultrasonic waves through the calcaneus. The calcaneus is the primary skeletal site for QUS assessment, due to its high trabecular bone content and two lateral surfaces that facilitate ultrasound wave propagation and accessibility (11). These ultrasonic waves operate at frequencies beyond the normal human auditory range (greater than 20 kHz). Two main parameters generated by QUS are the speed of sound (SOS) and broadband ultrasound attenuation (BUA) (12). The SOS describes how fast sound waves propagate through various body structures. The BUA measures the loss of strength of ultrasound waves as they travel through soft tissue and bone. The Stiffness Index (SI) represents a composite metric that integrates SOS and BUA through various algorithmic approaches. The association of these variables with the QUS value was determined using proprietary software.
Compared to DXA, QUS is radiation-free, portable, less time-consuming, and less expensive, making it appropriate for research and clinical environments. The device manufacturers, study population (age, ethnicity, and gender), QUS measurement parameters, measured DXA and Achilles site have all influenced and differed in studies examining the discriminatory ability of QUS (13). As a result, QUS still lacks universal guidelines for distinguishing between normal and low BMD values.
Calcaneal QUS may aid in screening for osteoporosis, but there is no consensus on the device, variable, or cutoff value to use. The current evidence is insufficient to recommend any specific cutoff for reliably confirming or ruling out osteoporosis (14). Calcaneal QUS devices are effective in assessing fracture risk for certain populations, with the strongest evidence for Caucasian females over 55 years old, and fair evidence for Asian females above the same age (15). The GE Achilles Lunar QUS (GE Healthcare, Madison, WI) had great diagnosis accuracy with SI≦57 and a low chance of osteoporosis with SI>78, according to a study of older women who took part in the Epidemiology of Osteoporosis Study (15). Although several studies have compared values between calcaneal QUS and DXA, few studies have been conducted on Asian population (16–18). To our knowledge, it is possible to use QUS to prescreen Taiwanese with a high risk of osteoporosis based on its significant correlation with DXA and its optimal Youden’s index cutoff value of T-score for QUS to confirm osteoporosis is -2.725 (18).
Despite being less expensive than DXA, QUS devices are still costly and may not be available in all primary healthcare settings. Aside from QUS, other risk-based algorithms, such as OSTA, osteoporosis risk assessment tool (ORAI), simple calculated risk estimation (SCORE), and fracture risk assessment tool(FRAX ®), are now utilized to forecast osteoporosis and fragility fracture (19). The majority of these algorithms were created based on Caucasians. The OSTA was developed by Koh et al. using data from Asian women (8). Based on age and weight, the formula of OSTA is 0.2 × [body weight (Kg) - age (years)]. Patients with an OSTA score of ≦- 4 are considered high risk, those between -1 and -4 are ranged medium risk, and those of >-1 are ranged low risk of osteoporosis (8). According to the original study by Koh et al., the receiver operating characteristic (ROC) analysis using the highest Youden’s index (20) identified the optimal cut-off point of OSTA for predicting osteoporosis to be -1. This OSTA risk index of -1 demonstrated a sensitivity of 91% and a specificity of 45%, with an area under the curve of 0.79 (8).
Several studies have examined the agreement between QUS and OSTA in identifying people with osteoporosis. The above studies mostly compared osteoporosis screening tools under the osteoporosis diagnosis by QUS, which is rare by DXA. The main feature of this study is that the large-scale analysis study used DXA as the diagnostic benchmark for osteoporosis to compare the osteoporosis screening effectiveness of OSTA and QUS in Taiwanese postmenopausal women. Since OSTA does not require equipment, it could replace QUS as a free osteoporosis screening tool if the two methods are consistent. Therefore, this study hopes to evaluate the ability of OSTA and QUS to detect primary osteoporosis in Taiwanese postmenopausal women and the consistency between OSTA and QUS.
2 Materials and methods
2.1 Ethics statement
This study was approved by the Institutional Review Board (IRB) of China Medical University Hospital (CMUH110-REC2-065) and the Taiwan Biobank IRB (TWBR11008 - 02).
2.2 Data source, participants’ inclusion and exclusion criteria
2.2.1 Data source
This study utilized data from the Taiwan Biobank, which (2021 - 06-21) includes approximately 179,623 participants aged 30 to 80 without a history of cancer. Taiwan Biobank contains health questionnaires, physical examination data, blood test results, and imaging data (including DXA and QUS). The same ISCD-certified technician conducted the BMD and SI measurements using the same DXA and QUS machines.
2.2.2 Participants’ inclusion criteria
Taiwanese women who were selected from Taiwan Biobank and have been postmenopausal for twelve months or more.
2.2.3 Participants’ exclusion criteria
Taiwanese women had missing QUS data, had missing DXA data at any one site (femoral neck, total hip, lumbar spine), had osteoporosis risk factors (including current drinking and smoking history, secondary osteoporosis disease, and long-term exposure to glucocorticoids), or had incomplete questionnaire data. Secondary osteoporosis disease includes type I (insulin-dependent) diabetes, osteogenesis imperfecta in adults, untreated long-standing hyperthyroidism, hypogonadism or premature menopause (<45 years), chronic malnutrition, malabsorption, and chronic liver disease.
2.3 Identify osteoporosis with QUS and OSTA
The study used the stiffness index (SI) of QUS data (Achilles InSight, GE, USA) to assess the osteoporosis risk of participants. In Table 1, the optimal cut-off values based on Youden’s J statistic (20) for QUS SI in predicting osteoporosis were identified as 79.5, 75.5, 74.5, and 77.5 for DXA-confirmed osteoporosis at any site (the lowest T-score measured at the DXA of the femoral neck, total hip, or lumbar spine), femoral neck, total hip, and lumbar spine, indicating a lower risk of osteoporosis for individuals with SI values exceeding these above optimal cut-off values. Notably, the study identified an optimal cut-off value of 79.5 for QUS SI under the WHO definition of osteoporosis, which is close to the 78 reported by Hans et al. (15); the optimal cut-off value of QUS SI for femoral neck DXA-determined osteoporosis was set at 75.5, which is similar to the 75.7 found by Kung et al. (17). Additionally, the study used the Osteoporosis Self-assessment Tool (OSTA) to evaluate the participants’ osteoporosis risk. The simplified formula for OSTA is 0.2 × [body weight (Kg) - age (years)], with a cut-off value of -1. Individuals with values above -1 were considered to have a lower risk of osteoporosis (8).
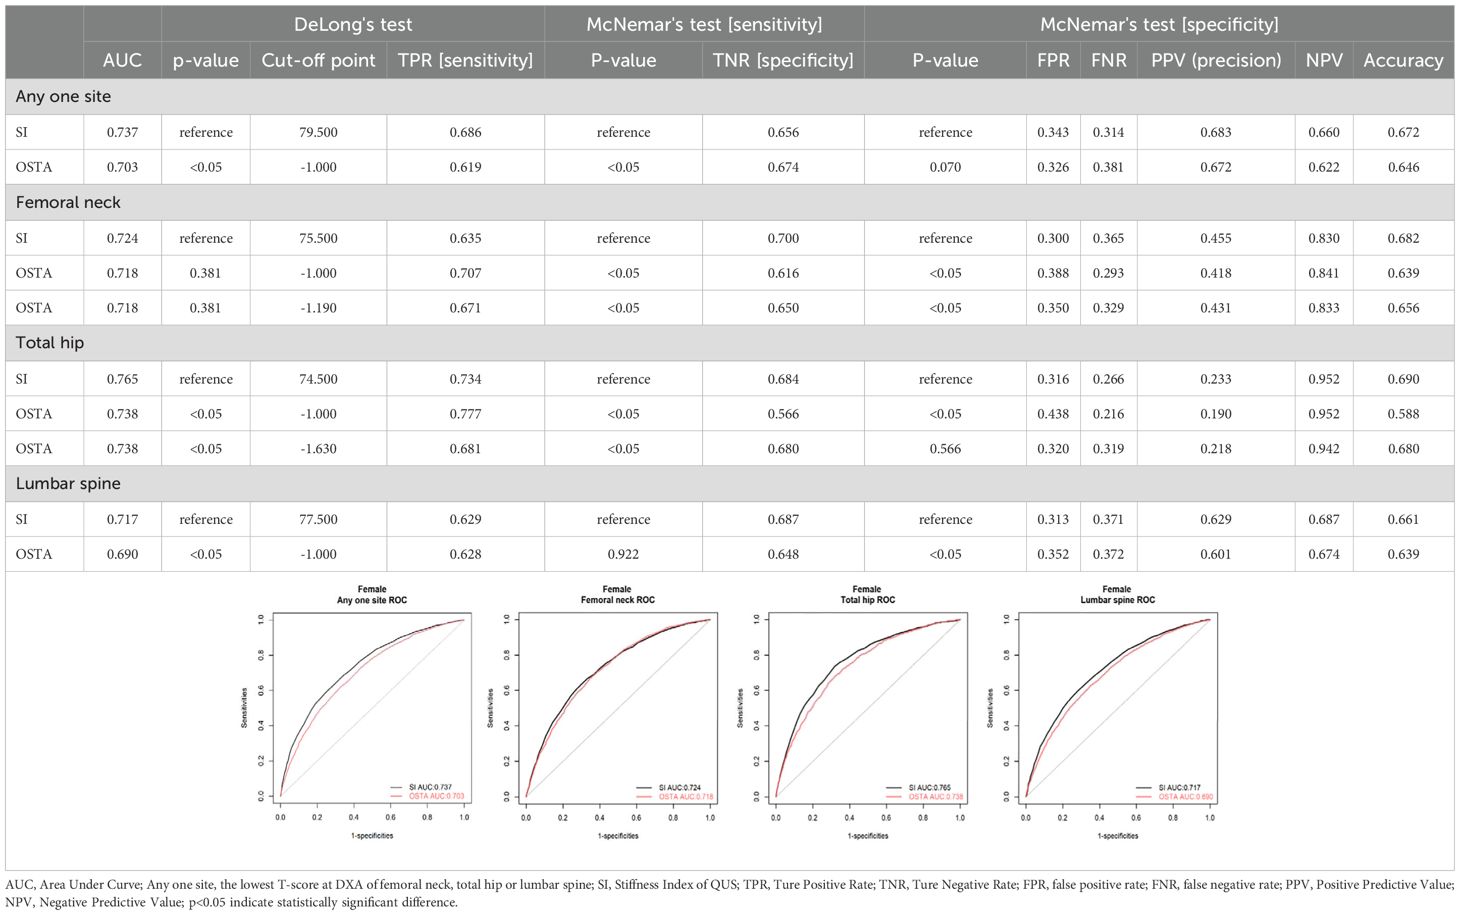
Table 1. Preformance of QUS and OSTA for primary osteoporosis screening in Taiwanese postmenopausal women with DXA-determined osteoporosis by different sites.
2.4 Diagnosis of osteoporosis
According to WHO definition, osteoporosis is diagnosed if the lowest T-score measured by DXA (DiscoveryTM QDRTM Bone Densitometry Systems (HOLOGIC) machine) at any one site of femoral neck, total hip, or lumbar spine (L1-L4) was less than or equal to -2.5 standard deviations (This study employed the young female Caucasian populations as the reference value according to WHO osteoporosis definition (21–23) and the DXA machine’s original setup).
2.5 Statistical analysis
This study used receiver operating characteristic (ROC) curve analysis and Delong’s test to evaluate the ability of OSTA and QUS for osteoporosis risk screening and compare the area under the curve (AUC) of both tools. The highest Youden’s index identifies the optimal cut-off values of OSTA and QUS SI; Youden’s J statistic is calculated using the formula: J=Sensitivity+Specificity-1 (20).The sensitivity was defined as the proportion of women diagnosed with osteoporosis (T-scores ≤ -2.5) who had a positive test (i.e., index values below the cut-off). The specificity was defined as the proportion of women diagnosed without osteoporosis who tested normal (i.e., having index values above or equal to the cut-off). McNemar’s test compared both tools’ sensitivity, specificity, and negative predictive value (NPV). Cohen’s kappa coefficient (k) and Spearman’s rank correlation coefficient (rs) assessed the correlation between OSTA, QUS, and DXA. All analyses were performed using R version 4.3.2 (http://www.R-project.org). A p-value of <0.05 indicated a statistically significant difference.
3 Result
3.1 Study population selection
Following the flowchart of Figure 1, 114,675 women were enrolled in this study. The study excluded women who were not postmenopausal, had missing QUS data, had missing DXA data at any one site (femoral neck, total hip, lumbar spine), had osteoporosis risk factors (including current drinking and smoking history, secondary osteoporosis disease, and long-term exposure to glucocorticoids), or had incomplete questionnaire data. Secondary osteoporosis disease includes type I (insulin-dependent) diabetes, osteogenesis imperfecta in adults, untreated long-standing hyperthyroidism, hypogonadism or premature menopause (<45 years), chronic malnutrition, malabsorption, and chronic liver disease. Finally, 8883 women were included and analyzed after excluding outliers.
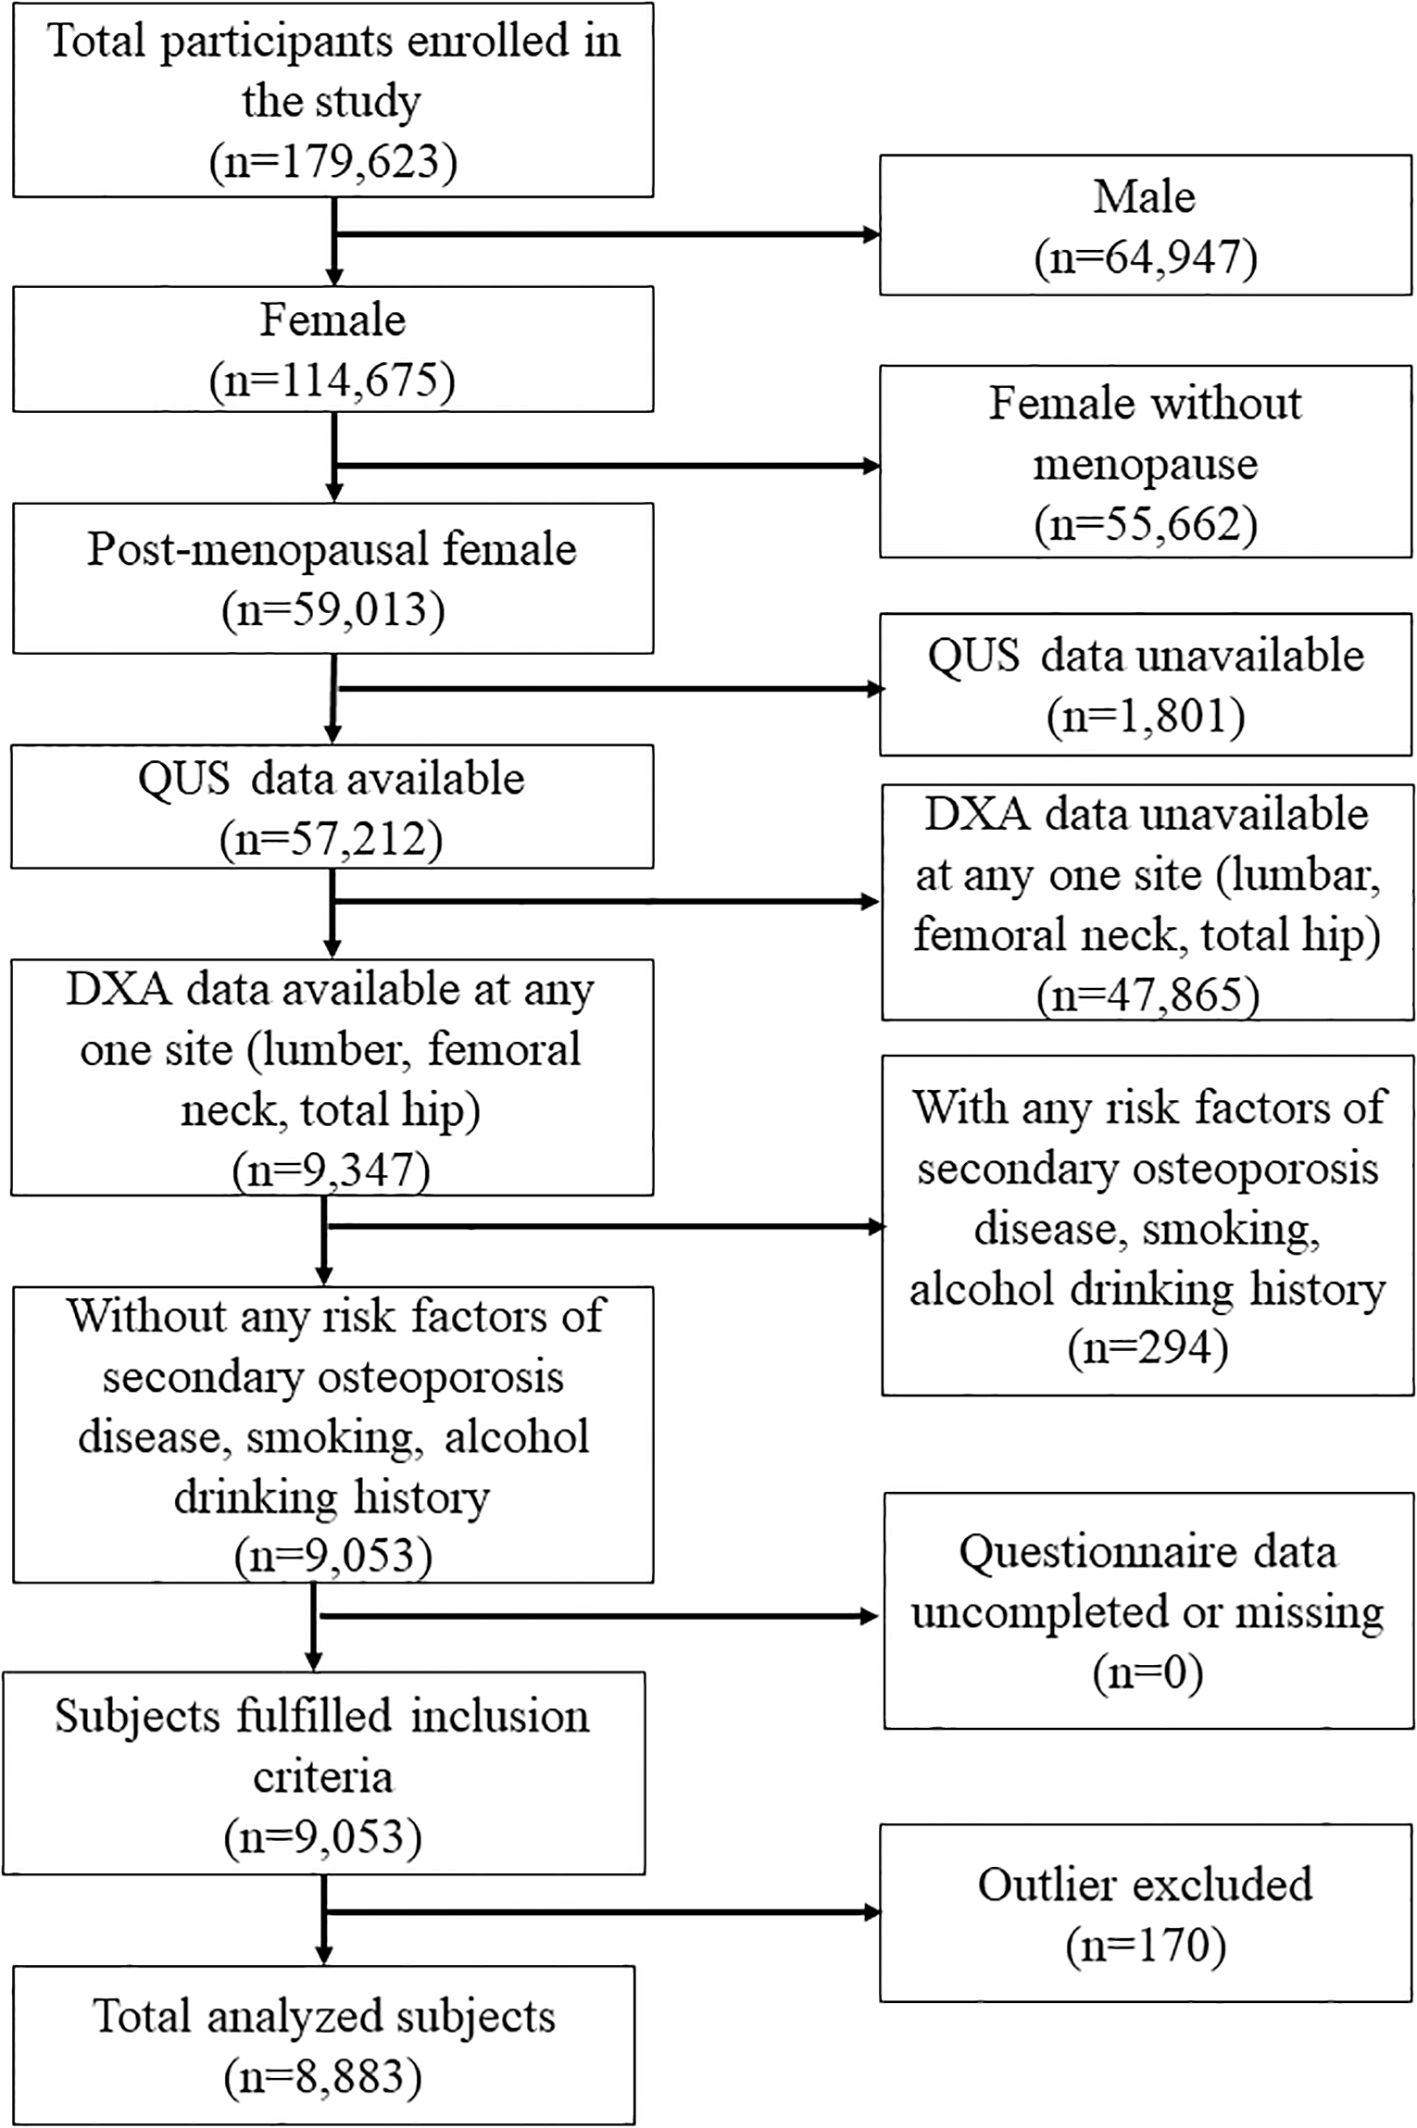
Figure 1. The flowchart of the study.
3.2 Characteristics of the study population
In Table 2, the subjects were categorized into two groups according to the WHO criteria’s diagnosis of osteoporosis (T-score ≤ -2.5): 4609 (51.89%) with osteoporosis and 4274 (48.11%) without osteoporosis. All characteristics were significantly different between both groups (p<0.05).

Table 2. Baseline characteristics of all subjects in the study.
3.3 The assessment of OSTA and QUS in detecting osteoporosis
In Table 1, the evaluation of osteoporosis screening tools based on WHO osteoporosis definition, the AUC, sensitivity, specificity, and NPV were 0.737, 0.686, 0.656, and 0.660 for QUS with an optimal cut-off value of 79.5; 0.703, 0.619, 0.674 and 0.622 for OSTA with an optimal cut-off value of -1(the same cut-off value of OSTA as Koh et al.). Under the cut-off values of 79.5 and -1 for QUS and OSTA, the AUC, sensitivity, and NPV of QUS significantly outperformed OSTA (p<0.05). The specificity of QUS was mildly more than OSTA without a significant difference (p>0.05). The capability of QUS to detect osteoporosis outperformed OSTA, with superior AUC, sensitivity, NPV, and comparable specificity.
For femoral neck DXA-determined osteoporosis with T-score ≤ -2.5, the AUC, sensitivity, specificity, and NPV were 0.724, 0.635, 0.700, and 0.830 for QUS with an optimal cut-off value of 75.5; 0.718, 0.671, 0.650, and 0.833 for OSTA with an optimal cut-off value of -1.19; 0.718, 0.707, 0.616, and 0.841 for OSTA with cut-off value of -1. Under the cut-off values of 75.5 and -1 for QUS and OSTA, the AUC of QUS was mildly more than OSTA without a significant difference (p>0.05). The sensitivity and NPV of OSTA were significantly better than QUS (p<0.05). The specificity of QUS significantly outperformed OSTA (p>0.05). The capability of OSTA to detect osteoporosis was comparable to QUS, with comparable AUC, superior sensitivity and NPV, and inferior specificity.
For total hip DXA-determined osteoporosis with T-score ≤ -2.5, the AUC, sensitivity, specificity, and NPV were 0.765, 0.734, 0.684, and 0.952 for QUS with an optimal cut-off value of 74.5; 0.738, 0.681, 0.680, and 0.942 for OSTA with an optimal cut-off value -1.63; 0.738, 0.777, 0.566, and 0.952 for OSTA with a cut-off value -1. Under the cut-off values of 74.5 and -1 for QUS and OSTA, the AUC and specificity of QUS were significantly better than OSTA (p<0.05). The sensitivity of OSTA significantly outperformed QUS (p<0.05). The NPV of OSTA was the same as QUS (p>0.05). The capability of QUS to detect osteoporosis outperformed OSTA, with superior AUC and specificity, inferior sensitivity, and the same NPV.
For lumbar DXA-determined osteoporosis with T-score ≤ -2.5, the AUC, sensitivity, specificity, and NPV were 0.717, 0.629, 0.687, and 0.687 for QUS with an optimal cut-off value of 77.5; 0.690, 0.628, 0.648, and 0.674 for OSTA with an optimal cut-off value of -1(the same cut-off value of OSTA as Koh et al.). Under the cut-off values of 77.5 and -1 for QUS and OSTA, the AUC, specificity, and NPV of QUS significantly outperformed OSTA (p<0.05). The sensitivity of QUS was the same as OSTA (p>0.05). The capability of QUS to detect osteoporosis outperformed OSTA, with superior AUC, specificity, NPV, and the same sensitivity.
In summary, QUS outperformed OSTA with significantly superior AUC, sensitivity, and NPV (all p<0.05) under WHO osteoporosis definition. For DXA-determined osteoporosis of the total hip or lumbar spine with T-score ≤ -2.5, QUS outperformed OSTA with significantly superior AUC and specificity (all p < 0.05). For femoral neck DXA-determined osteoporosis with T-score ≤ -2.5, the capability of OSTA to detect primary osteoporosis was comparable to QUS with comparable AUC (p>0.05), superior sensitivity (p<0.05), and superior NPV (p<0.05).
In brief, whether osteoporosis is diagnosed according to WHO definition, total hip, or lumbar spine DXA T-score ≤ -2.5, QUS outperformed OSTA with superior AUC in detecting primary osteoporosis of Taiwanese postmenopausal women (p<0.05). However, the capability of OSTA to detect primary osteoporosis was comparable to QUS with comparable AUC for femoral neck DXA-determined osteoporosis with T-score ≤ -2.5 (p>0.05).
3.4 Comparison between OSTA and QUS at each age stratification
Tables 3–6 divided the participants into two age groups: 45 - 65 and 66 - 80. Under WHO osteoporosis definition in Table 3, the sensitivity, specificity, and NPV were 0.646, 0.693, and 0.686 for QUS (cut-off value: 79.5) in the aged 45 - 65; 0.485, 0.774, and 0.627 for OSTA (cut-off value: -1) in the aged 45 - 65; 0.754, 0.543, and 0.573 for QUS in the aged 66 - 80; 0.850, 0.360, and 0.593 for OSTA in the aged 66 - 80. At the age of 45 - 65, the sensitivity and NPV of QUS outperformed OSTA (p<0.05), with inferior specificity (p<0.05). The capability of QUS to detect osteoporosis outperformed OSTA. At the age of 66 - 80, the sensitivity of OSTA outperformed QUS (p<0.05), with inferior specificity (p<0.05) and mildly superior NPV (p>0.05). The capability of OSTA to detect osteoporosis outperformed QUS.
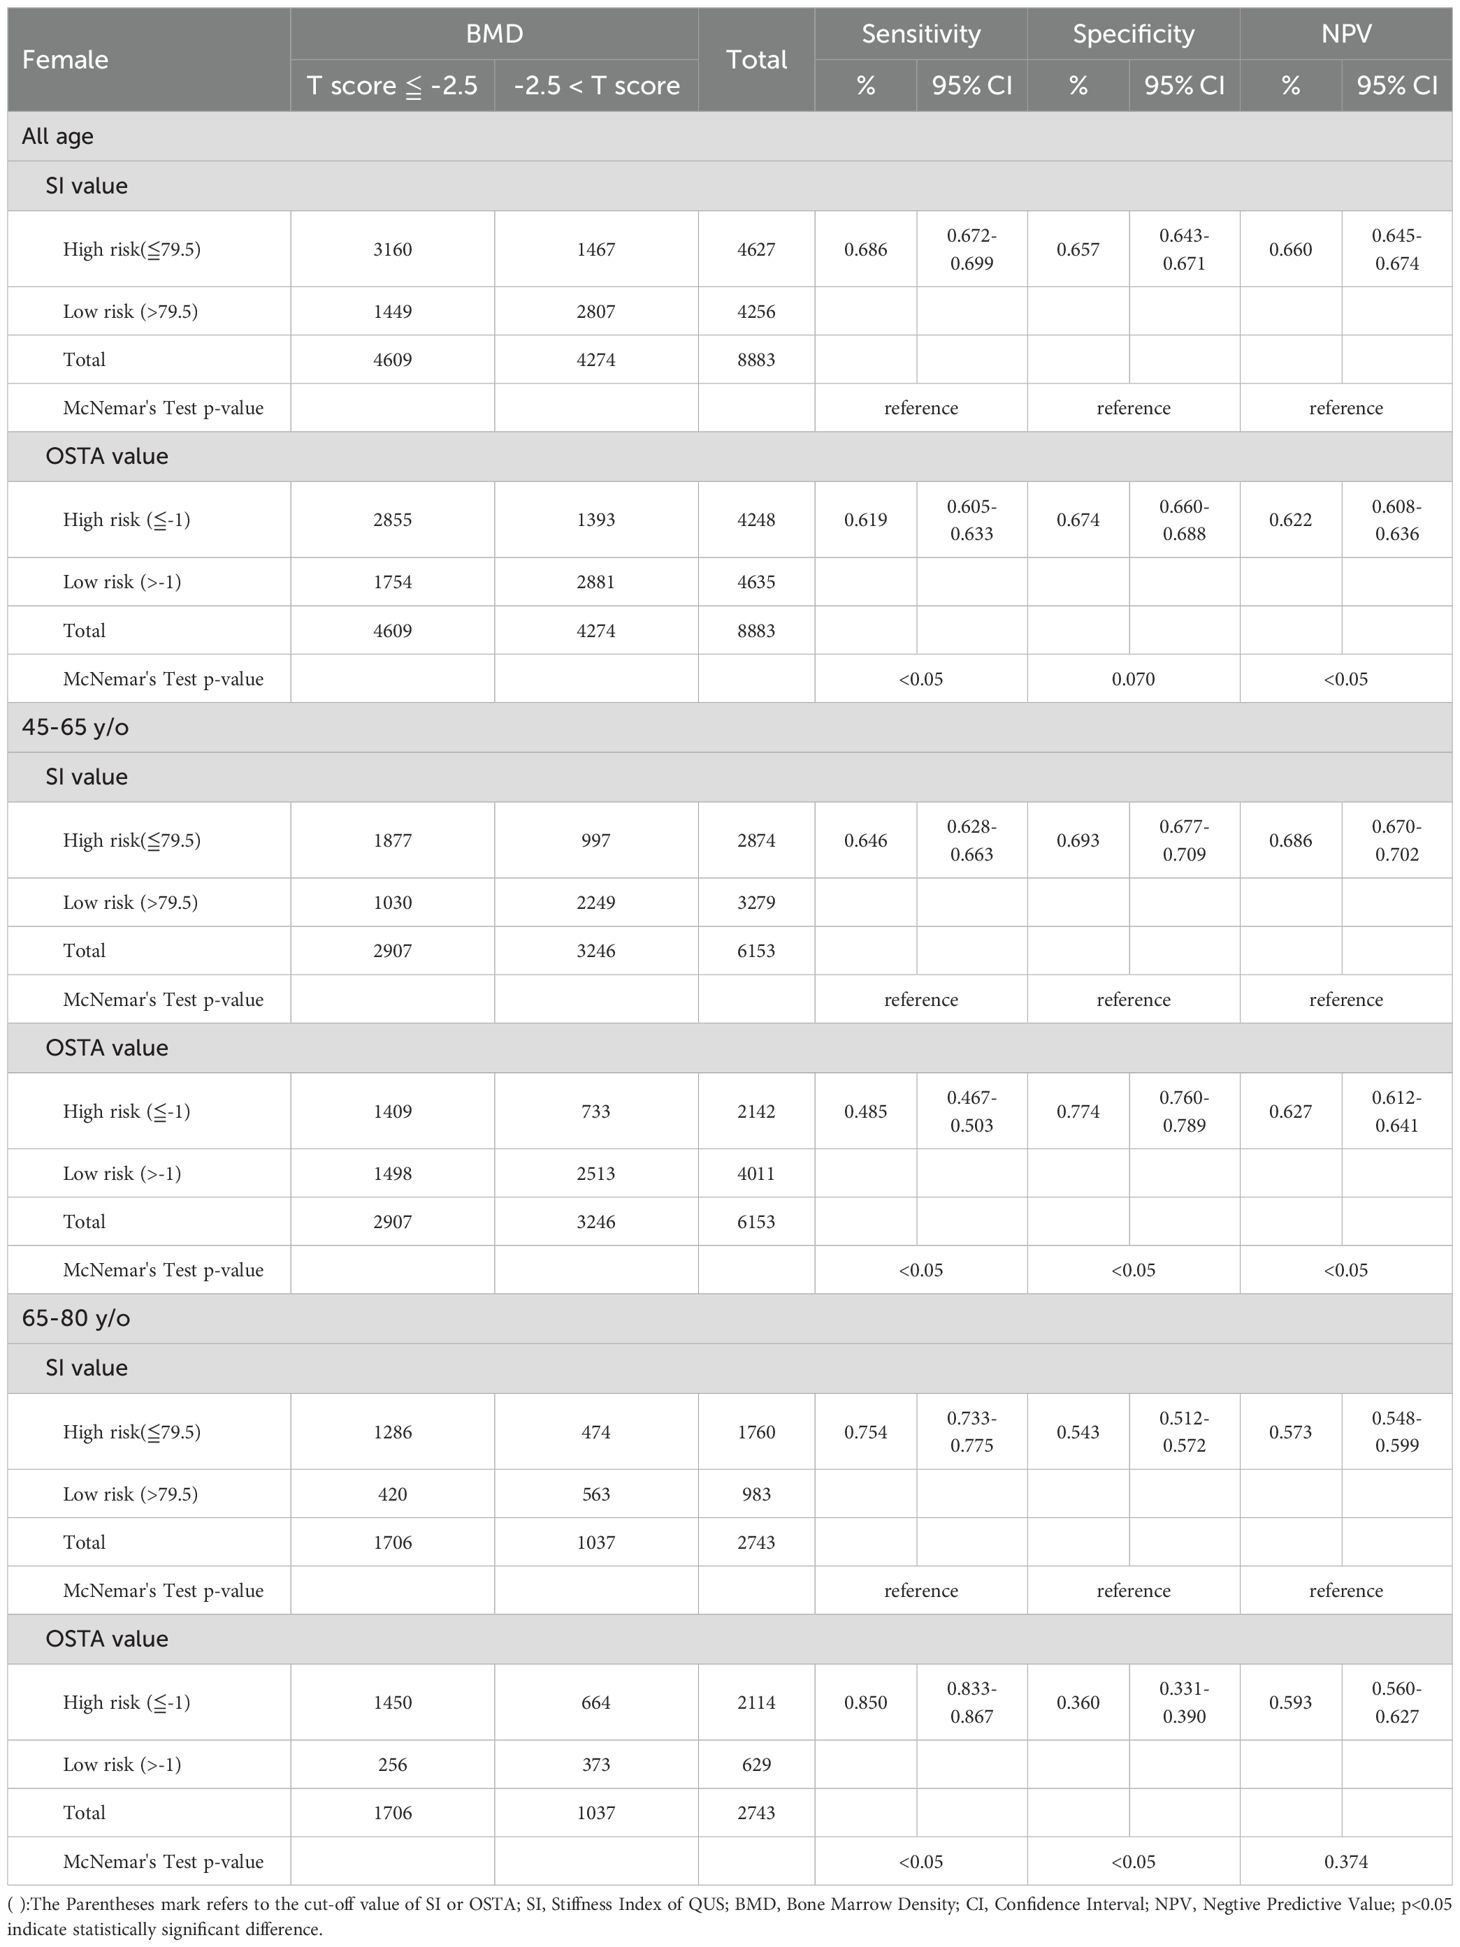
Table 3. Comparison between QUS and OSTA for osteoporosis screening in Taiwanese postmenopausal women with DXA-determined osteoporosis by any one site (The lowest T-score at DXA of femoral neck, total hip or lumbar spine).

Table 4. Comparison between QUS and OSTA for osteoporosis screening in Taiwanese postmenopausal women with DXA-determined osteoporosis by lumbar spine.

Table 5. Comparison between QUS and OSTA for osteoporosis screening in Taiwanese postmenopausal women with DXA-determined osteoporosis by femoral neck.
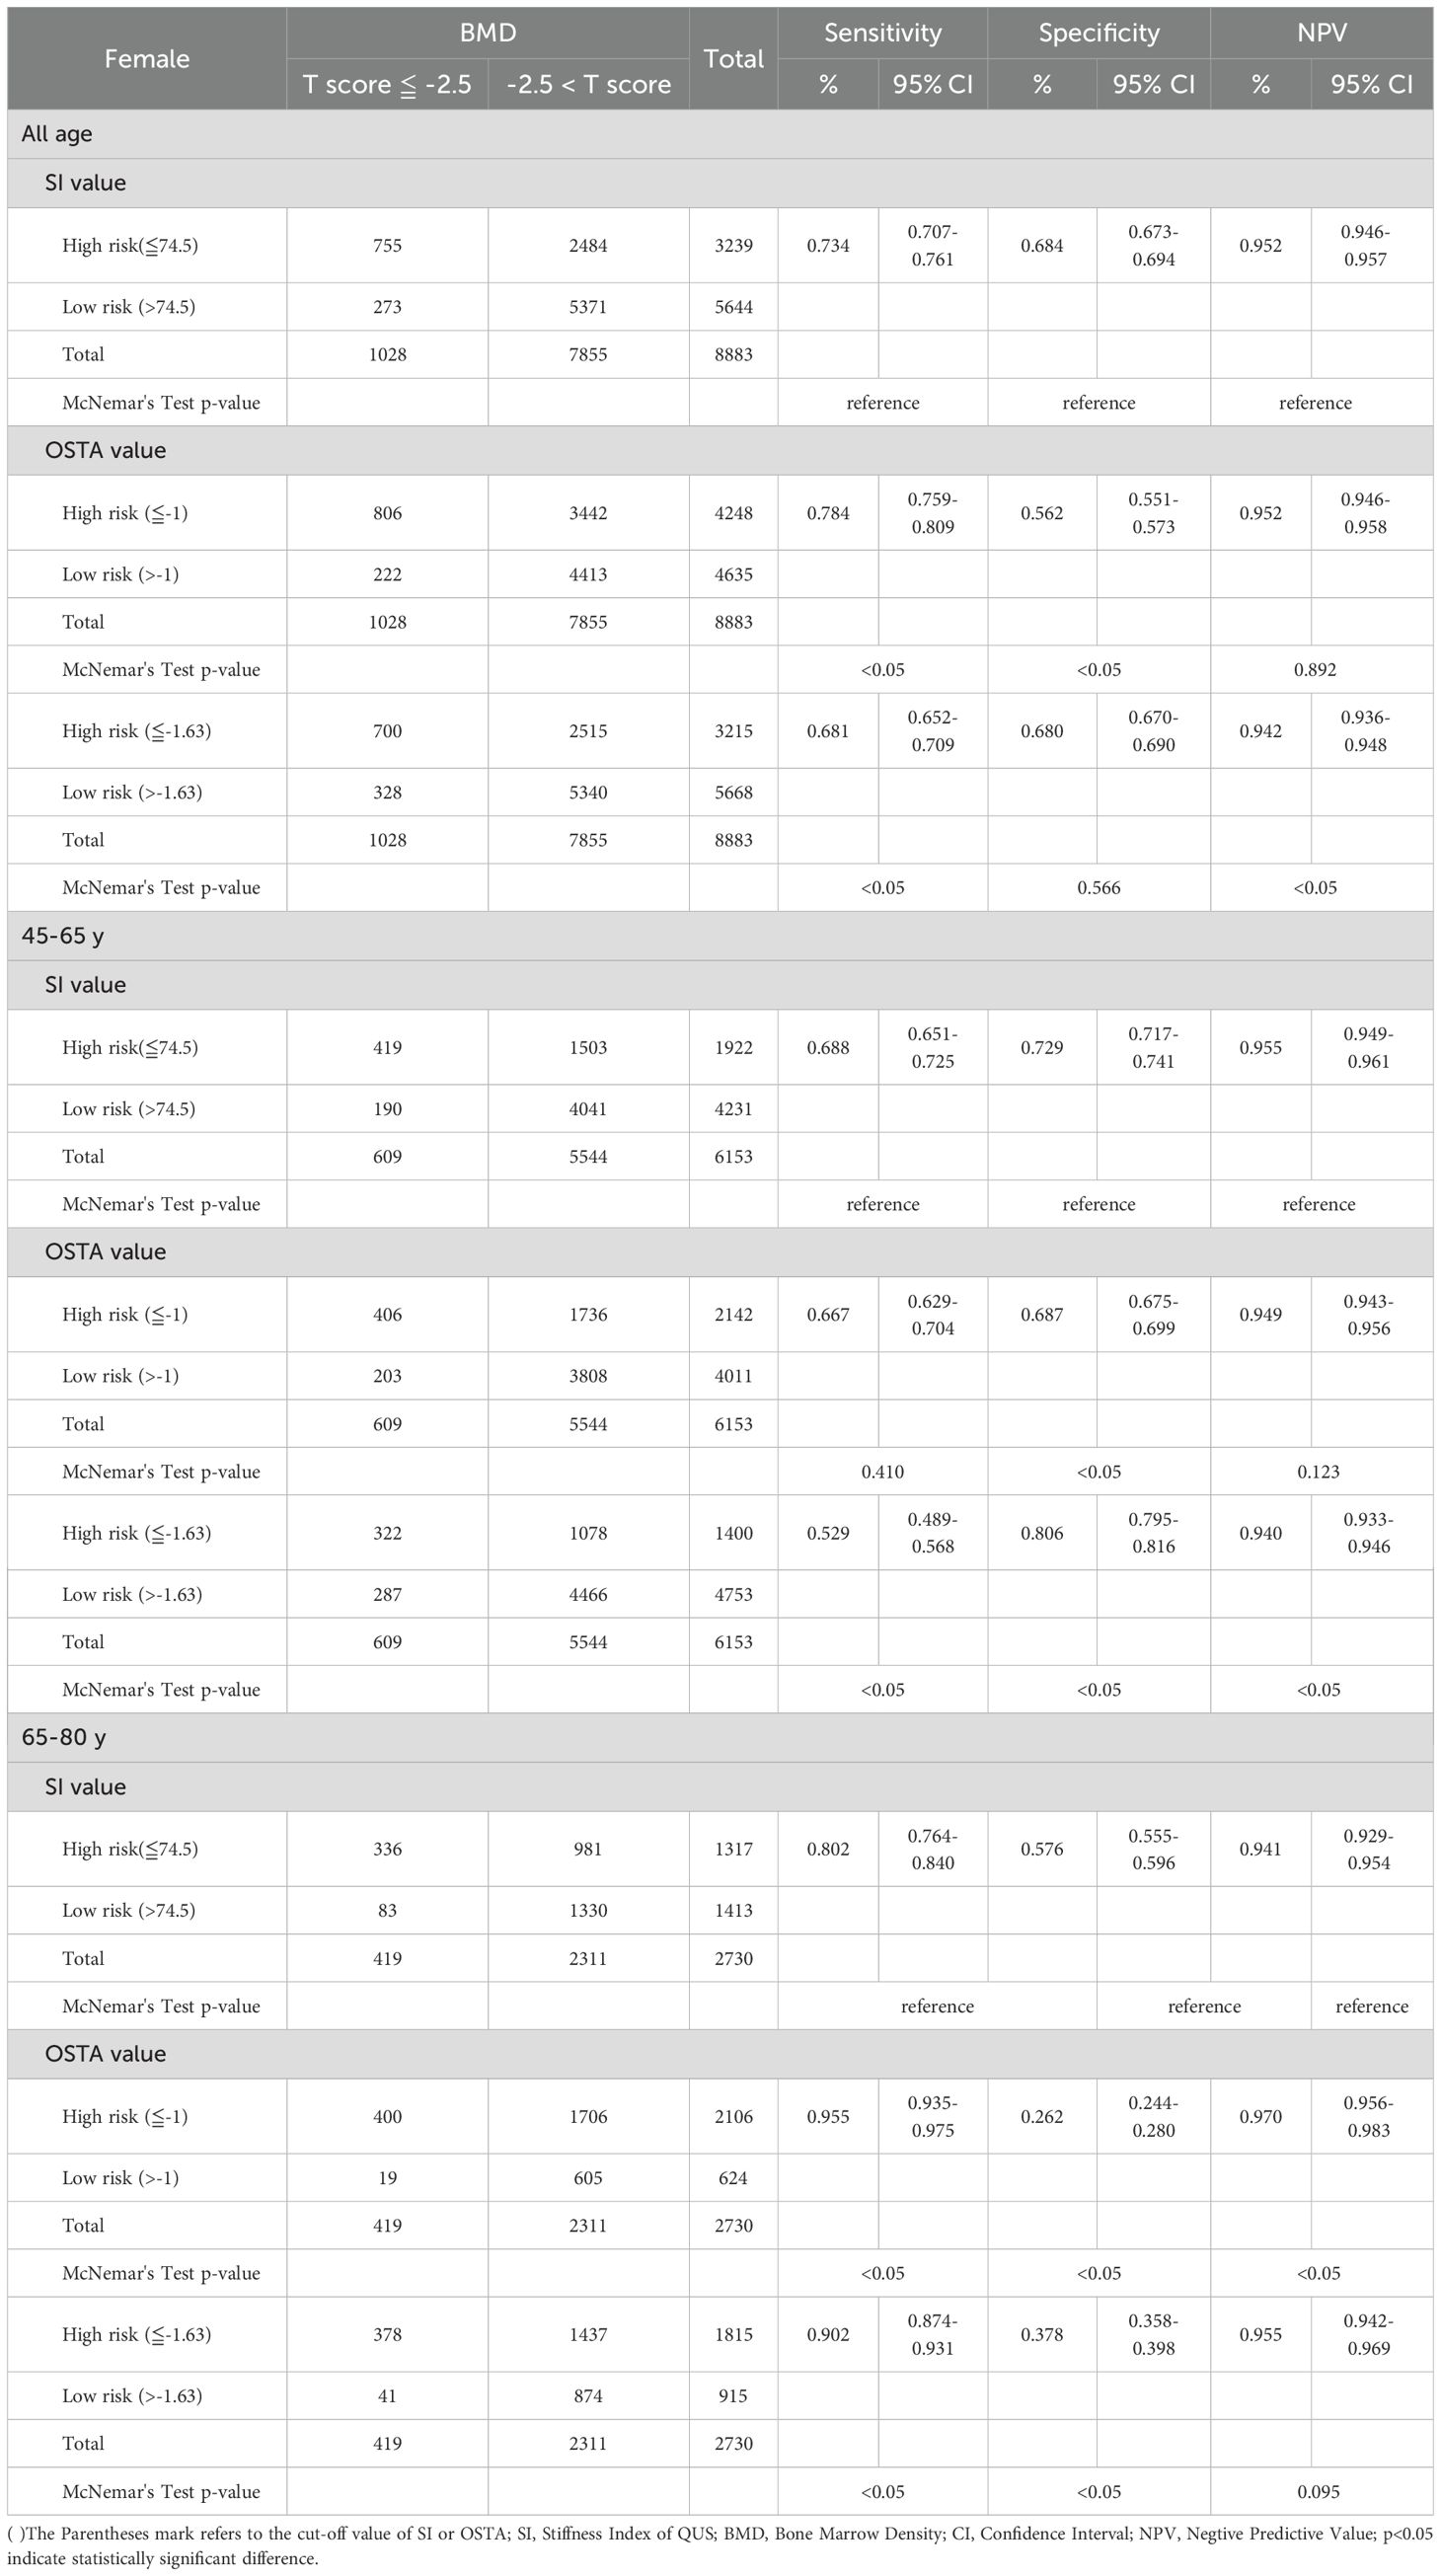
Table 6. Comparison between QUS and OSTA for osteoporosis screening in Taiwanese postmenopausal women with DXA-determined osteoporosis by total hip.
Under the diagnosis of osteoporosis based on the T-score≦ -2.5 at the lumbar spine in Table 4, the sensitivity, specificity, and NPV were 0.584, 0.724, and 0.709 for QUS (cut-off value: 77.5) in the aged 45 - 65; 0.493, 0.756, and 0.676 for OSTA (cut-off value: -1) in the aged 45 - 65; 0.706, 0.580, and 0.619 for QUS in the aged 66 - 80; 0.859, 0.335, and 0.662 for OSTA in the age 66 - 80. At the age of 45 - 65, the sensitivity and NPV of QUS outperformed OSTA (p<0.05), with inferior specificity (p<0.05). The capability of QUS to detect osteoporosis outperformed OSTA. At the age of 66 - 80, the sensitivity and NPV of OSTA outperformed QUS (p<0.05), with inferior specificity (p<0.05). The capability of OSTA to detect osteoporosis outperformed QUS.
Under the diagnosis of osteoporosis based on the T-score ≦ -2.5 at the femoral neck in Table 5, the sensitivity, specificity, and NPV were 0.588, 0.736, and 0.846 for QUS (cut-off value: 75.5) in the aged 45 - 65; 0.588, 0.730, and 0.845 for OSTA (cut-off value: -1) in the aged 45 - 65; 0.707, 0.604, and 0.779 for QUS in the aged 66 - 80; 0.886, 0.295, and 0.816 for OSTA in the aged 66 - 80. At the age of 45 - 65, the sensitivity of QUS was the same as the OSTA, with mildly superior specificity and NPV(p>0.05). The capability of QUS to detect osteoporosis outperformed OSTA. At the age of 66 - 80, the sensitivity and NPV of OSTA outperformed QUS (p<0.05), with inferior specificity (p<0.05). The capability of OSTA to detect osteoporosis outperformed QUS.
Under the diagnosis of osteoporosis based on the T-score ≦ -2.5 at the total hip in Table 6, the sensitivity, specificity, and NPV were 0.688, 0.729, and 0.955 for QUS (cut-off value: 74.5) in the aged 45 - 65; 0.667, 0.687, and 0.949 for OSTA (cut-off value: -1) in the aged 45 - 65; 0.802, 0.576, and 0.941 for QUS in the aged 66 - 80; 0.955, 0.262, and 0.970 for OSTA in the aged 66 - 80. At the age of 45 - 65, the specificity of QUS outperformed OSTA (p<0.05), with mildly superior sensitivity and NPV (p>0.05). The capability of QUS to detect osteoporosis outperformed OSTA. At the age of 66 - 80, the sensitivity and NPV of OSTA outperformed QUS (p<0.05), with inferior specificity (p<0.05). The capability of OSTA to detect osteoporosis outperformed QUS.
In summary, after further age-stratified analysis for detecting primary osteoporosis in Taiwanese postmenopausal women, whether osteoporosis is diagnosed according to WHO definition, femoral neck, total hip, or lumbar spine DXA T-score ≤ -2.5, QUS outperformed OSTA with superior sensitivity and NPV in those aged 45 - 65 (all p<0.05, except for femoral neck and total hip with p>0.05), while OSTA outperformed QUS with superior sensitivity and NPV in those aged 66 - 80 (all p<0.05, except NPV under WHO definition with p>0.05).
4 Discussion
Under WHO osteoporosis definition, QUS (AUC: 0.737, with a cut-off value of SI: 79.5) and OSTA (AUC: 0.703, with a cut-off value: -1) are good and sufficient primary osteoporosis screening tools for postmenopausal Taiwanese women with AUCs over 0.7 in Table 1. The AUC of the diagnostic tool <0.7 is considered unacceptable (24). In Table 7, the k between OSTA and DXA or between QUS and DXA are 0.293 or 0.342 (p<0.05); the rs between OSTA and DXA or between QUS and DXA are 0.424 or 0.481 (p<0.05). They had a fair agreement of k and a moderate correlation of rs with DXA. This means they could independently screen and track the women at primary osteoporosis risk but not replace DXA for osteoporosis diagnosis. The agreement between QUS and OSTA was limited despite a statistically significant correlation (k=0.197, slight agreement; rs=0.271, weak degree; all p<0.05). In other words, they couldn’t screen and track the women at primary osteoporosis risk interchangeably because their agreement is minimal. These results are similar to the previous studies on Chinese women (k=0.151, slight agreement; rs=0.418, moderate degree; all p<0.001) (25) and Taiwanese women (rs=0.200, weak degree; p<0.05) (16). Chin et al. also found similar results with slight to fair agreement of k and weak degree of rs between QUS and OSTA in Chinese (k=0.186, rs=0.325; all p<0.05), Malay (k=0.338, rs=0.348; all p<0.05), and Indian women (k=0.235, rs=0.345; all p>0.05) (26).
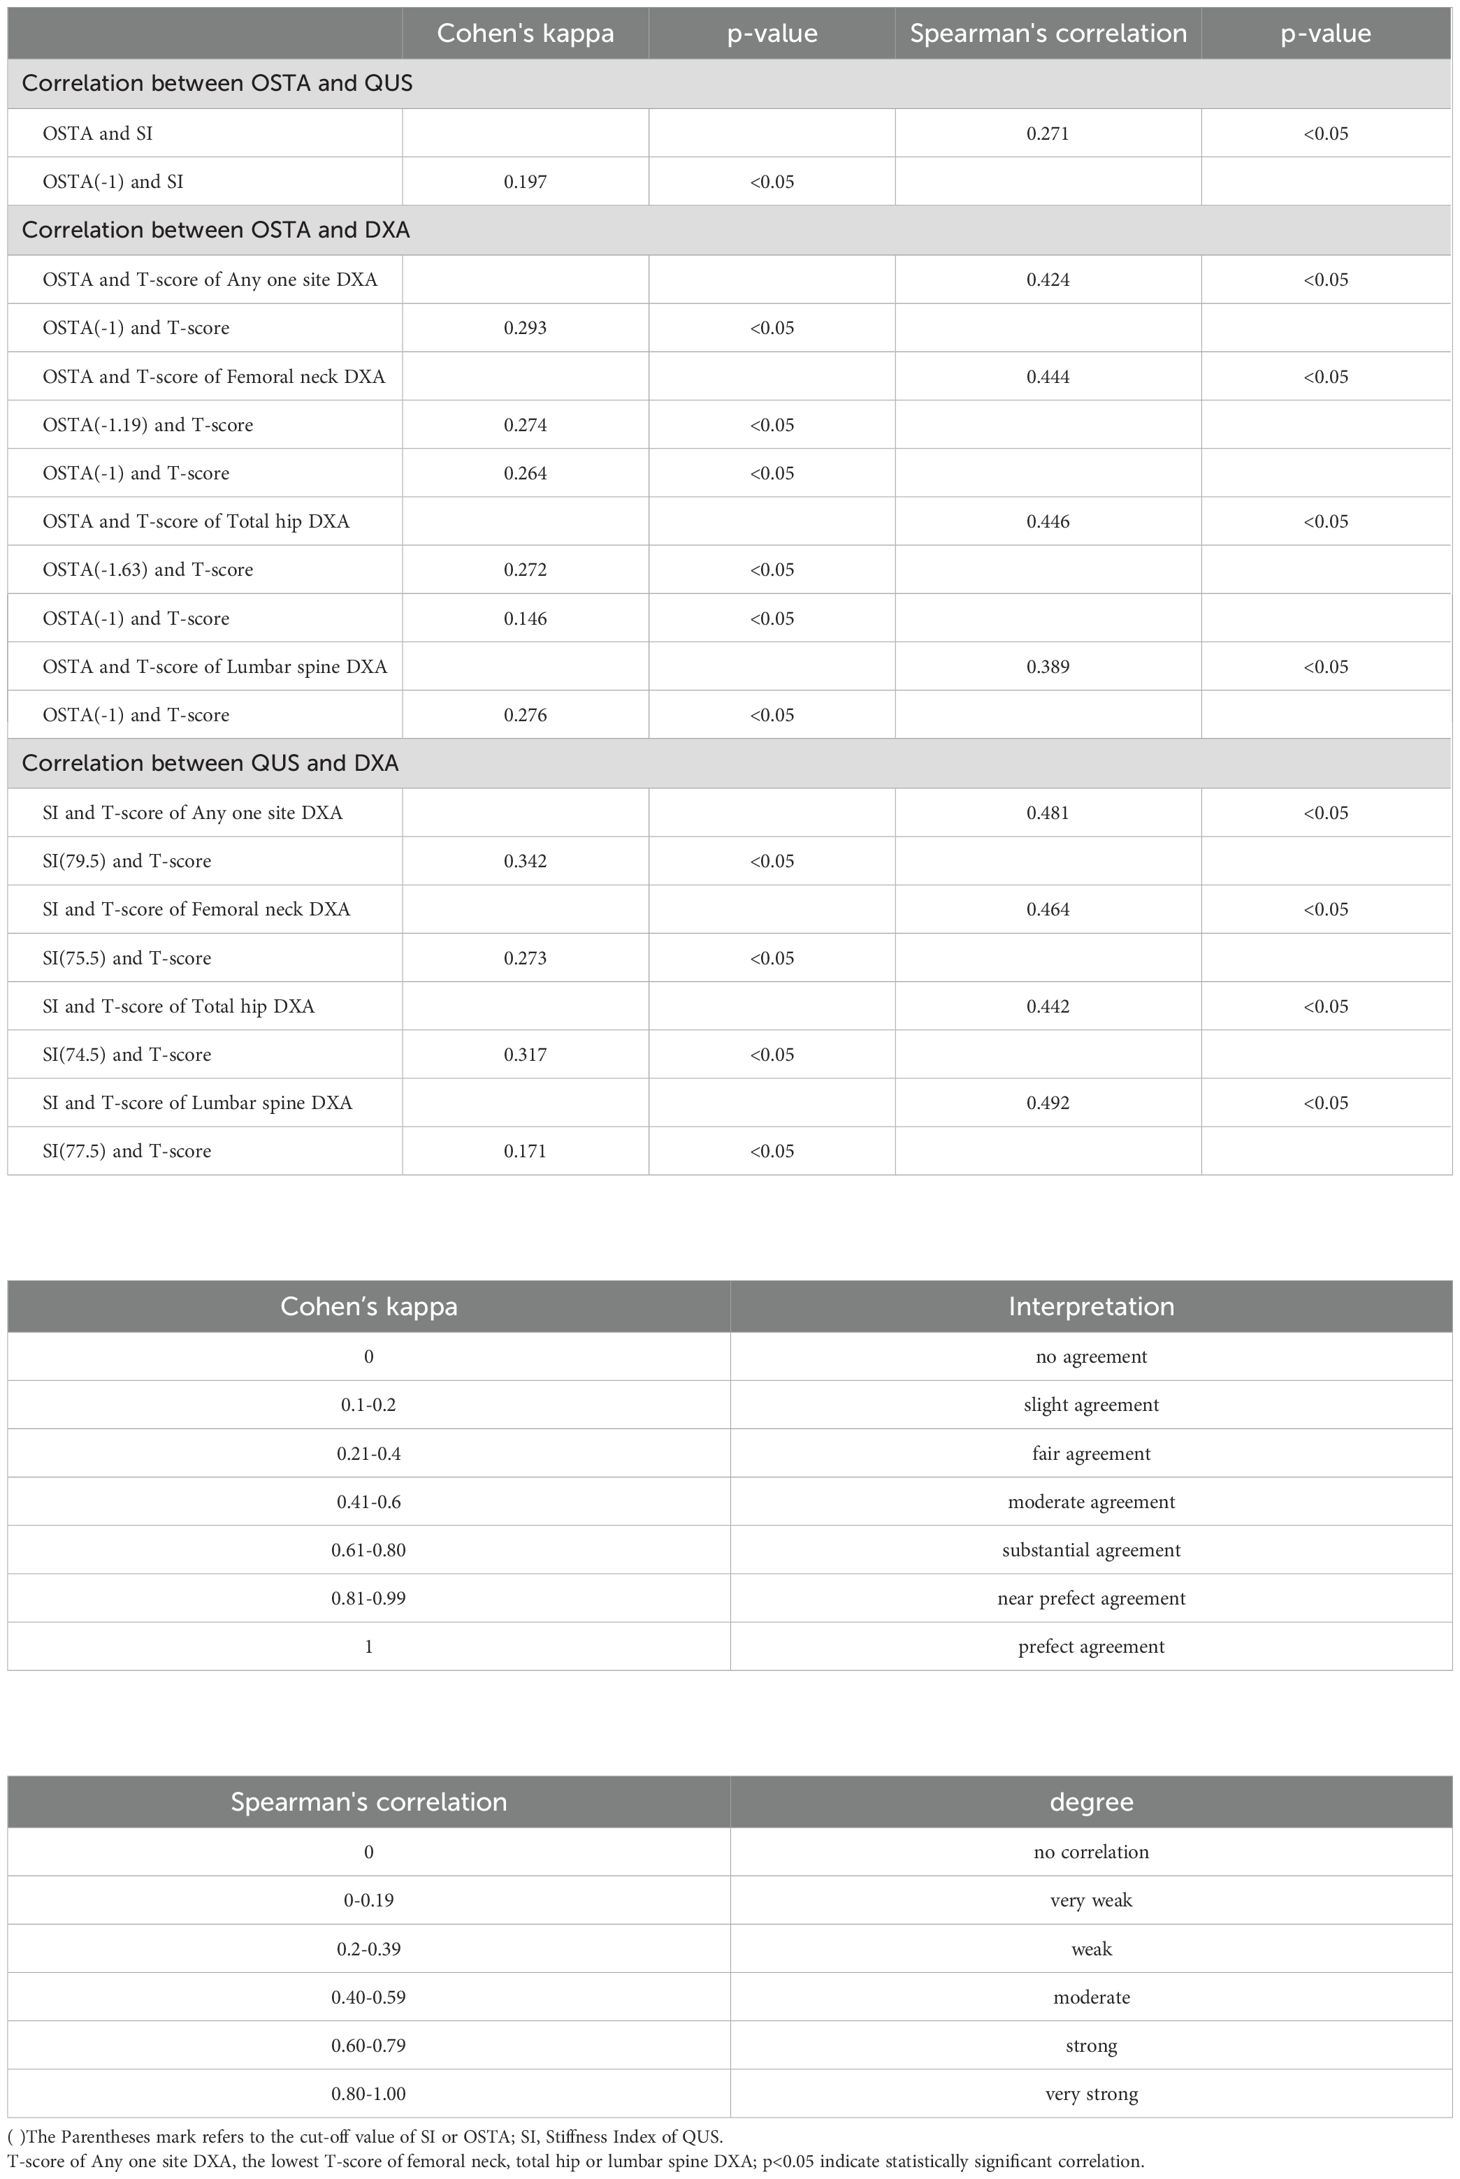
Table 7. The agreement and correlation between OSTA, QUS and DXA T-score at different sites.
The k and rs between QUS and DXA were better than those between OSTA and DXA under WHO osteoporosis definition (p<0.05) in Table 7. This means QUS rather than OSTA had a stronger correlation with DXA. After comparing AUCs, sensitivity, and NPV by Delong’s test and McNemar’s test, QUS outperformed OSTA with superior AUC, sensitivity, and NPV in primary osteoporosis screening of Taiwanese postmenopausal women under WHO osteoporosis definition (AUC, sensitivity, NPV of QUS and OSTA are 0.737, 68.6%, 66.0%, and 0.703, 61.9%, 62.2%; p<0.05). According to the Kung AW et al. study in Hong Kong, OSTA had better AUC, sensitivity, NPV, and rs with femoral neck DXA than QUS in primary osteoporosis screening of postmenopausal women for femoral neck DXA-determined osteoporosis (AUC, sensitivity, NPV, and rs of OSTA and QUS are 0.80, 88.0%, 94.2%, 0.62 and 0.78, 81.0%, 92.7%, 0.36; the cut-off value of OSTA and QUS SI are -1 and 75.7). However, the capability of OSTA to detect osteoporosis was comparable to QUS with no statistical difference in the AUC comparison between OSTA and QUS (P>0.05) (17). The above result of Kung AW et al. study was similar to this study, in that the capability of OSTA to detect osteoporosis was comparable to QUS, with comparable AUC, superior sensitivity and NPV, and inferior rs with femoral neck BMD in postmenopausal women for femoral neck DXA-determined osteoporosis (the cut-off value of OSTA and QUS SI are -1 and 75.5). This means that QUS outperformed OSTA in primary osteoporosis screening of Taiwanese postmenopausal women under WHO osteoporosis definition and the capability of OSTA to detect primary osteoporosis in Taiwanese postmenopausal women was comparable to QUS for femoral neck DXA-determined osteoporosis.
The QUS and OSTA had better moderate to high AUC and sensitivity, and extremely high NPV for identifying middle-aged and elderly postmenopausal women at the risk of primary osteoporosis as defined by DXA at the proximal femoral site rather than the lumbar spine site. Kung AW et al. and Trimpou, Penelope, et al. conducted similar results as this study (17, 27). Chen et al. found that the rs between QUS or OSTA and femoral neck BMD are better than between either and lumbar BMD (16). The above findings suggest that OSTA and QUS may predict primary osteoporosis risk in postmenopausal women more reliably at proximal femoral BMD rather than lumbar BMD. The reasons may be that lumbar BMD is affected by vertebral fractures, degenerative changes with osteophyte formation, calcification of the anterior longitudinal ligament, hyperostosis, kyphosis, intervertebral disc calcification, vascular calcification, and abdominal aortic calcification when measured by the DXA method, and its bone density may not decrease with age (28).
After further age-stratified analysis, whether osteoporosis is diagnosed according to WHO definition, femoral neck, total hip, or lumbar spine DXA T-score ≤ -2.5, QUS is more effective for osteoporosis screening in women aged 45 to 65 with better NPV than OSTA. OSTA is more effective for osteoporosis screening in women aged 66 to 80 with better NPV than QUS. Chen et al. showed that OSTA outperformed QUS with better AUC, sensitivity, NPV, and rs in Taiwanese postmenopausal women over 60 years old for femoral neck DXA-determined osteoporosis (16) which is similar to and echoes the statistical results of women aged 66 - 80 in this study. QUS and OSTA indices were significantly correlated with DXA in the research and previous studies (8, 16, 17, 27, 29–32). Soft tissues and edema at the heel can artificially reduce the transmission of ultrasound across the calcaneus. Furthermore, the SI of QUS is influenced by skeletal microstructures and bone strength, which DXA does not capture (11). Persistent swelling in feet or ankles particularly over 60 - 70 years old (33). These factors may weaken the agreement between QUS and DXA or QUS and OSTA, particularly in individuals over 60 - 70 years old.
The strengths of this study include a larger participant pool than most surveys of Taiwanese postmenopausal women, which enhances reliability (16, 34). A single ISCD-certified technician used the same DXA and QUS machines for consistent BMD and SI measurements, eliminating inter-modality and inter-operator variations. Notably, this research uses DXA as the diagnostic benchmark for osteoporosis diagnosis to assess the effectiveness of OSTA and QUS in screening Taiwanese postmenopausal women. In contrast, recent studies have mainly compared osteoporosis screening tools with osteoporosis diagnosis using QUS, rarely using DXA (16, 17, 25, 26, 34, 35).
The limitations of the study include the fact that the sample was not randomly selected. The participants were primarily recruited through the Taiwan Biobank and healthcare providers. This recruitment method may have resulted in a higher osteoporosis rate of 51.89% in this study compared to a previous investigation, which found a prevalence rate of 38.3% for osteoporosis at any site among Taiwanese women aged 50 years and older (36). However, the optimal cut-off value of the study for OSTA was established as -1 under WHO definition of osteoporosis or for lumbar DXA-determined osteoporosis. This aligns with the original formula proposed by Koh et al. (8). Notably, the study identified an optimal cut-off value of 79.5 for QUS SI under the WHO definition of osteoporosis, which is close to the 78 reported by Hans et al. (37); the optimal cut-off value of QUS SI for femoral neck DXA-determined osteoporosis was set at 75.5, which is similar to the 75.7 found by Kung et al. (17). Additionally, the study is a cross-sectional study; whether the OSTA or QUS could predict the future fracture risk of Taiwanese postmenopausal women needs further prospective cohort investigation. Finally, the study is limited to Taiwanese subjects geographically.
5 Conclusion
Compared to DXA, QUS and OSTA are radiation-free, portable, less expensive and time-consuming, and effective clinical risk assessment tools for detecting primary osteoporosis in Taiwanese postmenopausal women.
The study disclosed that OSTA and QUS may predict primary osteoporosis risk in Taiwanese postmenopausal women more reliably at proximal femoral BMD rather than lumbar BMD. Both could independently screen and track the women at primary osteoporosis risk but not replace DXA for osteoporosis diagnosis. However, they couldn’t screen and track the women at primary osteoporosis risk interchangeably because their agreement is minimal.
For primary osteoporosis screening of Taiwanese postmenopausal women in this study, QUS outperformed OSTA with significantly superior AUC, sensitivity, and NPV (all p<0.05) under WHO osteoporosis definition. For DXA-determined osteoporosis of total hip or lumbar spine with T-score ≤ -2.5, QUS outperformed OSTA with significantly superior AUC and specificity (all p<0.05). For femoral neck DXA-determined osteoporosis with T-score ≤ -2.5, the capability of OSTA to detect primary osteoporosis was comparable to QUS with comparable AUC (p>0.05), superior sensitivity (p<0.05), and superior NPV (p<0.05).
After further age-stratified analysis for detecting primary osteoporosis in Taiwanese postmenopausal women, whether osteoporosis is diagnosed according to WHO definition, femoral neck, total hip, or lumbar spine DXA T-score ≤ -2.5, QUS outperformed OSTA with superior sensitivity and NPV in those aged 45 - 65 (all p<0.05, except for femoral neck and total hip with p>0.05), while OSTA outperformed QUS with superior sensitivity and NPV in those aged 66 - 80 (all p<0.05, except NPV under WHO definition with p>0.05). According to the above finding, DXA scanning was suggested to confirm osteoporosis if the participant has an osteoporosis result after OSTA or QUS screening.
Whether OSTA or QUS could predict the future fracture risk of postmenopausal women needs further large-scale prospective cohort investigation, categorized more finely by age group.
Data availability statement
The raw data supporting the conclusions of this article will be made available by the authors, without undue reservation.
Ethics statement
This study was approved by the Institutional Review Board (IRB) of China Medical University Hospital (CMUH110-REC2-065) and the Taiwan Biobank IRB (TWBR11008-02). The studies were conducted in accordance with the local legislation and institutional requirements. Written informed consent for participation was not required from the participants or the participants’ legal guardians/next of kin in accordance with the national legislation and institutional requirements.
Author contributions
DL: Conceptualization, Data curation, Formal analysis, Investigation, Methodology, Writing – original draft. CL: Software, Supervision, Writing – review & editing. PW: Conceptualization, Project administration, Resources, Supervision, Validation, Writing – review & editing.
Funding
The author(s) declare financial support was received for the research and/or publication of this article. China Medical University Hospital supported this work, grant number DMR-111-174.
Conflict of interest
The authors declare that the research was conducted in the absence of any commercial or financial relationships that could be construed as a potential conflict of interest.
Generative AI statement
The author(s) declare that no Generative AI was used in the creation of this manuscript.
Any alternative text (alt text) provided alongside figures in this article has been generated by Frontiers with the support of artificial intelligence and reasonable efforts have been made to ensure accuracy, including review by the authors wherever possible. If you identify any issues, please contact us.
Publisher’s note
All claims expressed in this article are solely those of the authors and do not necessarily represent those of their affiliated organizations, or those of the publisher, the editors and the reviewers. Any product that may be evaluated in this article, or claim that may be made by its manufacturer, is not guaranteed or endorsed by the publisher.
References
1. United Nations, Department of Economic and Social Affairs, Population Division. World population ageing 2015 - highlights (ST/ESA/SER.A/368). New York: United Nations Press (2015).
2. Van Staa T, Dennison E, Leufkens Ha, and Cooper C. Epidemiology of fractures in England and Wales. Bone. (2001) 29:517–22. doi: 10.1016/S8756-3282(01)00614-7
3. Papaioannou A, Morin S, Cheung AM, Atkinson S, Brown JP, Feldman S, et al. 2010 Clinical practice guidelines for the diagnosis and management of osteoporosis in Canada: summary. Cmaj. (2010) 182:1864–73. doi: 10.1503/cmaj.100771
4. Kannus P, Sievänen H, Palvanen M, Järvinen T, and Parkkari J. Prevention of falls and consequent injuries in elderly people. Lancet. (2005) 366:1885–93. doi: 10.1016/S0140-6736(05)67604-0
5. Lewiecki E. Clinical applications of bone density testing for osteoporosis. Minerva Medica. (2005) 96:317–30.
6. Siris E, Adler R, Bilezikian J, Bolognese M, Dawson-Hughes B, Favus M, et al. The clinical diagnosis of osteoporosis: a position statement from the National Bone Health Alliance Working Group. Osteoporos Int. (2014) 25:1439–43. doi: 10.1007/s00198-014-2655-z
7. Edelmann-Schäfer B, Berthold LD, Stracke H, Lührmann PM, and Neuhäuser-Berthold M. Identifying elderly women with osteoporosis by spinal dual X-ray absorptiometry, calcaneal quantitative ultrasound and spinal quantitative computed tomography: a comparative study. Ultrasound Med Biol. (2011) 37:29–36. doi: 10.1016/j.ultrasmedbio.2010.10.003
8. Koh L, Ben Sedrine W, Torralba T, Kung A, Fujiwara S, Chan S, et al. A simple tool to identify Asian women at increased risk of osteoporosis. Osteoporos Int. (2001) 12:699–705. doi: 10.1007/s001980170070
9. McLeod KM and Johnson CS. Identifying women with low bone mass: a systematic review of screening tools. Geriatr Nursing. (2009) 30:164–73. doi: 10.1016/j.gerinurse.2008.07.003
10. Rubin KH, Friis-Holmberg T, Hermann AP, Abrahamsen B, and Brixen K. Risk assessment tools to identify women with increased risk of osteoporotic fracture: complexity or simplicity? A systematic review. J Bone Mineral Res. (2013) 28:1701–17. doi: 10.1002/jbmr.1956
11. Chin K-Y and Ima-Nirwana S. Calcaneal quantitative ultrasound as a determinant of bone health status: what properties of bone does it reflect? Int J Med Sci. (2013) 10:1778. doi: 10.7150/ijms.6765
12. Roux C and Dougados M. Quantitative ultrasound in postmenopausal osteoporosis. Curr Opin Rheumatol. (2000) 12:336–45. doi: 10.1097/00002281-200007000-00018
13. Nayak S, Olkin I, Liu H, Grabe M, Gould MK, Allen IE, et al. Meta-analysis: accuracy of quantitative ultrasound for identifying patients with osteoporosis. Ann Internal Med. (2006) 144:832–41. doi: 10.7326/0003-4819-144-11-200606060-00009
14. Thomsen K, Jepsen DB, Matzen L, Hermann A, Masud T, and Ryg J. Is calcaneal quantitative ultrasound useful as a prescreen stratification tool for osteoporosis? Osteoporos Int. (2015) 26:1459–75. doi: 10.1007/s00198-014-3012-y
15. Hans D and Krieg M-A. The clinical use of quantitative ultrasound (QUS) in the detection and management of osteoporosis. IEEE Trans Ultrason Ferroelectr Freq Control. (2008) 55:1529–38. doi: 10.1109/TUFFC.2008.829
16. Chen S-J, Chen Y-J, Cheng C-H, Hwang H-F, Chen C-Y, and Lin M-R. Comparisons of different screening tools for identifying fracture/osteoporosis risk among community-dwelling older people. Medicine. (2016) 95:e3415. doi: 10.1097/MD.0000000000003415
17. Kung AW, Ho AY, Sedrine WB, Reginster J-Y, and Ross PD. Comparison of a simple clinical risk index and quantitative bone ultrasound for identifying women at increased risk of osteoporosis. Osteoporos Int. (2003) 14:716–21. doi: 10.1007/s00198-003-1428-x
18. Yen C-C, Lin W-C, Wang T-H, Chen G-F, Chou D-Y, Lin D-M, et al. Pre-screening for osteoporosis with calcaneus quantitative ultrasound and dual-energy X-ray absorptiometry bone density. Sci Rep. (2021) 11:15709. doi: 10.1038/s41598-021-95261-7
19. Crandall CJ. Risk assessment tools for osteoporosis screening in postmenopausal women: a systematic review. Curr Osteoporos Rep. (2015) 13:287–301. doi: 10.1007/s11914-015-0282-z
20. Youden WJ. Index for rating diagnostic tests. Cancer. (1950) 3:32–5. doi: 10.1002/1097-0142(1950)3:1<32::AID-CNCR2820030106>3.0.CO;2-3
21. Kanis JA and Kanis J. Assessment of fracture risk and its application to screening for postmenopausal osteoporosis: synopsis of a WHO report. Osteoporos Int. (1994) 4:368–81. doi: 10.1007/BF01622200
22. Hwang J-S, Chan D-C, Chen J-F, Cheng T-T, Wu C-H, Soong Y-K, et al. Clinical practice guidelines for the prevention and treatment of osteoporosis in Taiwan: summary. J Bone Mineral Metab. (2014) 32:10–6. doi: 10.1007/s00774-013-0495-0
23. Watts NB, Leslie WD, Foldes AJ, and Miller PD. 2013 International Society for Clinical Densitometry position development conference: task force on normative databases. J Clin Densitom. (2013) 16:472–81. doi: 10.1016/j.jocd.2013.08.001
24. Zhu W, Zeng N, and Wang N eds. Sensitivity, specificity, accuracy, associated confidence interval and ROC analysis with practical SAS implementations. Baltimore, MD: NESUG Proc: Health Care and Life Sciences (2010).
25. Gao C, Song H, Chen B, Zhang Z, and Yue H. The assessment of the osteoporosis self-assessment tool for Asians and calcaneal quantitative ultrasound in identifying osteoporotic fractures and falls among Chinese people. Front Endocrinol. (2021) 12:684334. doi: 10.3389/fendo.2021.684334
26. Chin K-Y, Low NY, Kamaruddin AAA, Dewiputri WI, and Soelaiman I-N. Agreement between calcaneal quantitative ultrasound and osteoporosis self-assessment tool for Asians in identifying individuals at risk of osteoporosis. Ther Clin Risk Manage. (2017) 13:1333–41. doi: 10.2147/TCRM.S145519
27. Trimpou P, Bosaeus I, Bengtsson B-Å, and Landin-Wilhelmsen K. High correlation between quantitative ultrasound and DXA during 7 years of follow-up. Eur J Radiol. (2010) 73:360–4. doi: 10.1016/j.ejrad.2008.11.024
28. Muraki S, Yamamoto S, Ishibashi H, Horiuchi T, Hosoi T, Orimo H, et al. Impact of degenerative spinal diseases on bone mineral density of the lumbar spine in elderly women. Osteoporos Int. (2004) 15:724–8. doi: 10.1007/s00198-004-1600-y
29. Cortet B, Boutry N, Dubois P, Legroux-Gerot I, Cotten A, and Marchandise X. Does quantitative ultrasound of bone reflect more bone mineral density than bone microarchitecture? Calcified Tissue Int. (2004) 74:60–7. doi: 10.1007/s00223-002-2113-3
30. Padilla F, Jenson F, Bousson V, Peyrin F, and Laugier P. Relationships of trabecular bone structure with quantitative ultrasound parameters: In vitro study on human proximal femur using transmission and backscatter measurements. Bone. (2008) 42:1193–202. doi: 10.1016/j.bone.2007.10.024
31. Subramaniam S, Chan C-Y, Soelaiman I-N, Mohamed N, Muhammad N, Ahmad F, et al. The performance of osteoporosis self-assessment tool for Asians (OSTA) in identifying the risk of osteoporosis among Malaysian population aged 40 years and above. Arch Osteoporos. (2019) 14:117. doi: 10.1007/s11657-019-0666-2
32. Huang J-Y, Song W-Z, Zeng H-R, Huang M, and Wen Q-F. Performance of the Osteoporosis Self-Assessment Tool for Asians (OSTA) in screening osteoporosis among middle-aged and old women in the Chengdu region of China. J Clin Densitom. (2015) 18:539–45. doi: 10.1016/j.jocd.2015.01.001
33. Besharat S, Grol-Prokopczyk H, Gao S, Feng C, Akwaa F, and Gewandter JS. Peripheral edema: A common and persistent health problem for older Americans. PloS One. (2021) 16:e0260742. doi: 10.1371/journal.pone.0260742
34. Yang N-P, Lin T, Wang C-S, and Chou P. Correlation of osteoporosis screening by quantitative ultrasound of calcaneus and Osteoporosis Self-Assessment Tool for Asians in Taiwanese. J Formosan Med Assoc Taiwan yi zhi. (2004) 103:130–6.
35. Sherchan B, Lamichhane A, and Mahara DP. Osteoporosis self assessment tool for Asian (OSTA) index in comparison to quantitative ultrasound of the calcaneal in predicting low bone density. Nepal Orthop Assoc J. (2013) 3:20–5. doi: 10.3126/noaj.v3i2.9524
36. Tu S-H, Chen C, Hsieh Y-T, Chang H-Y, Yeh C-J, Lin Y-C, et al. Design and sample characteristics of the 2005-2008 Nutrition and Health Survey in Taiwan. Asia Pac J Clin Nutr. (2011) 20:225–37.
Keywords: osteoporosis self-assessment tool for Asians (OSTA), calcaneal quantitative ultrasound (QUS), osteoporosis, postmenopausal women, dual-energy X-ray absorptiometry (DXA)
Citation: Liu D-H, Lin C-S and Wu P-C (2025) Osteoporosis self-assessment tool for Asians and calcaneal quantitative ultrasound for identifying primary osteoporosis in Taiwanese postmenopausal women. Front. Endocrinol. 16:1639176. doi: 10.3389/fendo.2025.1639176
Received: 03 June 2025; Accepted: 20 August 2025;
Published: 12 September 2025.
Edited by:
Kok Yong Chin, National University of Malaysia, MalaysiaReviewed by:
Khemipa Sanklaa, Thammasat University - Rangsit Campus, ThailandFiliz Ozyigit, Bandirma Onyedi Eylül University, Türkiye
Copyright © 2025 Liu, Lin and Wu. This is an open-access article distributed under the terms of the Creative Commons Attribution License (CC BY). The use, distribution or reproduction in other forums is permitted, provided the original author(s) and the copyright owner(s) are credited and that the original publication in this journal is cited, in accordance with accepted academic practice. No use, distribution or reproduction is permitted which does not comply with these terms.
*Correspondence: Pei-Ching Wu, cmFyYWJlYXJAZ21haWwuY29t