 Yaping Wang1
 He Zhu
 Xiangming Tang
- 1Department of Electrocardiogram, Yangzhou Wutaishan Hospital of Jiangsu Province, Teaching Hospital of Yangzhou University, Yangzhou, China
- 2Department of Ultrasound, Yangzhou Wutaishan Hospital of Jiangsu Province, Teaching Hospital of Yangzhou University, Yangzhou, China
- 3Department of Clinical Laboratory, Yangzhou Wutaishan Hospital of Jiangsu Province, Teaching Hospital of Yangzhou University, Yangzhou, China
- 4Department of Psychiatry, Yangzhou Wutaishan Hospital of Jiangsu Province, Teaching Hospital of Yangzhou University, Yangzhou, China
- 5Department of Thoracic Surgery, The Affiliated Taizhou People’s Hospital of Nanjing Medical University, Taizhou School of Clinical Medicine, Nanjing Medical University, Taizhou, China
- 6Phase I Clinical Research Center, Taizhou School of Clinical Medicine, Nanjing Medical University, Taizhou, China
- 7Department of Neurology, The Affiliated Taizhou People’s Hospital of Nanjing Medical University, Taizhou School of Clinical Medicine, Nanjing Medical University, Taizhou, China
Background: Non-alcoholic fatty liver disease (NAFLD) is the most prevalent liver disease globally. NAFLD increases the risk of type 2 diabetes mellitus (T2DM) while lacking clinical predictors. This study aims to investigate the characteristics and clinical significance of the uric acid (UA) to high-density lipoprotein cholesterol ratio (UHR) and electrocardiogram (ECG) parameters in NAFLD patients, both with and without T2DM.
Methods: We compared 102 NAFLD with T2DM (NAFLD-T2DM) cases to 113 NAFLD without T2DM (NAFLD-nT2DM) cases. Baseline data and biochemical indicators, including UHR, were collected and analyzed in each group. A 12-lead ECG was used to collect parameters that were compared between the two groups. Multivariate logistic regression analysis was employed to identify factors influencing NAFLD with T2DM. Receiver operating characteristic (ROC) curves were utilized to assess the clinical value of UHR combined with ECG parameters in identifying T2DM risk among NAFLD patients.
Results: Compared to the NAFLD-nT2DM group, the NAFLD-T2DM group exhibited significantly higher levels of triglycerides (TG), fasting plasma glucose (FPG), UA, and UHR, while aspartate aminotransferase (AST) levels were lower (P < 0.05). The incidence of ST-T changes, heart rate, and P wave duration was also higher in the NAFLD-T2DM group, whereas the QT interval was shorter (P < 0.05). Multivariate logistic regression analysis revealed that UHR, ST-T changes, heart rate, QT interval, and P wave duration are independent factors associated with the incidence of T2DM in NAFLD. ROC curve analysis indicated that the area under the curve (AUC) for the combination of five variables in predicting T2DM in NAFLD was 0.949 (95% CI: 0.905-0.977, P < 0.05), with a sensitivity of 91.96% and a specificity of 93.55%, significantly superior to those of individual indicators.
Conclusion: UHR and ECG parameters are associated with T2DM in NAFLD patients. The combination of UHR and ECG parameters demonstrates predictive value for the incidence of T2DM in NAFLD patients. Clinical attention should be directed toward the levels of UHR and ECG parameters in NAFLD with T2DM.
1 Introduction
The advancement of the social economy, improvements in living conditions, and lifestyle changes increase the incidence of multiple chronic diseases, including hypertension, diabetes, and non-alcoholic fatty liver disease (NAFLD). NAFLD is defined as a clinical syndrome primarily characterized by the accumulation of fat in hepatocytes when excluding alcohol consumption and other contributing factors (1). Approximately 25% of adults worldwide are affected by NAFLD (2), with prevalence in Asia ranging from 15% to 40% (3). Studies suggest that by 2030, more than 300 million individuals in China, over 100 million in the United States, and 15 to 20 million in major European countries will be affected by NAFLD (4). As the most common chronic liver disease, NAFLD may also play a significant role in the progression of chronic liver disease to cirrhosis and liver cancer (5). The primary pathological features of NAFLD include hepatocellular edema, steatosis, inflammation, and varying degrees of hepatic fibrosis (6). The pathological change of NAFLD is partially reversible, therefore, early disease management is crucial for preventing and halting the progression of chronic liver disease to more severe stages, such as cirrhosis and liver cancer. Despite significant progress in understanding the pathogenesis of NAFLD, effective therapies remain limited in clinical practice (7). Consequently, enhancing the prevention and managing comorbidities are particularly important in the clinical approach to preventing and treating NAFLD.
NAFLD frequently coexists with various comorbidities, particularly type 2 diabetes mellitus (T2DM). Studies indicate that these two conditions mutually influence one another, complicating disease management and elevating the risk of several chronic diseases, including cardiovascular disease, diabetes-related microvascular complications, chronic kidney disease, and autonomic neuropathy (8, 9). It is well-known that T2DM is primarily characterized by inadequate insulin secretion and insulin resistance (IR), which arise from a combination of genetic and environmental factors (10). IR plays a central role in the pathogenesis of T2DM and is closely associated with obesity. Studies have shown that patients with both NAFLD and T2DM often suffer from obesity, hyperlipidemia, and increased body mass index (11). In obese individuals, excessive free fatty acids are converted into triglycerides in the liver, leading to hypoxia in adipocytes and chronic inflammation that affects insulin target cells, thereby inhibiting insulin signaling and contributing to IR (11). IR can lead to hyperinsulinemia, which diminishes lipid utilization and promotes lipid synthesis in the liver. Consequently, patients with NAFLD frequently exhibit IR, heightening their risk of developing diabetes (11). Therefore, IR may represent a common pathophysiological mechanism linking T2DM and NAFLD (12). On the other hand, studies employing magnetic resonance imaging to assess hepatic steatosis and cirrhosis have revealed a high prevalence of NAFLD and advanced fibrosis among diabetic patients (13). This evidence shows the interconnectedness of diabetes and NAFLD, which collectively impact patient prognosis. A clinical study investigated the risk of cirrhosis and hepatocellular carcinoma in patients with NAFLD, identifying diabetes as an independent predictor of adverse liver outcomes (14). Furthermore, the presence of NAFLD in diabetic patients is associated with an increased risk of secondary complications such as retinopathy, nephropathy, and cardiovascular disease (CVD), thereby contributing to higher mortality rates (8). Therefore, the interaction between T2DM and NAFLD accelerates disease progression and heightens the risk of adverse events in both hepatic and extrahepatic tissues and organs. Although emerging studies suggest that NAFLD may elevate the risk of T2DM (15), there remains a notable lack of therapeutic strategies for NAFLD and reliable evaluation indicators for assessing the risk of T2DM in affected patients. Above all, the development of a specific evaluation approach is essential for early identification, effective prevention, and treatment, ultimately improving patient outcomes.
Uric acid (UA) is the final product of purine metabolism, specifically from adenine and guanine in humans. Hyperuricemia can occur when UA production is excessive or renal excretion of UA is diminished. This condition not only contributes to the development of cardiovascular diseases and chronic kidney disease but may also accelerate the progression of these disorders (16). Studies have demonstrated that UA can promote inflammatory responses and oxidative stress (17). High-density lipoprotein cholesterol (HDL-C), primarily synthesized in the liver, is recognized as an anti-atherosclerotic lipoprotein that facilitates the transport of cholesterol from extrahepatic tissues to the liver for metabolism, serving as a protective factor against CVD (18). Emerging studies have indicated that the uric acid to high-density lipoprotein cholesterol ratio (UHR) may function as an emerging biomarker for assessing the body’s state of inflammatory and oxidative stress (19). Furthermore, UHR has been closely associated with various vascular and metabolic diseases, including coronary heart disease, NAFLD, and T2DM (20, 21). In addition to serum biomarkers, our previous study and others demonstrated that electrocardiography (ECG) is a non-invasive and convenient method for cardiac assessment, with certain ECG parameters serving as biomarkers to evaluate the severity and prognosis of coronary heart disease and other cardiovascular and cerebrovascular disorders (22–26). In light of these findings, the primary objective of this study is to explore the association between UHR and ECG parameters in patients with NAFLD and T2DM, as well as to investigate the clinical predictive value of these biomarkers in predicting the risk of T2DM in individuals with NAFLD, thereby providing a scientific basis for the disease prevention and treatment.
2 Materials and methods
2.1 Study subjects
Two hundred and fifteen newly diagnosed NAFLD patients admitted to the short-term rehabilitation center of our hospital from July 2023 to October 2024 were included as subjects for this study. Subjects were categorized into two groups based on the presence of T2DM: the NAFLD with T2DM group (NAFLD-T2DM group, n=102) and the NAFLD without T2DM group (NAFLD-nT2DM group, n=113). The diagnosis of NAFLD was based on the typical imaging changes underwent a liver ultrasound which included (1): increased near-field ultrasound beam in the liver (2), attenuated far-field ultrasound beam in the liver (3), unclear display of intrahepatic structures, after excluding other forms of liver disease (27). For the diagnosis of T2DM, the patients met the criteria established by the American Diabetes Association (28). Exclusion Criteria (1): Type 1 diabetes or secondary diabetes (2). Malignant tumors, severe infectious diseases, or acute complications of diabetes (3). Male subjects with an ethanol intake of ≥140 g per week, or those with other severe liver diseases (such as drug-induced liver injury, viral hepatitis, liver cirrhosis, liver cancer, autoimmune hepatitis, etc.) (4). Patients with severe damage to the heart, brain, kidneys, or other organs (5). Patients currently using medications that affect blood lipids, uric acid, or hepatic steatosis. This study received approval from the hospital ethics committee (WTSLL2024007) and was registered with the National Medical Research Registry System (MR-32-24-051272). All participants provided informed consent.
2.2 Methods
2.2.1 Data collection and measurement
After 10 minutes of seated rest, all participants had their systolic and diastolic blood pressures measured using a standard mercury sphygmomanometer. Both groups of participants fasted for 8–10 hours, and 5 mL of venous blood was collected from each participant the following morning. An automatic biochemical analyzer was used to measure the levels of triacylglycerol (TG), total cholesterol (TC), aspartate aminotransferase (AST), alanine aminotransferase (ALT), serum creatinine (Scr), uric acid (UA), fasting plasma glucose (FPG), low-density lipoprotein cholesterol (LDL-C), high-density lipoprotein cholesterol (HDL-C), apolipoprotein A1 (ApoA1), apolipoprotein B (ApoB), lipoprotein (a) (Lpa), cystatin C (Cys-C), and small dense LDL cholesterol (sdLDL-C). The UHR was determined as the ratio of UA to HDL-C.
2.2.2 ECG examination
An ECG examination was performed using the MAC800 ECG machine from GE Healthcare. Participants were instructed to lie in a supine position with their chests fully exposed. The skin was cleaned with an alcohol swab. After the participants were asked to breathe calmly, the ECG was recorded at a paper speed of 25 mm/s and a gain of 10 mm/mV. The analysis of the ECG results was conducted by a professional electrocardiographer with intermediate or higher qualifications.
2.2.3 Statistical analysis
Data were analyzed using SPSS 25.0 software. For normally distributed continuous data, results were expressed as mean ± SD, and comparisons between the two groups were conducted using the independent samples t-test. For continuous data that did not follow a normal distribution, results were presented as a median and interquartile range, and comparisons between groups were performed using the Mann-Whitney U test. Categorical data were expressed as frequencies, and comparisons were made using the chi-square test. Variables that demonstrated statistical significance in the univariate analysis were further analyzed using multivariate logistic regression analysis. Receiver operating characteristic (ROC) curves were generated using MedCalc 22.0 software to assess the predictive value of each indicator for NAFLD combined with T2DM. A value of P < 0.05 was considered statistically significant.
3 Results
As shown in Table 1, we initially compared the general and biochemical data between the two groups of patients. Among the 215 participants, 102 were classified in the NAFLD-T2DM group, with a mean age of 63.87 ± 4.43 years, and 113 were in the NAFLD-nT2DM group, with a mean age of 63.59 ± 4.90 years. No statistically significant differences were observed between the two groups regarding age, systolic blood pressure (SBP), diastolic blood pressure (DBP), TC, LDL-C, HDL-C, ApoA1, ApoB, Lpa, Cys-C, sdLDL-C, ALT, and Scr. However, levels of TG, FPG, UA, and UHR were significantly higher in the NAFLD-T2DM group compared to the NAFLD-nT2DM group (P < 0.05). Conversely, the level of AST was significantly lower in the NAFLD-T2DM group (P < 0.05).
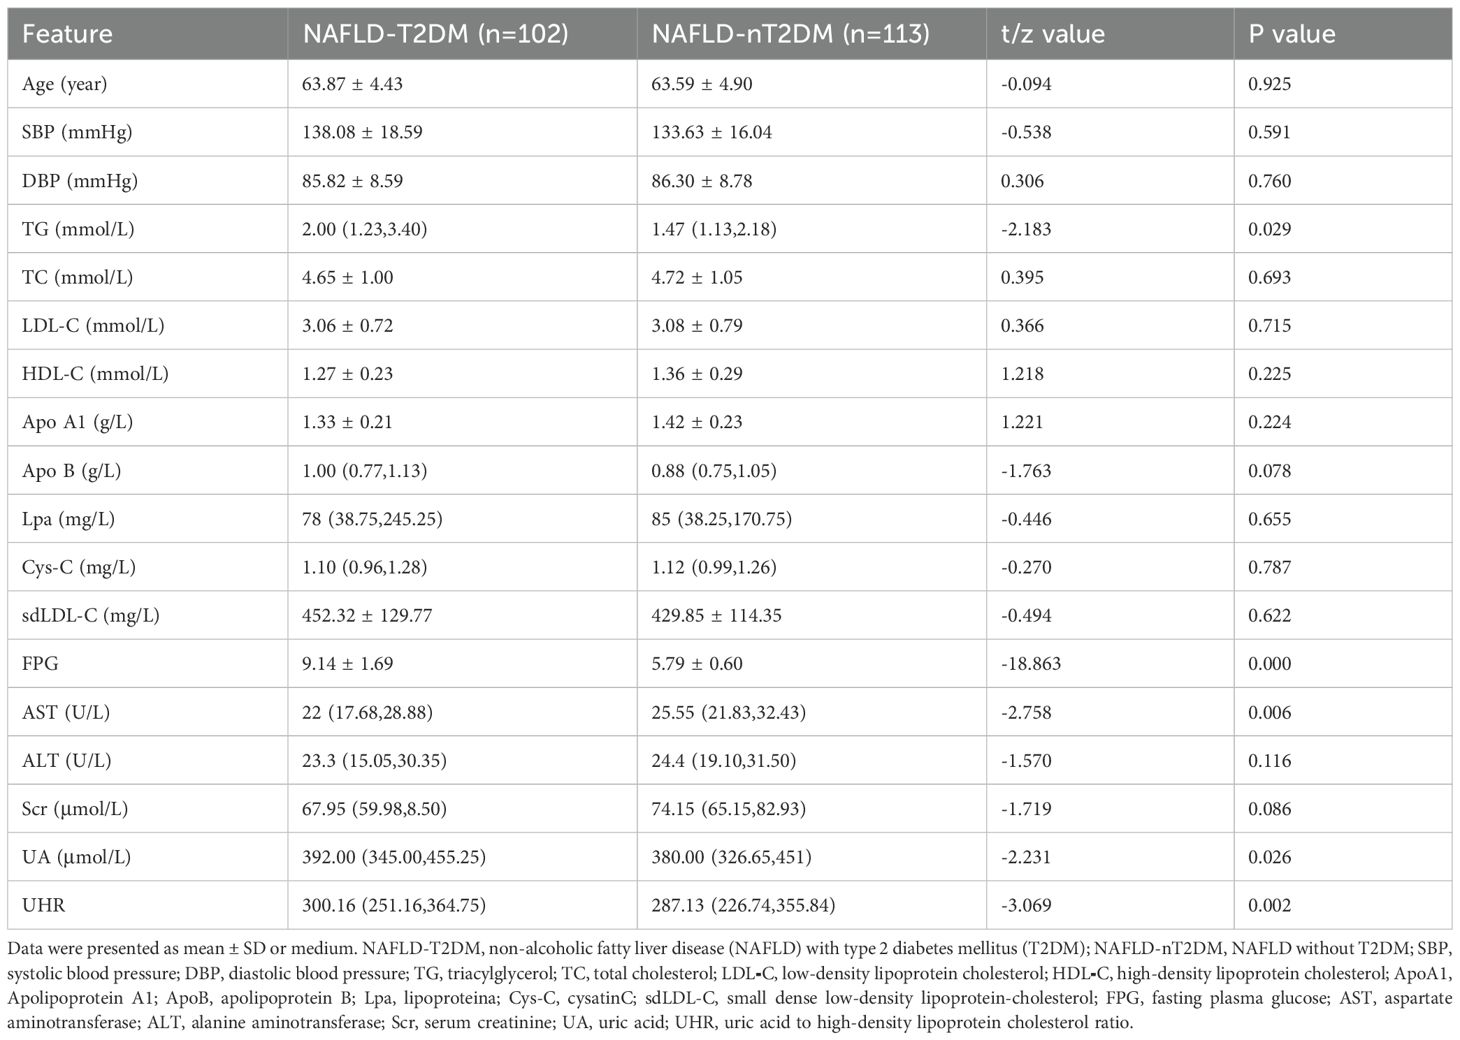
Table 1. Comparison of the baseline characteristics in two groups.
Subsequently, we analyzed the incidence of ECG abnormalities in both groups. The incidence of abnormal ECG (specifically ST-T changes) was significantly higher in the NAFLD-T2DM group compared to the NAFLD-nT2DM group (P < 0.05) (Table 2). However, no statistically significant differences were found between the two groups regarding the incidence of sinus tachycardia/bradycardia, first degree atrioventricular block, left ventricular high voltage, incomplete/complete right bundle branch block, premature beats, abnormal Q wave, QT interval prolongation, and left/right atrial abnormalities (P > 0.05) (Table 2). Furthermore, we compared ECG parameters between the two groups. As shown in Table 3, the heart rate and P wave duration were significantly higher in the NAFLD-T2DM group, while the QT interval was shorter (P < 0.05). These findings indicate that characteristic ECG changes are present in patients with NAFLD combined with T2DM.
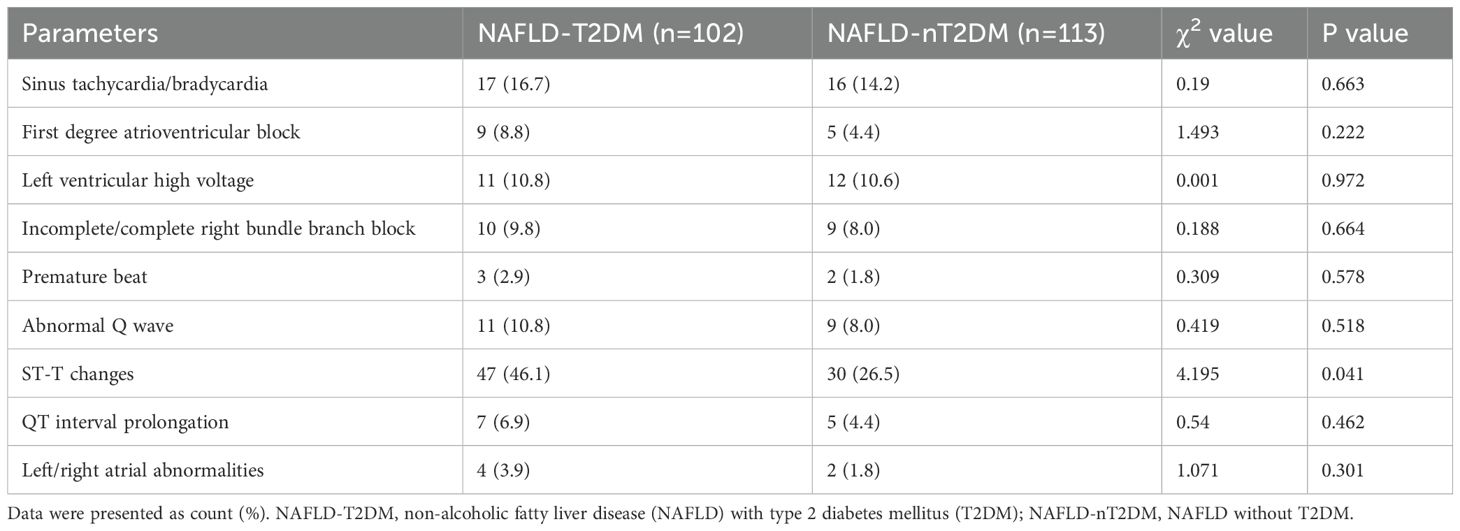
Table 2. Comparison of the incidence of abnormal electrocardiograms in two groups.
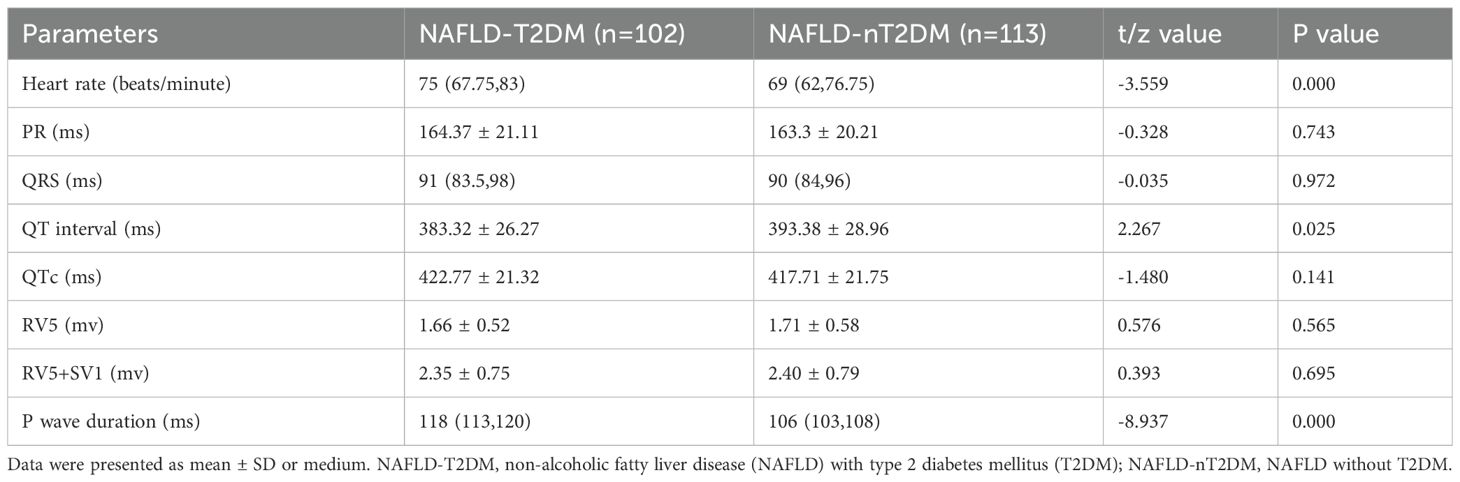
Table 3. Comparison of electrocardiogram parameters in two groups.
To elucidate the factors associated with the coexistence of NAFLD patients with T2DM, we conducted a multivariate logistic regression analysis. As shown in Table 4, the analysis included parameters that demonstrated statistical significance in the univariate analysis: TG, AST, UA, UHR, ST-T changes, heart rate, QT interval, and P wave duration as independent variables, with the presence of T2DM in NAFLD as the dependent variable. The results indicated that UHR, ST-T changes, heart rate, QT interval, and P wave duration are independent influencing factors for the presence of T2DM in NAFLD (Table 4). This suggests that these indicators are associated with the coexistence of T2DM in patients with NAFLD and may serve as risk indicators for the development of T2DM in this population.
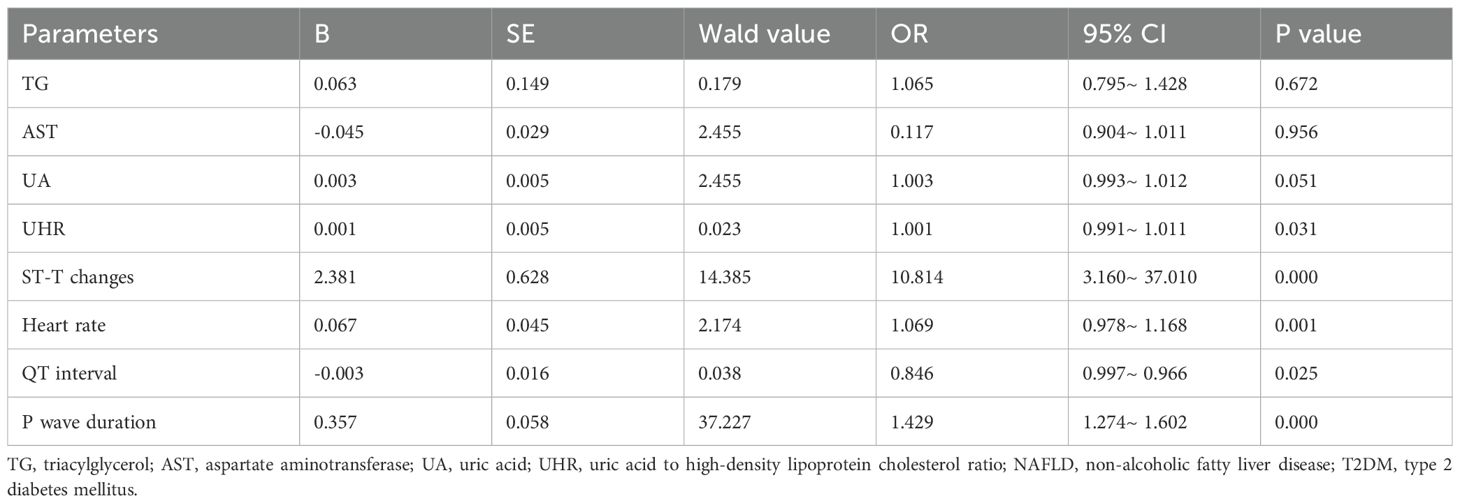
Table 4. Logistic regression analysis of the indicators in NAFLD with T2DM.
Additionally, we employed ROC curve analysis to assess the predictive value of the relevant indicators for NAFLD combined with T2DM. We conducted ROC curve analyses for UHR, heart rate, QT interval, ST-T changes, P wave duration, and the combination of five variables, calculating the area under the curve (AUC). As shown in Table 5 and Figure 1, the AUC for predicting NAFLD combined with T2DM using UHR, heart rate, QT interval, ST-T changes, P wave duration, and the combination of five variables were 0.641 (95% CI: 0.565-0.712, P < 0.05), 0.663 (95% CI: 0.588-0.733, P < 0.05), 0.602 (95% CI: 0.525-0.675, P < 0.05), 0.745 (95% CI: 0.674-0.808, P < 0.05), 0.909 (95% CI: 0.856-0.947, P < 0.05), and 0.949 (95% CI: 0.905-0.977, P < 0.05), respectively. The AUC for the combination of five variables diagnosis was significantly higher than that for UHR, heart rate, QT interval, ST-T changes, and P wave duration, with statistical significance (Z = 7.087, Z = 6.227, Z = 7.358, Z = 5.297, Z = 1.513, P < 0.05). Moreover, the sensitivity and specificity of the combination of five variables for predicting T2DM in NAFLD were 91.96% and 93.55% (Table 5), respectively, which were significantly higher than those of single indicators, indicating a superior predictive value.
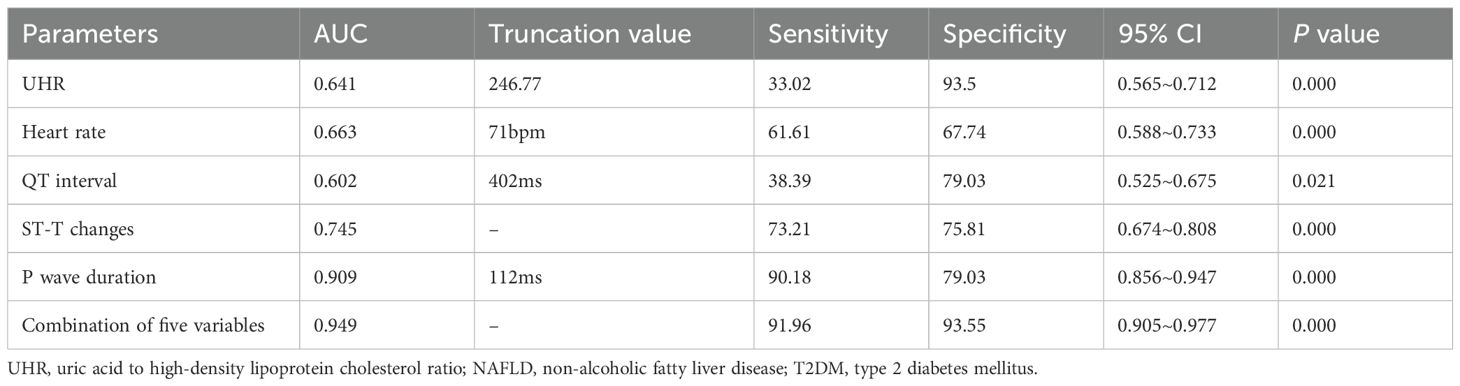
Table 5. Analysis of the indicators in predicting NAFLD with T2DM.
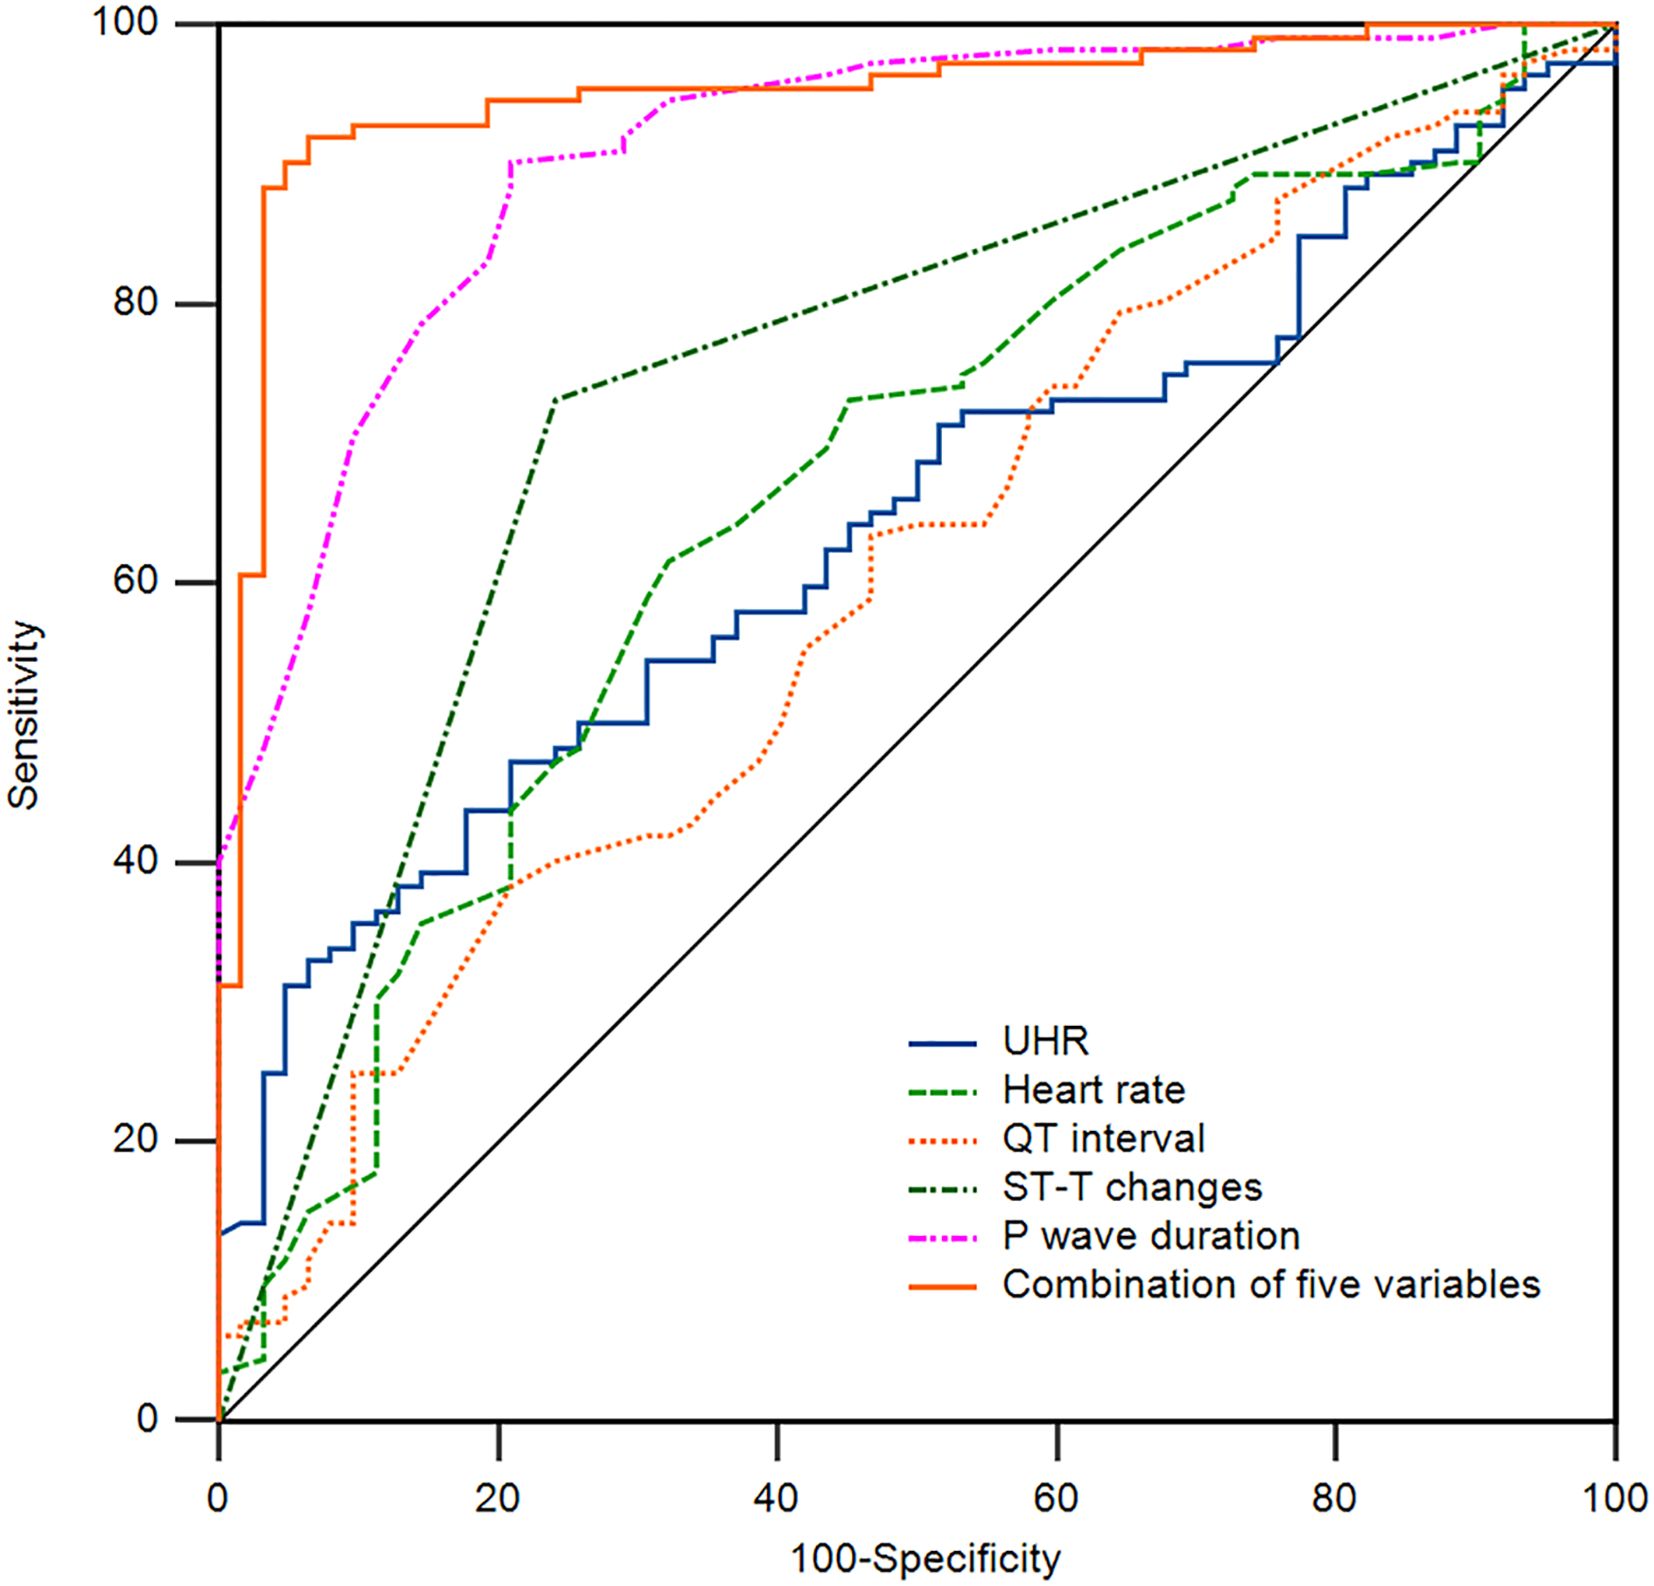
Figure 1. Receiver operating characteristic (ROC) curve of the indicators for the prediction of T2DM in NAFLD patients. The area under the curve (AUC) of UHR, Heart rate, QT interval, ST-T changes, P wave duration, and a combination of five variables for the prediction of T2DM in NAFLD patients are 0.641, 0.663, 0.602, 0.745, 0.909, and 0.949. NAFLD, non-alcoholic fatty liver disease; T2DM, type 2 diabetes mellitus; UHR, uric acid to high-density lipoprotein cholesterol ratio.
4 Discussion
NAFLD is a significant contributor to chronic liver diseases. In light of the current absence of effective therapeutic strategies, the prevention and management of this condition have emerged as critical scientific challenges. This study examined patients undergoing short-term convalescence in our hospital. We found that, compared to NAFLD patients without T2DM, serum markers such as the UHR and ECG-related parameters exhibited distinctive changes in NAFLD patients. These changes may serve as indicators of the risk of developing T2DM in this population. Furthermore, the combination of UHR and ECG-related parameters—including ST-T changes, heart rate, QT interval, and P wave duration demonstrated enhanced sensitivity and specificity in predicting the risk of T2DM in NAFLD patients, suggesting their potential as biomarkers.
It is important to note that simple NAFLD, despite its relatively minor hepatic injury, increases the risk of various metabolic disturbances, including IR, T2DM, dyslipidemia, and hypertension (1, 29). Studies have shown that elevated levels of transaminases are positively correlated with the future risk of developing T2DM, with NAFLD patients facing more than double the risk (30, 31). Additionally, it is estimated that 37% of T2DM patients with NAFLD will develop non-alcoholic steatohepatitis (NASH) globally (32).
Currently, the precise pathogenesis of NAFLD in conjunction with T2DM remains incompletely understood. However, existing studies suggest that its development is closely linked to inflammatory responses. This relationship may arise from the regulatory effects of inflammatory cytokines on insulin sensitivity, which can trigger IR and ultimately disrupt the metabolic equilibrium of the liver (11). IR, a common pathological basis for both metabolic disorders, impairs the liver’s ability to suppress hepatic glucose production in response to insulin. Concurrently, it promotes de novo lipogenesis through the activation of the Notch signaling pathway. The accumulation of fat in the liver results from impaired processes of free fatty acid (FFA) uptake, synthesis, export, and oxidation. In patients with NAFLD, the degree of hepatic steatosis correlates with elevated plasma levels of free FFA, attributable to the impaired capacity of adipose tissue to inhibit lipolysis (33). FFA can activate the c-Jun N-terminal kinase (JNK) signaling pathway, inducing cellular stress responses, inflammation, apoptosis, and mitochondrial dysfunction. Furthermore, the JNK signaling pathway can lead to the phosphorylation of peroxisome proliferator-activated receptor gamma, exacerbating lipotoxicity and hepatic inflammatory responses (34). IR results in decreased sensitivity of target organs to insulin, further deteriorating glucose metabolism and advancing disease progression (35). Studies indicate that UA plays a pro-inflammatory role in various chronic diseases. Elevated UA levels can induce oxidative stress, resulting in IR in pancreatic β-cells (36). IR can also lead to decreased HDL-C concentrations through multiple mechanisms. On one hand, under IR conditions, reduced lipoprotein lipase activity decreases the hydrolysis of triglycerides in chylomicrons and very low-density lipoproteins, further limiting HDL-C production. On the other hand, increased hepatic lipase activity enhances the clearance of HDL-C (37). Consequently, the UHR can more effectively predict the extent of metabolic disorders. Clinical studies have confirmed that UHR is closely associated with various metabolic diseases, including diabetes, diabetic nephropathy, cardiovascular diseases, and metabolic-associated fatty liver disease (38, 39). Studies showed that UHR serves as a useful predictor of glycemic control in men with T2DM, as it is positively correlated with glycated hemoglobin (HbA1c) and fasting plasma glucose levels (39). Zhang suggested that UHR is independently associated with an increased risk of NAFLD, with their study indicating that a 1% increase in UHR level corresponds to a 10.5% increased risk of developing NAFLD (38). UHR was elevated in metabolic syndrome and is suggested to possess greater sensitivity and specificity than other criteria used to identify subjects with metabolic syndrome (40).
CVD is the leading cause of mortality among patients with T2DM, accounting for two-thirds of all-cause deaths (41). Elevated levels of HbA1c are closely associated with an increased risk of heart disease and overall mortality (42). Various glycemic control strategies, particularly those focusing on weight reduction, effectively reduce the likelihood of major adverse cardiovascular events, thereby confirming the efficacy of diabetes treatment in yielding positive cardiovascular outcomes (43). In addition to macrovascular complications associated with CVD, patients with NAFLD also face an elevated risk of microvascular disease, particularly chronic kidney disease, which is strongly correlated with CVD and T2DM (44). Hypertension, T2DM, smoking, and physical inactivity were significantly associated with primary and secondary ECG abnormalities (44). The incidence of primary abnormalities increased significantly with the number of cardiovascular risk factors. One study emphasized the importance of implementing preventive measures for primary and secondary ECG abnormalities, which may indicate an increased risk of cardiovascular disease (45). Another study investigating atrial electromechanical delay (EMD) and P wave dispersion (Pd) in patients with T2DM found that, compared to healthy volunteers, patients with T2DM exhibited significantly higher EMD and Pd, with interatrial EMD positively correlated with Pd and left atrial volume index (46). This suggests that T2DM may increase the risk of atrial fibrillation (AF) by affecting atrial conduction properties, underscoring the necessity of regular cardiac monitoring in patients with T2DM (46). The study explored the mechanisms underlying prolonged P wave duration in rats with T2DM, revealing that the prolonged P wave duration in T2DM rats was not related to left atrial size but was instead caused by abnormalities in atrial myocyte ion currents and the expression of gap junction proteins Cx40 and Cx43, as well as fibrosis of the atrial tissue. The results indicated that T2DM may lead to prolonged P-wave duration by affecting the expression of Cx40 and Cx43 proteins and inducing atrial fibrosis (47). Other studies have found that, compared to healthy controls, patients with T2DM initially experience an increase in heart rate during hypoglycemia; however, after one hour of sustained hypoglycemia, the heart rate decreases to baseline levels, accompanied by reactivation of vagal tone (48). Moreover, during hypoglycemia, T2DM patients exhibit shorter QT intervals, QTc intervals, and T-wave amplitude and symmetry compared to the control group, demonstrating more pronounced cardiac repolarization abnormalities (48). This is consistent with the findings of this study, which discovered that the group with NAFLD combined with T2DM had an increased heart rate, shortened QT interval, and prolonged P wave duration, indicating a heightened likelihood of cardiac repolarization abnormalities. However, continuously monitored blood glucose and ECG in patients with type 1 diabetes showed that during hyperglycemia, the QTc interval was, on average, longer and positively correlated with the duration of hyperglycemia (49). Additionally, neuropathy was significantly associated with a prolonged QTc interval, emphasizing the potential importance of continuous monitoring of blood glucose and ECG data in clinical practice (49). On the other hand, compared to healthy controls, T2DM patients had significantly prolonged T-peak to T-end (Tp-e) intervals, Tp-e/QT ratios, and Tp-e/QTc ratios, indicating an increased risk of ventricular arrhythmias (50). Moreover, there was no significant statistical association between T-wave alteration (TWA) and T2DM after adjusting for confounding factors such as age, gender, and hypertension, although the incidence of T-wave abnormalities was higher in diabetic patients (51). However, TWA is independently associated with changes in left ventricular myocardial structure, impaired left ventricular systolic function, and left ventricular diastolic dysfunction, suggesting that TWA may serve as a useful indicator for identifying early myocardial structural and functional abnormalities in T2DM patients (52). Similarly, the prevalence of ST-T changes in patients with NAFLD was 6.5%, and among participants with ST-T changes, the prevalence of NAFLD was 42.9%, suggesting a significant independent association between ST-T changes and NAFLD (53). This study also confirmed an increased incidence of ST-T changes in the group with NAFLD combined with T2DM, indicating the need for the early assessment of cardiovascular disease risk (53). Patients with hemodynamically significant coronary lesions had significantly increased UA levels (54). Higher UA levels had a significantly higher probability of cardiac conduction block (mainly first-degree atrioventricular block) than those with normal UHR levels (55). This association remained significant even after adjusting for multiple cardiovascular risk factors and potential confounding variables, suggesting that elevated UA may be an independent predictor of cardiac conduction block in T2DM patients (55). This indicates a strong association between UHR levels and ECG parameters. The logistic regression analysis in this study revealed that UHR, ST-T changes, heart rate, QT interval, and P wave duration are all independent influencing factors for the development of T2DM in patients with NAFLD. The results of ROC curve analysis showed that the AUC for the combination of five variables was 0.949 (95% CI: 0.905–0.977, P < 0.05), with a sensitivity of 91.96% and a specificity of 93.55%, which is significantly higher than that of any single indicator. This combination provides better predictive value for patients with NAFLD who develop T2DM and offers a valuable reference for clinical practice. Therefore, in clinical settings, especially in NAFLD patients with glucose/lipid dysfunction as well as obesity, there should be an emphasis on regularly monitoring and assessing UHR, ST-T changes, heart rate, QT interval, and P wave duration. Furthermore, UHR and ECG testing are commonly utilized and cost-effective in the real-word medical settings. Collectively, this approach contributes to the protection of the cardiac health in patients, thereby improving their quality of life.
However, the current study has several limitations, including cross-sectional and single-center (rehabilitation-center setting), which preclude the establishment of a causal relationship between UHR and ECG parameters and the development of T2DM in NAFLD patients. Furthermore, this study did not include an analysis of potential factors such as body mass index (BMI), medication, and lifestyle of the subjects. To generalize the findings to broader and more diverse populations, future studies are needed to validate these findings by increasing the sample size, enhancing multicenter collaboration, and improving follow-up protocols.
In summary, UHR levels and ECG parameters are significant factors associated with the risk of T2DM in NAFLD. The combination of UHR and ECG parameters exhibits predictive value for the presence of T2DM in this population. UHR and ECG changes in patients with NAFLD and T2DM should be closely monitored in the clinical setting. Furthermore, it is essential to integrate the strengths of multiple disciplines, such as hepatology and endocrinology, to provide comprehensive management for patients with these comorbidities. This approach will facilitate the establishment of a more precise and detailed tiered diagnosis and treatment system, thereby promoting effective management of patients with these comorbid conditions.
Data availability statement
The original contributions presented in the study are included in the article/supplementary material. Further inquiries can be directed to the corresponding author.
Ethics statement
This study received approval from the hospital ethics committee (WTSLL2024007) and was registered with the National Medical Research Registry System (MR-32-24-051272). The studies were conducted in accordance with the local legislation and institutional requirements. The participants provided their written informed consent to participate in this study.
Author contributions
YW: Writing – original draft, Funding acquisition, Formal Analysis, Investigation, Software, Data curation, Visualization, Project administration, Writing – review & editing, Methodology. ML: Data curation, Validation, Methodology, Writing – review & editing, Investigation, Formal Analysis, Visualization. WL: Writing – review & editing, Formal Analysis, Methodology, Data curation, Validation, Investigation. YL: Data curation, Software, Methodology, Writing – review & editing, Investigation, Formal Analysis. XWT: Validation, Supervision, Formal Analysis, Writing – review & editing, Investigation, Resources. FS: Resources, Formal Analysis, Validation, Supervision, Writing – review & editing, Investigation. HZ: Validation, Investigation, Supervision, Writing – review & editing, Formal Analysis, Resources. XMT: Writing – original draft, Funding acquisition, Project administration, Conceptualization, Supervision, Writing – review & editing, Resources, Formal Analysis.
Funding
The author(s) declare financial support was received for the research and/or publication of this article. This work was supported in part by the Youth Talent Support Project of Jiangsu Provincial 333 Project ( (2022)3-29-052), Elderly Health Research Project of Jiangsu Commission of Health (LR2022015, LKZ2023020), Yangzhou Basic Research Program (Joint Special Project) Health Project (2024–2–19), Jiangsu Yangzhou Basic Research Program of Health Project (Joint Project, 2024-4-24, 2024-4-25), Scientific research start-up fund from the Affiliated Taizhou People’s Hospital of Nanjing Medical University (XT, 2023), Science and Technology Development Fund of Nanjing Medical University (NMUB20240245), National Natural Science Foundation of China (81873094).
Conflict of interest
The authors declare that the research was conducted in the absence of any commercial or financial relationships that could be construed as a potential conflict of interest.
Generative AI statement
The author(s) declare that no Generative AI was used in the creation of this manuscript.
Any alternative text (alt text) provided alongside figures in this article has been generated by Frontiers with the support of artificial intelligence and reasonable efforts have been made to ensure accuracy, including review by the authors wherever possible. If you identify any issues, please contact us.
Publisher’s note
All claims expressed in this article are solely those of the authors and do not necessarily represent those of their affiliated organizations, or those of the publisher, the editors and the reviewers. Any product that may be evaluated in this article, or claim that may be made by its manufacturer, is not guaranteed or endorsed by the publisher.
References
1. Chalasani N, Younossi Z, Lavine JE, Charlton M, Cusi K, Rinella M, et al. The diagnosis and management of nonalcoholic fatty liver disease: Practice guidance from the American Association for the Study of Liver Diseases. Hepatology. (2018) 67:328–57. doi: 10.1002/hep.29367
2. Kantartzis K and Stefan N. Clustering NAFLD: phenotypes of nonalcoholic fatty liver disease and their differing trajectories. Hepatol Commun. (2023) 7:e0112. doi: 10.1097/hc9.0000000000000112
3. Li J, Zou B, Yeo YH, Feng Y, Xie X, Lee DH, et al. Prevalence, incidence, and outcome of non-alcoholic fatty liver disease in Asia, 1999-2019: a systematic review and meta-analysis. Lancet Gastroenterol Hepatol. (2019) 4:389–98. doi: 10.1016/s2468-1253(19)30039-1
4. Estes C, Anstee QM, Arias-Loste MT, Bantel H, Bellentani S, Caballeria J, et al. Modeling NAFLD disease burden in China, France, Germany, Italy, Japan, Spain, United Kingdom, and United States for the period 2016-2030. J Hepatol. (2018) 69:896–904. doi: 10.1016/j.jhep.2018.05.036
5. Powell EE, Wong VW, and Rinella M. Non-alcoholic fatty liver disease. Lancet. (2021) 397:2212–24. doi: 10.1016/s0140-6736(20)32511-3
6. Sanyal AJ, Van Natta ML, Clark J, Neuschwander-Tetri BA, Diehl A, Dasarathy S, et al. Prospective study of outcomes in adults with nonalcoholic fatty liver disease. N Engl J Med. (2021) 385:1559–69. doi: 10.1056/NEJMoa2029349
7. Rong L, Zou J, Ran W, Qi X, Chen Y, Cui H, et al. Advancements in the treatment of non-alcoholic fatty liver disease (NAFLD). Front Endocrinol (Lausanne). (2022) 13:1087260. doi: 10.3389/fendo.2022.1087260
8. Targher G, Bertolini L, Rodella S, Zoppini G, Lippi G, Day C, et al. Non-alcoholic fatty liver disease is independently associated with an increased prevalence of chronic kidney disease and proliferative/laser-treated retinopathy in type 2 diabetic patients. Diabetologia. (2008) 51:444–50. doi: 10.1007/s00125-007-0897-4
9. Williams KH, Burns K, Constantino M, Shackel NA, Prakoso E, Wong J, et al. An association of large-fibre peripheral nerve dysfunction with non-invasive measures of liver fibrosis secondary to non-alcoholic fatty liver disease in diabetes. J Diabetes Complications. (2015) 29:1240–7. doi: 10.1016/j.jdiacomp.2015.06.015
10. Hubacek JA, Dlouha L, Adamkova V, Dlouha D, Pacal L, Kankova K, et al. Genetic risk score is associated with T2DM and diabetes complications risks. Gene. (2023) 849:146921. doi: 10.1016/j.gene.2022.146921
11. Tanase DM, Gosav EM, Costea CF, Ciocoiu M, Lacatusu CM, Maranduca MA, et al. The intricate relationship between type 2 diabetes mellitus (T2DM), insulin resistance (IR), and nonalcoholic fatty liver disease (NAFLD). J Diabetes Res. (2020) 2020:3920196. doi: 10.1155/2020/3920196
12. Frankowski R, Kobierecki M, Wittczak A, Różycka-Kosmalska M, Pietras T, Sipowicz K, et al. Type 2 diabetes mellitus, non-alcoholic fatty liver disease, and metabolic repercussions: the vicious cycle and its interplay with inflammation. Int J Mol Sci. (2023) 24:9677. doi: 10.3390/ijms24119677
13. Doycheva I, Cui J, Nguyen P, Costa EA, Hooker J, Hofflich H, et al. Non-invasive screening of diabetics in primary care for NAFLD and advanced fibrosis by MRI and MRE. Aliment Pharmacol Ther. (2016) 43:83–95. doi: 10.1111/apt.13405
14. Alexander M, Loomis AK, van der Lei J, Duarte-Salles T, Prieto-Alhambra D, Ansell D, et al. Risks and clinical predictors of cirrhosis and hepatocellular carcinoma diagnoses in adults with diagnosed NAFLD: real-world study of 18 million patients in four European cohorts. BMC Med. (2019) 17:95. doi: 10.1186/s12916-019-1321-x
15. Ferguson D and Finck BN. Emerging therapeutic approaches for the treatment of NAFLD and type 2 diabetes mellitus. Nat Rev Endocrinol. (2021) 17:484–95. doi: 10.1038/s41574-021-00507-z
16. Yanai H, Adachi H, Hakoshima M, and Katsuyama H. Molecular biological and clinical understanding of the pathophysiology and treatments of hyperuricemia and its association with metabolic syndrome, cardiovascular diseases and chronic kidney disease. Int J Mol Sci. (2021) 22:9221. doi: 10.3390/ijms22179221
17. Borghi C, Agabiti-Rosei E, Johnson RJ, Kielstein JT, Lurbe E, Mancia G, et al. Hyperuricaemia and gout in cardiovascular, metabolic and kidney disease. Eur J Intern Med. (2020) 80:1–11. doi: 10.1016/j.ejim.2020.07.006
18. Kontush A. HDL-mediated mechanisms of protection in cardiovascular disease. Cardiovasc Res. (2014) 103:341–9. doi: 10.1093/cvr/cvu147
19. Kolahi Ahari R, Mansoori A, Sahranavard T, Miri MS, Feizi S, Esmaily H, et al. Serum uric acid to high-density lipoprotein ratio as a novel indicator of inflammation is correlated with the presence and severity of metabolic syndrome: A large-scale study. Endocrinol Diabetes Metab. (2023) 6:e446. doi: 10.1002/edm2.446
20. Park B, Jung DH, and Lee YJ. Predictive value of serum uric acid to HDL cholesterol ratio for incident ischemic heart disease in non-diabetic koreans. Biomedicines. (2022) 10:1422. doi: 10.3390/biomedicines10061422
21. Kosekli MA, Kurtkulagii O, Kahveci G, Duman TT, Tel BMA, Bilgin S, et al. The association between serum uric acid to high density lipoprotein-cholesterol ratio and non-alcoholic fatty liver disease: the abund study. Rev Assoc Med Bras (1992). (2021) 67:549–54. doi: 10.1590/1806-9282.20201005
22. Abuş S and Afşin A. Fragmented QRS in the relatives of patients with coronary artery disease. Ann Noninvasive Electrocardiol. (2022) 27:e12970. doi: 10.1111/anec.12970
23. Karadeniz F and Altuntaş E. Correlation between frontal QRS-T angle, Tp-e interval, and Tp-e/QT ratio to coronary artery severity assessed with SYNTAX score in stable coronary artery disease patients. J Arrhythm. (2022) 38:155. doi: 10.1002/joa3.12756
24. Tikkanen JT, Kentta T, Porthan K, Anttonen O, Eranti A, Aro AL, et al. Risk of sudden cardiac death associated with QRS, QTc, and JTc intervals in the general population. Heart Rhythm. (2022) 19:1297–303. doi: 10.1016/j.hrthm.2022.04.016
25. Chatterjee NA, Tikkanen JT, Panicker GK, Narula D, Lee DC, Kentta T, et al. Simple electrocardiographic measures improve sudden arrhythmic death prediction in coronary disease. Eur Heart J. (2020) 41:1988–99. doi: 10.1093/eurheartj/ehaa177
26. Wang Y, Liu M, Liu Y, Tang X, and Tang X. Assessment of heart rate deceleration capacity, heart rate deceleration runs, heart rate acceleration capacity, and lipoprotein-related phospholipase A2 as predictors in individuals with dementia. Front Neurol. (2024) 15:1438736. doi: 10.3389/fneur.2024.1438736
27. Fan JG, Wei L, and Zhuang H. Guidelines of prevention and treatment of nonalcoholic fatty liver disease (2018, China). J Dig Dis. (2019) 20:163–73. doi: 10.1111/1751-2980.12685
28. American Diabetes Association. Diagnosis and classification of diabetes mellitus. Diabetes Care. (2014) 37 Suppl 1:S81–90. doi: 10.2337/dc14-S081
29. Younossi ZM, Stepanova M, Younossi Y, Golabi P, Mishra A, Rafiq N, et al. Epidemiology of chronic liver diseases in the USA in the past three decades. Gut. (2020) 69:564–8. doi: 10.1136/gutjnl-2019-318813
30. De Silva NMG, Borges MC, Hingorani AD, Engmann J, Shah T, Zhang X, et al. Liver function and risk of type 2 diabetes: bidirectional mendelian randomization study. Diabetes. (2019) 68:1681–91. doi: 10.2337/db18-1048
31. Mantovani A, Byrne CD, Bonora E, and Targher G. Nonalcoholic fatty liver disease and risk of incident type 2 diabetes: A meta-analysis. Diabetes Care. (2018) 41:372–82. doi: 10.2337/dc17-1902
32. Younossi ZM, Golabi P, de Avila L, Paik JM, Srishord M, Fukui N, et al. The global epidemiology of NAFLD and NASH in patients with type 2 diabetes: A systematic review and meta-analysis. J Hepatol. (2019) 71:793–801. doi: 10.1016/j.jhep.2019.06.021
33. Armandi A, Rosso C, Caviglia GP, and Bugianesi E. Insulin resistance across the spectrum of nonalcoholic fatty liver disease. Metabolites. (2021) 11:155. doi: 10.3390/metabo11030155
34. Scorletti E and Carr RM. A new perspective on NAFLD: Focusing on lipid droplets. J Hepatol. (2022) 76:934–45. doi: 10.1016/j.jhep.2021.11.009
35. Lee SH, Park SY, and Choi CS. Insulin resistance: from mechanisms to therapeutic strategies. Diabetes Metab J. (2022) 46:15–37. doi: 10.4093/dmj.2021.0280
36. Yu W, Chen C, Zhuang W, Wang W, Liu W, Zhao H, et al. Silencing TXNIP ameliorates high uric acid-induced insulin resistance via the IRS2/AKT and Nrf2/HO-1 pathways in macrophages. Free Radic Biol Med. (2022) 178:42–53. doi: 10.1016/j.freeradbiomed.2021.11.034
37. Bjornstad P and Eckel RH. Pathogenesis of lipid disorders in insulin resistance: a brief review. Curr Diabetes Rep. (2018) 18:127. doi: 10.1007/s11892-018-1101-6
38. Zhang YN, Wang QQ, Chen YS, Shen C, and Xu CF. Association between serum uric acid to HDL-cholesterol ratio and nonalcoholic fatty liver disease in lean chinese adults. Int J Endocrinol. (2020) 2020:5953461. doi: 10.1155/2020/5953461
39. Aktas G, Kocak MZ, Bilgin S, Atak BM, Duman TT, and Kurtkulagi O. Uric acid to HDL cholesterol ratio is a strong predictor of diabetic control in men with type 2 diabetes mellitus. Aging Male. (2020) 23:1098–102. doi: 10.1080/13685538.2019.1678126
40. Kocak MZ, Aktas G, Erkus E, Sincer I, Atak B, and Duman T. Serum uric acid to HDL-cholesterol ratio is a strong predictor of metabolic syndrome in type 2 diabetes mellitus. Rev Assoc Med Bras (1992). (2019) 65:9–15. doi: 10.1590/1806-9282.65.1.9
41. Low Wang CC, Hess CN, Hiatt WR, and Goldfine AB. Clinical update: cardiovascular disease in diabetes mellitus: atherosclerotic cardiovascular disease and heart failure in type 2 diabetes mellitus - mechanisms, management, and clinical considerations. Circulation. (2016) 133:2459–502. doi: 10.1161/circulationaha.116.022194
42. Thanopoulou A, Karamanos B, and Archimandritis A. Glycated hemoglobin, diabetes, and cardiovascular risk in nondiabetic adults. N Engl J Med. (2010) 362:2030–1. doi: 10.1056/NEJMc1003829
43. Ghosh-Swaby OR, Goodman SG, Leiter LA, Cheng A, Connelly KA, Fitchett D, et al. Glucose-lowering drugs or strategies, atherosclerotic cardiovascular events, and heart failure in people with or at risk of type 2 diabetes: an updated systematic review and meta-analysis of randomised cardiovascular outcome trials. Lancet Diabetes Endocrinol. (2020) 8:418–35. doi: 10.1016/s2213-8587(20)30038-3
44. Byrne CD and Targher G. NAFLD as a driver of chronic kidney disease. J Hepatol. (2020) 72:785–801. doi: 10.1016/j.jhep.2020.01.013
45. Sahranavard T, Alimi R, Arabkhazaei J, Nasrabadi M, Alavi Dana SMM, Gholami Y, et al. Association of major and minor ECG abnormalities with traditional cardiovascular risk factors in the general population: a large scale study. Sci Rep. (2024) 14:11289. doi: 10.1038/s41598-024-62142-8
46. Demir K, Avci A, Kaya Z, Marakoglu K, Ceylan E, Yilmaz A, et al. Assessment of atrial electromechanical delay and P-wave dispersion in patients with type 2 diabetes mellitus. J Cardiol. (2016) 67:378–83. doi: 10.1016/j.jjcc.2015.06.003
47. Li B, Pan Y, and Li X. Type 2 diabetes induces prolonged P-wave duration without left atrial enlargement. J Korean Med Sci. (2016) 31:525–34. doi: 10.3346/jkms.2016.31.4.525
48. Chow E, Bernjak A, Walkinshaw E, Lubina-Solomon A, Freeman J, Macdonald IA, et al. Cardiac autonomic regulation and repolarization during acute experimental hypoglycemia in type 2 diabetes. Diabetes. (2017) 66:1322–33. doi: 10.2337/db16-1310
49. Charamba B, Liew A, Coen E, Newell J, O’Brien T, Wijns W, et al. Modelling the relationship between continuously measured glucose and electrocardiographic data in adults with type 1 diabetes mellitus. Endocrinol Diabetes Metab. (2021) 4:e00263. doi: 10.1002/edm2.263
50. Tokatli A, Kiliçaslan F, Alis M, Yiginer O, and Uzun M. Prolonged tp-e interval, tp-e/QT ratio and tp-e/QTc ratio in patients with type 2 diabetes mellitus. Endocrinol Metab (Seoul). (2016) 31:105–12. doi: 10.3803/EnM.2016.31.1.105
51. Soflaei Saffar S, Nazar E, Sahranavard T, Fayedeh F, Moodi Ghalibaf A, Ebrahimi M, et al. Association of T-wave electrocardiogram changes and type 2 diabetes: a cross-sectional sub-analysis of the MASHAD cohort population using the Minnesota coding system. BMC Cardiovasc Disord. (2024) 24:48. doi: 10.1186/s12872-023-03649-2
52. Zhen Z, Chen Y, Liu JH, Chan CW, Yuen M, Lam KS, et al. Increased T-wave alternans is associated with subclinical myocardial structural and functional abnormalities in patients with type 2 diabetes. J Cardiol. (2016) 68:329–34. doi: 10.1016/j.jjcc.2015.10.010
53. Xiao L, Bai T, Zeng J, Yang R, and Yang L. Nonalcoholic fatty liver disease, a potential risk factor of non-specific ST-T segment changes: data from a cross-sectional study. PeerJ. (2020) 8:e9090. doi: 10.7717/peerj.9090
54. Li F, Zhao D, Li Q, Lin X, Sun H, and Fan Q. Uric acid to high-density lipoprotein cholesterol ratio is a novel marker to predict functionally significant coronary artery stenosis. J Interv Cardiol. (2022) 2022:9057832. doi: 10.1155/2022/9057832
55. Mantovani A, Rigolon R, Pichiri I, Morani G, Bonapace S, Dugo C, et al. Relation of elevated serum uric acid levels to first-degree heart block and other cardiac conduction defects in hospitalized patients with type 2 diabetes. J Diabetes Complications. (2017) 31:1691–7. doi: 10.1016/j.jdiacomp.2017.09.011
Keywords: non-alcoholic fatty liver disease, diabetes mellitus, uric acid to high-density lipoprotein cholesterol ratio, electrocardiogram parameter, biomarker
Citation: Wang Y, Liu M, Li W, Liu Y, Tang X, Sun F, Zhu H and Tang X (2025) Association of UHR and ECG parameters with type 2 diabetes mellitus in non-alcoholic fatty liver disease. Front. Endocrinol. 16:1643842. doi: 10.3389/fendo.2025.1643842
Received: 09 June 2025; Accepted: 18 August 2025;
Published: 28 August 2025.
Edited by:
Jian Sun, Guangzhou Sport University, ChinaReviewed by:
Rashu Barua, New York University, United StatesElif Basaran, Abant Izzet Baysal University, Türkiye
Copyright © 2025 Wang, Liu, Li, Liu, Tang, Sun, Zhu and Tang. This is an open-access article distributed under the terms of the Creative Commons Attribution License (CC BY). The use, distribution or reproduction in other forums is permitted, provided the original author(s) and the copyright owner(s) are credited and that the original publication in this journal is cited, in accordance with accepted academic practice. No use, distribution or reproduction is permitted which does not comply with these terms.
*Correspondence: Xiangming Tang, dHhpYW5nbWluZ0AxNjMuY29t