 Rongrong He
 Hui Sun
 Haiying Liu
 Jinxia Li
- 1Clinical Laboratory, Xi’an International Medical Center Hospital, Xi ’an, Shaanxi, China
- 2Clinical Laboratory, Xi ‘an Daxing Hospital, Xi ’an, Shaanxi, China
- 3Department of Medical Administration and Infectious Disease Supervision, Chang’an District Center for Disease Control and Prevention, Xi ’an, Shaanxi, China
Objective: This study aims to investigate the relationship between newly identified inflammatory indicators and IR in patients with T2DM, thereby providing a reference basis for the early clinical prevention, diagnosis, and treatment of IR in patients with T2DM.
Methods: A total of 779 patients with T2DM admitted to the Endocrinology Department of our hospital from January 2022 to December 2024 were included in the observation group. Five hundred healthy individuals who underwent physical examinations during the same period were randomly selected as the control group. Patients in the observation group were divided into the IS group, the EIR group, and the SIR according to the HOMA-IR level. Analyze the relationship between the four indicators and IR in patients with T2DM, and observe whether they are independent risk factors for IR in T2DM patients, as well as analyze their clinical utility.
Results: Compared with the control group, the levels of inflammatory indicators SII, SIRI, MHR and UHR in the observation group were significantly increased. The levels of SII, SIRI, MHR and UHR in the EIR group and the SIR Group were significantly higher than those in the IS group. Moreover, with the increase in HOMA-IR score, all four inflammatory indicators showed an upward trend. The results of Spearman’s rank correlation analysis showed that all four indicators were positively correlated with IR in patients with T2DM. Multivariate ordered logistic regression analysis showed that all four indicators were independent risk factors for IR in patients with T2DM. The ROC results indicated that SII, SIRI, MHR and UHR could serve as potential discriminatory ability indicators for evaluating the degree of IR in patients with T2DM.
Conclusion: The levels of SIRI, SII, UHR and MHR in patients with T2DM increase and are positively correlated with IR. They are independent risk factors for IR in patients with T2DM and have clinical utility to a certain extent. They can provide a reference basis for the early clinical prevention, diagnosis and treatment of IR in patients with T2DM.
1 Introduction
Diabetes mellitus is a chronic condition commonly encountered in clinical practice, arising from endocrine and metabolic disorders. According to data from the International Diabetes Federation (IDF), approximately 537 million individuals aged 20-79 worldwide were living with diabetes in 2021. This figure is projected to rise to 643 million by 2030, reaching 783 million by 2045 (1, 2). Diabetes can be categorised into type 1 diabetes mellitus (T1DM) and type 2 diabetes mellitus (T2DM) based on differing pathogenic mechanisms, with T2DM accounting for approximately 90% of all cases (3, 4). T2DM primarily develops from unhealthy lifestyle and dietary habits, manifesting characteristic features including insulin resistance (IR), impaired pancreatic β-cell function, and hyperglycaemia (5). Insulin maintains glucose metabolic homeostasis through various physiological responses in tissues such as the liver, skeletal muscle, and adipose tissue. The development of IR leads to glucose metabolism dysregulation, resulting in hyperglycaemia and subsequent diabetes onset. In severe cases, this may progress to multi-organ complications including cardiovascular disease and diabetic nephropathy (6, 7).
The hyperinsulinaemic-euglycaemic clamp (HEC) remains the gold standard for assessing insulin resistance (IR) (8). However, this evaluation method is time-consuming, costly, and technically complex, with limited reproducibility, rendering it unsuitable for routine clinical application (9, 10). The homeostatic model assessment of insulin resistance (HOMA-IR) serves as an alternative approach for IR assessment and is currently regarded as a sensitive indicator for measuring IR (11). HOMA-IR calculations require measurement of fasting plasma insulin levels in patients (11, 12), yet these are not routinely included in standard clinical tests. Consequently, clinicians cannot promptly evaluate IR levels in T2DM patients, necessitating research into simpler, accurate, and cost-effective diagnostic tests to predict IR.
In recent years, epidemiological studies have shown that chronic inflammation plays an important role in the pathogenesis of T2DM (13). Long-term and chronic inflammation in the body leads to the upregulation of inflammatory factors in the islet microenvironment, including interleukin-1 β, CRP, tumor necrosis factor -α, etc., thereby destroying the function and activity of islet β cells and increasing reactive oxygen species, and lead to or aggravate the IR of peripheral tissues (14, 15). Blood components such as neutrophils, lymphocytes, monocytes, and platelets play crucial roles in the development and progression of T2DM (16–18). Serum uric acid (SUA), the end product of dietary and endogenous purine nucleotide metabolism, contributes to atherosclerosis and IR by reducing nitric oxide production, promoting vascular smooth muscle proliferation, and inducing endothelial dysfunction (19). Furthermore, research indicates that low levels of high-density lipoprotein cholesterol (HDL-C) are implicated in the development of metabolic syndrome and IR (20). Therefore, the development of novel biomarkers based on haematological parameters – including complete blood count components (neutrophils, monocytes, platelets, and lymphocytes), SUA, and HDL-C – offers a cost-effective approach to comprehensively assess systemic inflammatory status without imposing additional financial burdens on patients, while facilitating multi-dimensional clinical evaluation. Emerging inflammatory markers derived from these parameters, such as the systemic immune-inflammation index (SII), systemic inflammation response index (SIRI), serum uric acid to HDL-C ratio (UHR), and monocyte to HDL-C Ratio (MHR), have gained widespread clinical application across various pathologies, including diabetes mellitus (21–23).
Whilst associations between novel inflammatory markers (SII, SIRI, UHR, and MHR) and diabetes mellitus have been documented (24–26), their collective significance as determinants of IR in T2DM patients remains unestablished. Concurrently, early identification and clinical intervention of IR demonstrate prognostic value in T2DM management. This study consequently examines the relationship of SII, SIRI, and UHR in T2DM-associated IR, aiming to provide evidence-based insights for the timely prevention, diagnosis, and therapeutic stratification of IR in clinical practice.
2 Materials and methods
2.1 Study population and data collection
A retrospective analysis was conducted to observe a total of 1589 patients with type 2 diabetes who visited the Department of Endocrinology of Xi ‘an International Medical Center Hospital from January 2022 to December 2024, and they were classified as the observation group. According to the T2DM International Standard (ADA) (27), T2DM is defined as a fasting blood glucose level of ≥ 7.0 mmol/L and/or a 2-hour blood glucose level of ≥11.1 mmol/L and/or a glycated hemoglobin (HbA1c) level of ≥ 6.5% during the oral glucose tolerance test (OGTT). The sample size was estimated using JMP®Trial 18.0.1 software (JMP Statistical Discovery LLC., USA). A 95% (α=0.05) confidence interval and 90% (1-β) power were considered to detect a difference of 0.25 units. The calculated sample size is 387. Five hundred healthy individuals who underwent physical examinations during the same period were randomly selected as the control group. Collect the clinical data of the observed subjects, including indicators such as gender, age, BMI, smoking, drinking, blood routine results, and blood lipid results. According to HOMA-IR (28)= (fasting insulin × fasting blood glucose)/22.5, the observation group was divided into the insulin-sensitive (IS) group (HOMA-IR <1.9), the early insulin resistance (EIR) group (1.9≤ HOMA-IR ≤2.9) and the significant insulin resistance (SIR) group (HOMA-IR >2.9) (29).
Inclusion criteria: (1) ≥20 years old; (2) Type 2 diabetes; (3) The clinical data are complete. Exclusion criteria: (1) Type 1 diabetes; (2) Combined with infectious diseases, or malignant tumors, leukemia and other diseases; (3) Those with severe renal insufficiency or anemia and hemolytic diseases; (4) Those who have recently taken drugs that affect uric acid, blood lipids and blood cells; (5) Those with incomplete clinical data. A total of 779 cases were finally included in the observation group.
As this study was a retrospective analysis, informed consent from participants could not be obtained. This study was approved by the ethics committee of our hospital, and its protocol abided by the principles of the Declaration of Helsinki(GJYX-KY-2025-007).
2.2 Detect blood and biochemical indicators and calculate the inflammation index
Neutrophils, monocytes, lymphocytes and platelets were counted using the standard automatic hematology analyzer (SYSMEX-XN9000, Japan), and all reagents were provided by the manufacturer. Triglycerides (GPO-PAP method), total cholesterol (CHOD-PAP method, Maccura, China), HDL-C (direct method - peroxidase removal method, Maccura, China), low-density lipoprotein cholesterol (direct method - peroxidase removal method, Maccura, China), SUA (uricase method) and blood glucose (glucose oxidase method, Maccura, China) were measured using an automatic biochemical analyzer (Hitachi - 008as, Japan). The daily laboratory quality control of the above-mentioned projects is under control.
The inflammatory index calculation: SII= neutrophil count (×109/L) ×platelet count (×109/L)/lymphocyte count (×109/L); SIRI =neutrophil count (×109/L) × monocyte count (×109/L)/lymphocyte count (×109/L); UHR = SUA (umol/L)/HDL-C (mmol/L) ratio; MHR =monocyte (×109/L)/HDL-C (mmol/L) ratio;
2.3 Statistical analysis
Statistical analysis was conducted using SPSS 22.0 software. Non-normal distribution data were expressed as the median and interquartile range [M (Q3-Q1)], and categorical variables were expressed as percentages. The comparison of non-normal distribution quantitative variables between the two groups was conducted using the two-sample non-parametric test. Non-parametric tests were used for the comparison of non-normal distribution data among multiple groups. The comparison of categorical variable rates was conducted using the chi-square test. The correlations between the four inflammatory indicators and the HOMA-IR score were analyzed using Spearman’s rank correlation analysis. Since the outcome variable (degree of IR) of this study was an ordered multicategorical variable, multivariate ordered logistic regression was used to analyze its influencing factors. The discriminatory ability of four inflammatory indicators for IR of T2DM was evaluated through the ROC curve.
3 Results
3.1 Comparison of clinical characteristics
3.1.1 Comparison of clinical characteristics and indicators between the observation group and the control group
A total of 500 healthy subjects (control group) and 779 patients with T2DM (observation group) were included. The age distribution of the control group was 56 (51, 60) years old, among which 66.00% were male. The age distribution of the T2DM group was 58 (47, 66) years old, among which 68.42% were male. There was no statistically significant difference in age and gender between the T2DM group and the control group (P > 0.05). Compared with the control group, the total amounts of WBC, MONO, PLT, NEUT, TG, UA and glucose in the blood of the T2DM group were significantly higher than those of the control group, and the total amount of LYMP was significantly lower than that of the control group (P<0.05). The contents of LDL and HDL in the blood of the T2DM group were significantly lower than those of the control group (P<0.05). The values of inflammation indices SII, SIRI, MHR and UHR in the T2DM group were significantly higher than those in the control group (P<0.05). As shown in Table 1.
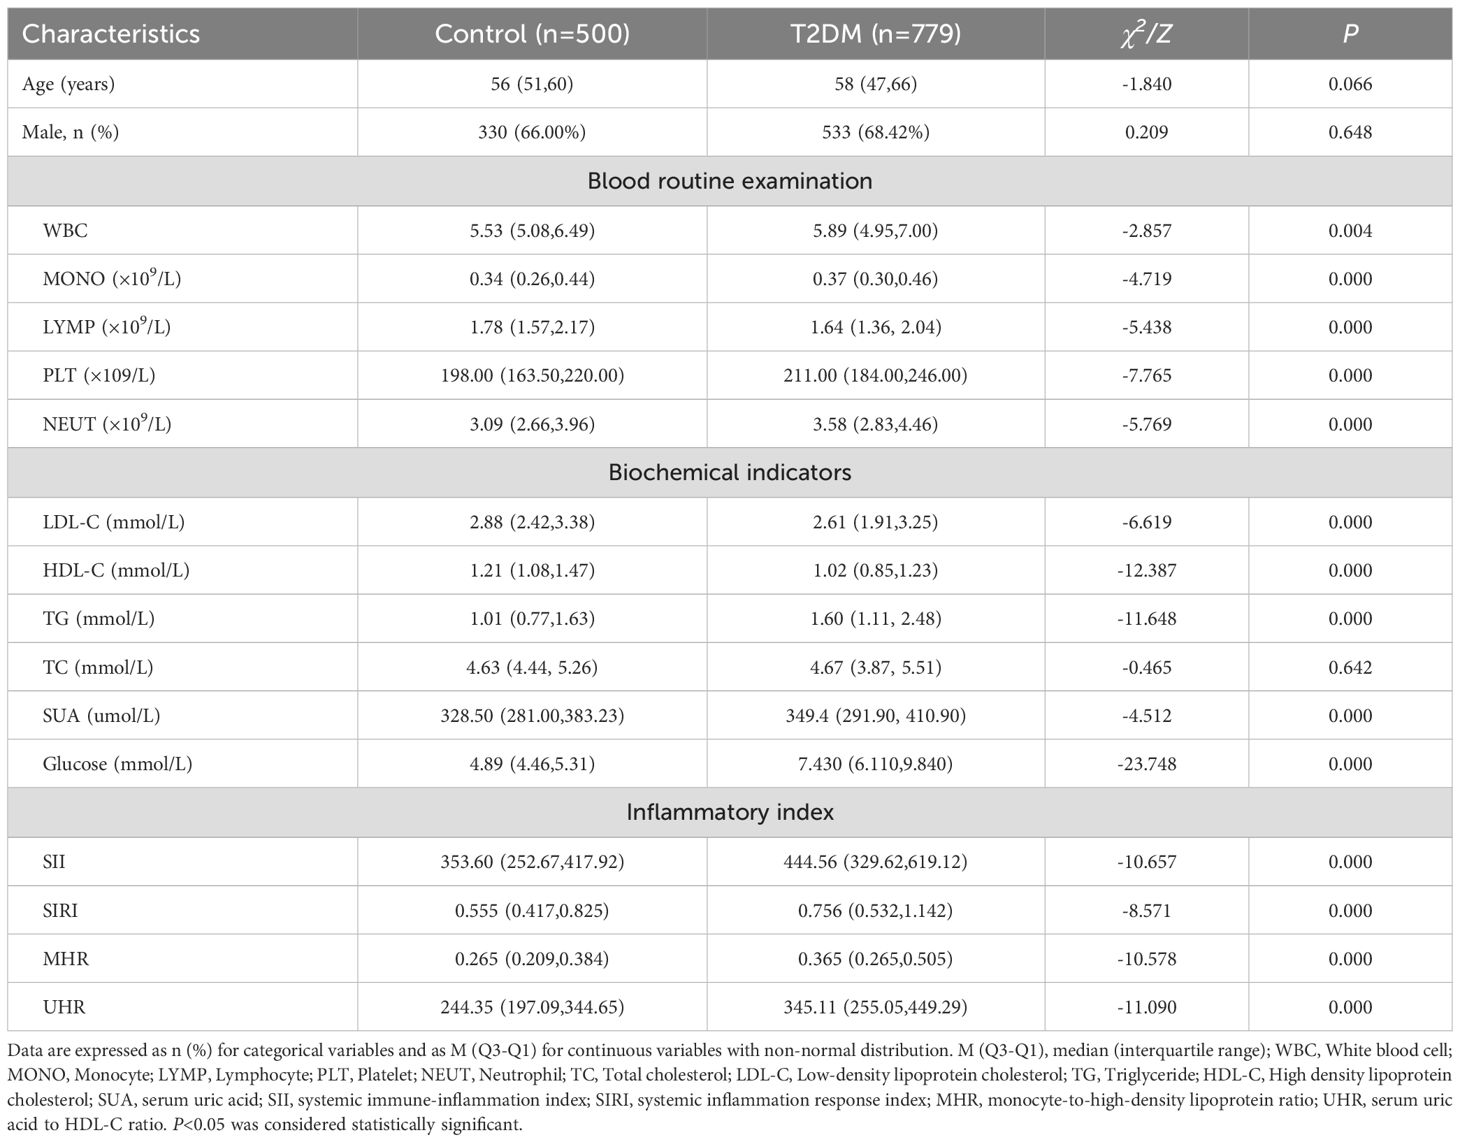
Table 1. Demographic data and clinical characteristics of control and T2DM patients [(x ± s), M (Q3–Q1)].
3.1.2 Comparison of clinical characteristics and indicators of T2DM patients with different HOMA-IR levels
779 patients with T2DM were divided into three groups according to HOMA-IR. The average ages of the three groups of patients were 56(46.50,62.00) years old, 56(46.00,65.00) years old and 55 (44.00,63.00) years old respectively. The proportions of males in each group were 68.05%, 68.82% and 68.75% respectively. There was no statistically significant difference in age, gender, BMI, smoking and drinking among the three groups of patients (P > 0.05). There was no statistically significant difference in total cholesterol among the three groups of patients (P > 0.05). There were statistically significant differences in WBC, uric acid, fasting C-peptide, fasting insulin, Glucose, MONO, NEUT, PLT, LDL, triglycerides of TG, and total cholesterol of TC among the three groups of patients, and they showed an increasing trend with the increase of HOMA-IR score (P<0.05). There were statistically significant differences in the values of lymphocytes and HDL-C among the three groups of patients (P<0.05), and with the increase of HOMA-IR score, the values of lymphocytes and HDL-C showed a downward trend (P<0.05). The inflammatory indicators SII, SIRI, MHR and UHR of the three groups of patients were compared, and the differences were statistically significant. Moreover, with the increase of HOMA-IR score, all four inflammatory indicators showed an upward trend (P<0.05, Table 2).
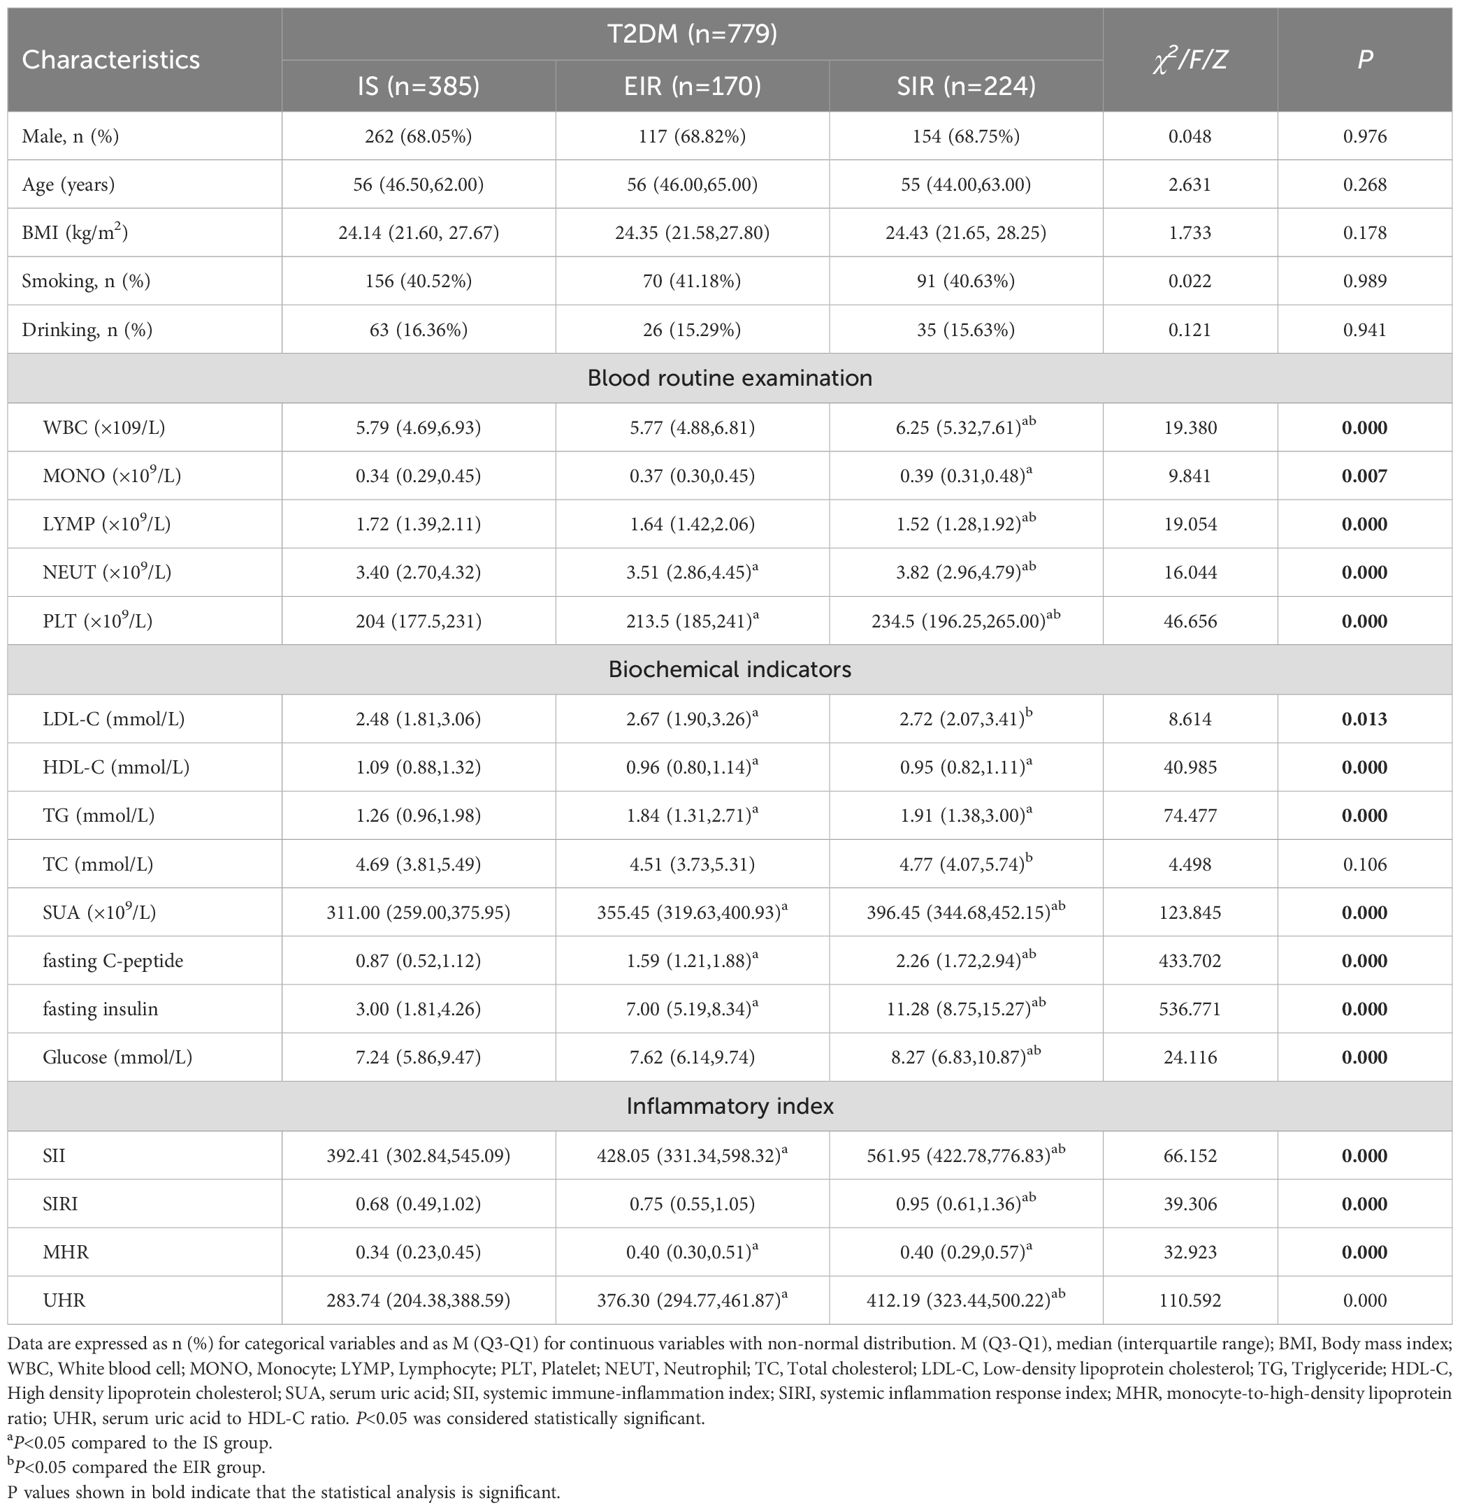
Table 2. Comparison of clinical features of T2DM patients with different HOMA-IR scores [M (Q3–Q1)].
3.2 Correlation analysis
The correlation analysis results of serum SII, SIRI, MHR and UHR in patients with T2DM and HOMA-IR are shown in Table 3. Serum SII, SIRI, MHR and UHR in patients with T2DM were all positively correlated with HOMA-IR (P < 0.05). The rank correlation coefficients of SII, SIRI, MHR and UHR with HOMA-IR were 0.221, 0.170, 0.204 and 0.383, respectively.
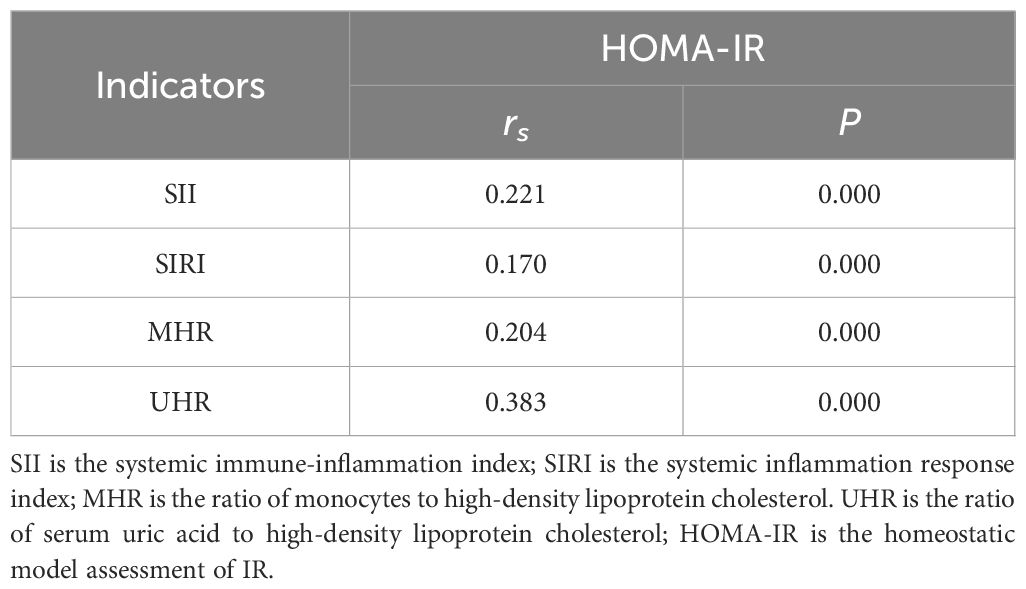
Table 3. Correlation analysis of serum SII, MHR, cTnI, and Gensini scores in patients with AMI.
3.3 Multivariate ordered regression analysis
The results of the parallelism hypothesis test showed that P=0.461 (>0.1), which was in line with the proportional dominance hypothesis, indicating that the regression equations of each model were parallel and meeting the premise of ordered logistic regression analysis. The influencing factors related to the degree of IR in the univariate analysis were included in the multivariate ordered logistic regression model (with the degree of IR as the dependent variable). The results showed that SII, SIRI, MHR and UHR were independent risk factors for IR in patients with T2DM (P < 0.05). The goodness of fit test results of the model (χ² = 1562.475, P = 0.013) indicated that the model fit well (Table 4).
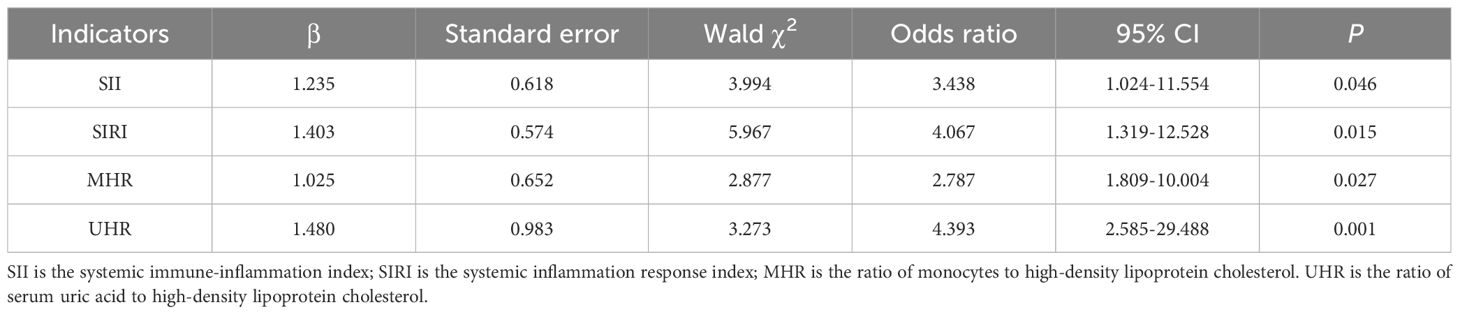
Table 4. Multi-factor ordinal logistic regression for IR in patients with T2DM.
3.4 ROC curve analysis
In this study, the ROC curve was used to evaluate the discriminatory ability of novel inflammatory markers (SII, SIRI, MHR, UHR) for the degree of IR in patients with T2DM. The results showed that in the EIR group, the AUC values of SII, SIRI, MHR and UHR were 0.638, 0.606, 0.617 and 0.71 respectively (P<0.05). When the four indicators were combined for detection, the AUC increased to 0.740, and the sensitivity and specificity reached 58.73% and 79.24% respectively. For the SIR Group, the AUC values of each index were 0.679 for SII, 0.638 for SIRI, 0.600 for MHR, and 0.684 for UHR (P<0.05). After combined detection, the AUC increased to 0.733, at which point the specificity was 76.63% and the sensitivity was 58.03%. It IS worth noting that the AUC values of MHR and UHR in the IS group were 0.550 and 0.593 respectively (P<0.05); SII and SIRI did not show statistically significant in the IS group (P > 0.05). Studies have shown that the combined detection of SII, SIRI, MHR and UHR can be used as potential clinical utility indicators for evaluating the degree of IR in T2DM (for details, see Table 5; Figure 1).
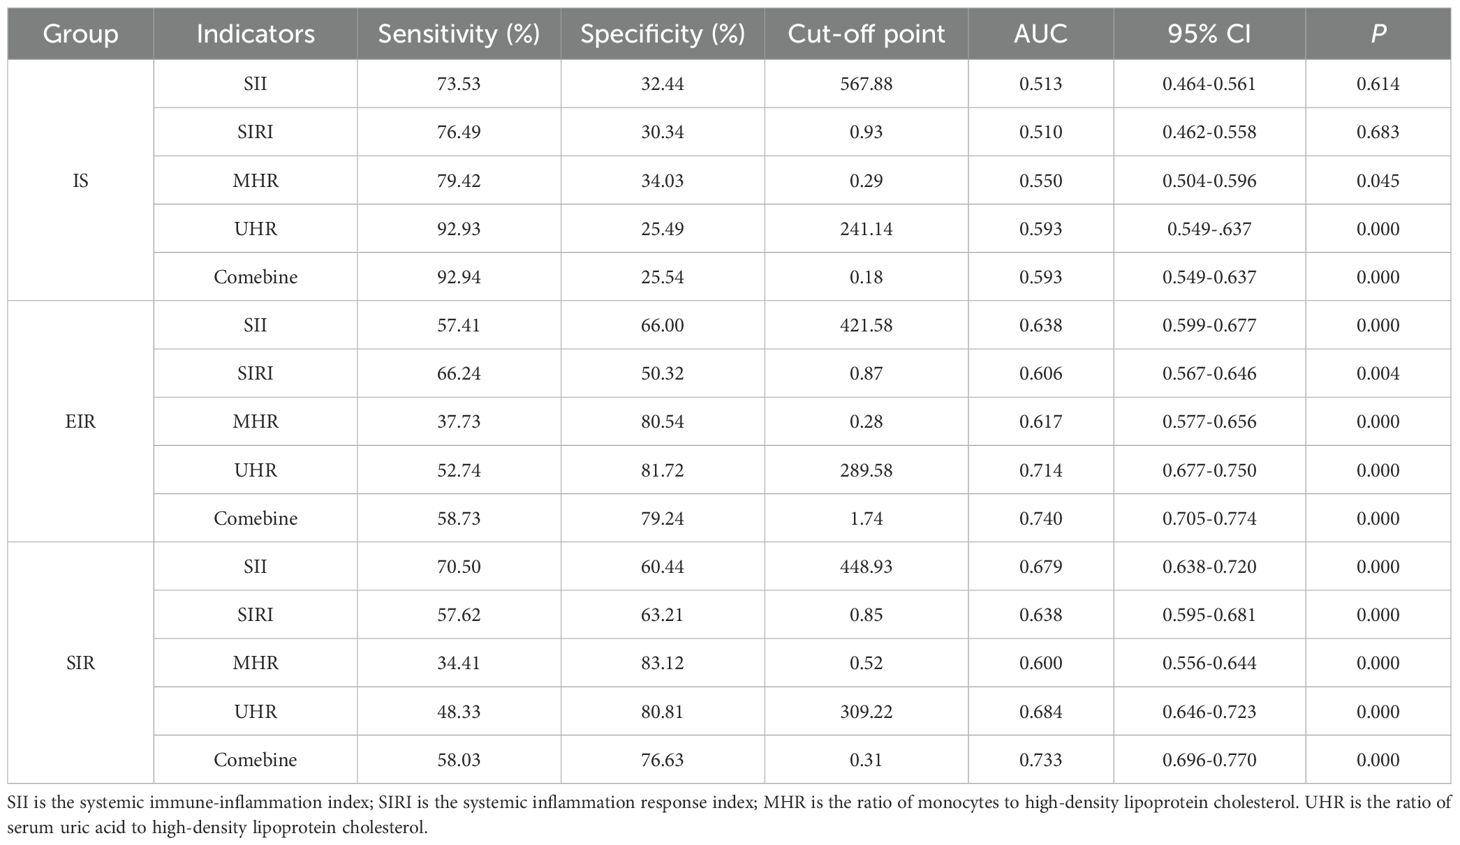
Table 5. ROC curve analysis for the degree of IR in T2DM.
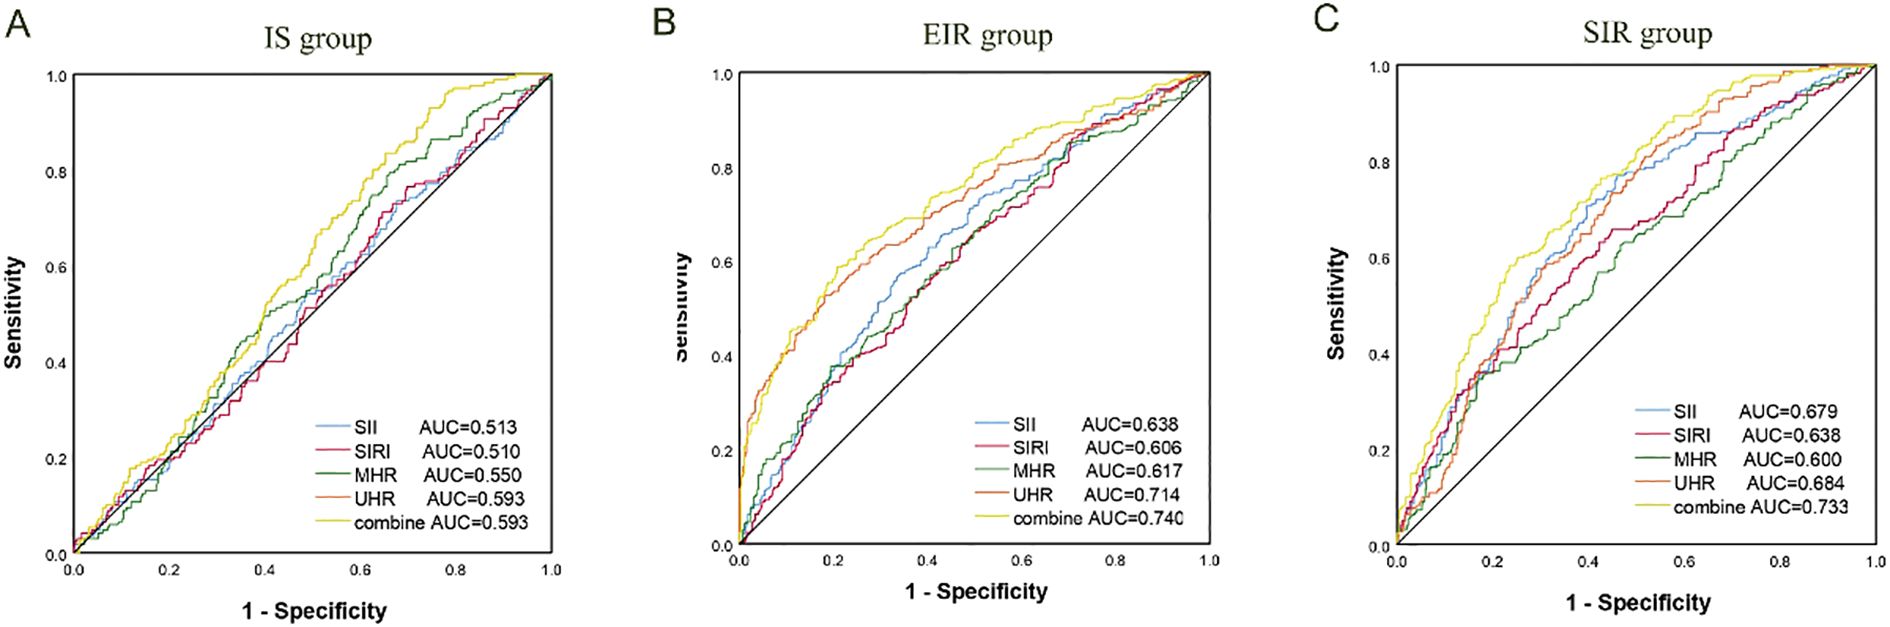
Figure 1. ROC curve for degree of IR in T2DM. (A) IS group; (B) EIR group; (C) SIR group. AUC, Area under the curve; SII, systemic immune-inflammation index; SIRI, systemic inflammation response index; MHR, monocyte-to-high-density lipoprotein ratio; UHR is the ratio of serum uric acid to high-density lipoprotein cholesterol.
4 Discussion
T2DM is an urgent issue facing the health of the global population. The low treatment rate and compliance rate of diabetic patients also aggravate the occurrence and progression of chronic complications in diabetic patients. IR and/or islet β -cell dysfunction are the main causes of T2DM. Patients with T2DM have a long-term hyperglycemic state in their bodies, which is also prone to cause congenital and adaptive immune responses in the body, thereby leading to a chronic and low-grade inflammatory state of the body (30). In addition, the state of hyperglycemia and hyperlipidemia will further aggravate the damage of the islets and cause IR (31). The results of this study show that compared with the healthy population, the counts of WBC and its subcellular populations in patients with T2DM are significantly increased, and the levels of blood lipid, uric acid and blood glucose are also significantly increased. This is consistent with previous studies (31, 32). In addition, the levels of SII, SIRI, UHR and MHR in patients of the T2DM group were also significantly increased. It is indicated that the body of patients with T2DM is in a chronic and low-grade inflammatory state. If this state is maintained for a long time, it may promote the development of T2DM and lead to the occurrence of complications.
The inflammatory process plays an important role in the pathogenesis of T2DM, and the persistent chronic inflammatory response can lead to a decrease in the body’s sensitivity to insulin, causing IR. Therefore, it is very important to explore the role of new inflammatory markers in the occurrence and development of T2DM. Neutrophils are one of the important subgroups of white blood cells and have been proven to play a significant role in the inflammatory response of the body (33). When inflammation occurs in the body, it is the immune cell that responds first in the body, assists macrophages in aggregation, and interacts with antigen-presenting cells at the same time, further promoting the chronic inflammatory response (34). Platelets, known as “inflammatory cells”, are important indicators in routine blood cell counts. When activated, they adhere to endothelial cells and white blood cells and play a key role in inducing inflammatory responses by releasing pro-inflammatory compounds (35). Lymphocytes, as a part of adaptive immunity, play an important role in innate immunity and act as inflammatory mediators with regulatory and protective functions (36). Monocytes are a relatively special subgroup of white blood cells, which can differentiate into macrophages. Both have the ability to regulate inflammatory cytokines (37). Uric acid is synthesized by xanthine oxidase during purine metabolism and is also an extracellular antioxidant that can prevent oxidative stress. Normal uric acid levels have antioxidant effects, while high uric acid levels promote oxidation (38). In addition, abnormal lipid metabolism also plays an important role in the pathogenesis of T2DM and is an important risk factor for the development of T2DM. Studies have shown that hyperlipidemia can accelerate glucose-induced mitochondrial damage, thereby accelerating the occurrence and development of T2DM (32, 39). However, HDL-C has exactly the opposite effect and has antioxidant and anti-inflammatory effects in the occurrence and development of T2DM (40). The results of this study show that compared with patients sensitive to insulin, after IR occurs in patients with T2DM, neutrophils, monocytes, lymphocytes and platelets all increase. At the same time, their uric acid levels also increase significantly, while the HDL-C level decreases significantly. It is suggested that the levels of neutrophils, monocytes, lymphocytes, platelets, uric acid and HDL-C may play important biological roles in the occurrence and development of T2DM. However, due to individualized differences, when IR occurs in patients with T2DM, the above indicators may still be within the 95% confidence interval. Therefore, in recent years, new inflammatory markers based on blood cell subsets and biochemical indicators (such as HDL-C, SUA, etc.) have emerged, providing new and more comprehensive research directions for medical researchers.
SII is a new indicator for evaluating inflammation based on neutrophils, platelets, lymphocytes, etc., which can more objectively reflect the inflammatory changes of the body. SIRI combines neutrophils, monocytes and lymphocytes, etc., and is a novel and easily accessible biomarker of inflammation and the immune system, which is usually related to the intensity of the inflammatory response. Research shows (41) that there is a correlation between leukocytosis and chronic complications of diabetes, and the increase in white blood cells mainly reflects the elevation of neutrophils in the body. When inflammation occurs in the body, white blood cells respond rapidly to inflammatory stimuli, resulting in an increase in neutrophils in the circulation (42). In addition, the increase in interleukin levels can promote the reduction of lymphocytes and the increase of neutrophils (43). In patients with diabetes, platelets exhibit higher activity, leading to the release of inflammatory mediators and thereby attracting more platelets and WBCs to the inflammatory site (44). The MCP-1 secreted by monocytes and macrophages can promote the aggregation of inflammatory cells at the lesion site, thereby stimulating monocytes to secrete IL-1 and IL-6, putting the pancreatic tissue in a micro-inflammatory state, damaging endothelial cells, increasing blood glucose, generating oxidative stress, and triggering IR (45). UHR, which is the result of the combination of uric acid and HDL-C, is a sign of an increased inflammatory response in the body. MHR combines blood cell subsets (monocytes) with HDL-C and is an indicator for evaluating inflammation and oxidative stress. Juraschek et al. pointed out that hyperuricemia increases the risk of T2DM by 1.87 times and IR by 1.36 times (46). Furthermore, for every 1 mg/dL increase in serum uric acid level, the risk of T2DM increases by 17% (47). Furthermore, HDL-C is an anti-inflammatory and antioxidant factor, and the increase in its level is regarded as a protective factor against IR (48, 49). Therefore, SII, SIRI, UHR and MHR may be direct indicators of factors such as blood cell subcomponents, uric acid and HDL-C involved in the chronic inflammatory response of the body. Guo et al. (50) and Zhao et al. (51) conducted a study using NHANES data, and the results showed that there was a positive correlation between SII and HOMA-IR. The research results of Song et al. (26) show that the levels of SIRI were higher in T2DM-PAD patients, and they were independently linked with its clinical severity. In addition, both MHR (49) and UHR (52) are associated with IR levels. This study grouped patients with T2DM based on their different IR levels and observed the levels of SII, SIRI, UHR and MHR, which differed from the strategies of the above-mentioned studies. The results of this study show that the levels of SII, SIRI, UHR and MHR in patients of the T2DM group were significantly increased. Moreover, compared with patients sensitive to insulin, patients with early IR and those with significantIR have higher levels of SII, SIRI, UHR and MHR. Meanwhile, all four indicators were positively correlated with IR in patients with T2DM. Through multivariate ordered regression analysis, the results showed that all four indicators were independent risk factors for IR in patients with T2DM. In addition, the ROC analysis showed that the four indicators had good diagnostic efficacy for IR in patients with T2DM. However, in the IS group, SII and SIRI did not show statistically significant clinical utility. This might be because the bodies of insulin-sensitive individuals did not have obvious inflammatory responses, even though they were in a chronic and low-grade inflammatory state.
There is a potential mechanistic explanation for the association between SII, SIRI, and IR. Platelets play a central role in hemostasis and thrombosis and actively contribute to inflammatory responses by releasing various pro-inflammatory cytokines, growth factors, and chemokines. These mediators promote endothelial dysfunction, IR, and atherosclerosis (53). Neutrophils further propagate the inflammatory cascade by secreting pro-inflammatory cytokines, generating oxidative stress, and releasing proteolytic enzymes. These actions contribute to endothelial dysfunction, exacerbate IR, and induce pancreatic β-cell apoptosis (54). Monocytes and macrophages secrete monocyte chemoattractant protein-1 (MCP-1), which facilitates the recruitment of inflammatory cells to sites of injury. This process stimulates monocytes to release interleukin (IL)-1 and IL-6, resulting in a persistent low-grade inflammatory state within pancreatic tissue. This inflammation damages endothelial cells, elevates blood glucose levels, induces oxidative stress, and ultimately triggers IR (45). Lymphocytes, as key mediators of adaptive immunity, upon activation, release cytokines that amplify systemic inflammation, disrupt glucose homeostasis, and accelerate the progression of diabetic complications (55). In T2DM, elevated levels of neutrophils, monocytes, and platelets, along with relative lymphopenia, are commonly observed, underscoring the pivotal role of chronic inflammation in disease onset and progression. These alterations contribute to increased levels of SII and SIRI, reflecting a heightened inflammatory state that mediates IR. Potential mechanisms linking MHR and UHR with insulin resistance have also been proposed. Recent experimental studies have confirmed the critical involvement of monocyte-derived immunity in the pathogenesis of T2DM, contributing to β-cell dysfunction, impaired insulin secretion, and the development of IR (56). Elevated uric acid levels can enhance adipocyte oxidative stress by upregulating MCP-1 expression and downregulating adiponectin, a pro-oxidative effect that may promote adipose tissue accumulation, thereby contributing to insulin resistance (57). Additionally, uric acid-induced reductions in nitric oxide bioavailability impair skeletal muscle glucose uptake, further aggravating IR (52, 58). HDL-C exerts multiple protective effects, including reverse cholesterol transport, anti-inflammatory actions, antithrombotic properties, vasodilation, and anti-apoptotic functions (59). In patients with T2DM, monocyte counts and blood uric acid levels are elevated, while HDL-C levels are reduced. These changes lead to increased levels of the MHR and UHR, which may promote the development of insulin resistance. Given that SII, SIRI, MHR, and UHR are composite markers reflecting both inflammatory activity and lipid metabolism, our findings suggest that these four indices may serve as potential biomarkers for identifying insulin resistance in individuals with T2DM.
To sum up, the levels of the novel inflammatory markers SIRI, SII, UHR and MHR in patients with T2DM increase and are positively correlated with IR. They are independent risk factors for IR in T2DM patients and have clinical utility to a certain extent, which can provide a reference basis for the early clinical prevention, diagnosis and treatment of IR in T2DM patients. This study also has certain limitations. Although the four inflammatory indicators are readily available in clinical practice, due to individual differences, the reduction in the numbers of lymphocytes, neutrophils or platelets is also very common and may lead to selection bias. In addition, some unknown confounding factors, such as the duration of T2DM, have an impact on the research conclusions. And, the retrospective study also limited the persuasiveness of the results of this study and prevented a comprehensive observation of the dynamic changes of each index. Although the AUC of the combined detection of the EIR and SIR Groups did not reach the high accuracy (AUC > 0.9) in the results of this study, it was still superior to the detection of a single indicator. This indicates that large-sample, multi-center prospective studies are still needed before actual clinical application to provide theoretical support for this purpose, which also provides a direction for subsequent researchers. In the future, we will also expand the sample size and improve the research methods, with the aim of providing a more comprehensive reference basis for the clinical diagnosis and treatment of IR in patients with T2DM.
Data availability statement
The raw data supporting the conclusions of this article will be made available by the authors, without undue reservation.
Ethics statement
The studies involving humans were approved by Ethics Committee of Xi ‘an International Medical Center Hospital. The studies were conducted in accordance with the local legislation and institutional requirements. The ethics committee/institutional review board waived the requirement of written informed consent for participation from the participants or the participants’ legal guardians/next of kin because this study is a retrospective study.
Author contributions
RH: Writing – review & editing, Conceptualization, Writing – original draft, Data curation. HS: Writing – original draft, Methodology, Conceptualization, Writing – review & editing. HL: Methodology, Visualization, Writing – original draft. JL: Conceptualization, Writing – review & editing, Project administration, Writing – original draft.
Funding
The author(s) declare that no financial support was received for the research and/or publication of this article.
Conflict of interest
The authors declare that the research was conducted in the absence of any commercial or financial relationships that could be construed as a potential conflict of interest.
Generative AI statement
The author(s) declare that no Generative AI was used in the creation of this manuscript.
Any alternative text (alt text) provided alongside figures in this article has been generated by Frontiers with the support of artificial intelligence and reasonable efforts have been made to ensure accuracy, including review by the authors wherever possible. If you identify any issues, please contact us.
Publisher’s note
All claims expressed in this article are solely those of the authors and do not necessarily represent those of their affiliated organizations, or those of the publisher, the editors and the reviewers. Any product that may be evaluated in this article, or claim that may be made by its manufacturer, is not guaranteed or endorsed by the publisher.
References
1. Sun H, Saeedi P, Karuranga S, Pinkepank M, Ogurtsova K, Duncan BB, et al. IDF Diabetes Atlas: Global, regional and country-level diabetes prevalence estimates for 2021 and projections for 2045. Diabetes Res Clin Pract. (2022) 183:109119. doi: 10.1016/j.diabres.2021.109119
2. Wang M, Chen M, Guo R, Ding Y, Zhang H, and He Y. The improvement of sulforaphane in type 2 diabetes mellitus (T2DM) and related complications:A review. Trends Food Sci Technology. (2022) 129:397–407. doi: 10.1016/j.tifs.2022.10.007
3. Kanwugu ON, Glukhareva TV, Danilova IG, and Kovaleva EG. Natural antioxidants in diabetes treatment and management: prospects of astaxanthin. Crit Rev Food Sci Nutr. (2022) 62:5005–28. doi: 10.1080/10408398.2021.1881434
4. Yingrui W, Zheng L, Guoyan L, and Hongjie W. Research progress of active ingredients of Scutellaria baicalensis in the treatment of type 2 diabetes and its complications. BioMed Pharmacother. (2022) 148:112690. doi: 10.1016/j.biopha.2022.112690
5. Xu N, Zhou Y, Lu X, and Chang Y. Auricularia auricula-judae (Bull.) polysaccharides improve type 2 diabetes in HFD/STZ-induced mice by regulating the AKT/AMPK signaling pathways and the gut microbiota. J Food Sci. (2021) 86:5479–94. doi: 10.1111/1750-3841.15963
6. Demir S, Nawroth PP, Herzig S, and Ekim Üstünel B. Emerging targets in type 2 diabetes and diabetic complications. Adv Sci (Weinh). (2021) 8:e2100275. doi: 10.1002/advs.202100275
7. Teck J. Diabetes-associated comorbidities. Prim Care. (2022) 49:275–86. doi: 10.1016/j.pop.2021.11.004
8. Tam CS, Xie W, Johnson WD, Cefalu WT, Redman LM, and Ravussin E. Defining insulin resistance from hyperinsulinemic-euglycemic clamps. Diabetes Care. (2012) 35:1605–10. doi: 10.2337/dc11-2339
9. Wallace TM, Levy JC, and Matthews DR. Use and abuse of HOMA modeling. Diabetes Care. (2004) 27:1487–95. doi: 10.2337/diacare.27.6.1487
10. Rudvik A and Månsson M. Evaluation of surrogate measures of insulin sensitivity - correlation with gold standard is not enough. BMC Med Res Methodol. (2018) 18:64. doi: 10.1186/s12874-018-0521-y
11. Yang Y, Zhang Y, Wang J, Ning X, Zhang Y, Zhao T, et al. Sex differences in the association of HOMA-IR index and BDNF in han chinese patients with chronic schizophrenia. Front Psychiatry. (2021) 12:656230. doi: 10.3389/fpsyt.2021.656230
12. Matli B, Schulz A, Koeck T, Falter T, Lotz J, Rossmann H, et al. Distribution of HOMA-IR in a population-based cohort and proposal for reference intervals. Clin Chem Lab Med. (2021) 59:1844–51. doi: 10.1515/cclm-2021-0643
13. Antar SA, Ashour NA, Sharaky M, Khattab M, Ashour NA, Zaid RT, et al. Diabetes mellitus: Classification, mediators, and complications; A gate to identify potential targets for the development of new effective treatments. BioMed Pharmacother. (2023) 168:115734. doi: 10.1016/j.biopha.2023.115734
14. Wu CS, Lin CC, Hsieh FC, Wu TY, and Fang AH. Antiobesity Effect of Lacticaseibacillus paracasei LM-141 on High-Fat Diet-Induced Rats through Alleviation of Inflammation and Insulin Resistance. Evid Based Complement Alternat Med. (2023) 2023:1011591. doi: 10.1155/2023/1011591
15. Weinberg Sibony R, Segev O, Dor S, and Raz I. Overview of oxidative stress and inflammation in diabetes. J Diabetes. (2024) 16:e70014. doi: 10.1111/1753-0407.70014
16. Li X, Wang L, Liu M, Zhou H, and Xu H. Association between neutrophil-to-lymphocyte ratio and diabetic kidney disease in type 2 diabetes mellitus patients: a cross-sectional study. Front Endocrinol (Lausanne). (2024) 14:1285509. doi: 10.3389/fendo.2023.1285509
17. Blériot C, Dalmas É, Ginhoux F, and Venteclef N. Inflammatory and immune etiology of type 2 diabetes. Trends Immunol. (2023) 44:101–9. doi: 10.1016/j.it.2022.12.004
18. Pretorius L, Thomson GJA, Adams RCM, Nell TA, Laubscher WA, and Pretorius E. Platelet activity and hypercoagulation in type 2 diabetes. Cardiovasc Diabetol. (2018) 17:141. doi: 10.1186/s12933-018-0783-z
19. Meshkani R, Zargari M, and Larijani B. The relationship between uric acid and metabolic syndrome in normal glucose tolerance and normal fasting glucose subjects. Acta Diabetol. (2011) 48:79–88. doi: 10.1007/s00592-010-0231-3
20. Han T, Cheng Y, Tian S, Wang L, Liang X, Duan W, et al. Changes in triglycerides and high-density lipoprotein cholesterol may precede peripheral insulin resistance, with 2-h insulin partially mediating this unidirectional relationship: a prospective cohort study. Cardiovasc Diabetol. (2016) 15:154. doi: 10.1186/s12933-016-0469-3
21. Sun H, Liu H, Li J, Kou J, and Yang C. Analysis of the clinical predictive value of the novel inflammatory indices SII, SIRI, MHR and NHR in patients with acute myocardial infarction and their extent of coronary artery disease. J Inflammation Res. (2024) 17:7325–38. doi: 10.2147/JIR.S479253
22. Xu H, Feng H, Zhang W, Wei F, Zhou L, Liu L, et al. Prediction of immune-related adverse events in non-small cell lung cancer patients treated with immune checkpoint inhibitors based on clinical and hematological markers: Real-world evidence. Exp Cell Res. (2022) 416:113157. doi: 10.1016/j.yexcr.2022.113157
23. Aktas G, Kocak MZ, Bilgin S, Atak BM, Duman TT, and Kurtkulagi O. Uric acid to HDL cholesterol ratio is a strong predictor of diabetic control in men with type 2 diabetes mellitus. Aging Male. (2020) 23:1098–102. doi: 10.1080/13685538.2019.1678126
24. Zhang J, Fan X, Xu Y, Wang K, Xu T, Han T, et al. Association between inflammatory biomarkers and mortality in individuals with type 2 diabetes: NHANES 2005-2018. Diabetes Res Clin Pract. (2024) 209:111575. doi: 10.1016/j.diabres.2024.111575
25. Kocak MZ, Aktas G, Erkus E, Sincer I, Atak B, and Duman T. Serum uric acid to HDL-cholesterol ratio is a strong predictor of metabolic syndrome in type 2 diabetes mellitus. Rev Assoc Med Bras (1992). (2019) 65:9–15. doi: 10.1590/1806-9282.65.1.9
26. Song Y, Zhao Y, Shu Y, Zhang L, Cheng W, Wang L, et al. Combination model of neutrophil to high-density lipoprotein ratio and system inflammation response index is more valuable for predicting peripheral arterial disease in type 2 diabetic patients: A cross-sectional study. Front Endocrinol (Lausanne). (2023) 14:1100453. doi: 10.3389/fendo.2023.1100453
27. American Diabetes Association. Glycemic targets: standards of medical care in diabetes-2021. Diabetes Care. (2021) 44:S73–84. doi: 10.2337/dc21-S006
28. Matthews DR, Hosker JP, Rudenski AS, Naylor BA, Treacher DF, and Turner RC. Homeostasis model assessment: insulin resistance and beta-cell function from fasting plasma glucose and insulin concentrations in man. Diabetologia. (1985) 28:412–9. doi: 10.1007/BF00280883
29. Abu AlSel BT, Mahmoud AA, Hamed EO, Hakim NA, Sindi AAA, Jawad NMM, et al. Iron homeostasis-related parameters and hepcidin/ferritin ratio: emerging sex-specific predictive markers for metabolic syndrome. Metabolites. (2024) 14:473. doi: 10.3390/metabo14090473
30. Delalat S, Sultana I, Osman H, Sieme M, Zhazykbayeva S, Herwig M, et al. Dysregulated inflammation, oxidative stress, and protein quality control in diabetic HFpEF: unraveling mechanisms and therapeutic targets. Cardiovasc Diabetol. (2025) 24:211. doi: 10.1186/s12933-025-02734-4
31. Li Y, Guo X, Ge J, Li Q, Chen X, Zhu Y, et al. Sex differences in associations of metabolic inflammation and insulin resistance with incident type 2 diabetes mellitus: a retrospective cohort of adults with annual health examinations. Lipids Health Dis. (2025) 24:50. doi: 10.1186/s12944-025-02473-1
32. Kosekli MA and Aktas G. Serum uric acid to hdl cholesterol ratio is associated with diabetic control in new onset type 2 diabetic population. Acta Clin Croat. (2023) 62:277–82. doi: 10.20471/acc.2023.62.02.04
33. Luo J, Thomassen JQ, Nordestgaard BG, Tybjærg-Hansen A, and Frikke-Schmidt R. Neutrophil counts and cardiovascular disease. Eur Heart J. (2023) 44:4953–64. doi: 10.1093/eurheartj/ehad649
34. Herrero-Cervera A, Soehnlein O, and Kenne E. Neutrophils in chronic inflammatory diseases. Cell Mol Immunol. (2022) 19:177–91. doi: 10.1038/s41423-021-00832-3
35. Repsold L and Joubert AM. Platelet function, role in thrombosis, inflammation, and consequences in chronic myeloproliferative disorders. Cells. (2021) 10:3034. doi: 10.3390/cells10113034
36. Chen H, Sun L, Feng L, Yin Y, and Zhang W. Role of innate lymphoid cells in obesity and insulin resistance. Front Endocrinol (Lausanne). (2022) 13:855197. doi: 10.3389/fendo.2022.855197
37. Mraz M and Haluzik M. The role of adipose tissue immune cells in obesity and low-grade inflammation. J Endocrinol. (2014) 222:R113–27. doi: 10.1530/JOE-14-0283
38. Prabhakar AP and Lopez-Candales A. Uric acid and cardiovascular diseases: a reappraisal. Postgrad Med. (2024) 136:615–23. doi: 10.1080/00325481.2024.2377952
39. Song Y, Yang Y, Zhang J, Wang Y, He W, Zhang X, et al. The apoB100/apoAI ratio is independently associated with the severity of coronary heart disease: a cross sectional study in patients undergoing coronary angiography. Lipids Health Dis. (2015) 14:150. doi: 10.1186/s12944-015-0155-6
40. Liao LP, Wu L, and Yang Y. The relationship between triglyceride/high-density lipoprotein cholesterol ratio and coronary microvascular disease. BMC Cardiovasc Disord. (2023) 23:228. doi: 10.1186/s12872-023-03229-4
41. Nah EH, Cho S, Park H, Kim S, and Cho HI. Associations of complete blood count parameters with pancreatic beta-cell function and insulin resistance in prediabetes and type 2 diabetes mellitus. J Clin Lab Anal. (2022) 36:e24454. doi: 10.1002/jcla.24454
42. Chung KP, Chang HT, Lo SC, Chang LY, Lin SY, Cheng A, et al. Severe lymphopenia is associated with elevated plasma interleukin-15 levels and increased mortality during severe sepsis. Shock. (2015) 43:569–75. doi: 10.1097/SHK.0000000000000347
43. Fonseka TM, McIntyre RS, Soczynska JK, and Kennedy SH. Novel investigational drugs targeting IL-6 signaling for the treatment of depression. Expert Opin Investig Drugs. (2015) 24:459–75. doi: 10.1517/13543784.2014.998334
44. Kaur R, Kaur M, and Singh J. Endothelial dysfunction and platelet hyperactivity in type 2 diabetes mellitus: molecular insights and therapeutic strategies. Cardiovasc Diabetol. (2018) 17:121. doi: 10.1186/s12933-018-0763-3
45. Rehman K and Akash MS. Mechanisms of inflammatory responses and development of insulin resistance: how are they interlinked? J BioMed Sci. (2016) 23:87. doi: 10.1186/s12929-016-0303-y
46. Juraschek SP, McAdams-Demarco M, Miller ER, Gelber AC, Maynard JW, Pankow JS, et al. Temporal relationship between uric acid concentration and risk of diabetes in a community-based study population. Am J Epidemiol. (2014) 179:684–91. doi: 10.1093/aje/kwt320
47. Kodama S, Saito K, Yachi Y, Asumi M, Sugawara A, Totsuka K, et al. Association between serum uric acid and development of type 2 diabetes. Diabetes Care. (2009) 32:1737–42. doi: 10.2337/dc09-0288
48. Lotfollahi Z, Dawson J, Fitridge R, and Bursill C. The anti-inflammatory and proangiogenic properties of high-density lipoproteins: an emerging role in diabetic wound healing. Adv Wound Care (New Rochelle). (2021) 10:370–80. doi: 10.1089/wound.2020.1308
49. Okuyan O, Dumur S, Elgormus N, and Uzun Hs. The relationship between vitamin D, inflammatory markers, and insulin resistance in children. Nutrients. (2024) 16:3005. doi: 10.3390/nu16173005
50. Guo H, Wan C, Zhu J, Jiang X, and Li S. Association of systemic immune-inflammation index with insulin resistance and prediabetes: a cross-sectional study. Front Endocrinol (Lausanne). (2024) 15:1377792. doi: 10.3389/fendo.2024.1377792
51. Zhao Q, Liu X, Xu J, Rao X, and Liu M. Association of systemic immunity-inflammation index with type 2 diabetes and insulin resistance in NHANES 2005-2018. Sci Rep. (2024) 14:30133. doi: 10.1038/s41598-024-79763-8
52. Zhou X and Xu J. Association between serum uric acid-to-high-density lipoprotein cholesterol ratio and insulin resistance in patients with type 2 diabetes mellitus. J Diabetes Investig. (2024) 15:113–20. doi: 10.1111/jdi.14086
53. Al-Mansoori L, Al-Jaber H, Prince MS, and Elrayess MA. Role of inflammatory cytokines, growth factors and adipokines in adipogenesis and insulin resistance. Inflammation. (2022) 45:31–44. doi: 10.1007/s10753-021-01559-z
54. Dludla PV, Mabhida SE, Ziqubu K, Nkambule BB, Mazibuko-Mbeje SE, Hanser S, et al. Pancreatic β-cell dysfunction in type 2 diabetes: Implications of inflammation and oxidative stress. World J Diabetes. (2023) 14:130–46. doi: 10.4239/wjd.v14.i3.130
55. Ge T, Yu Y, Cui J, and Cai L. The adaptive immune role of metallothioneins in the pathogenesis of diabetic cardiomyopathy: good or bad. Am J Physiol Heart Circ Physiol. (2019) 317:H264–75. doi: 10.1152/ajpheart.00123.2019
56. Donath MY, Dinarello CA, and Mandrup-Poulsen T. Targeting innate immune mediators in type 1 and type 2 diabetes. Nat Rev Immunol. (2019) 19:734–46. doi: 10.1038/s41577-019-0213-9
57. Aktas G. Exploring the link: Hemogram-derived markers in type 2 diabetes mellitus and its complications. World J Diabetes. (2025) 16:105233. doi: 10.4239/wjd.v16.i7.105233
58. Asma Sakalli A, Küçükerdem HS, and Aygün O. What is the relationship between serum uric acid level and insulin resistance?: A case-control study. Med (Baltimore). (2023) 102:e36732. doi: 10.1097/MD.0000000000036732
Keywords: type 2 diabetes mellitus systemic, systemic immune-inflammation index, systemic inflammation response index, uric acid to HDL-C ratio, monocyte to HDL-C ratio
Citation: He R, Sun H, Liu H and Li J (2025) The relationship between novel inflammatory markers SII, SIRI, MHR, UHR and insulin resistance in patients with type 2 diabetes: based on a retrospective analysis. Front. Endocrinol. 16:1648823. doi: 10.3389/fendo.2025.1648823
Received: 17 June 2025; Accepted: 22 August 2025;
Published: 09 September 2025.
Edited by:
Serafino Fazio, Federico II University Hospital, ItalyReviewed by:
Neelam Singh, HRIT Group of Institutions, IndiaYazeed Alshuweishi, King Saud University, Saudi Arabia
Copyright © 2025 He, Sun, Liu and Li. This is an open-access article distributed under the terms of the Creative Commons Attribution License (CC BY). The use, distribution or reproduction in other forums is permitted, provided the original author(s) and the copyright owner(s) are credited and that the original publication in this journal is cited, in accordance with accepted academic practice. No use, distribution or reproduction is permitted which does not comply with these terms.
*Correspondence: Jinxia Li, OTQzOTYwMTJAcXEuY29t
†These authors have contributed equally to this work and share first authorship