 Lee Yam Poon1†Li Mei Hsu1†
 Lai Kwan Lam2,3*†
 Xiaoqing Huang1
 Pengli Xu2
 Qiuer Liang2,4
 Pengcheng Xie2,5
 Shuyu Yang1*
- 1Center of Integrated Chinese and Western Medicine, The First Affiliated Hospital of Xiamen University, School of Medicine, Xiamen University, Xiamen, Fujian, China
- 2School of Traditional Chinese Medicine, Jinan University, Guangzhou, China
- 3Department of Obstetrics and Gynaecology, Faculty of Medicine, The Chinese University of Hong Kong, Hong Kong, Hong Kong SAR, China
- 4Affiliated Dongguan People’s Hospital, Southern Medical University, Dongguan, China
- 5The Third Affiliated Hospital, Guangzhou University of Traditional Chinese Medicine, Guangzhou, China
Objective: This study explores the therapeutic potential and mechanisms of Modified Danggui Buxue Decoction (MDBD) in diabetic retinopathy (DR) using network pharmacology, bioinformatics, machine learning, Mendelian randomization (MR), molecular docking, and in vitro experiments.
Methods: A network pharmacology was constructed in order to screen core components and targets. Analysis of samples from the GEO database was performed for target and immune cell analysis, resulting in the identification of significantly differentially expressed core genes (SDECGs). A machine learning model was utilized to screen feature genes and construct nomogram. Preliminary validation was carried out using molecular docking, another GEO dataset, and MR. Subsequently, samples were clustered based on SDECGs expression and consensus clustering, followed by an analysis between clusters. SDECGs expression was scored and differences between clusters were analyzed. Finally, in vitro experiments were conducted on MMCs to assess the effects of beta-sitosterol, the primary active component of MDBD, and siRNA on DR-related biomarkers using CCK-8 assays, ELISA, western blotting and RT-qPCR.
Results: This study identified the core components of MDBD, including quercetin, stigmasterol, beta-sitosterol, kaempferol, and 14 differentially expressed SDECGs between DR and control groups, with both positive and negative immune cell regulatory effects. Five feature genes (CCND1, ERBB2, INSR, TP53, SERPINE1) were identified and used to construct a predictive model. MR analysis revealed a causal link between elevated ERBB2 levels and increased DR risk (Odds Ratio [OR]=1.860, 95% CI: 1.247-2.774, P = 0.002) using the weighted median method. Beta-sitosterol displayed high binding affinity with CCND1, ERBB2, INSR, and SERPINE1. Cluster analysis categorized DR samples into four groups, with C1 showing low and C2 high SDECG expression and immune cell upregulation. Significant differences in SDECGs and DEGs scores were observed between C1 and C2. In vitro, ERBB2 expression was significantly elevated in DR cell model. Beta-sitosterol inhibited ERBB2 protein and mRNA expression and reduced IL-1β, VEGF, and ANGPTL6 secretion. ERBB2 inhibition also reduced these biomarkers.
Conclusion: MDBD treats DR by targeting SDECGs, modulating immune responses, and reducing inflammation. Beta-sitosterol and ERBB2 inhibition showed significant therapeutic effects, offering valuable insights for clinical application and future research directions.
1 Introduction
Diabetic retinopathy (DR), a major complication of diabetes mellitus (DM), is the leading cause of visual impairment and preventable blindness among working-age adults worldwide (1). It is classified into non-proliferative DR (NPDR) and proliferative DR (PDR), both of which result from hyperglycemia-induced damage to retinal blood vessels, causing swelling, leakage, and eventually bilateral vision loss (2). The global prevalence of DR is estimated to range from 30% to 40%, with developing countries facing higher rates due to limited access to healthcare and resources (3–5). Currently, approximately 93 million people are affected by DR globally (6), and modern lifestyle factors, such as physical inactivity and sedentary behavior, further contribute to its prevalence (7). Both type 1 and type 2 diabetes mellitus (T1DM and T2DM) accelerate the progression of DR, with poor glycemic control, hypertension, hypercholesterolemia, and insufficient physical activity identified as key risk factors (8, 9). Alarmingly, the global incidence of DR among adults is expected to rise to 129.84 million by 2030 and 160.50 million by 2045 (10). Management strategies for DR aim to mitigate pathological microvascular changes and preserve visual acuity (11). Intravitreal agents, such as anti-VEGF therapies like aflibercept and ranibizumab, and corticosteroid implants including dexamethasone and fluocinolone, have shown significant efficacy in reducing vision-threatening complications, particularly diabetic macular edema (DME) and PDR (12). However, anti-VEGF therapies are associated with adverse effects, including macular ischemia, retinal pigment epithelial tears, elevated intraocular pressure, endophthalmitis, retinal vasculitis, and retinal artery occlusion (13). Corticosteroid treatments also pose risks, such as inflammation, cataract formation, vision deterioration, uveitis, ocular discomfort, blurred vision, and retinal detachment, which may lead to lens opacity and vision loss (14). These challenges show the importance of developing new management approaches to reduce complications and improve patient outcomes.
In China, Traditional Chinese Medicine (TCM) has been widely applied in the treatment of diabetic retinopathy (DR), with its efficacy supported by clinical trials. A network meta-analysis has demonstrated that integrating TCM with conventional Western therapies produces better outcomes compared to Western medicine alone (15). The Modified Danggui Buxue Decoction (MDBD), comprising Astragalus membranaceus (Fisch.) Bge., Angelica sinensis (Oliv.) Diels, and Panax notoginseng (Burk.) F.H.Chen. in a 1:5:1 ratio, is recognized for its ability to nourish qi, replenish blood, and resolve stasis, thereby improving DR (16). Astragalus membranaceus (Fisch.) Bge., a perennial herb from the Leguminosae family, is a prominent traditional Chinese medicine known for its function in replenishing Qi and elevating Yang in TCM theory (17). The dried root of this herb contains bioactive compounds, such as polysaccharides, flavonoids, and saponins, which exhibit immunomodulatory, anti-inflammatory, and anti-tumor activities (18–20). Angelica sinensis (Oliv.) Diels, the dried root of a perennial herb in the Umbelliferae family, has long been used in Chinese medicine for its role in nourishing and invigorating the blood (21). Its therapeutic effects are attributed to mechanisms such as antioxidant activity, regulation of apoptosis, and modulation of inflammatory responses (22–24). Panax notoginseng (Burk.) F.H.Chen., commonly known as a traditional chinese medicinal herb, a widely utilized traditional Chinese medicinal herb, has been employed for centuries to promote blood circulation and stop bleeding, making it a vital component in haemostatic and tonic formulations (25). Its pharmacological properties include significant effects on the cardiovascular and immune systems, as well as haemostatic, anti-inflammatory, and anti-tumor activities (26–28). MDBD integrates the synergistic effects of three potent herbs, offering a comprehensive therapeutic approach to addressing blood-related disorders and promoting overall health.
Sudies have demonstrated the compounds extracted from Astragalus membranaceus (Fisch.) Bge., Angelica sinensis (Oliv.) Diels, and Panax notoginseng (Burk.) F.H.Chen. in MDBD may contribute to its benefits for DR. For example, astragaloside I, extracted from Astragalus membranaceus, has been shown to reduce renal fibrosis in diabetic kidney disease by inhibiting HDAC3 and TGF-β1, thereby regulating the Klotho/TGF-β1/Smad2/3 pathway (29). Similarly, Angelica polysaccharides from Angelica sinensis have demonstrated the ability to alleviate glycemic disorders in T2D KKAy mice by improving gut microbiota composition and function (30). In addition, ginsenoside Rb1, the main active compound from Panax notoginseng, has been reported to reduce high glucose-induced podocyte apoptosis and mitochondrial damage by targeting aldose reductase, slowing the progression of diabetic kidney disease (31).
Our previous clinical studies have shown that MDBD effectively improves retinal health in patients with non-proliferative diabetic retinopathy (NPDR). Fundus images revealed reductions in microaneurysms, hemorrhages, and exudations, alongside improvements in visual acuity, both superior to the untreated NPDR or calcium dobesilate group (32–34). Key indicators of blood routine, including White Blood Cell Count (WBC) and Neutrophil Count (NE), liver function indicators Alanine Aminotransferase (ALT) and Aspartate Aminotransferase (AST), and kidney function indicators Blood Urea Nitrogen (BUN), Creatinine (CRE), and Uric Acid (UA), remained within normal ranges, with no significant differences observed after treatment (32, 33). MDBD demonstrates comparable efficacy and a favorable safety profile, showing promise as a reliable and safe treatment option. Furthermore, our previous study revealed that MDBD protects retinal Müller cells from hypoxia-induced apoptosis by inhibiting the ATF4/CHOP pathway, reinforcing its protective role in DR (35). Despite these encouraging results, the mechanisms behind MDBD’s therapeutic effects in DR remain unclear.
This study aims to comprehensively analyze MDBD’s role in DR treatment, employing network pharmacology to identify its key components and therapeutic targets. Differentially expressed core genes (SDECGs) were identified using samples from the GEO database. Validation was conducted through molecular docking, additional GEO datasets, and Mendelian randomization (MR) to elucidate the specific mechanisms and pathways involved. These findings provide a foundation for further experimental validation (Figure 1).
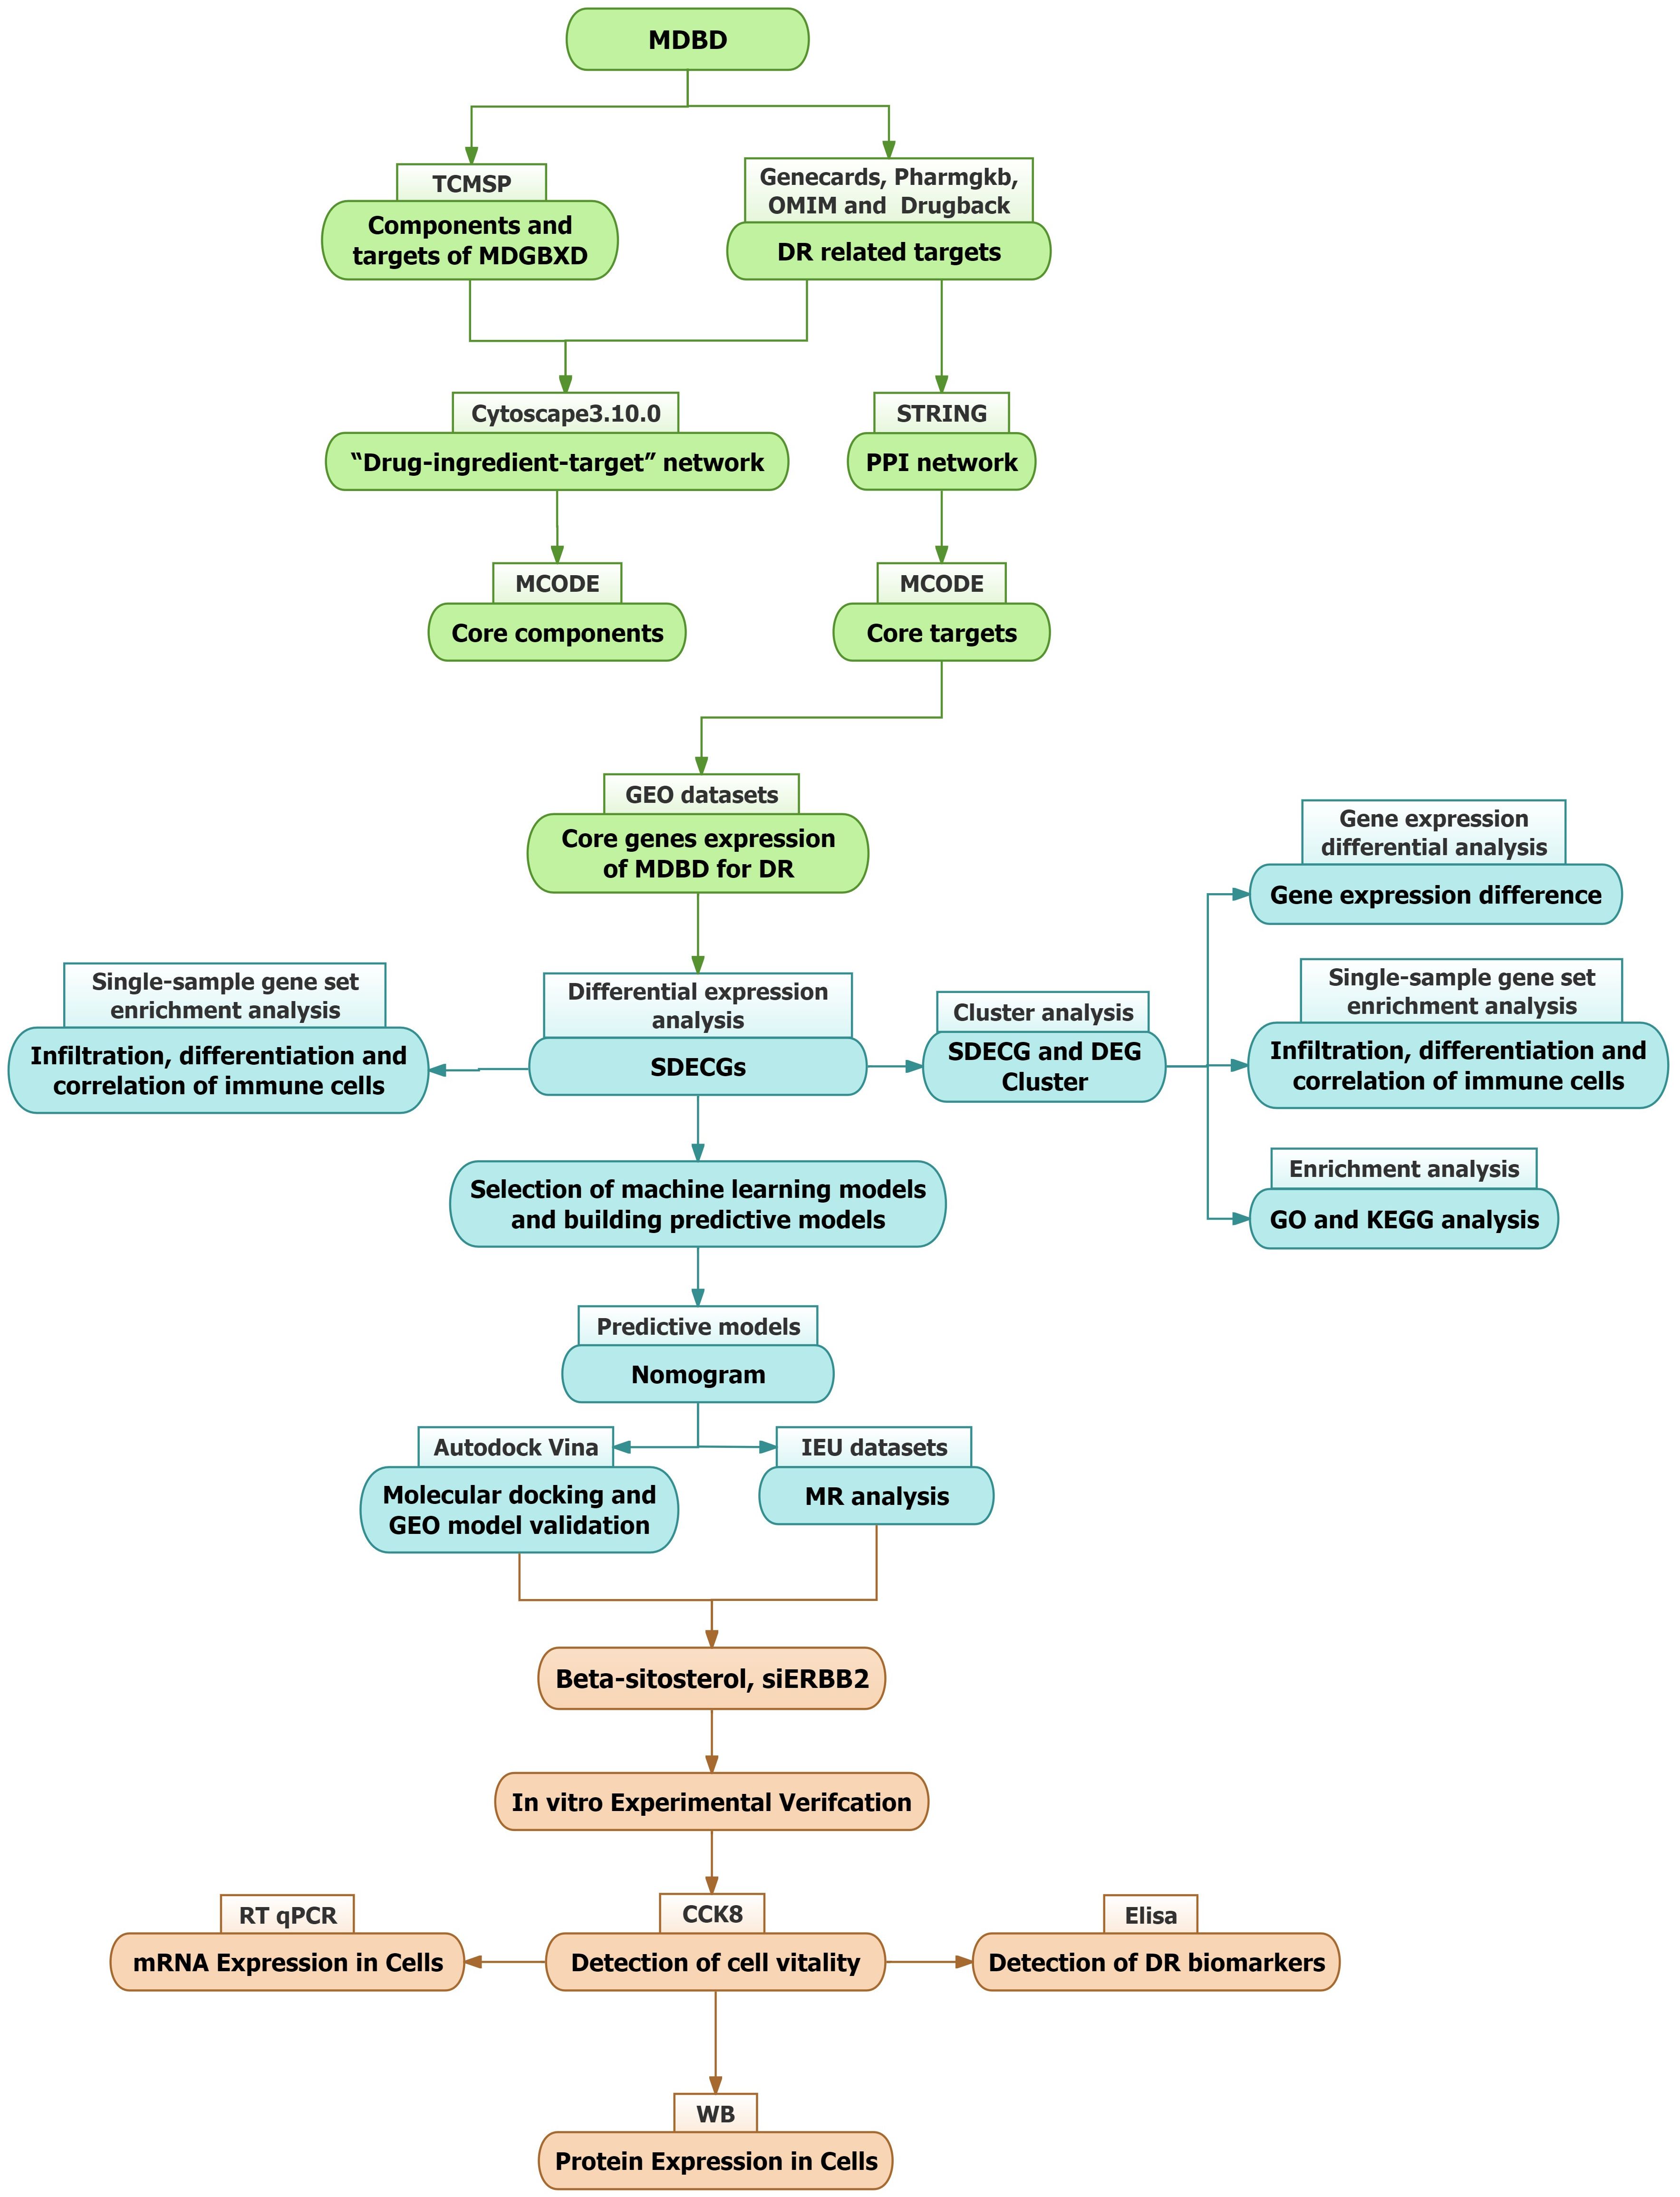
Figure 1. Study flowchart.
2 Method
2.1 Collection of the components and targets of MDBD
Active constituents and targets of Astragalus membranaceus (Fisch.), Angelica sinensis (Oliv.) Diels, and Panax notoginseng (Burk.) F.H. Chen were identified via the Traditional Chinese Medicine Systems Pharmacology (TCMSP) platform (https://tcmsp-e.com/tcmsp.php). Criteria for filtering included oral bioavailability (OB) of at least 30% and drug-likeness (DL) of at least 0.18. Target validation was subsequently performed utilizing the UniProt database.
2.2 Identification of targets associated with DR
Target genes associated with diabetic retinopathy were retrieved by searching Genecards (https://www.genecards.org/), OMIM (https://omim.org/), PharmGKB (https://www.pharmgkb.org/), and Drugbank (https://go.drugbank.com/). The collected target genes were consolidated, and duplicates were eliminated.
2.3 Development of the drug-component-target network
The Venn package was employed to identify intersections between active ingredients in MDBD and DR-related targets. Cytoscape V3.10.0 was then used to construct a network, incorporating diseases, drugs, components, and DR-related targets as nodes, with their interrelationships represented as edges. Topological analysis was conducted to identify core components within the network.
2.4 Construction of protein-protein interaction network
The intersecting targets’ PPI network was retrieved from the String database (https://string-db.org), specifying Homo sapiens as the species and setting the minimum interaction score at 0.40. Using Cytoscape V3.10.0, a network was constructed with nodes representing diseases, drugs, components, and DR-related targets, while edges depicted their relationships. To pinpoint key components and core PPI targets, the MCODE plugin was applied for clustering and topological analysis.
2.5 Acquisition and processing of GEO samples
The keyword ‘Diabetic retinopathy’ guided sample searches in the GEO database (https://www.ncbi.nlm.nih.gov/geo/), with constraints on data type (expression profiles) and species (Homo sapiens). Gene expression and clinical data were extracted to evaluate core gene expression levels related to MDBD treatment for diabetic retinopathy across normal and DR groups.
2.6 Differential expression and correlation analysis of core genes
Core gene expression levels were extracted from control and DR groups, followed by differential expression analysis using R packages such as ‘limma’, ‘pheatmap’, and ‘ggpubr’ in R V4.3.3. Results were visualized via box plots and heatmaps, identifying genes with P < 0.05 as SDECGs. Perl scripts determined the chromosomal positions of these genes, which were then displayed in circular plots using the R package ‘Rcircos’. The ‘cor’ function calculated and visualized correlation coefficients for each SDECG.
2.7 Immune cell infiltration and correlation in DR samples
The CIBERSORT command in R was employed to conduct 1000 simulations, determining the relative abundance of immune cells. A bar graph was used to illustrate immune cell content per sample. Single-sample gene set enrichment analysis (ssGSEA) was performed using R packages ‘GSVA’ and ‘GSABase’ to compare immune cell content differences between normal and DR groups, with results shown in box plots. Correlation testing was conducted between SDECGs and ssGSEA scores, and coefficients were visualized. CIBERSORT results were finalized.
2.8 Development of predictive models for DR
Four predictive models, Random Forest (RF), Support Vector Machine (SVM), Generalized Linear Model (GLM), and Extreme Gradient Boosting (XGB), were developed based on SDECG expression data. Feature genes were selected using residual cumulative distribution plots, residual boxplots, and Receiver Operating Characteristic (ROC) curves. The optimal model was constructed incorporating feature genes and their expression levels across normal and DR groups. Decision and calibration curves were formulated to evaluate model accuracy.
2.9 MR analysis between feature genes and DR
A two-sample Mendelian Randomization (MR) analysis was conducted to explore the causal link between feature genes and DR risk, with SNPs designated as instrumental variables (IVs). Feature gene SNPs were sourced from the Integrative Epidemiology Unit (IEU) database (https://gwas.mrcieu.ac.uk/) as exposure variables, while DR-related SNPs were outcome variables. The “TwoSampleMR” package facilitated MR analysis, employing the inverse variance weighted (IVW) method to assess the correlation between feature gene expression levels and DR risk. Heterogeneity was examined using Cochran’s Q statistic, with P < 0.05 indicating heterogeneity in IVW results. MR-Egger regression and MR-PRESSO analysis were used to evaluate potential horizontal pleiotropy, with P < 0.05 suggesting its presence.
2.10 Molecular docking of core compounds with feature genes
The 3D structures of the core components and feature genes of MDBD were retrieved from the PubChem (https://pubchem.ncbi.nlm.nih.gov) and Protein Data Bank (PDB) (http://www.rcsb.org/) databases. Molecular docking was performed using Autodock Vina to preliminarily verify the interaction between the core network pharmacological components and feature genes, and the top four docking combinations were selected and visualized with Pymol. Differential expression analysis of GEO datasets was performed to identify key genes between the normal and DR groups, providing additional validation for the molecular mechanisms.
2.11 Cluster analysis of SDECGs
The R package ‘ConsensusClusterPlus’ was utilized to categorize DR samples based on SDECG expression, employing the k-means clustering technique with Euclidean distance, allowing for up to nine clusters. Comparative analysis of clustering outcomes was performed using heatmaps and boxplots to evaluate expression levels. Principal Component Analysis (PCA) was conducted to discern inter-cluster differences. Subsequent ssGSEA analysis on SDECG clusters generated bar plots to depict immune cell content variations across clusters. Gene Ontology (GO) and Kyoto Encyclopedia of Genes and Genomes (KEGG) enrichment analyses were executed using GMT files from the GSEA platform (http://www.gsea-msigdb.org/). Gene Set Variation Analysis (GSVA) was conducted in R V4.3.3 to assess enriched gene expression across clusters. Differential gene expression analysis, adhering to|logFC|>1 and adj.P-Value<0.05, was followed by Venn diagram visualization to identify differentially expressed genes (DEGs) among clusters.
2.12 Enrichment analysis of DEGs among SDECG clusters
The DEGs among SDECG clusters underwent GO enrichment analysis covering biological processes (BP), molecular functions (MF), and cellular components (CC), alongside KEGG pathway enrichment. These analyses were executed using R packages such as “clusterProfiler” and “enrichplot” in R V4.3.3, with a screening threshold of P-value <0.05. Results were depicted through circular plots and bar graphs.
2.13 Cluster analysis of DEGs
An additional cluster analysis, based on DEG expression, was performed using the methodology described in Section 2.11, selecting the DEG cluster with the highest precision. The DEG clustering results were used to compare DEG expression levels across clusters, SDECG expression variations, and immune cell content differences among clusters. These findings were visualized using heatmaps and box plots.
2.14 Differential analysis of SDECGs and construction of alluvial diagrams
Scores for SDECGs were computed for each sample based on expression levels, utilizing PCA by incorporating PC1 and PC2. Differential analysis of SDECGs and DEGs clustering scores was executed using R packages such as “limma” and “ggpubr” in R V4.3.3. Box plots were generated to depict SDECGs scores across clustered samples. Additionally, the “ggalluvial” package facilitated the creation of alluvial diagrams to illustrate relationships and processes among SDECGs clusters, DEGs clusters, and samples with varying SDECGs scores.
2.15 Preparation for beta-sitosterol
Beta-sitosterol (HY-N0171A, MedChemExpress, USA) was dissolved in DMSO (D8371, Solarbio, USA). The solution was subsequently diluted in complete culture medium for mouse retinal Müller cells (CM-M117, Procell, China) to prepare various concentrations as required for the experiments. Fresh solutions were prepared immediately prior to use.
2.16 Cell culture and DR cell model induction
The mouse retinal Müller cells (MMCs) (CP-M117, Procell, China) were purchased from Pricella Biotechnology Co.,Ltd. The cells were cultured in in complete culture medium for mouse retinal Müller cells (CM-M117, Procell, China), and maintained at 37.0 °C with a CO2 concentration of 5% in a cell culture incubator. When the confluence of MMCs reached over 80%, they were passaged using trypsin (2.5% EDTA) (SH30042.01, HyClone, USA).
We induced DR cell model according to our previous study (35), utilizing a hypoxia-induced injury approach to simulate the conditions encountered in DR. MMCs were cultured under hypoxic conditions by placing them in a hypoxia chamber with a controlled oxygen concentration of 1% for a duration of 48 hours. Beta-sitosterol were used to incubated MMCs for 24h. The cells were harvested for subsequent analysis.
2.17 siERBB2 transfection
The RiboFECT™ CP transfection kit (C10511-05, RiboPharm, China) facilitated cell transfection in a 6-well plate. A solution of siERBB2 was prepared by mixing 3μl of 30μM stock with 120μl of 1X riboFECT™ CP Buffer, followed by the addition of 12μl of riboFECT™ CP reagent to form the transfection complex. This complex was combined with an antibody-free complete culture medium and gently agitated. Subsequent treatments led to incubation of the plates at 37 °C in a CO2 incubator for 24 hours prior to assays.
2.18 Evaluation of cell viability using CCK-8 assay
Cell viability assessment was conducted using the Cell Counting Kit-8 (CCK-8) (K009-1000T, Zeta-life, USA). MMCs were exposed to various concentrations of Beta-sitosterol in medium at 37 °C for 24 hours following hypoxia induction. Post medium removal, 10 μL of CCK-8 solution was introduced to each well and incubated in a CO2 incubator for 1 hour. Absorbance was recorded at 450 nm utilizing a microplate reader.
2.19 Real-time quantitative PCR
Total RNA extraction from MMCs was performed using TRIzol (DP424, Tiangen, China). cDNA synthesis followed with the RevertAid First Strand cDNA Synthesis Kit (K1622, Thermo, USA). RT-qPCR was employed to evaluate mRNA expression using 2x SYBR Green qPCR Master Mix (B21203, Selleck, USA) on a CFX96™ real-time system (Bio-Rad, USA). Relative expression levels of target genes were determined via the 2^-ΔΔCt method, based on obtained Ct values. Primers for analyzed genes included:
Erb-B2 Receptor Tyrosine Kinase 2 (ERBB2): forward, 5’-CTGTGTGACCACCTGCCCCTAC-3’, and reverse, 5’-TGCCCAGACCATAGCATACTCC-3’; Beta-actin (β-actin): forward, 5’-AGGTCATCACTATTGGCAACGAG-3’, and reverse, 5’-TTGGCATAGAGGTCTTTACGGAT-3’.
2.20 Western blotting
MMC lysis was achieved using the RIPA buffer (R0020, Solarbio, USA) to facilitate protein extraction for subsequent analyses. Quantification of proteins in the lysis supernatant was conducted employing the BCA Protein Assay Kit (P0011, Beyotime, China). Proteins were separated via SDS polyacrylamide gel electrophoresis (SDS-PAGE) utilizing the SDS-PAGE Gel Kit (P1200, Solarbio, USA), followed by transfer onto polyvinylidene fluoride (PVDF) membranes (IPVH00010, Millipore, Germany). After blocking and washing, the membranes underwent incubation with a primary antibody for 20 hours, succeeded by a 2-hour incubation with a secondary antibody. The proteins on PVDF membranes were processed with BeyoECL Plus (P0018S, Beyotime, China) to enhance chemiluminescence. Antibodies employed for Western blotting included ERBB2 (18299-1-AP, Proteintech), and glyceraldehyde-3-phosphate dehydrogenase (GAPDH) (UM4002, UtiBody, China).
2.21 Enzyme-linked immunosorbent assay
The quantification of interleukin-1β (IL-1β), vascular endothelial growth factor (VEGF), and angiopoietin-like 6 (ANGPTL6) in Müller cells (MMCs) was performed using specific enzyme-linked immunosorbent assay (ELISA) kits (MM-0040M1, MM-0128M1, MM-48029M1, Meimian, China). ELISA assays were conducted strictly following the manufacturer’s protocols to ensure accuracy and reproducibility. Absorbance measurements were taken at 450 nm using a calibrated microplate reader, and the concentrations were calculated by comparing the absorbance values to standard curves generated during the assay.
2.22 Statistical analysis
The statistical analysis was conducted using GraphPad Prism 10 software (GraphPad Software, USA). Quantitative data were expressed as mean ± standard error of the mean (SEM). For comparisons among multiple groups, one-way analysis of variance (ANOVA) was applied, followed by Fisher’s LSD test or Tukey’s post hoc test for pairwise comparisons. Differences between two groups were analyzed using the Student’s t-test. Statistical significance was determined by a Type I error probability (α) of less than 5%, with significance levels presented as P < 0.05, P < 0.01, or P < 0.001 to denote varying degrees of statistical difference.
3 Results
3.1 Constituents and targets of MDBD
Active constituents and targets of Angelica sinensis, Astragalus membranaceus, and Panax notoginseng were acquired via the TCMSP database. Following the elimination of duplicates and irrelevant entries, 30 distinct active components and 1207 associated targets were identified (Supplementary Table S1).
3.2 Targets associated with DR
Targets numbering 4848, 185, 64, and 4 were sourced from Genecards, Pharmgkb, OMIM, and Drugbank, respectively. After duplicate removal, a total of 4973 DR-related targets were obtained (Figure 2).
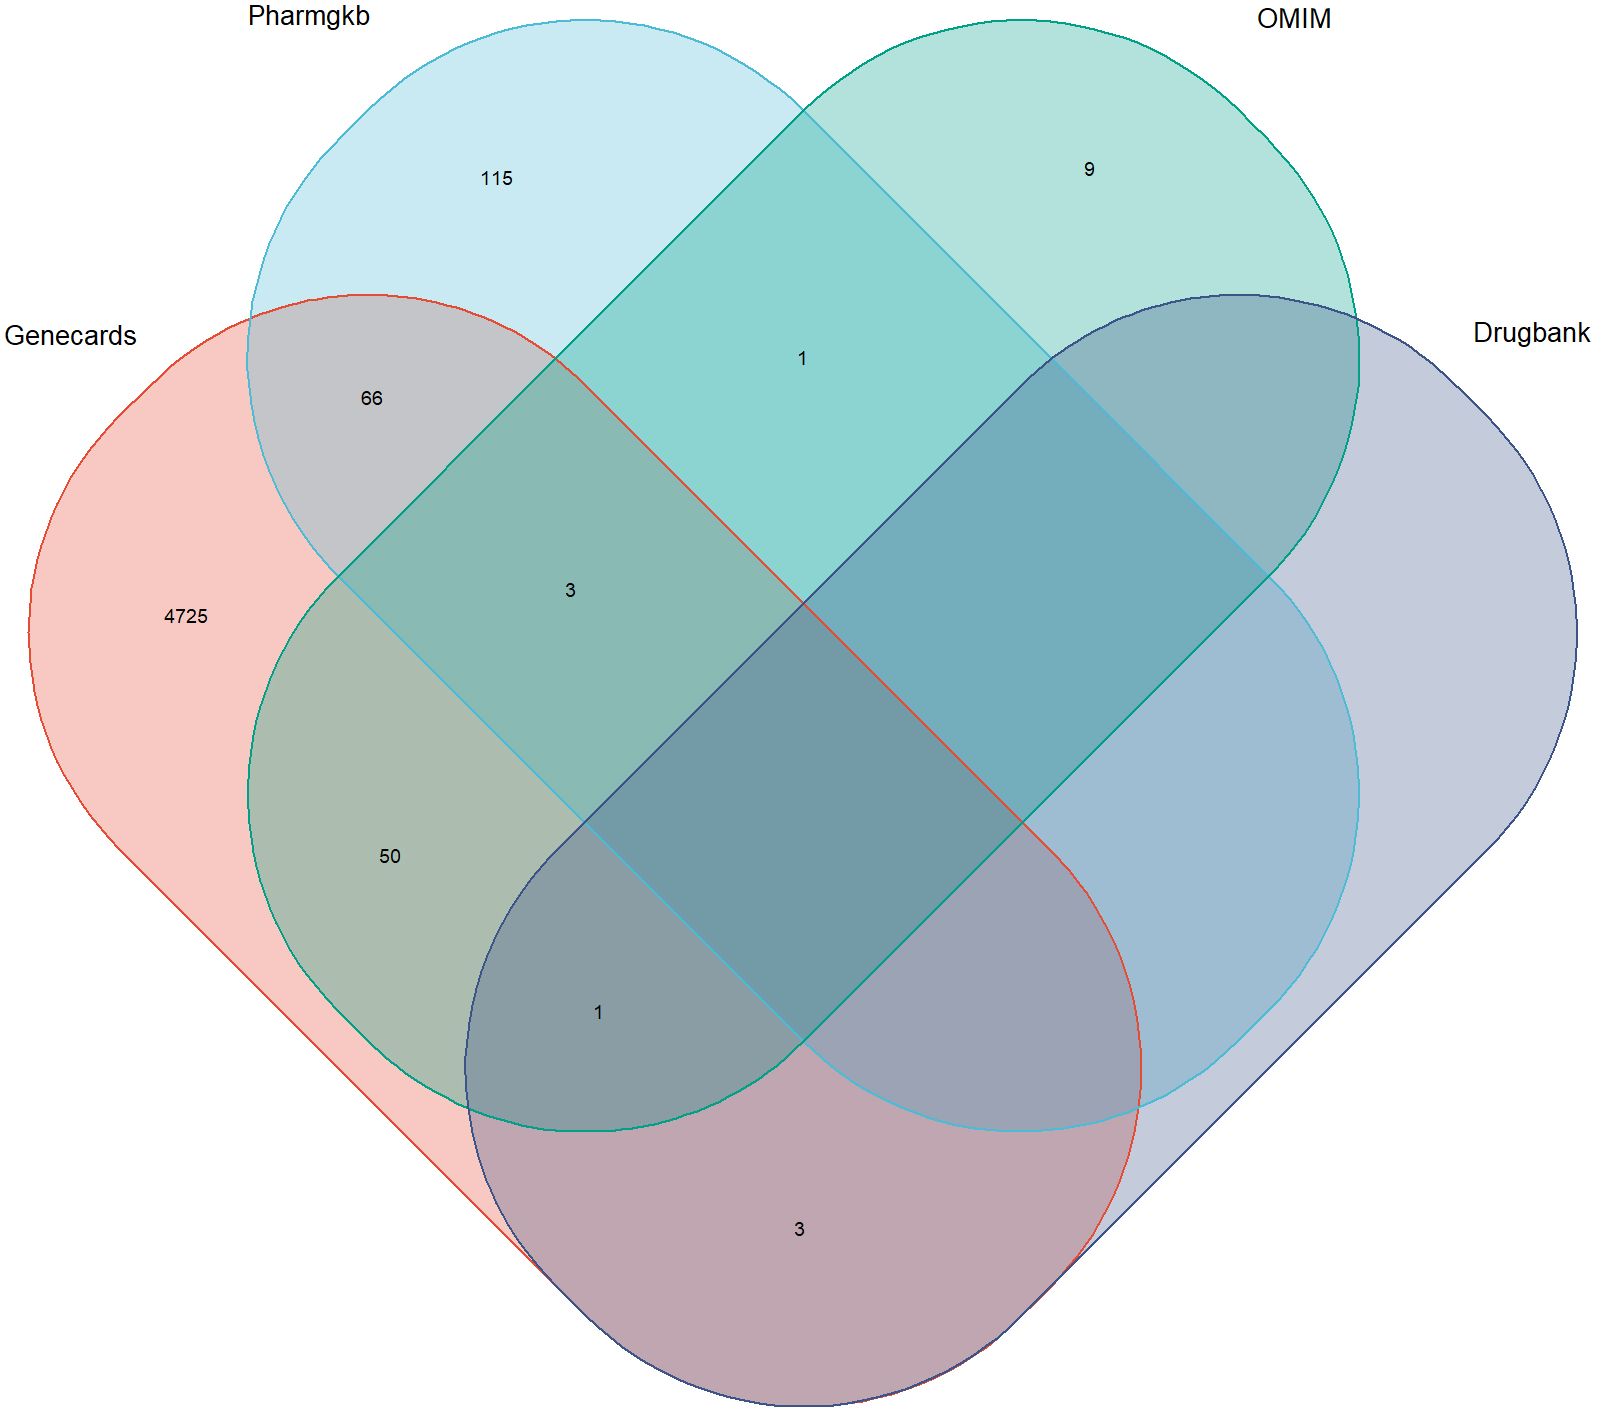
Figure 2. Targets associated with diabetic retinopathy in multiple databases. The overlapping regions represent duplicates.
3.3 Network of “drug-component-target”
The intersection between each active ingredient in MDBD and DR-related targets was determined using the venn package, resulting in 130 targets directly linked to drug and disease (Figure 3A). Topological analysis was conducted to pinpoint core components within the network (Figure 3B).
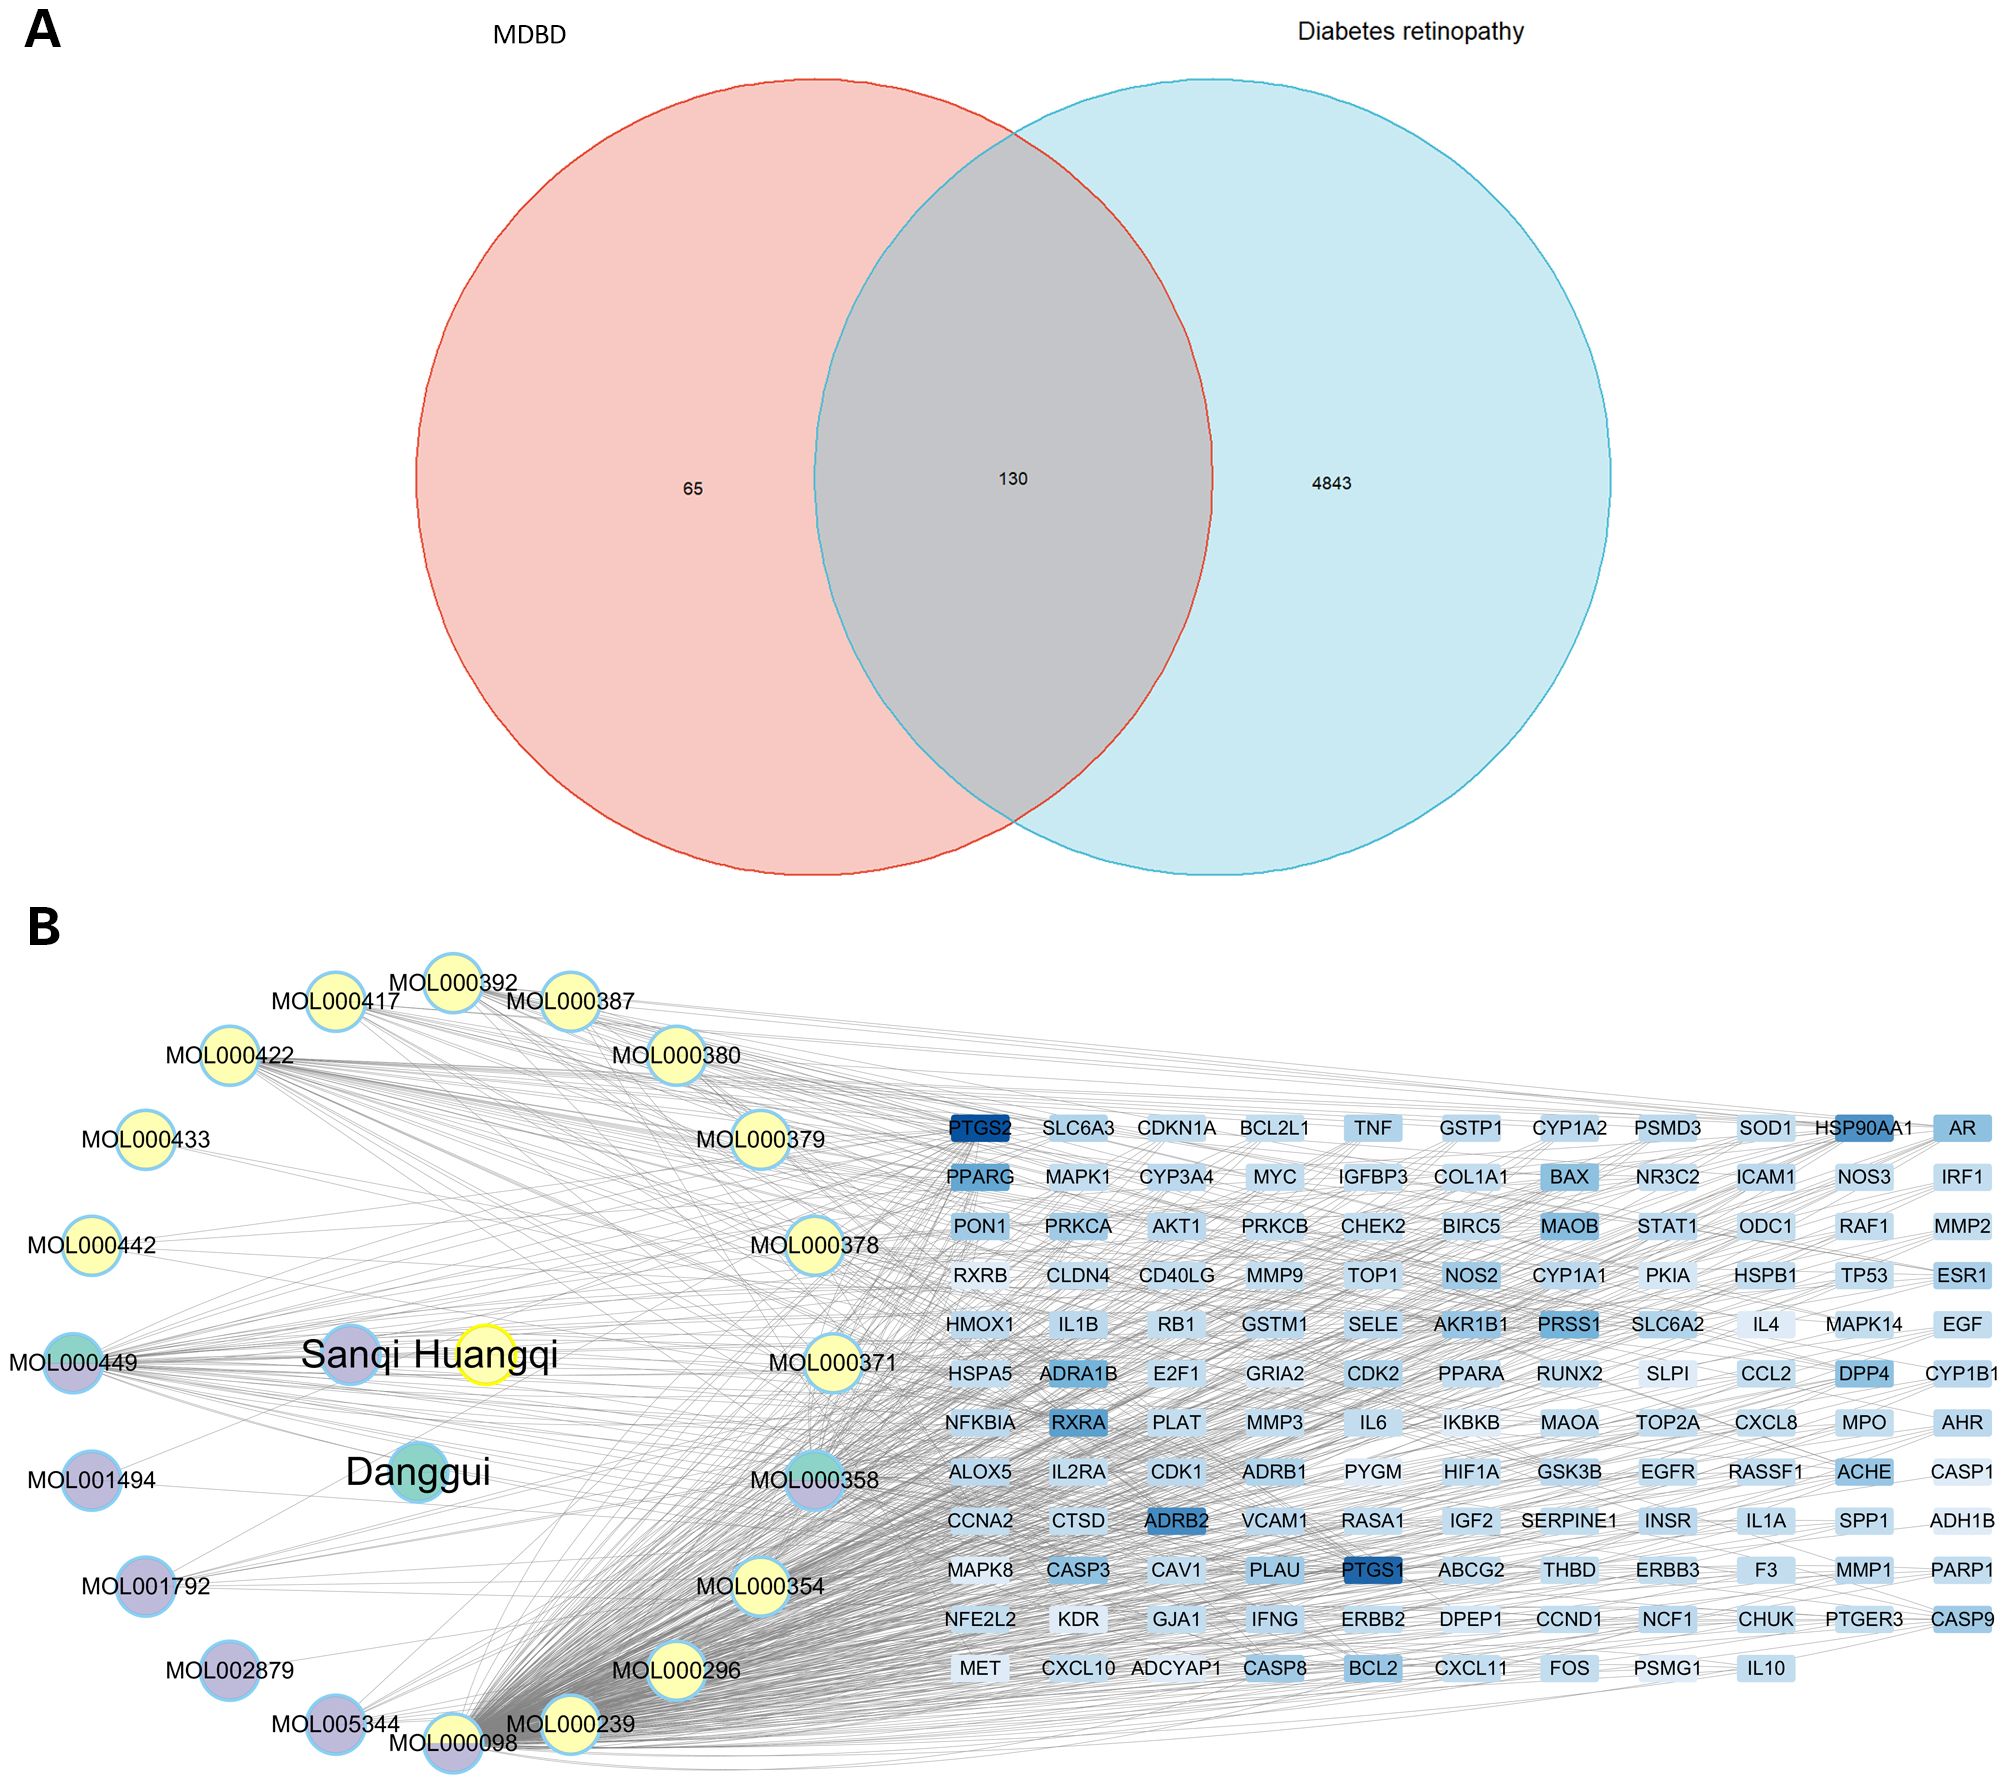
Figure 3. Drug-component-target network. (A) Venn diagram of intersection between compounds in MBDB and DR-related targets. (B) Interaction network of drug-component-target. This network comprises three traditional Chinese medicines, encompassing 20 compounds and 130 targets. MBDB, Modified Danggui Buxue Decoction.
3.4 PPI network
The PPI network of intersecting targets was extracted from the String database, with Homo sapiens specified as the species. The network comprised 80 nodes and 1318 edges, with an average node degree of 35.5. The MCODE plugin facilitated clustering of the PPI network to identify core PPI targets, yielding two clustered networks with a minimum interaction score of 0.40. Seventy-four core targets were identified, including MAPK8, CASP9, IL1A, IFN, EGFR, IL1B, CDKN1A, SOD1, ERBB2, NOS3, and CD40LG, which are deemed significant for MDBD treatment of DR (Supplementary Table S2; Figure 4).
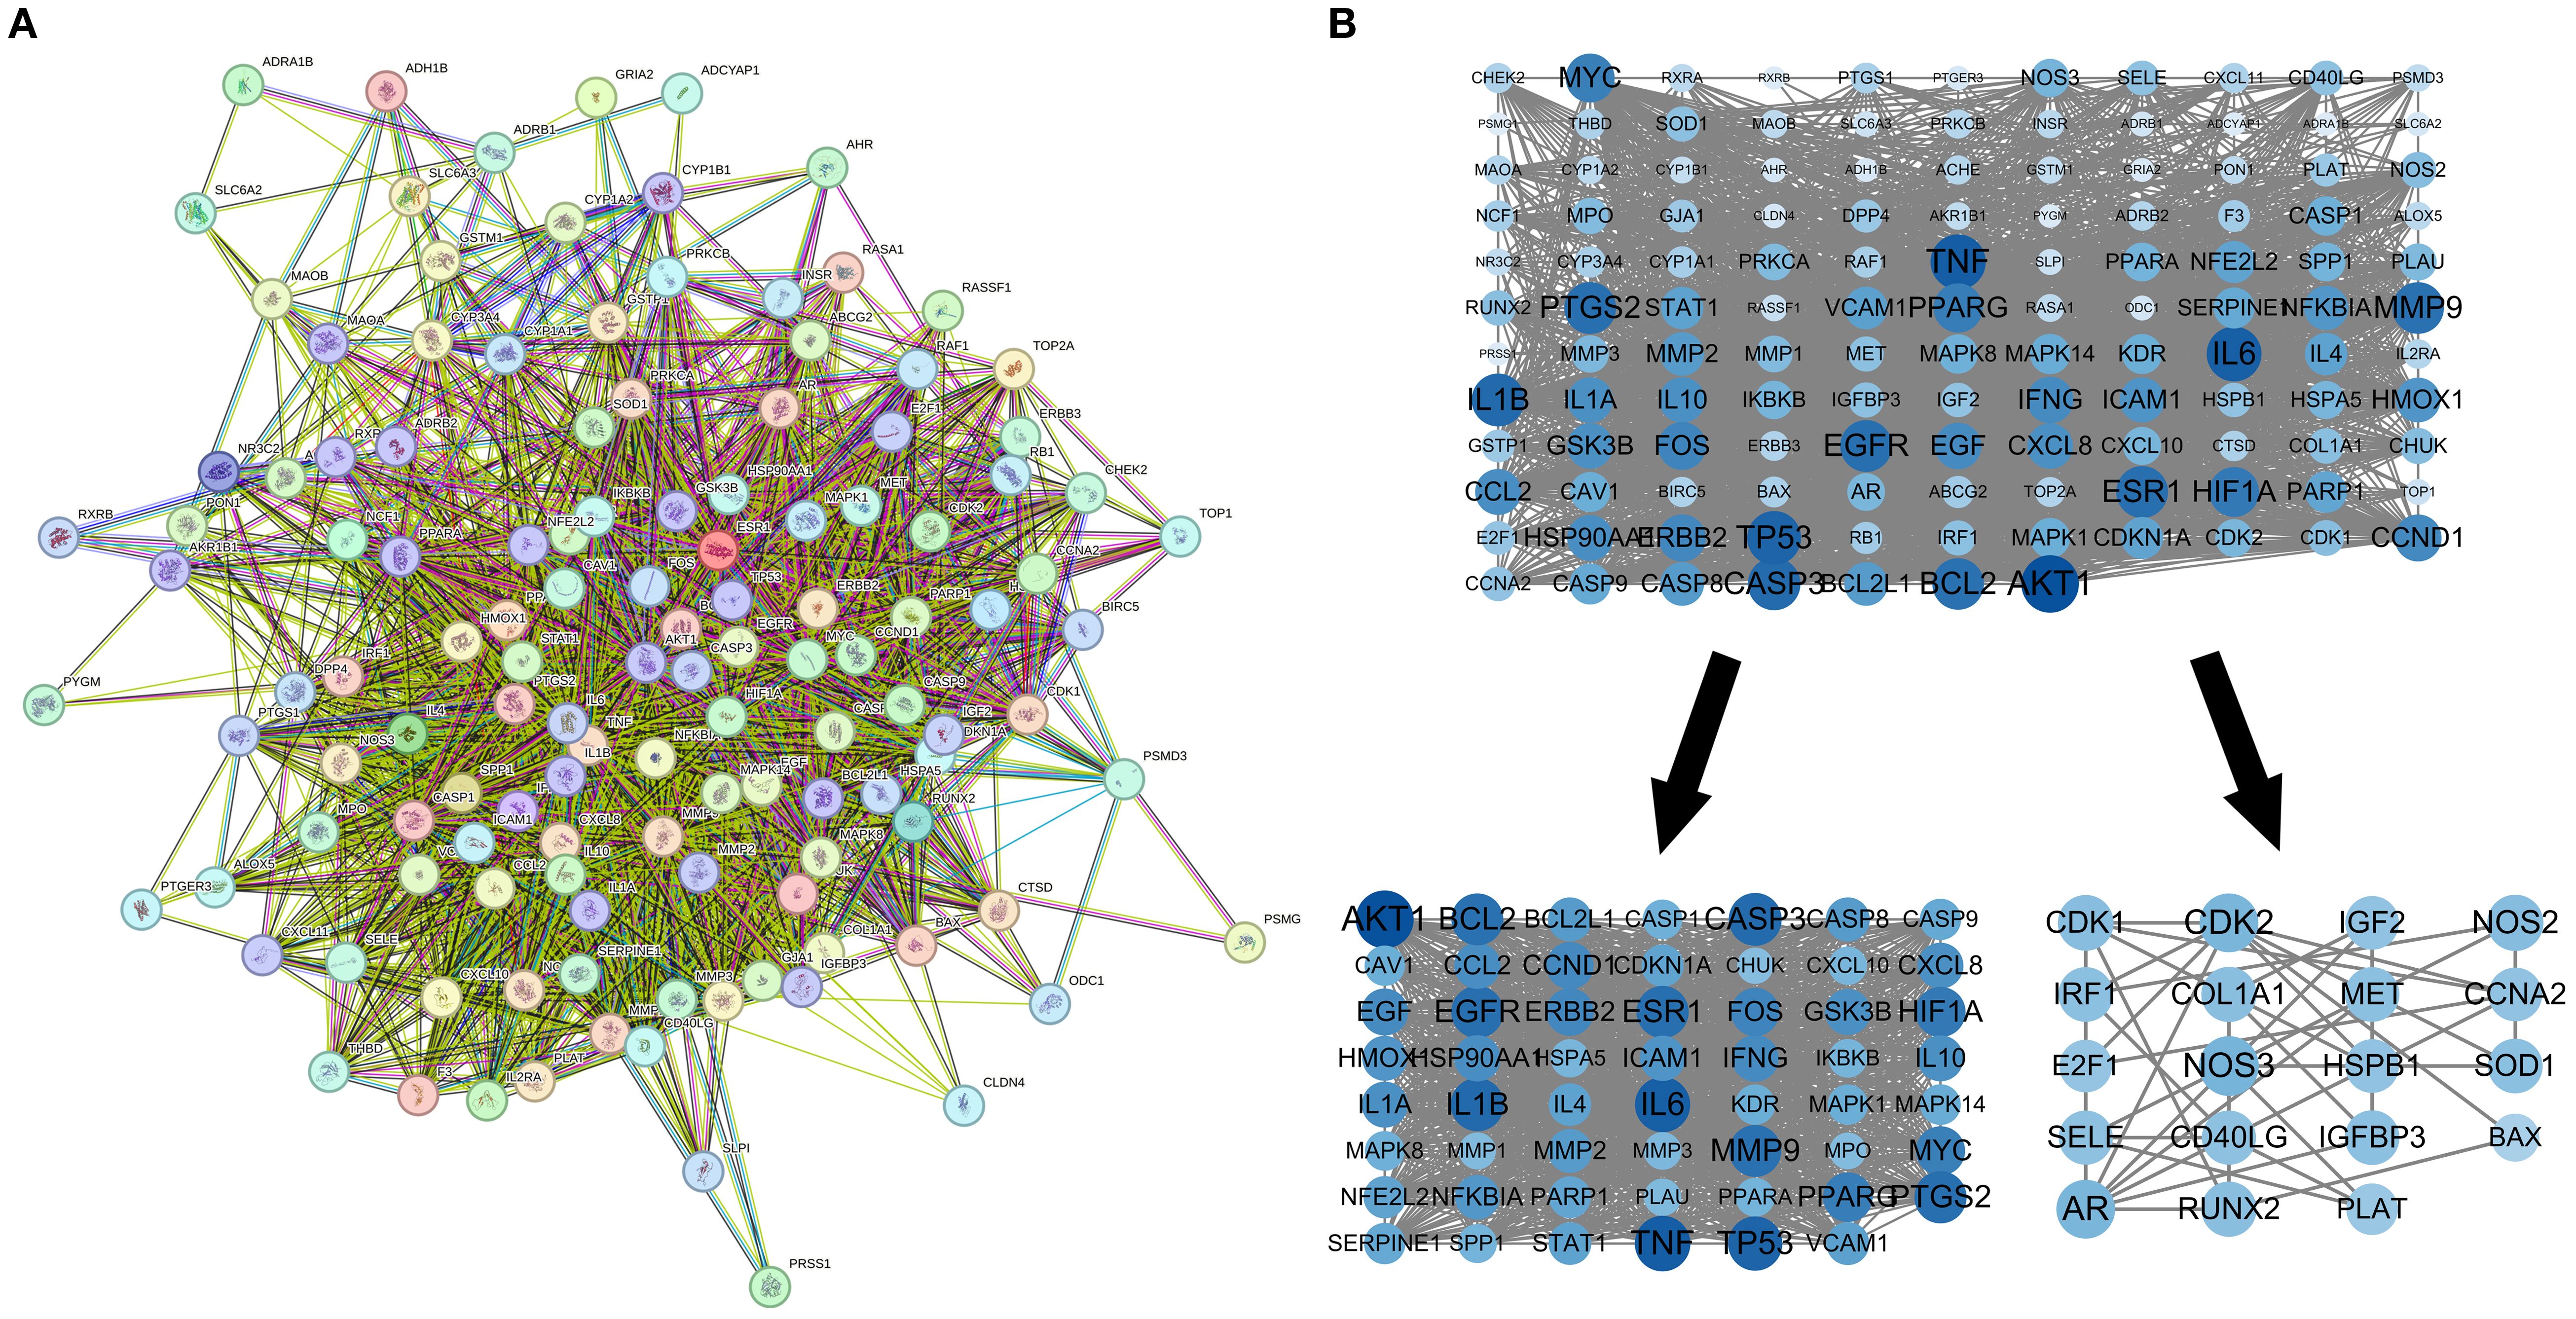
Figure 4. PPI network for modified danggui buxue decoction. (A) Protein-protein interaction network for diabetic retinopathy targets. (B) Sub-networks highlighting key protein clusters. The protein-protein interaction network, based on targets for diabetic retinopathy, is illustrated. Nodes symbolize distinct proteins, while edges indicate protein associations, with line thickness reflecting data support strength.
3.5 Sample acquisition in GEO datasets
The keyword “diabetic retinopathy” was utilized to extract samples from the GEO database, with restrictions on data type and biological species. Gene expression and clinical data were obtained to assess the expression levels of core genes in MDBD-treated DR within normal and DR cohorts. Two datasets were selected: GSE160306, GPL20301. Macular tissue analysis was performed across various clinical stages: DR for diabetic retinopathy; NPDR for non-proliferative diabetic retinopathy; PDR for proliferative diabetic retinopathy; DME for diabetic macular edema, where elevated scores denote more severe lesions. The study included 20 normal samples and 39 DR samples.
3.6 Variations in core gene expression, chromosomal localization, and expression correlation of SDECGs
Seventy-four core genes of MDBD were identified through network pharmacology analysis (Supplementary Table S2). Expression levels were extracted from both the control and DR groups, followed by differential expression analysis. Fourteen genes, including NR3C2, PSMG1, INSR, HIF1A, RXRB, IKBKB, CAV1, RXRA, TP53, CCND1, ERBB2, ADRB1, PLAT, and SERPINE1, were validated as SDECGs core genes in human samples. Except for HIF1A, PSMG1, ADRB1, and PLAT, which exhibited high expression in the control group, the remaining genes were highly expressed in the DR group (Figures 5A, B). Chromosomal positions of MDBD core genes were mapped in RCircos (Figures 5C, D). Correlation analysis among SDECGs in DR samples revealed strong correlations, encompassing both positive and negative relationships (Figures 5E, F).
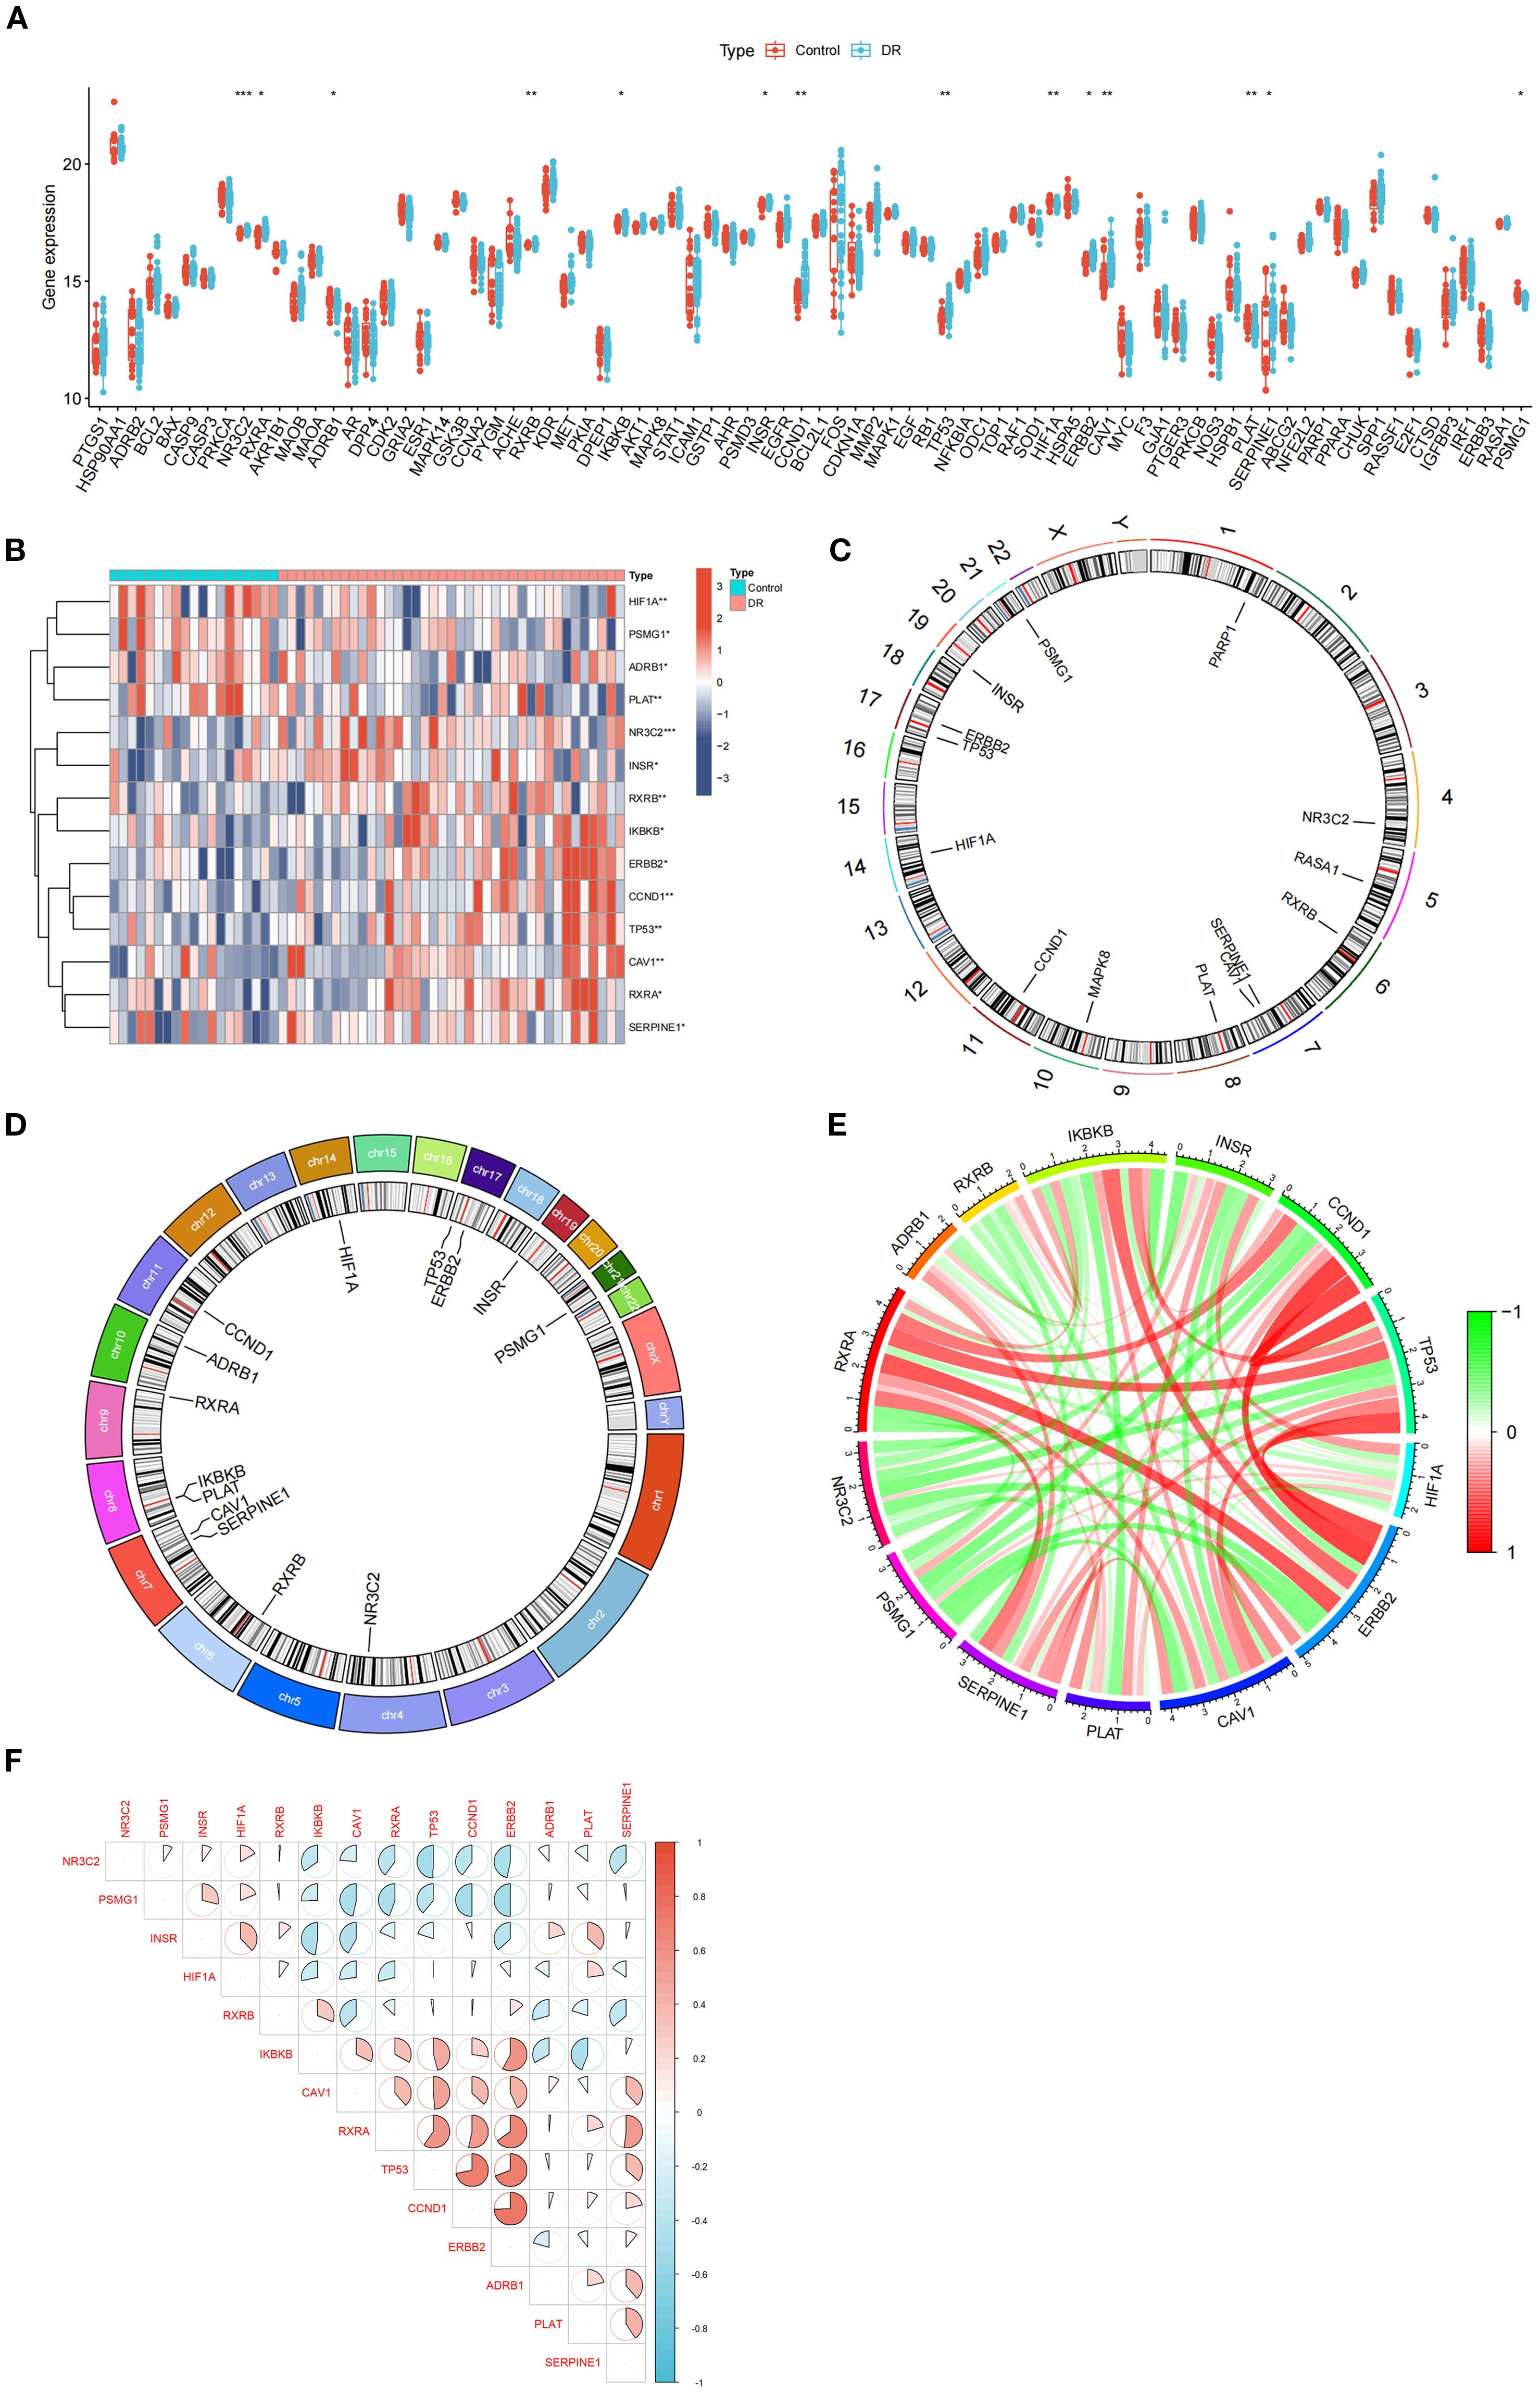
Figure 5. Gene Expression Analysis. (A) Box plot of core gene expression. The horizontal axis is core genes, and the vertical axis is gene expression level. Data presented as mean ± SEM. *P<0.05; **P<0.01; ***P<0.001. (B) Heat map of SDECGs expression levels. Red presents upregulated genes, and blue presents downregulated genes. Data presented as mean ± SEM. *P<0.05; **P<0.01; ***P<0.001. (C) Circular plot of chromosomal locations of SDECGs; (D) Circos plot of 14 SDECGs. (E) Circular plot of the correlation among SDECGs, with red indicating positive and green negative correlations. (F) Correlation matrix between SDECGs. Red presents positive correlation, and blue presents negative correlations.
3.7 Immune cell infiltration, differentiation, and correlation in control and DR samples
Single-sample gene set enrichment analysis (ssGSEA) was conducted to compare immune cell levels between control and DR groups (Figure 6A), identifying statistically significant immune cells such as macrophages M0 with elevated expression in the DR group and resting dendritic cells with high expression in the control group. Immune cell infiltration analysis determined the types and levels of immune cells in each sample, visualizing these levels (Figure 6B). The intersection of SDECGs with ssGSEA scores for immune cell correlation testing indicated that correlations between SDECGs and immune cells included both positive and negative relationships (Figures 6C, D). Among the immune cells significantly associated with SDECGs (P < 0.05), dendritic cells resting, eosinophils, macrophages M0, macrophages M1, neutrophils, activated NK cells, resting CD4 memory T cells, CD8 T cells, and regulatory T cells (Tregs) were predominantly positively correlated with the relevant SDECGs. Conversely, memory B cells, naive B cells, macrophages M2, resting mast cells, monocytes, plasma cells, and follicular helper T cells were mainly negatively correlated with the relevant SDECGs.
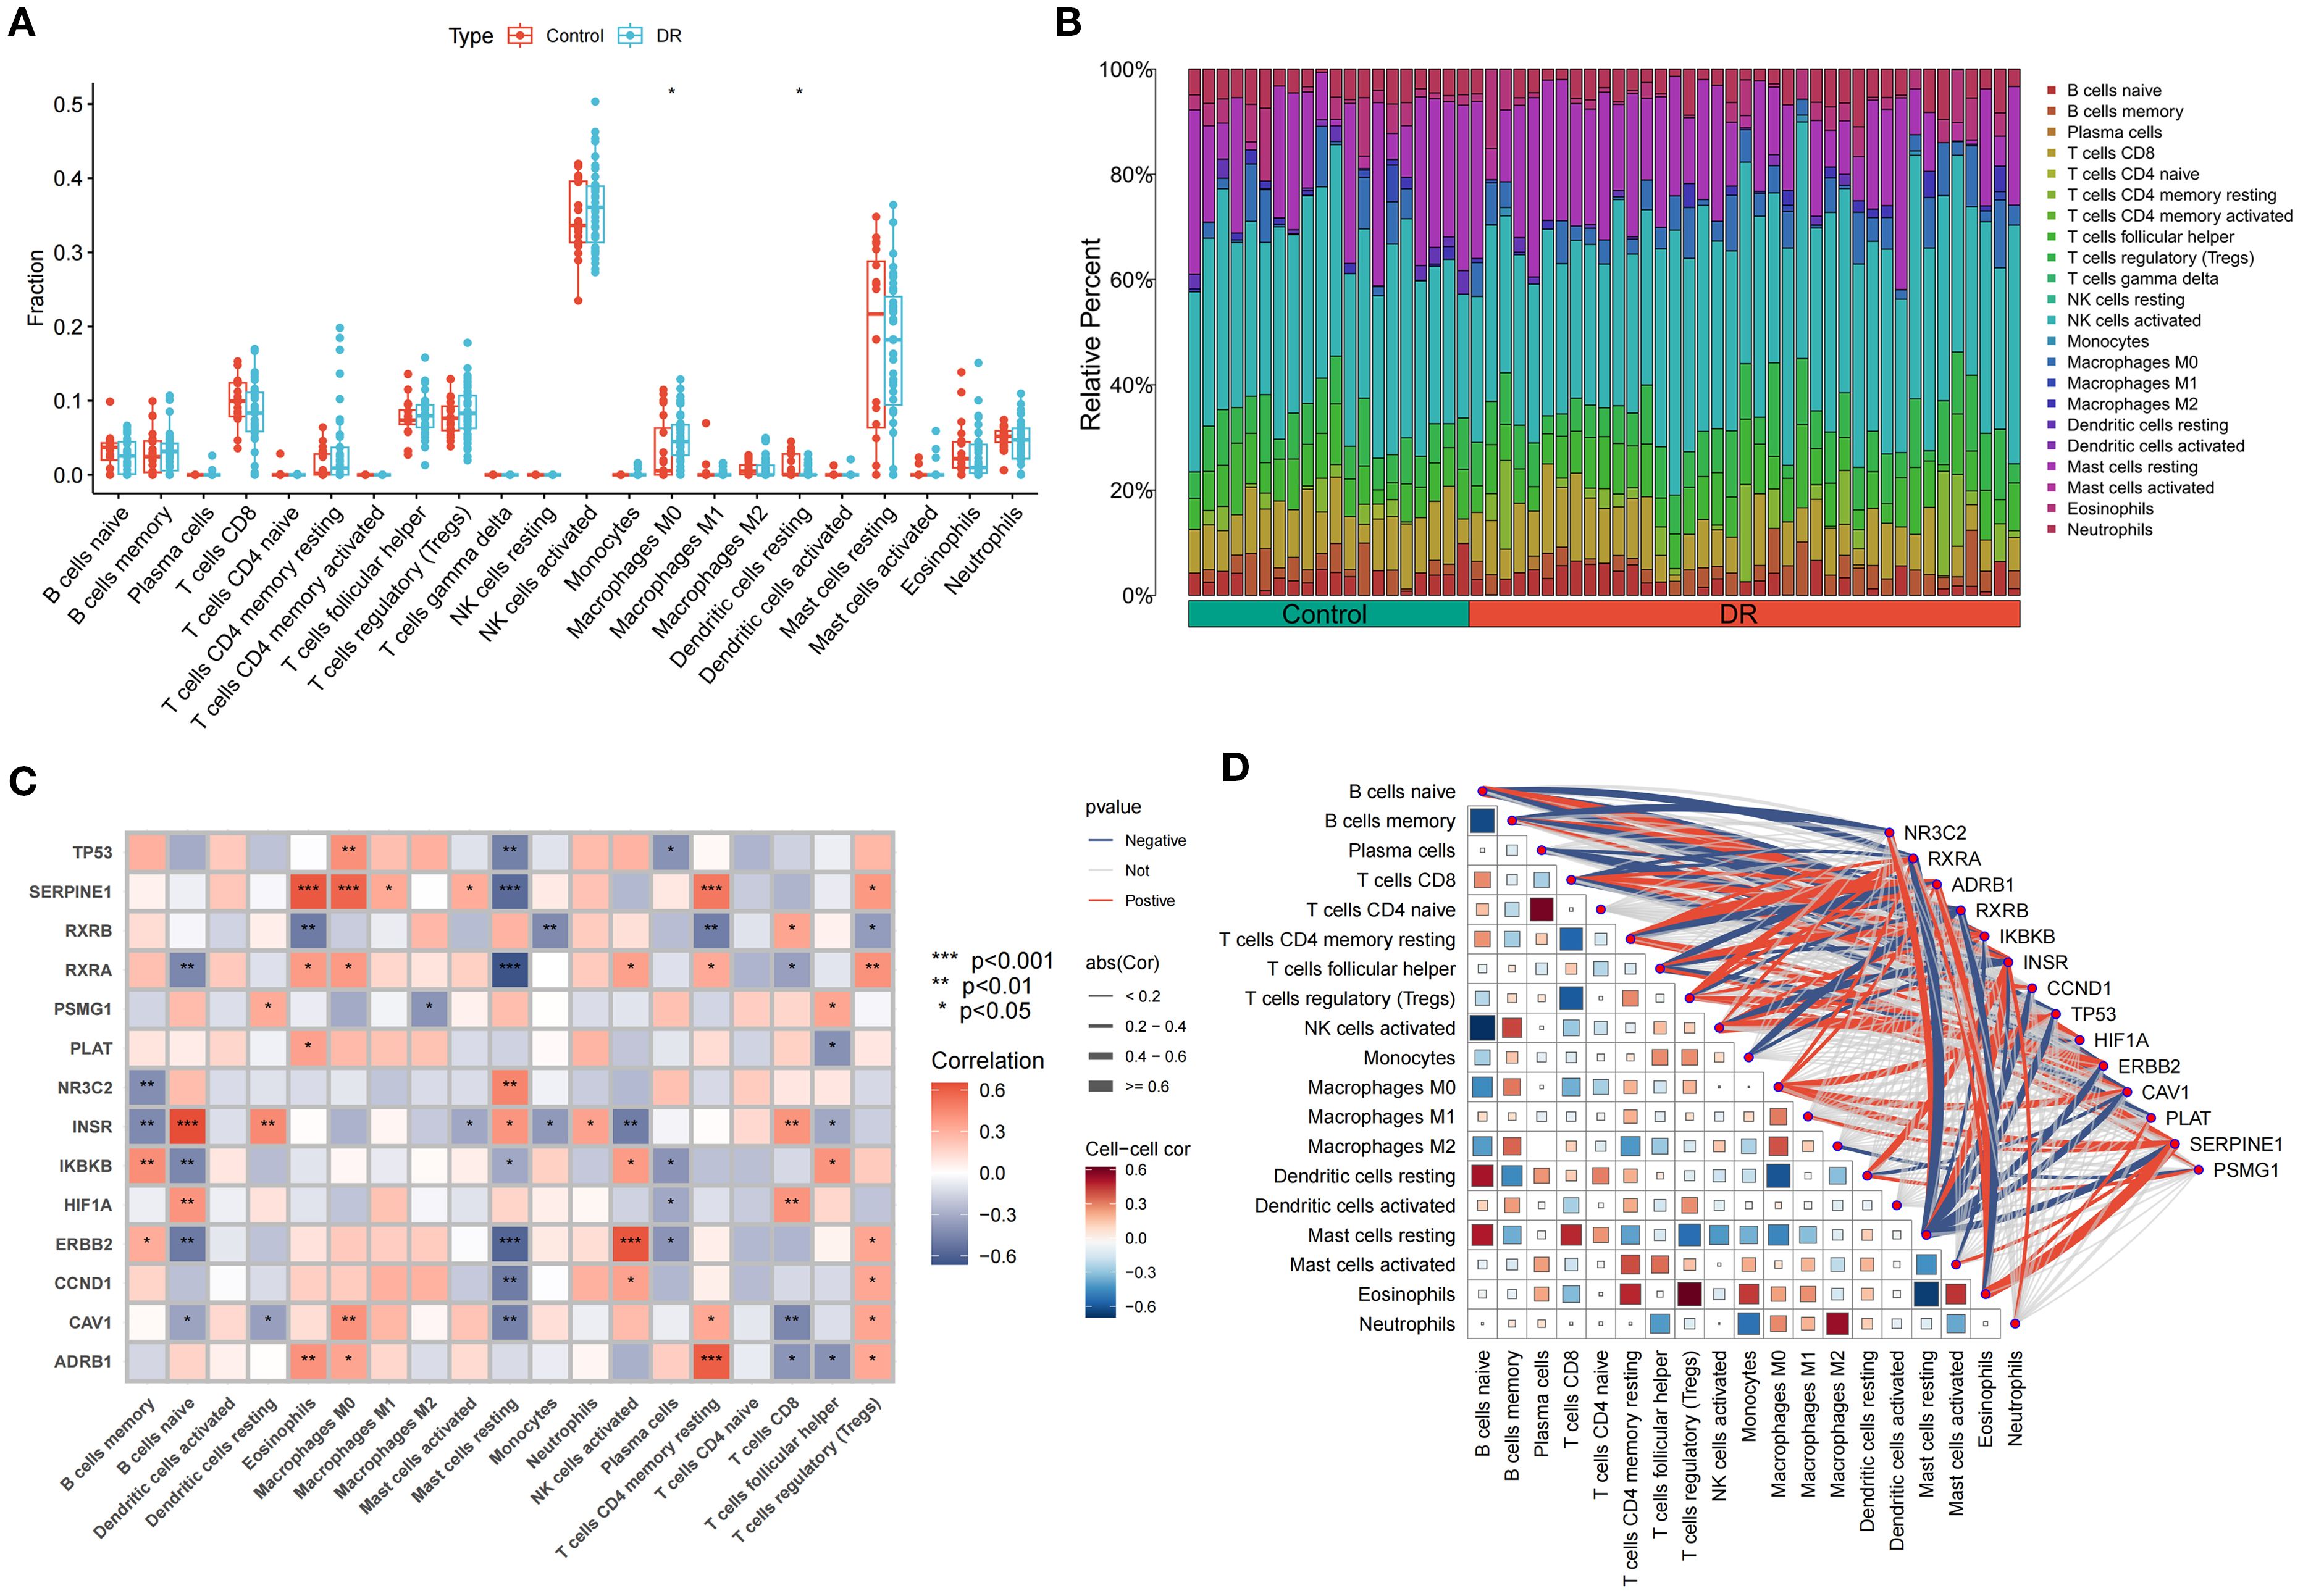
Figure 6. Immune Cell Infiltration Analysis. (A) Bar plot of differences in immune cell fraction between control and DR group. The horizontal axis is immune cells, and the vertical axis is immune cell fraction. The data are presented as the mean ± SEM. *P<0.05. (B) Distribution proportion of immune cells within samples. (C) Heatmap of correlations between immune cell infiltration and SDECG. The horizontal axis is SDECGs, and the vertical axis is immune cells. Red presents positive correlation, and blue presents negative correlations. The data are presented as the mean ± SEM. *P<0.05; **P<0.01; ***P<0.001. (D) Network and heatmap of correlations between immune cell infiltration and SDECG. Darker colors indicate stronger correlations between immune cells; thicker lines indicate stronger gene–immune cell correlations. Red presents positive correlation, and blue presents negative correlations.
3.8 Selection of machine learning models and construction of predictive models for DR treatment
Expression data of SDECGs served to construct four predictive models: RF, SVM, GLM, and XGB. Analysis of residual box plots, ROC curves, and reverse cumulative distribution plots demonstrated that the RF model achieved the highest accuracy, featuring the largest area under the ROC curve and minimal residuals and reverse cumulative values (Figures 7A–C). The RF model, selected for further development, facilitated the construction of a predictive model to derive feature importance scores for the genes. Results indicated that SERPINE1 had the highest score, with gene importance ranked as SERPINE1, TP53, ERBB2, CCND1, INSR, PLAT, NR3C2, CAV1, PSMG1, and RXRA (Figure 7D). The top five genes, CCND1, ERBB2, INSR, TP53, and SERPINE1, were utilized for nomogram construction (Figure 7E). Finally, decision and calibration curves assessed the predictive model’s accuracy, demonstrating high accuracy based on positive outcomes (Figures 7F, G).
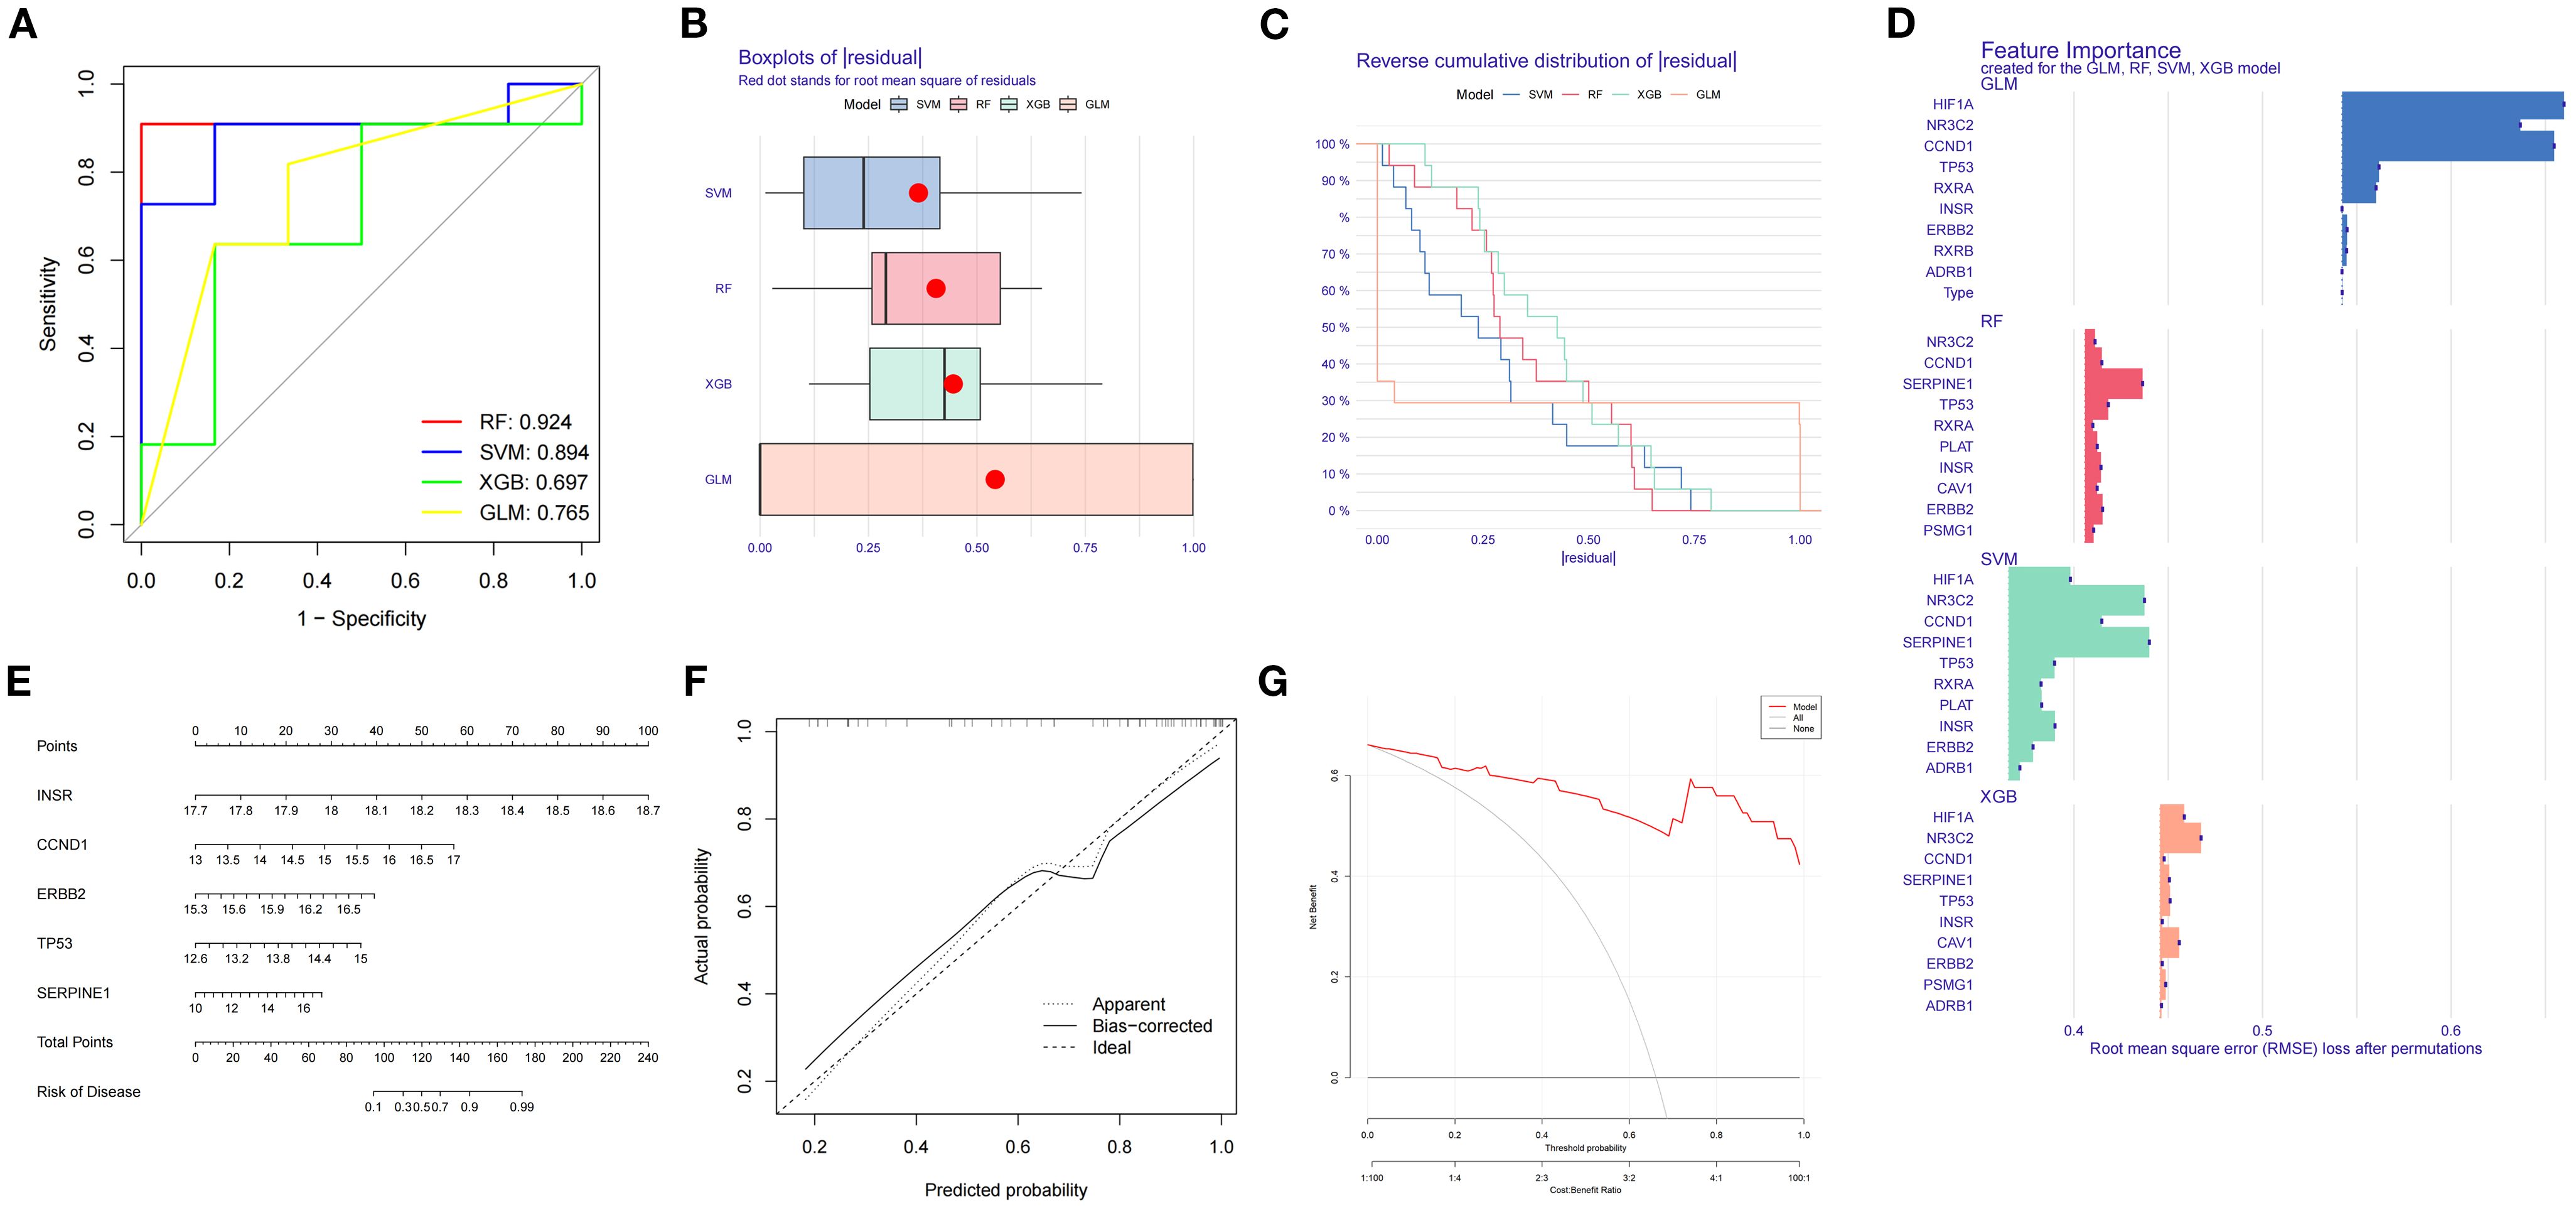
Figure 7. (A) ROC curves and AUC for RF, SVM, GLM, XGB. (B) Box plots of residuals distribution. The horizontal axis is residuals, and the vertical axis is models. Red dot denotes the root mean square of residuals. (C) Reverse cumulative residual distribution. The horizontal axis is residuals, and the vertical axis is reverse cumulative proportion (%). (D) Feature importance for RF, SVM, GLM, XGB. The horizontal axis is root mean square error loss after permutations, and the vertical axis is feature genes. The larger the value, the more important the feature gene. (E) Nomogram predicts disease risk using key features. (F) Calibration plot: predicted vs. actual probability. (G) Performance metrics include RMSE for model accuracy.
3.9 Mendelian randomization analysis of feature genes and DR
MR analysis was executed to investigate the causal relationship between specific feature genes and DR, with SNPs defined as IVs. SNPs from signature genes were utilized as exposure factors, while SNPs related to DR served as outcome factors. Information on the SNPs for the four highlighted genes CCND1, ERBB2, INSR, and SERPINE1 can be found in Supplementary Table S3. No SNPs were identified as weak IVs. Due to insufficient data, MR analysis could not be performed on TP53. IVW analysis indicated that ERBB2 is linked to an increased risk of DR (Odds Ratio [OR]=1.70, 95% CI: 1.016 to 2.856, P = 0.04), whereas the other three genes did not exhibit a significant causal relationship with DR (Figure 8A; Supplementary Table S4). The IVW results confirmed ERBB2 as a risk factor for DR, with consistent effect directions observed in the weighted median analysis (OR = 1.860, 95% CI: 1.247-2.774, P = 0.002), as demonstrated by both scatter and forest plots (Figures 8B, C).
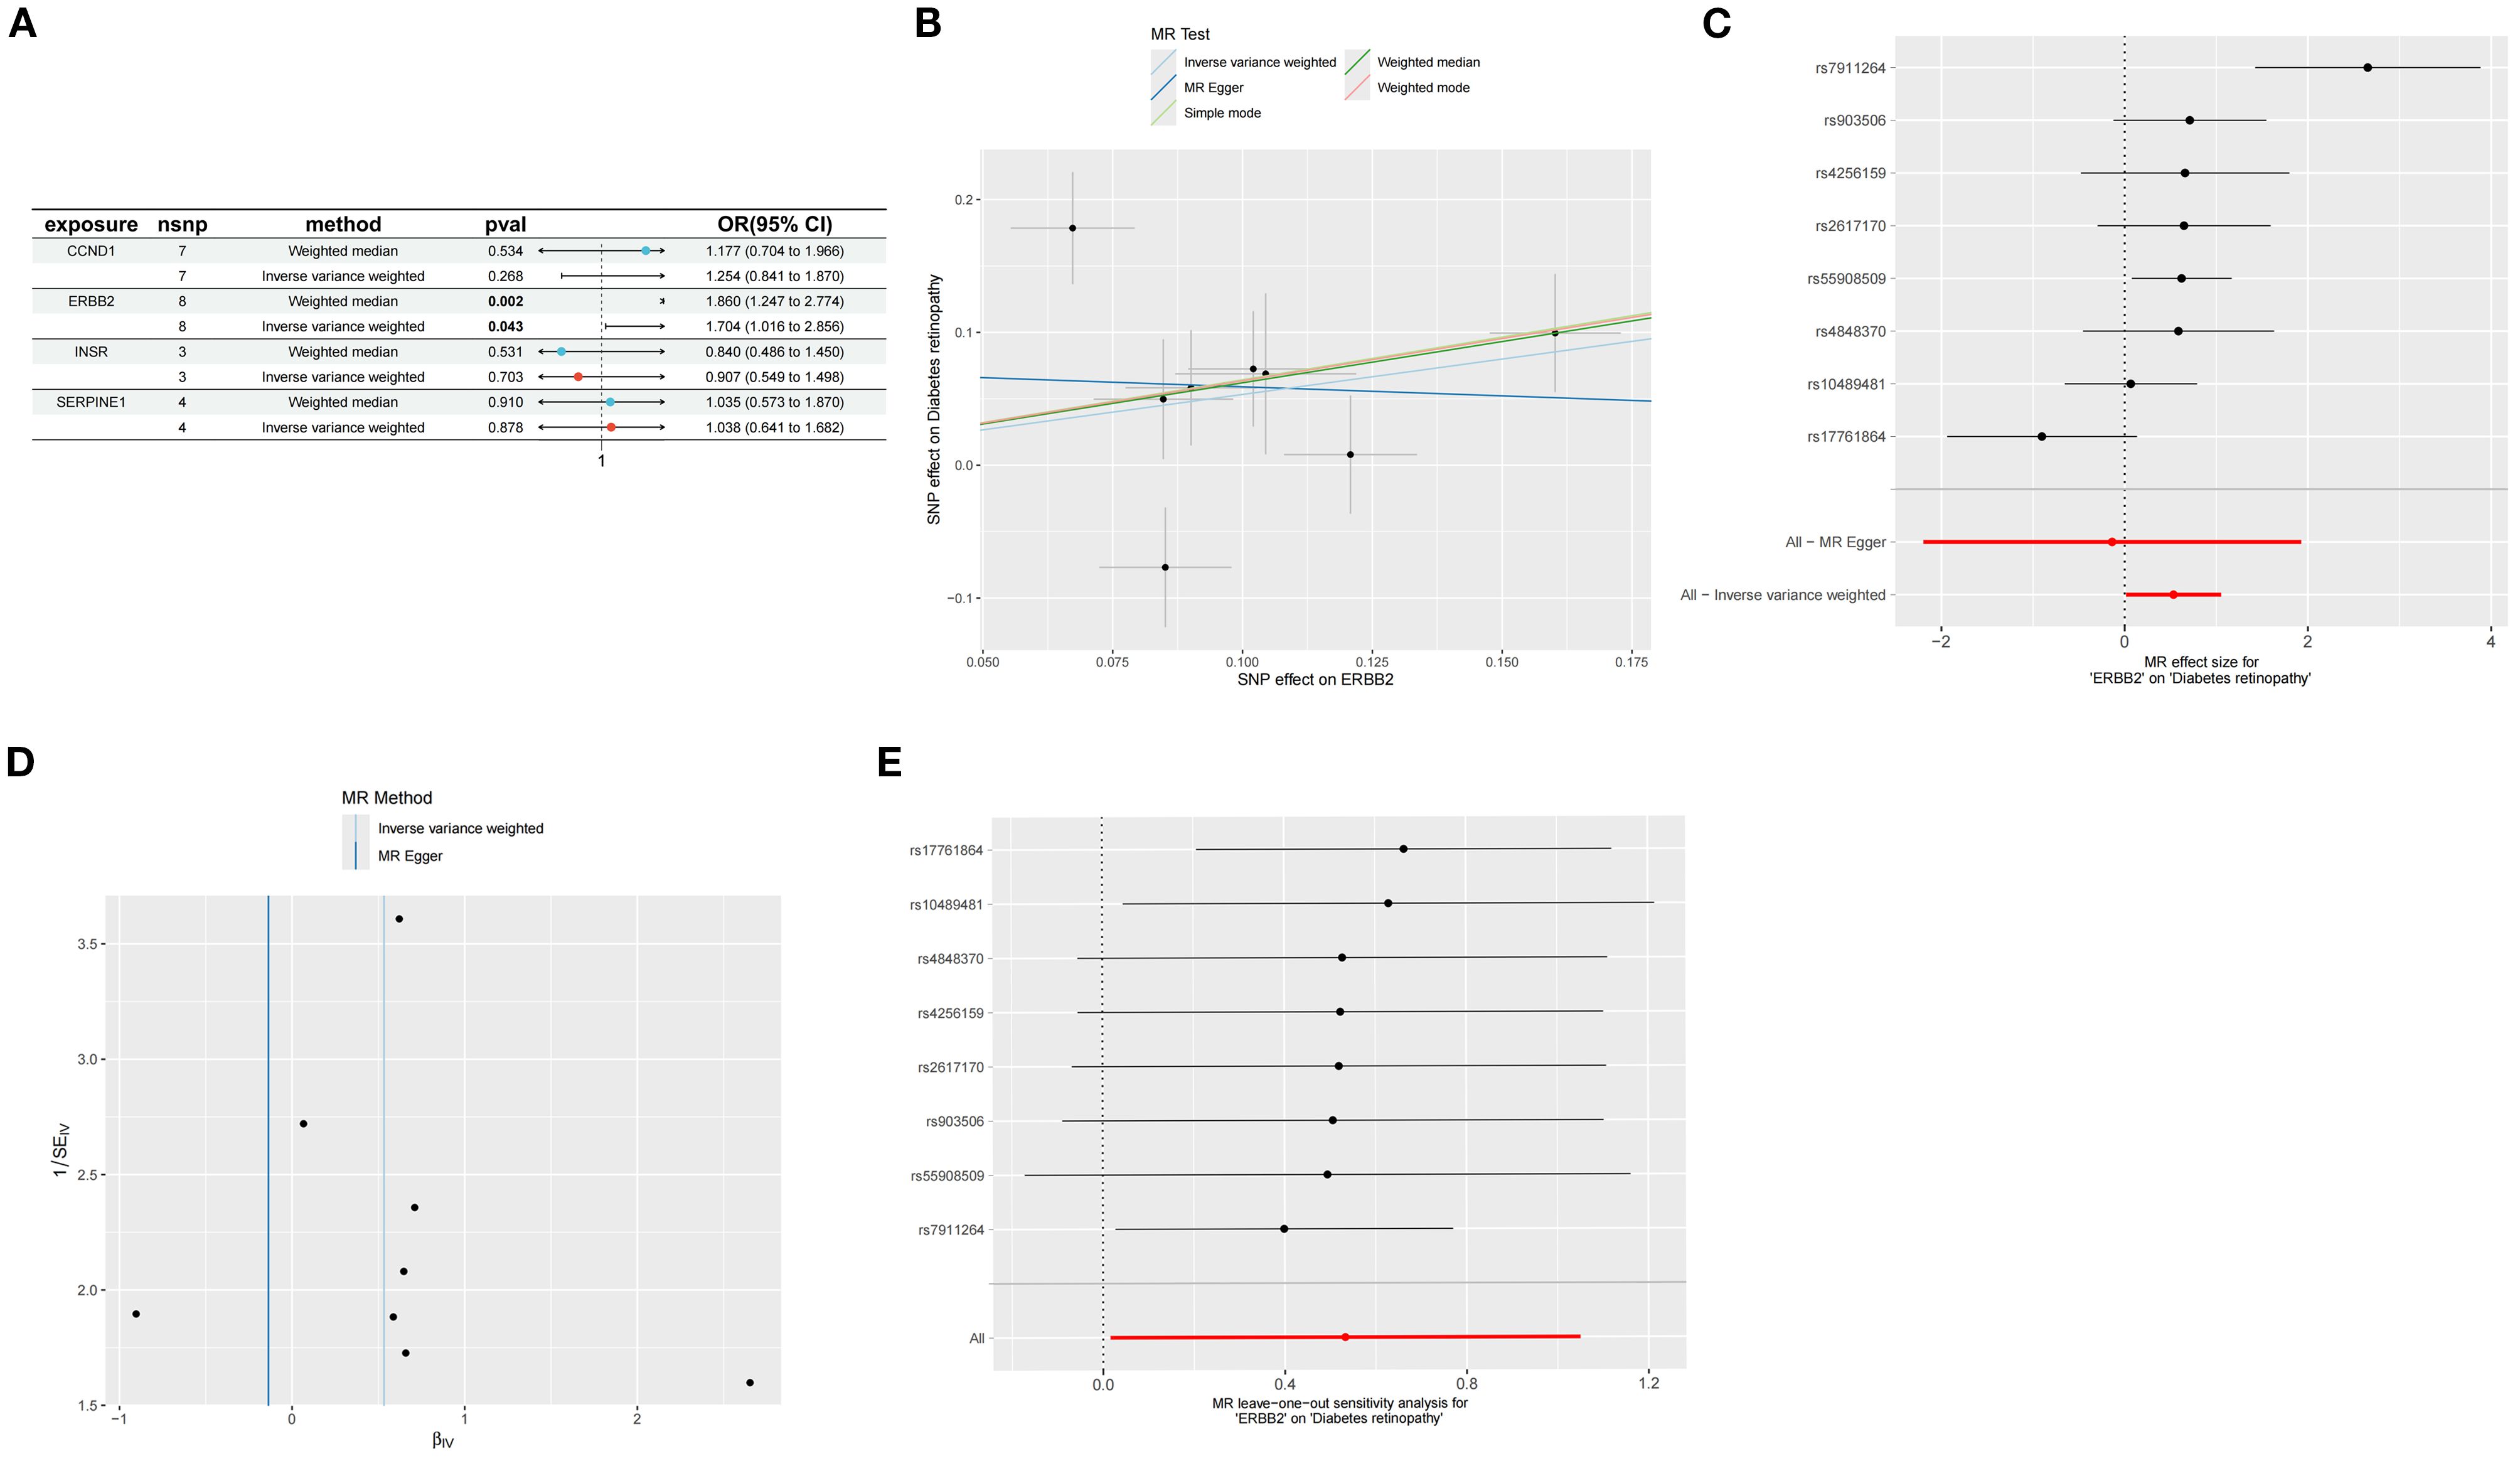
Figure 8. Mendelian randomization analysis of feature genes and DR. (A) Mendelian randomization analysis of five top feature genes. (B) SNP effects on ERBB2 and diabetic retinopathy. (C) Forest plot of MR effect sizes for ERBB2 on diabetic retinopathy. (D) Funnel plot for MR analysis of ERBB2 on diabetic retinopathy. (E) Leave-one-out sensitivity analysis for MR of ERBB2 on diabetic retinopathy.
Cochran’s Q test was employed to evaluate study heterogeneity, revealing significant heterogeneity among the selected instrumental variables (P = 0.003) (Figure 8D; Supplementary Table S5). Consequently, IVW with random effects was applied in all MR analyses to mitigate heterogeneity impact. Despite Cochran’s Q test detecting some heterogeneity, MR-Egger analysis showed minimal influence from horizontal pleiotropy (P>0.05) (Figure 8D; Supplementary Table S4), indicating no directional pleiotropy and affirming stable causal relationships. The leave-one-out analysis demonstrated consistent MR analysis results upon sequential SNP removal, indicating robustness and negligible impact on the overall findings (Figure 8E).
3.10 Molecular docking analysis and validation of GEO datasets
Autodock Vina was utilized for molecular docking to preliminarily validate interactions between core pharmacological components and feature genes. The optimal docking combinations were selected and visualized using Pymol. Through molecular docking analysis of feature genes and core components of MDBD, it was observed that the binding energy for all docking combinations was below -6.0 kcal/mol, suggesting stable structures could be formed between feature genes and core components (Figure 9A; Supplementary Table S6).
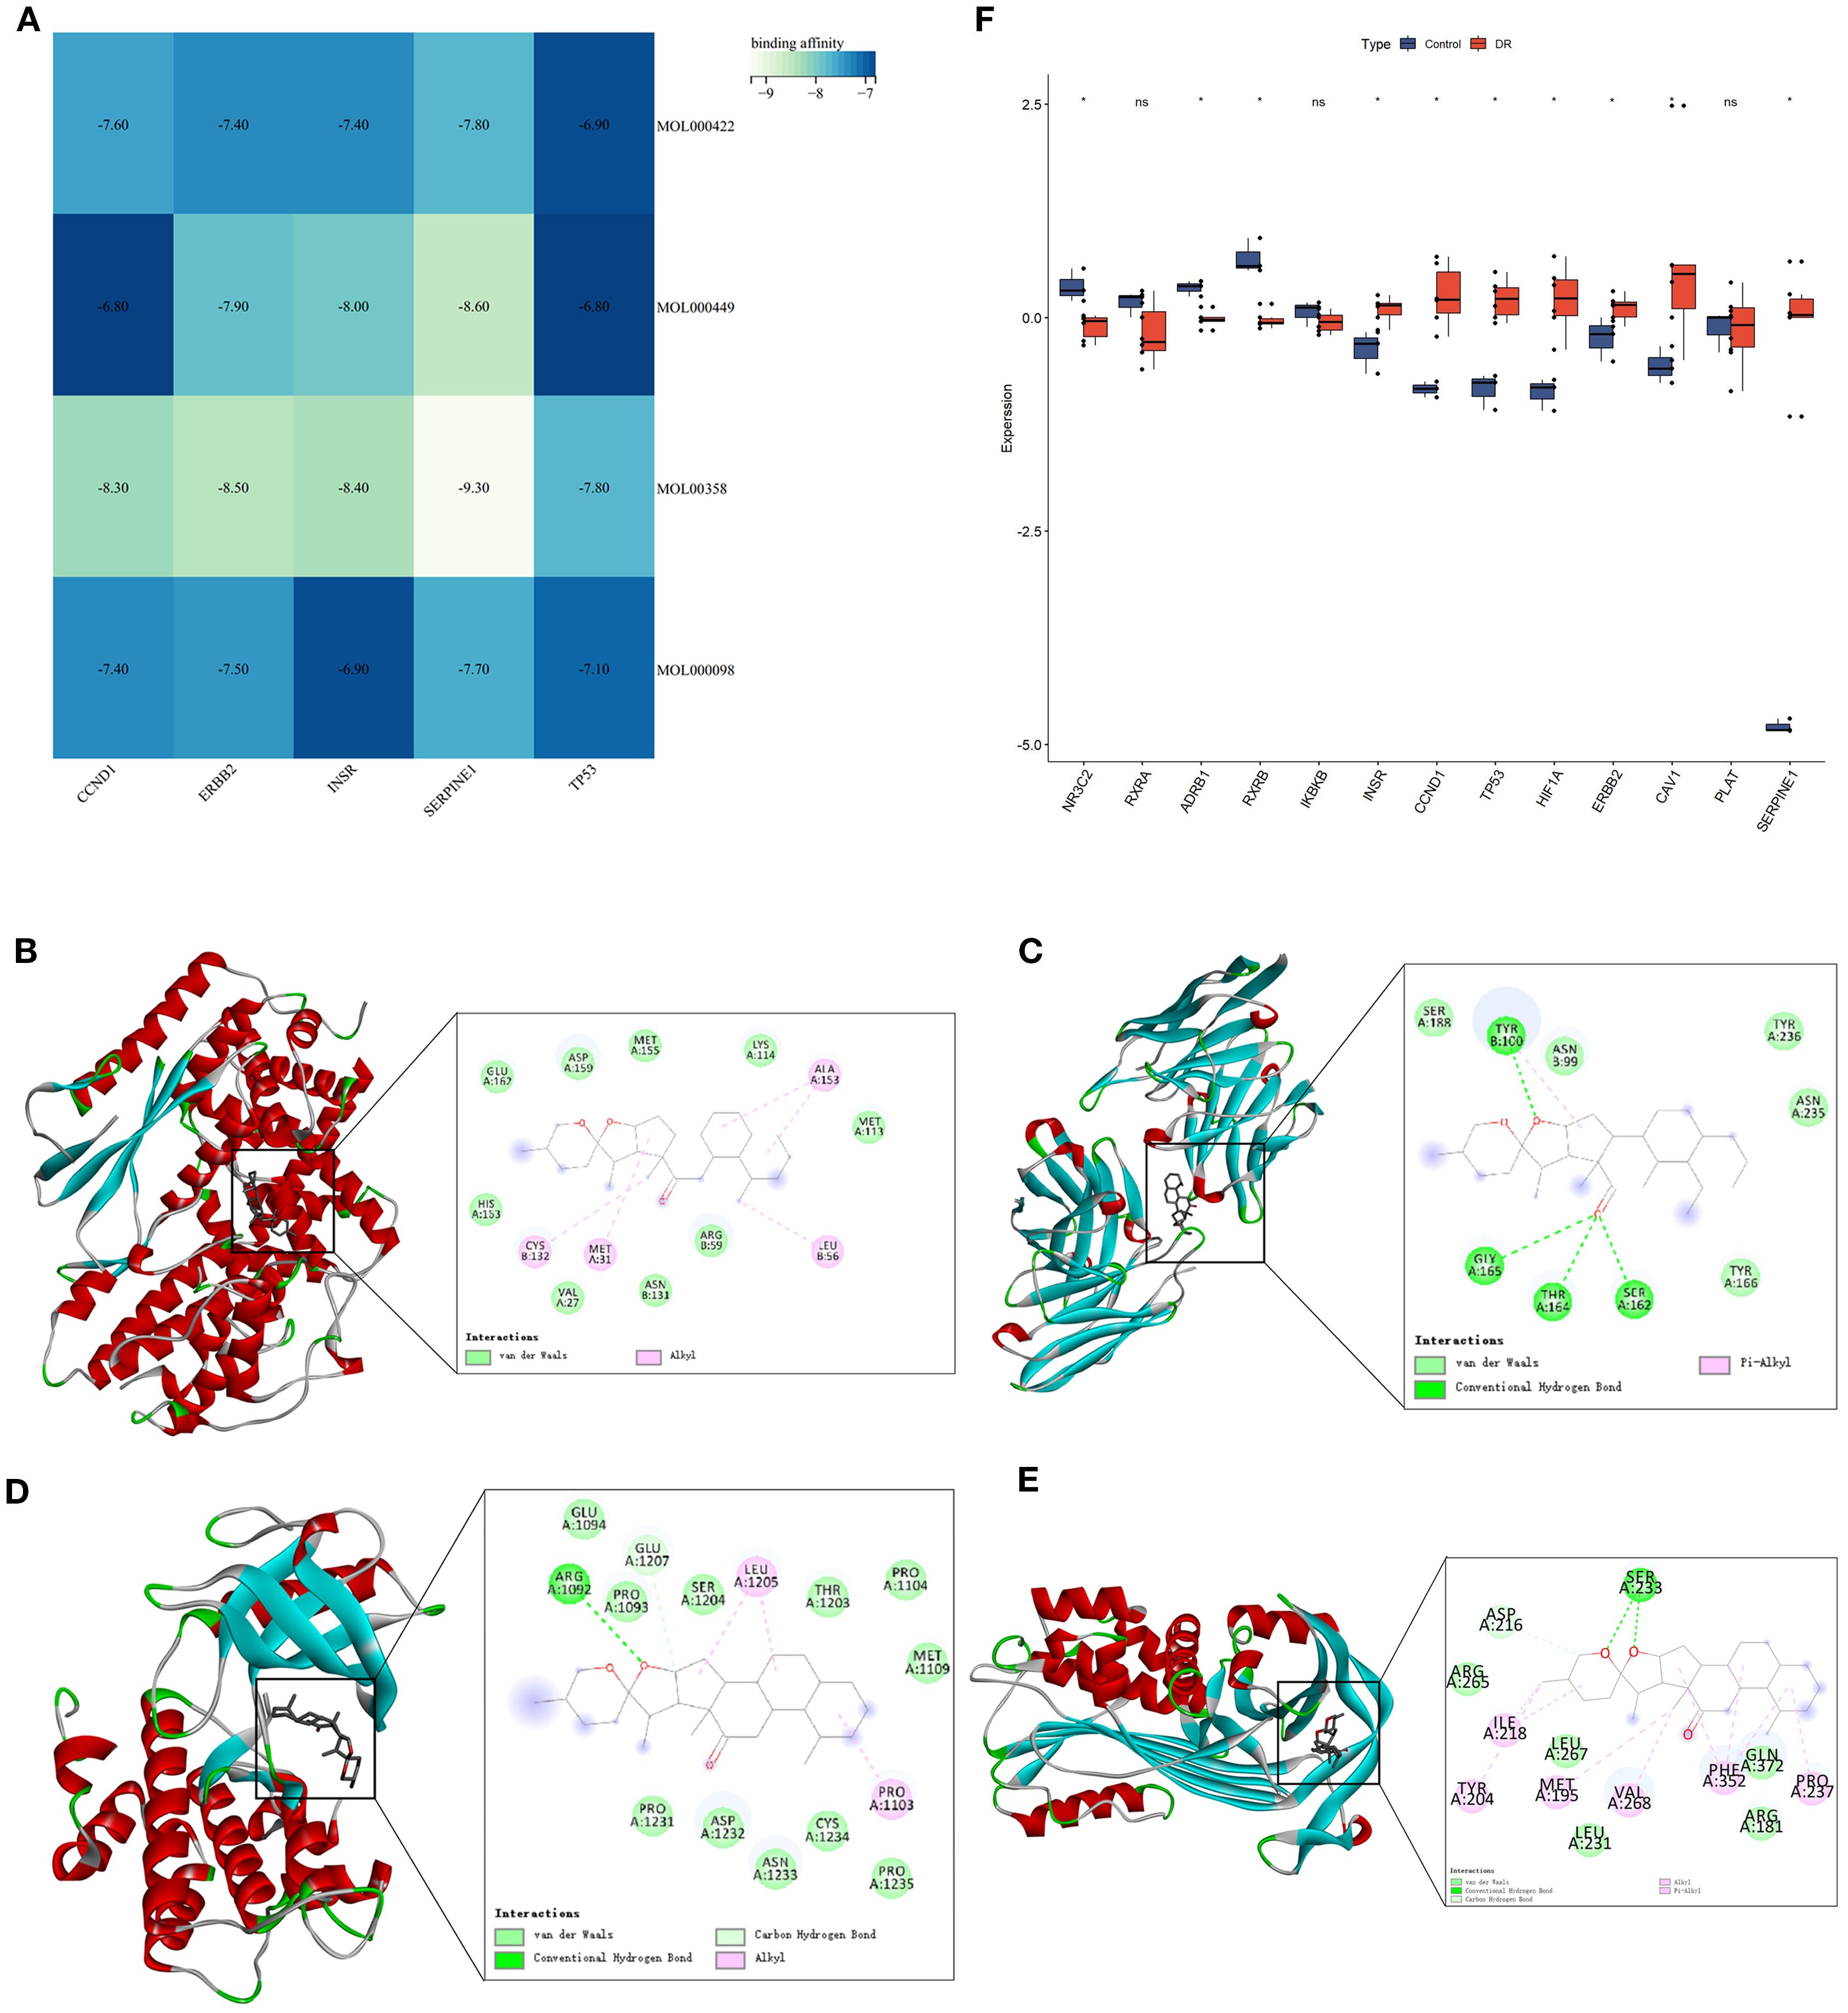
Figure 9. Molecular Docking analysis of feature genes and core components of MDBD and validation of GEO datasets. (A) Heatmap of molecular docking analysis of feature genes and core components of MDBD. The horizontal axis is five top feature genes, and the vertical axis is core components. Darker color denotes weaker affinity and lighter color denotes stronger affinity. (B–E) Molecular docking of Beta-sitosterol with CCND1, ERBB2, INSR, and SERPINE1. (F) Differential expression analysis between the control and DR groups. The horizontal axis is feature genes, and the vertical axis is gene expresion level. The data are presented as the mean ± SEM. *P<0.05.
Figures 9B–E showed the top docking combinations of four key gene proteins with the core components of MDBD, while Figure 9F presented differential expression analysis of GEO datasets between the control and DR groups. Beta-sitosterol exhibited high binding affinity with CCND1, ERBB2, INSR, and SERPINE1. Alkyl interactions with CCND1 residues CYS132, MET31, LEU56, and ALA153, along with van der Waals forces with CCND1 residues GLU162, ASP159, MET155, LYS114, MET113, HIS153, VAL27, ASN131, and ARG59 were noted, with a docking energy of -8.3 kcal/mol (Figure 9B). Conventional hydrogen bonds were formed with ERBB2 residues TYR100, GLY165, THR164, and SER162, along with van der Waals interactions with ERBB2 residues SER188, ASN99, TYR236, ASN235, and TYR166, and a pi-alkyl interaction with TYR100, resulting in a docking energy of -8.5 kcal/mol (Figure 9C). Beta-sitosterol also established a conventional hydrogen bond with INSR residues ARG1092 and a carbon hydrogen bond with GLU1207. Additional van der Waals interactions with residues GLU1094, PRO1093, SER1204, THR1203, PRO1104, MET1109, PRO1235, CYS1234, ASN1233, ASP1232, and PRO1231, as well as alkyl interactions with LUE1205 and PRO1103, were observed, with a docking energy of -8.4 kcal/mol (Figure 9D). Furthermore, beta-sitosterol demonstrated high binding affinity for SERPINE1 residues SER233 through conventional hydrogen bonding and ASP216 through carbon hydrogen bonding. Van der Waals interactions with SERPINE1 residues ARG265, LEU267, LEU231, ARG181, and GLN273, along with pi-alkyl interactions with residues ILE218, TYR204, MET195, VAL268, PHE352, and PRO237, were also noted, with a docking energy of -9.3 kcal/mol (Figure 9E).
3.11 Cluster analysis of SDECGs and inter-cluster comparisons
K-means clustering, utilizing Euclidean distance and a maximum of nine clusters, was employed to categorize DR samples based on SDECG expression. The analysis revealed two distinct clusters, achieving optimal accuracy (Figures 10A, B) and demonstrating high cluster stability (Figures 10C, D). Subsequent examination of SDECG expression in these clusters identified significantly elevated levels of NR3C2, PSMG1, INSR, HIF1A, and RXRB in Cluster C1 (P < 0.05, P < 0.01, P < 0.001), whereas IKBKB, CAV1, RXRA, TP53, CCND1, ERBB2, ADRB1, PLAT, and SERPINE1 showed increased expression in Cluster C2 (P < 0.05, P < 0.01, P < 0.001) (Figures 10E, F). Principal component analysis (PCA) results indicated a discernible separation between Clusters C1 and C2, with Cluster C1 exhibiting a higher density (Figure 10G). To assess immune cell level variations between C1 and C2, ssGSEA was conducted, identifying statistically significant immune cell populations. Notably, Cluster C1 exhibited higher fractions of CD8+ T cells, resting dendritic cells, and resting mast cells (P < 0.05, P < 0.01, P < 0.001), while Cluster C2 had elevated levels of resting CD4+ memory T cells, regulatory T cells (Tregs), M0 macrophages, and eosinophils (P < 0.05, P < 0.01, P < 0.001) (Figure 10H). Immune cell infiltration analysis further characterized the immune cell types and levels in each cluster, visually depicted in Figure 10I.
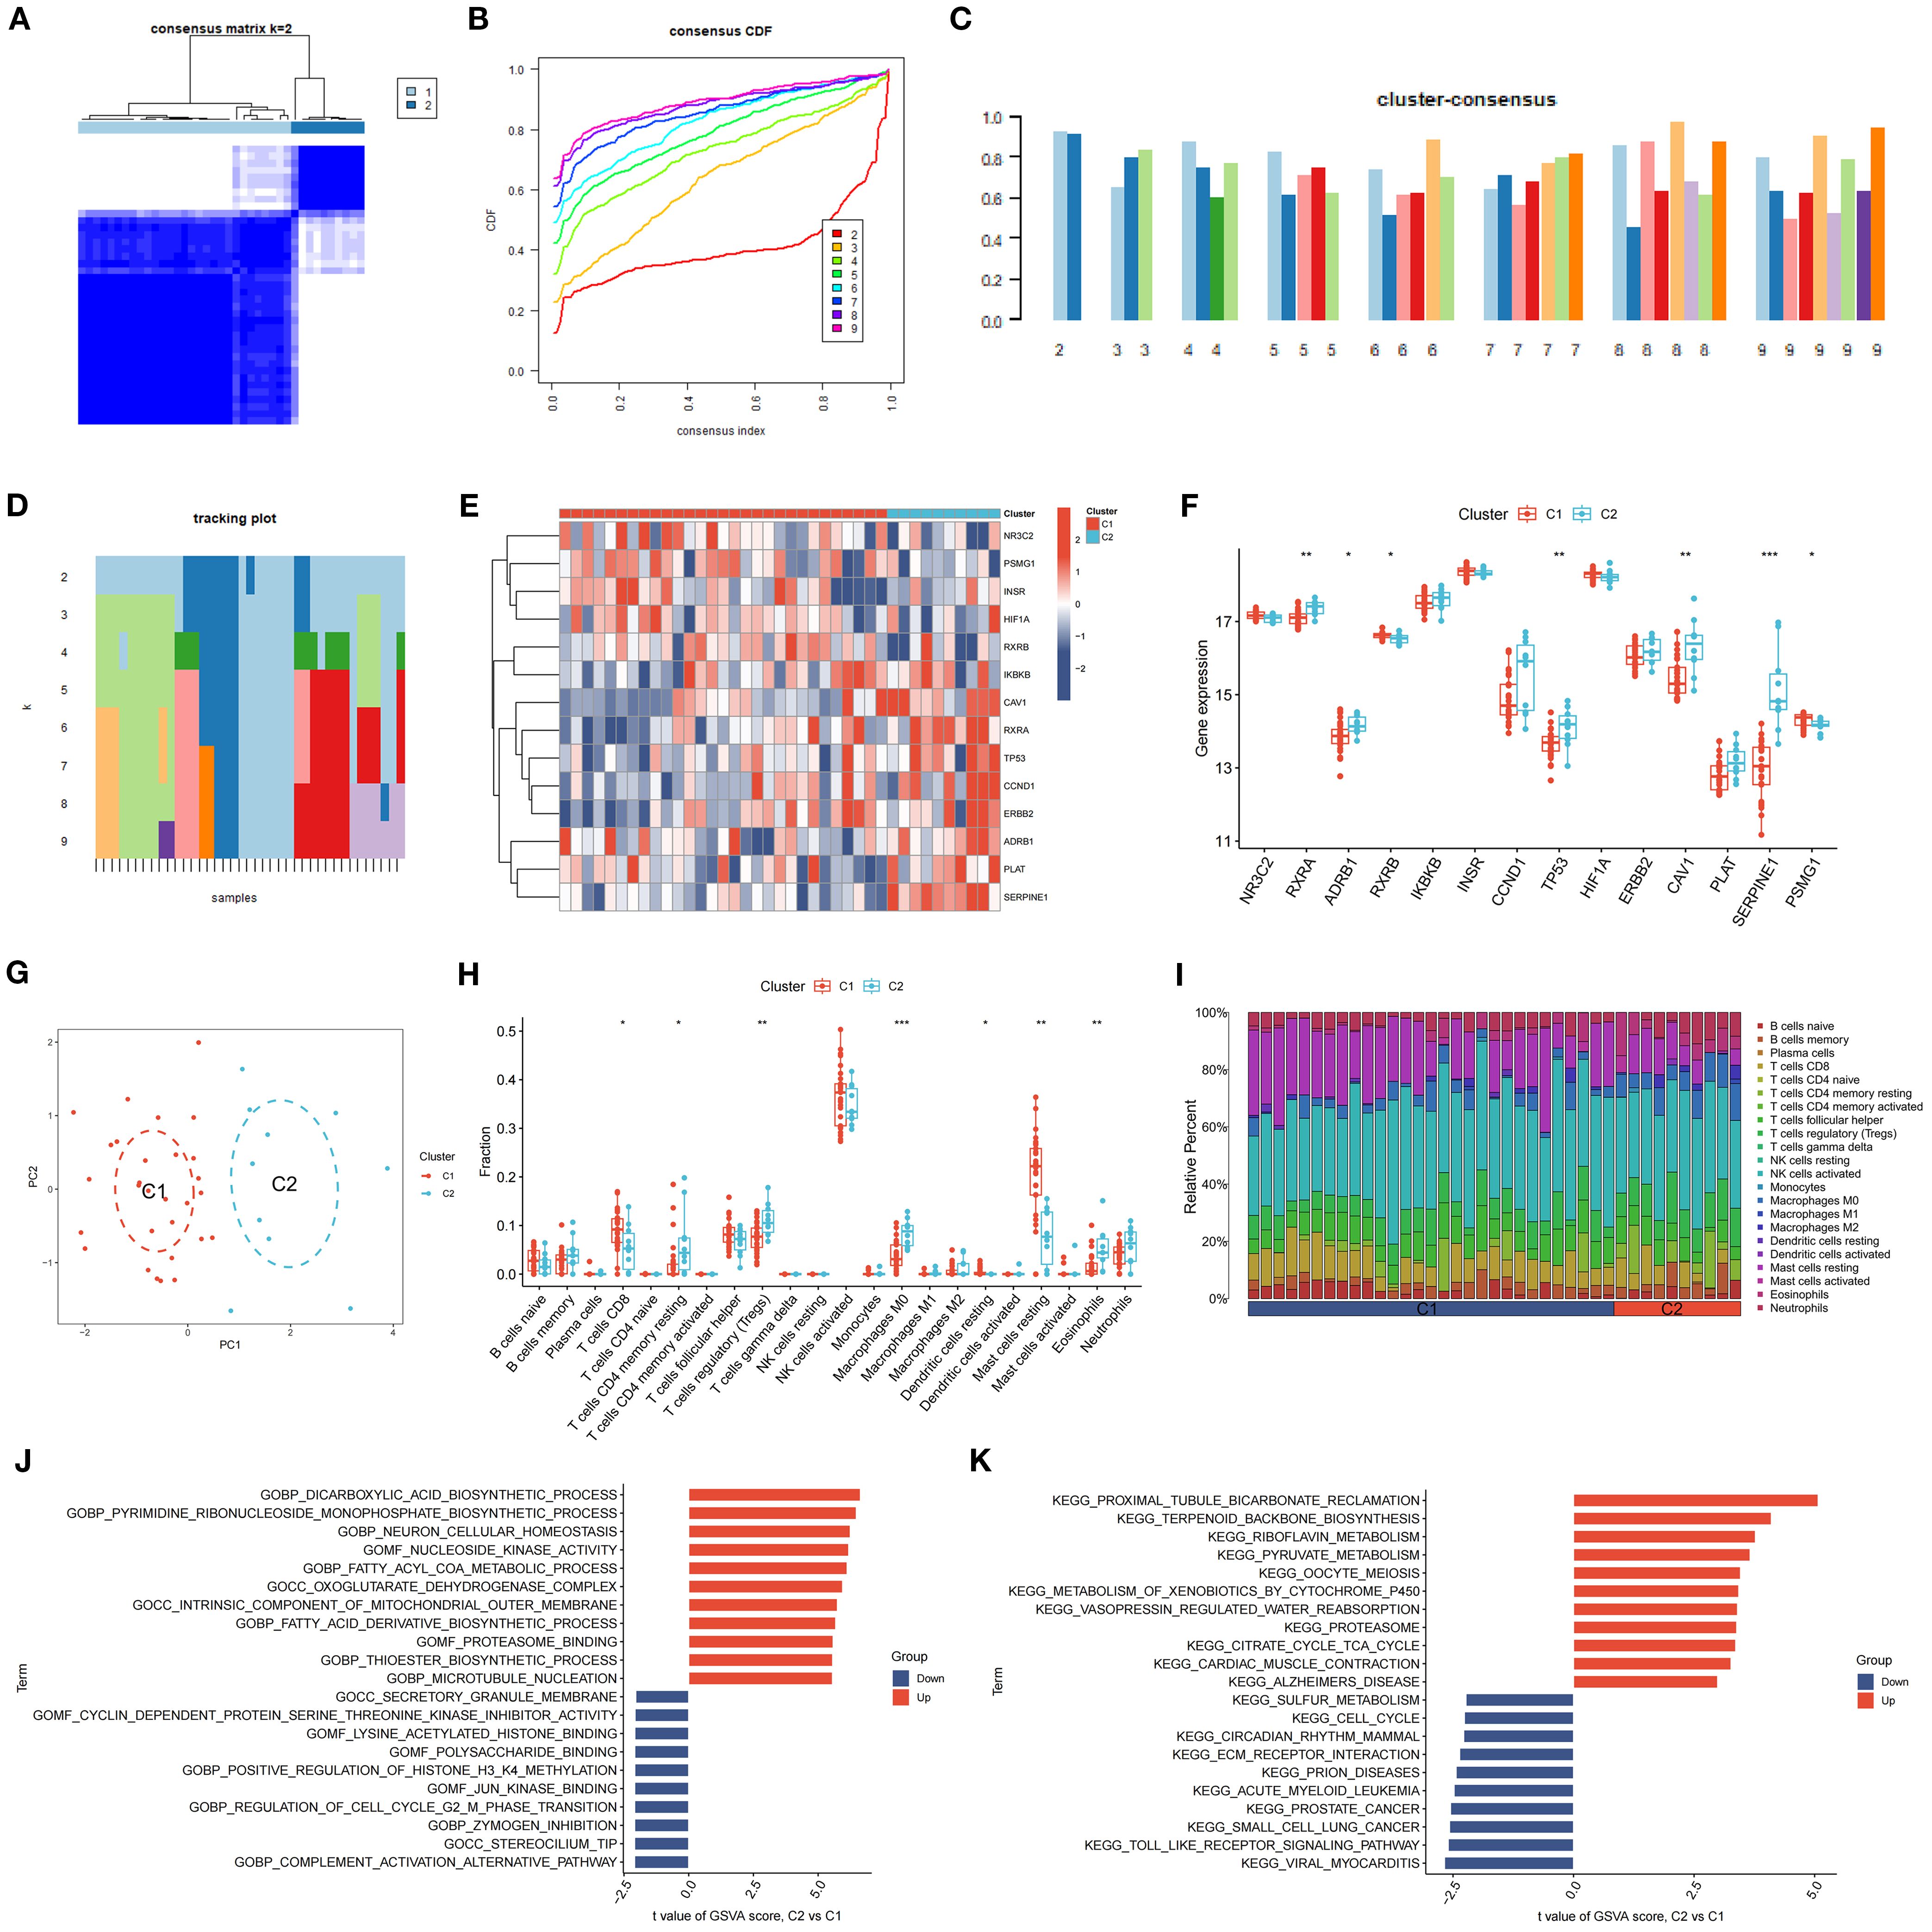
Figure 10. Clustering and Expression Analysis of SDECGs. (A) A heatmap of the consensus matrix for the clustering of SDECGs across samples. (B) The cumulative distribution functions derived from the consensus matrix of SDECGs clustering. (C) The cluster consensus plot of mean consensus scores across different clusters. The horizontal axis shows the number of clusters (k = 2–9), and the vertical axis shows the mean consensus score. Colors represent the respective clusters. (D) The tracking plot of mean consensus scores for diverse clusters. (E) Heatmap of the expression of SDECGs between C1 and C2. Red presents upregulated genes, and blue presents downregulated genes. (F) The box plot of he expression differences of SDECGs between C1 and C2. The horizontal axis is SDECGs, and the vertical axis is gene expresion level. The data are presented as the mean ± SEM. *P<0.05; **P<0.01; ***P<0.001. (G) The PCA scatter plots of SDECGs between C1 and C2. (H, I) ssGSEA comparison of immune cells between C1 and C2. The horizontal axis is immune cells, and the vertical axis is immune cell fraction in figure 10H. The data are presented as the mean ± SEM. *P<0.05; **P<0.01; ***P<0.001. (J, K) GO and KEGG gene set enrichment analysis by GSEA of C1 and C2.
GSVA revealed that terms related to the dicarboxylic acid biosynthetic process, pyrimidine ribonucleoside monophosphate biosynthetic process, neuron cellular homeostasis, nucleoside kinase activity, fatty acyl-CoA metabolic process, and oxoglutarate dehydrogenase complex were upregulated in C2 compared to C1. Conversely, terms associated with the secretory granule membrane, cyclin-dependent protein serine/threonine kinase inhibitor activity, lysine acetylated histone binding, polysaccharide binding, and positive regulation of histone H3 K4 methylation were downregulated (Figure 9J). KEGG analysis indicated that pathways such as proximal tubule bicarbonate reclamation, terpenoid backbone biosynthesis, riboflavin metabolism, pyruvate metabolism, oocyte meiosis, and xenobiotic metabolism by cytochrome P450 were upregulated in C2 relative to C1, whereas sulfur metabolism, cell cycle, circadian rhythm, ECM receptor interaction, and prion diseases were downregulated (Figure 10K).
3.12 DEGs enrichment analysis across SDECG clusters in DR samples
Enrichment analysis was conducted to elucidate the biological functions and pathways linked to the 726 DEGs, thereby revealing the mechanisms through which MDBD influences DR from various perspectives. The DEGs underwent GO enrichment analysis for BP, CC and MF. Findings indicated significant enrichment of DEGs in BP, primarily involving neuron and cell development, encompassing neuron projection regulation, axon development, positive regulation of cell development, axonogenesis, and wound healing. Enrichment in CC included collagen-containing extracellular matrix, neuronal cell body, and endoplasmic reticulum lumen, while MF enrichment comprised growth factor binding, cytokine binding, and voltage-gated monoatomic ion channel activity (Figures 11A, B). KEGG enrichment analysis suggested DEG involvement in pathways such as complement and coagulation cascades, pertussis, TGF-beta signaling, focal adhesion, and the PI3K-Akt signaling pathway (Figure 11C).
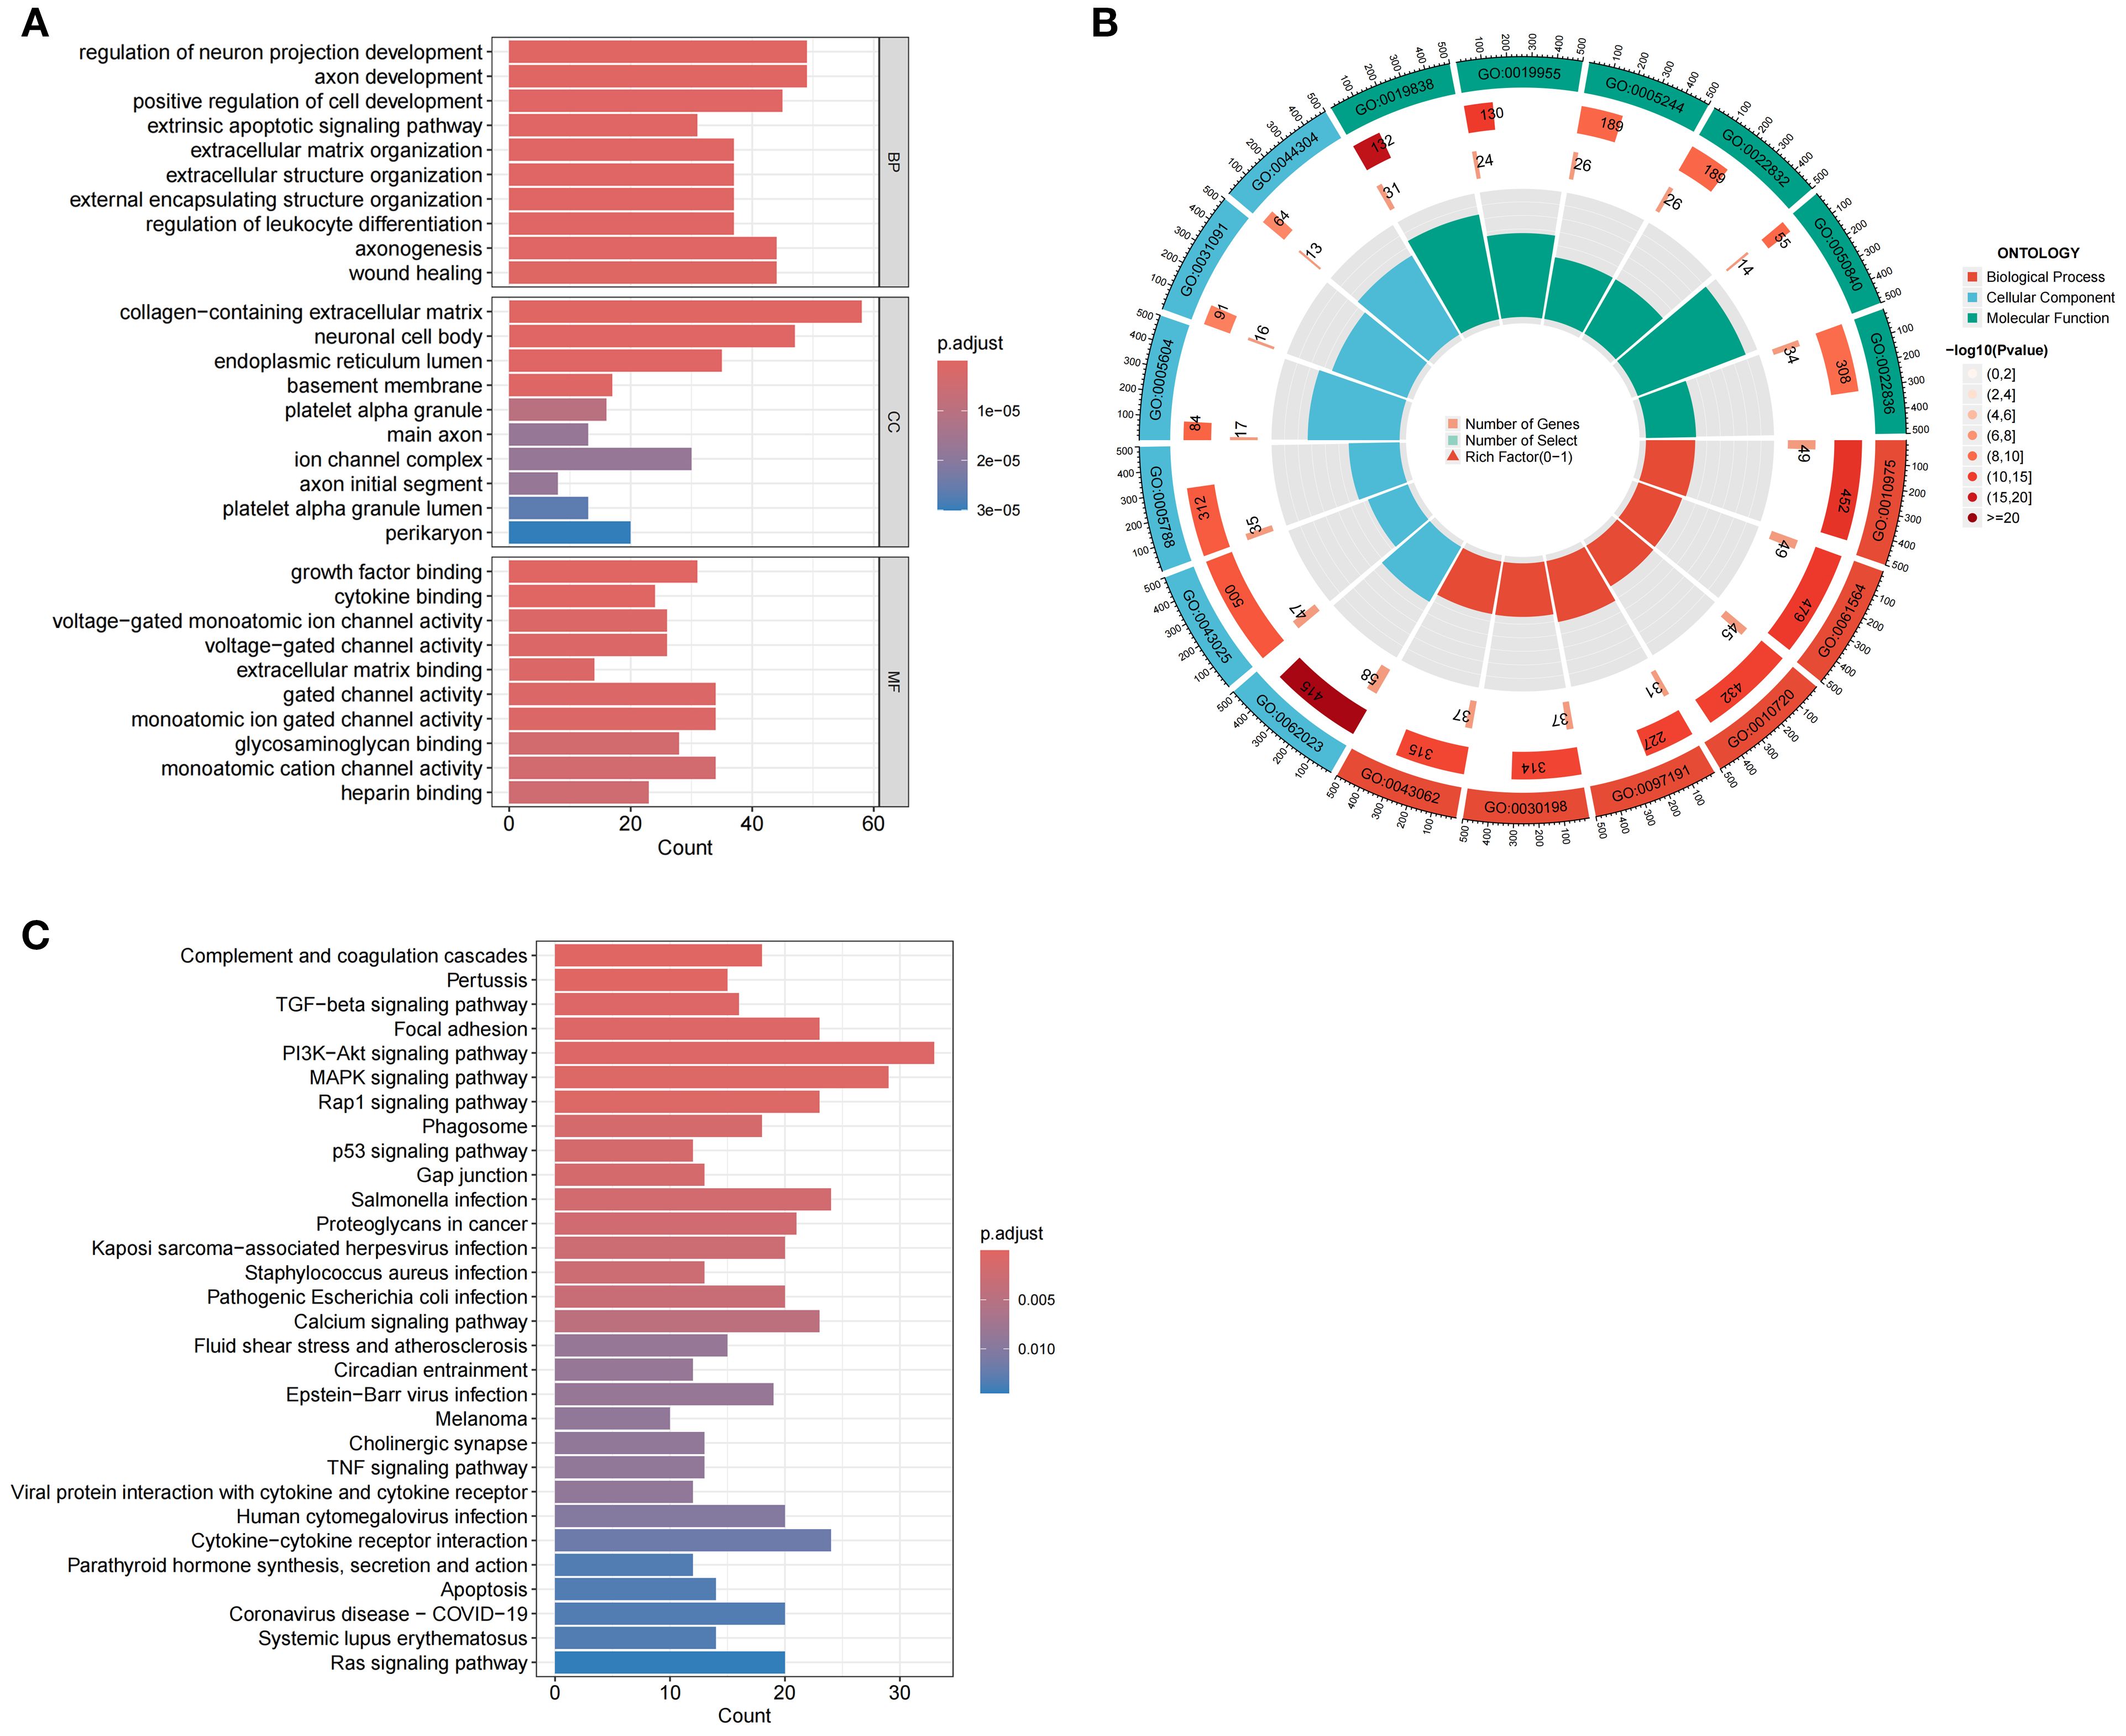
Figure 11. Enrichment Analysis of DEGs Using GO and KEGG. (A) GO enrichment analysis of DEGs. The horizontal axis is the number of DEGs associated with each enriched GO term, and the vertical axis is enriched GO terms. BP: Biological Process; CC: Cellular Component; MF: Molecular Function. (B) Circular diagram of GO enrichment analysis of DEGs. The outermost layer labels each pathway, while the innermost layer summarizes the P value and enrichment size (gene count). (C) KEGG enrichment analysis of DEGs. The horizontal axis is the number of DEGs associated with each enriched KEGG pathway, and the vertical axis is enriched KEGG pathways.
3.13 Analysis of DEG clusters and inter-cluster comparisons
K-means clustering, utilizing Euclidean distance with a maximum of nine clusters, was applied to classify DR samples based on the expression of 726 DEGs. This approach resulted in the division of samples into two distinct clusters, achieving precise outcomes (Figures 12A, B) and demonstrating high stability (Figures 12C, D). A subsequent analysis of DEG expression within these clusters identified 305 DEGs with significantly increased expression levels in Cluster CI and decreased levels in Cluster CII, including CD163L1, PCYT2, SLC45A1, and ELOVL6. Conversely, 421 DEGs showed elevated expression in Cluster CII and reduced levels in Cluster CI, such as LPAR6, CGNL1, SHISA9, and TNFRSF1B (Figure 12E). Principal Component Analysis (PCA) revealed a clear distinction between the clusters, with Cluster CI exhibiting a higher density than Cluster CII (Figure 12F). ssGSEA results indicated a high expression of naive B cells, CD8+ T cells, resting dendritic cells, and resting mast cells in Cluster CI (P < 0.01), whereas regulatory T cells (Tregs), activated NK cells, and M0 macrophages were more prevalent in Cluster CII (P < 0.05, P < 0.01, P < 0.001) (Figure 12G). Immune cell infiltration analysis characterized the types and levels of immune cells expressed in each sample from both clusters, visually represented in Figure 12H.
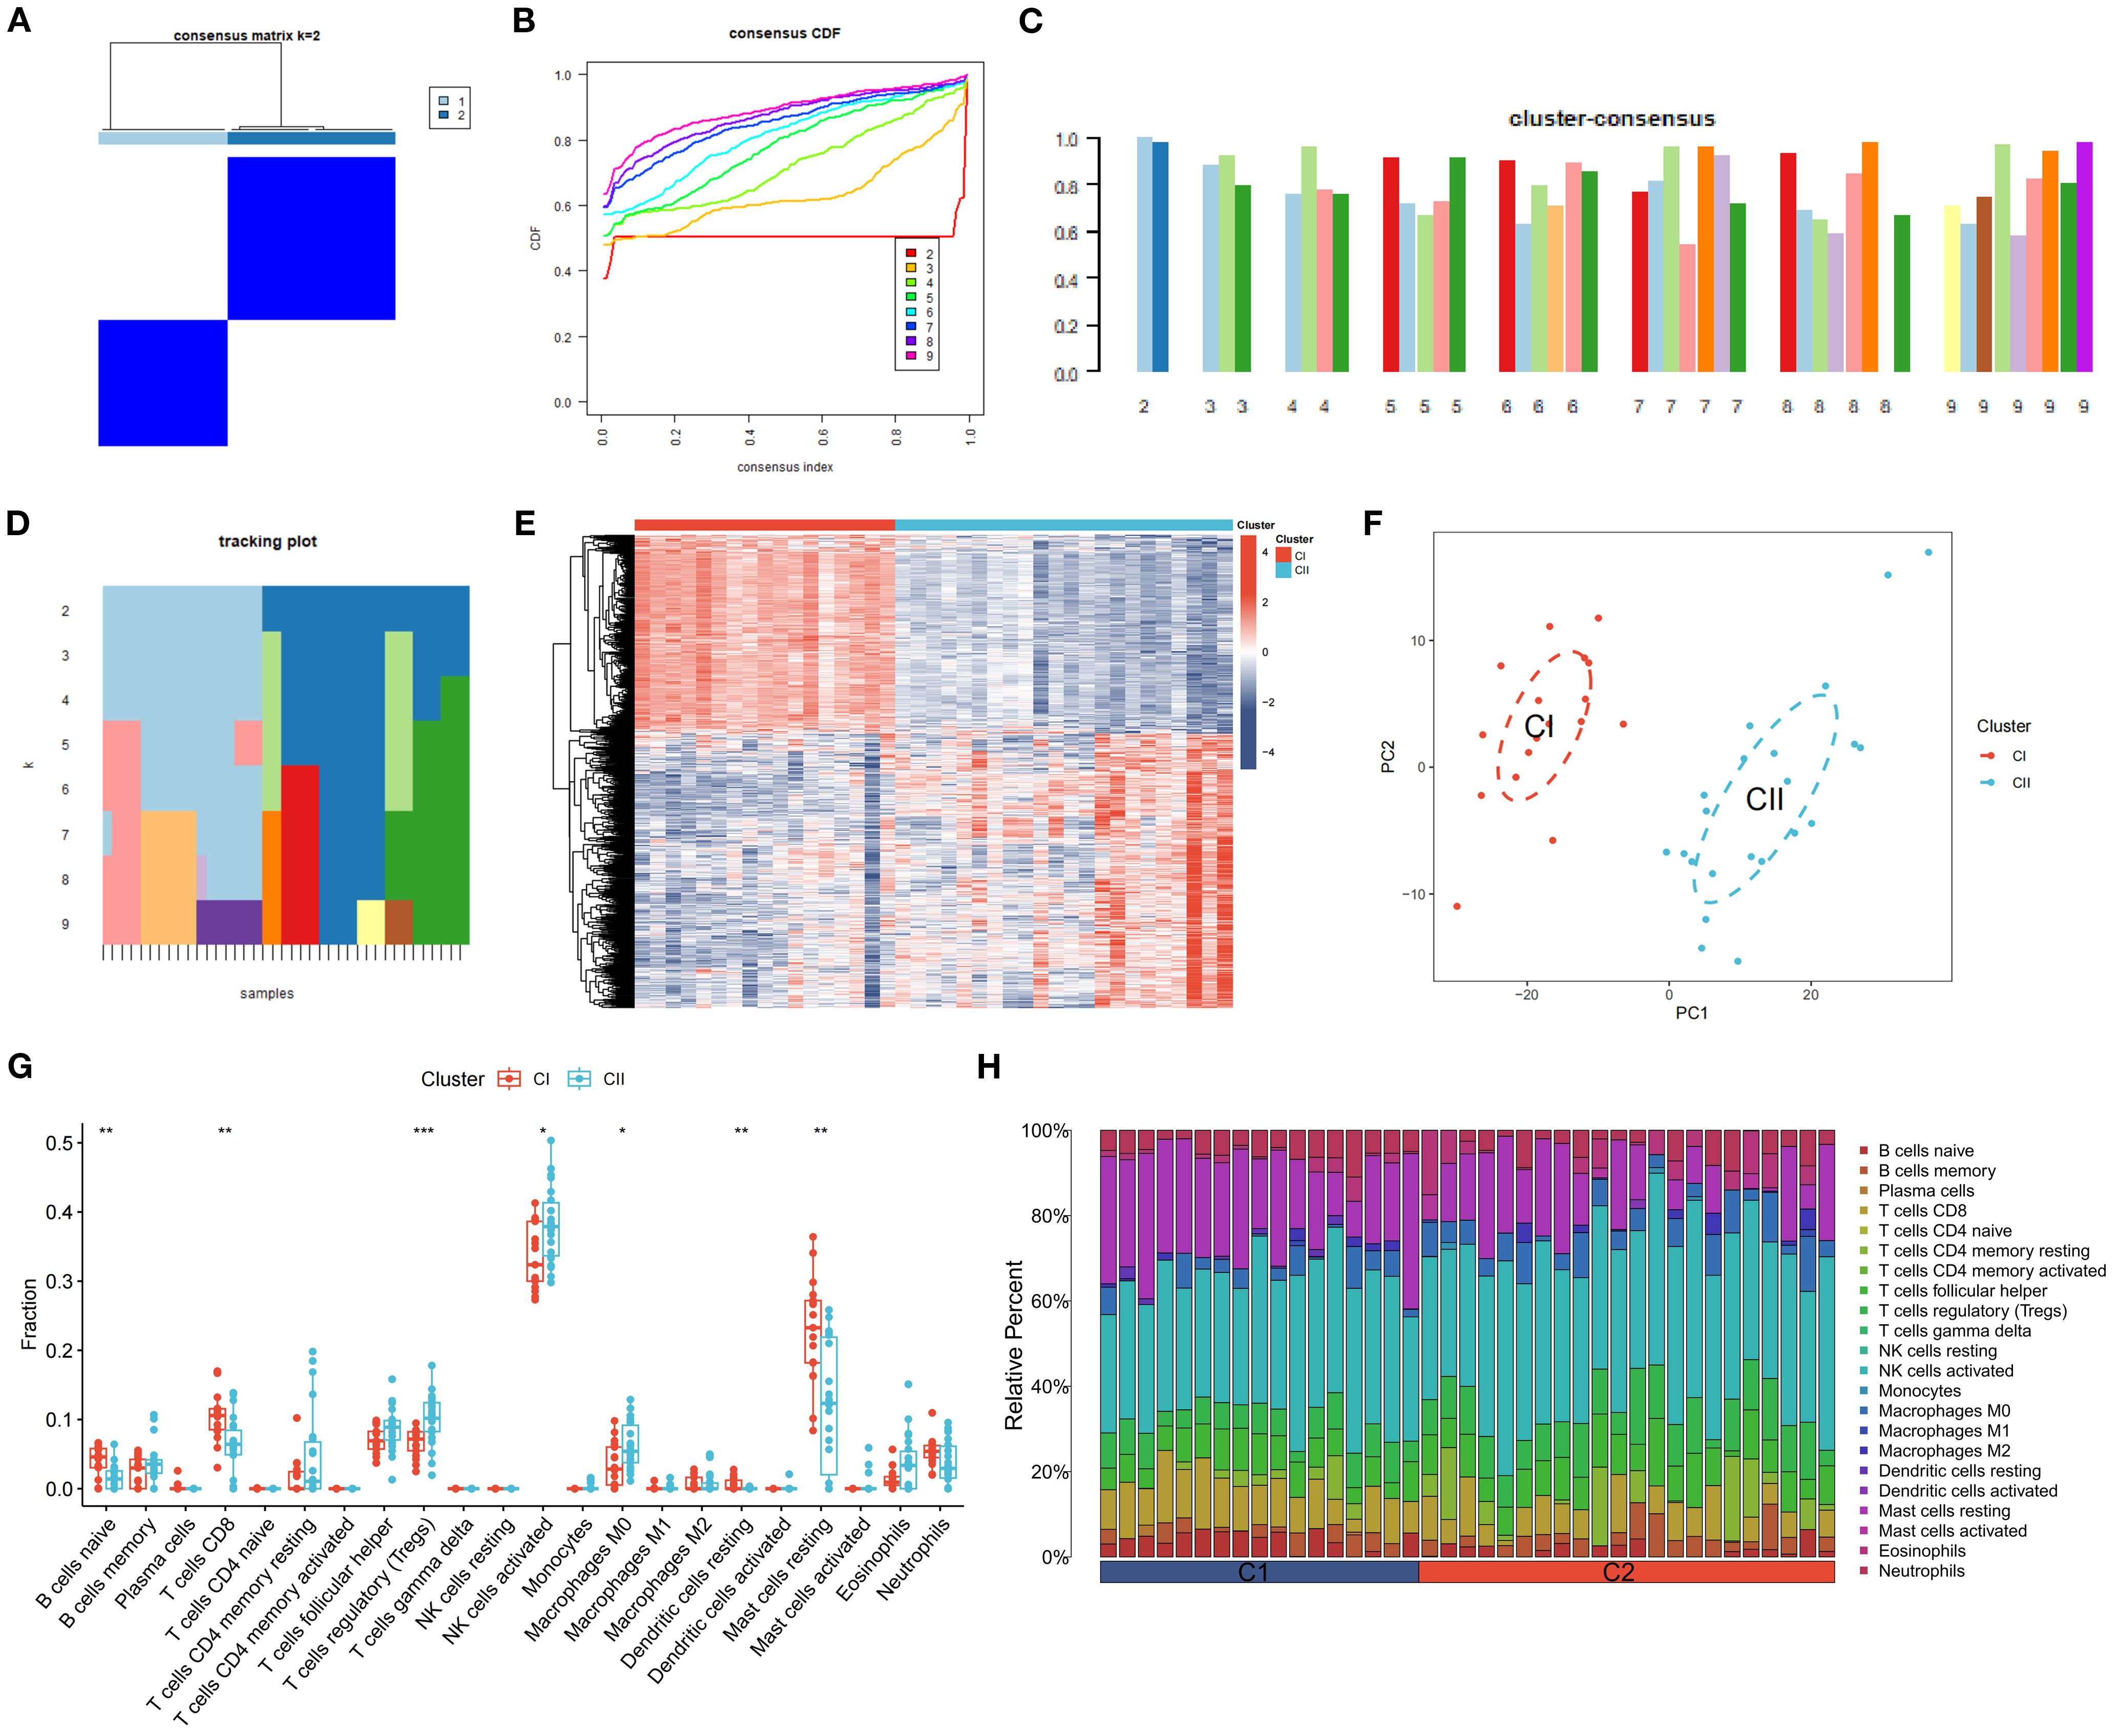
Figure 12. Clustering and Expression Analysis of DEGs. (A) A heatmap of the consensus matrix for DEG clustering across samples. (B) Cumulative distribution functions from the consensus matrix of DEG clustering. (C) Mean consensus scores for various clusters. The horizontal axis shows the number of clusters (k = 2–9), and the vertical axis shows the mean consensus score. Colors represent the respective clusters. (D) The tracking of mean consensus scores across different clusters. (E) Heatmap of the expression of DEGs between CI and CII. (F) PCA scatter plots of DEGs between CI and CII. (G, H) The comparison of ssGSEA for immune cells between CI and CII. The horizontal axis is immune cells, and the vertical axis is immune cell fraction in figure 12G. The data are presented as the mean ± SEM. *P<0.05; **P<0.01; ***P<0.001.
3.14 Comparative analysis of SDECG scores across clusters and alluvial plot construction
PCA was utilized to evaluate the SDECGs of MDBD in DR treatment, leading to the establishment of a scoring model. Differences in scores among various clusters were assessed to determine significant disparities in SDECGs and to establish the corresponding cluster relationships, ensuring the findings’ reliability. PCA results indicated a statistically significant difference between two SDECG clusters (P < 0.001) (Figure 13A) and two DEG clusters (P < 0.001) (Figure 13B), demonstrating that C1 has a higher score than C2, and CI surpasses CII. The alluvial plot suggested that C1 in SDECG clustering aligns with CI in DEG clustering, while C2 corresponds predominantly to CII (Figure 13C).
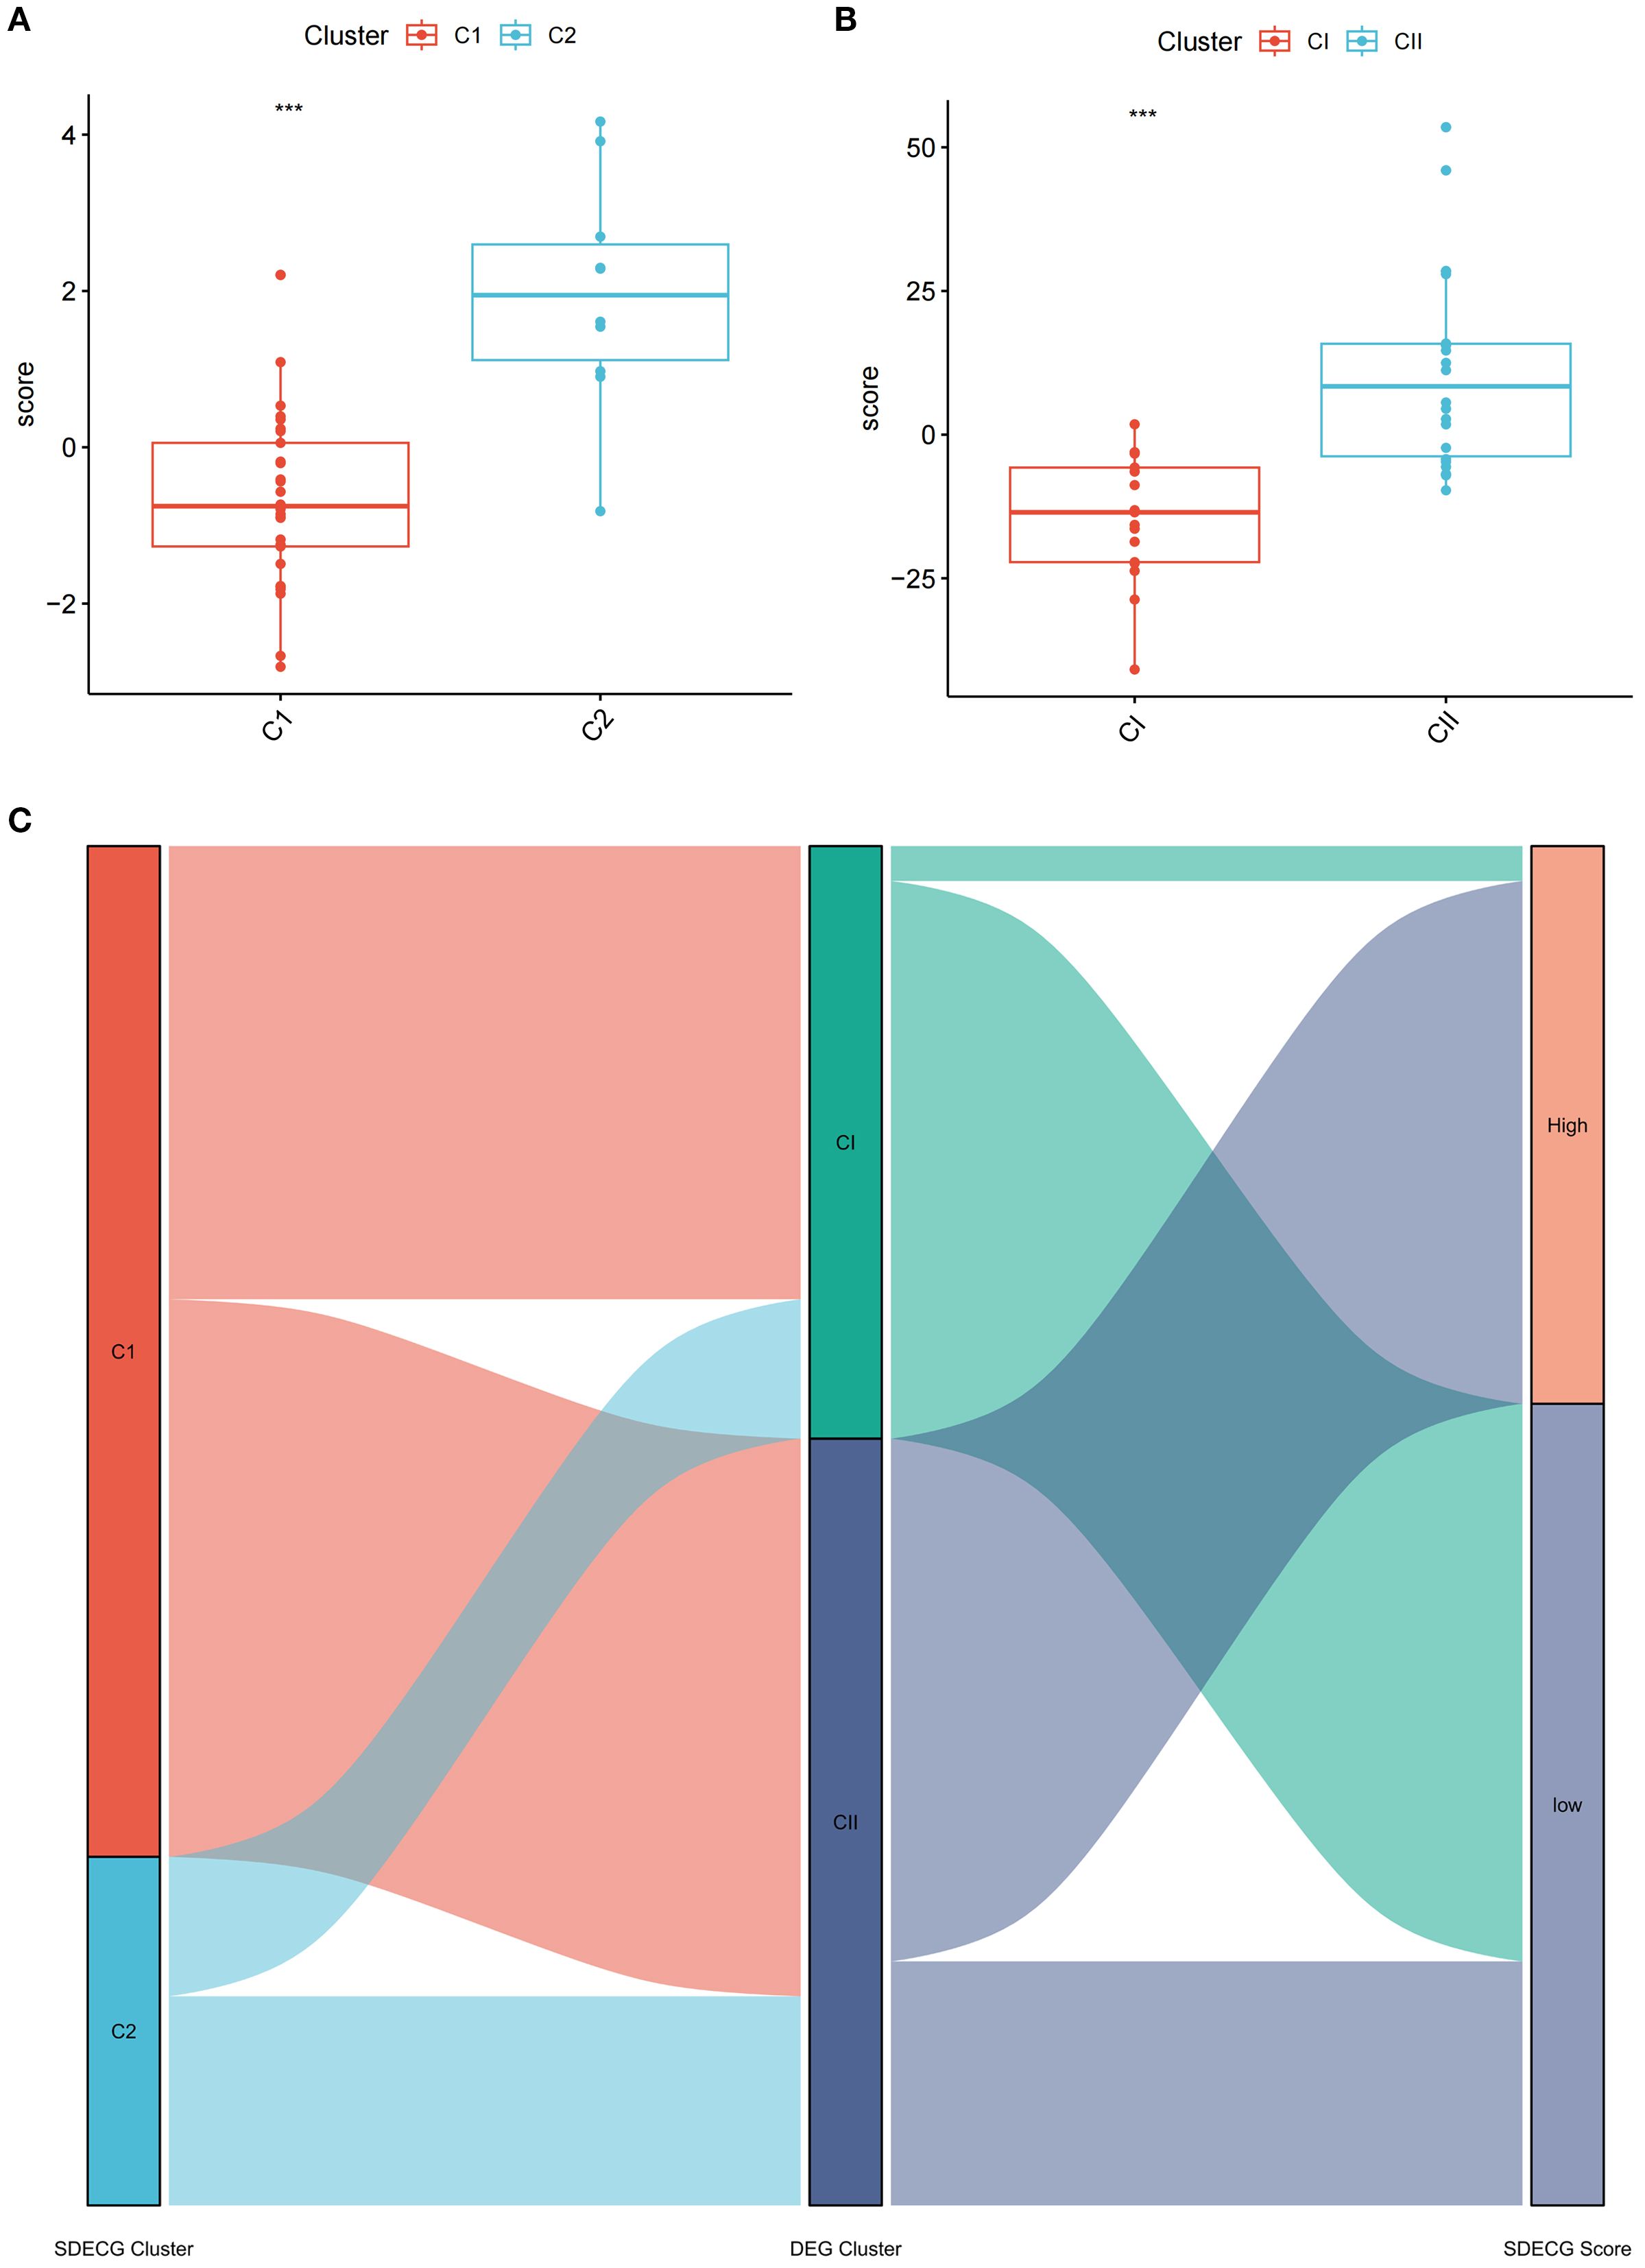
Figure 13. Comparative Analysis of SDECG Scores and Cluster Relationships. (A) The scores for SDECG in Clusters C1 and C2. The horizontal axis is sample groups, and the vertical axis is SDECG score of samples. The data are presented as the mean ± SEM. *P<0.05; **P<0.01; ***P<0.001. (B) The DEG scores for Clusters CI and CII. The horizontal axis is sample groups, and the vertical axis is DEG score of samples. The data are presented as the mean ± SEM. *P<0.05; **P<0.01; ***P<0.001. (C) Alluvial plot of the inter-cluster relationships. The alluvial plot shows the relationships and overall flow between SDECG clusters, DEG clusters, and samples with high and low SDECG scores. Each ribbon represents the flow of samples across SDECG clusters, DEG clusters, and SDECG score groups (High vs Low).
3.15 In vitro experimental validation of beta-sitosterol effects
A cell viability assay demonstrated a significant reduction in viability in the hypoxia-induced model group compared to the control group (P < 0.001). However, treatment with beta-sitosterol at concentrations of 8μM, 12μM, 16μM, and 20μM significantly restored cell viability relative to the model group (P < 0.001 for all comparisons) (Figure 14A). Notably, the 12μM and 16μM beta-sitosterol treatment groups exhibited the most pronounced effects, warranting further investigation.
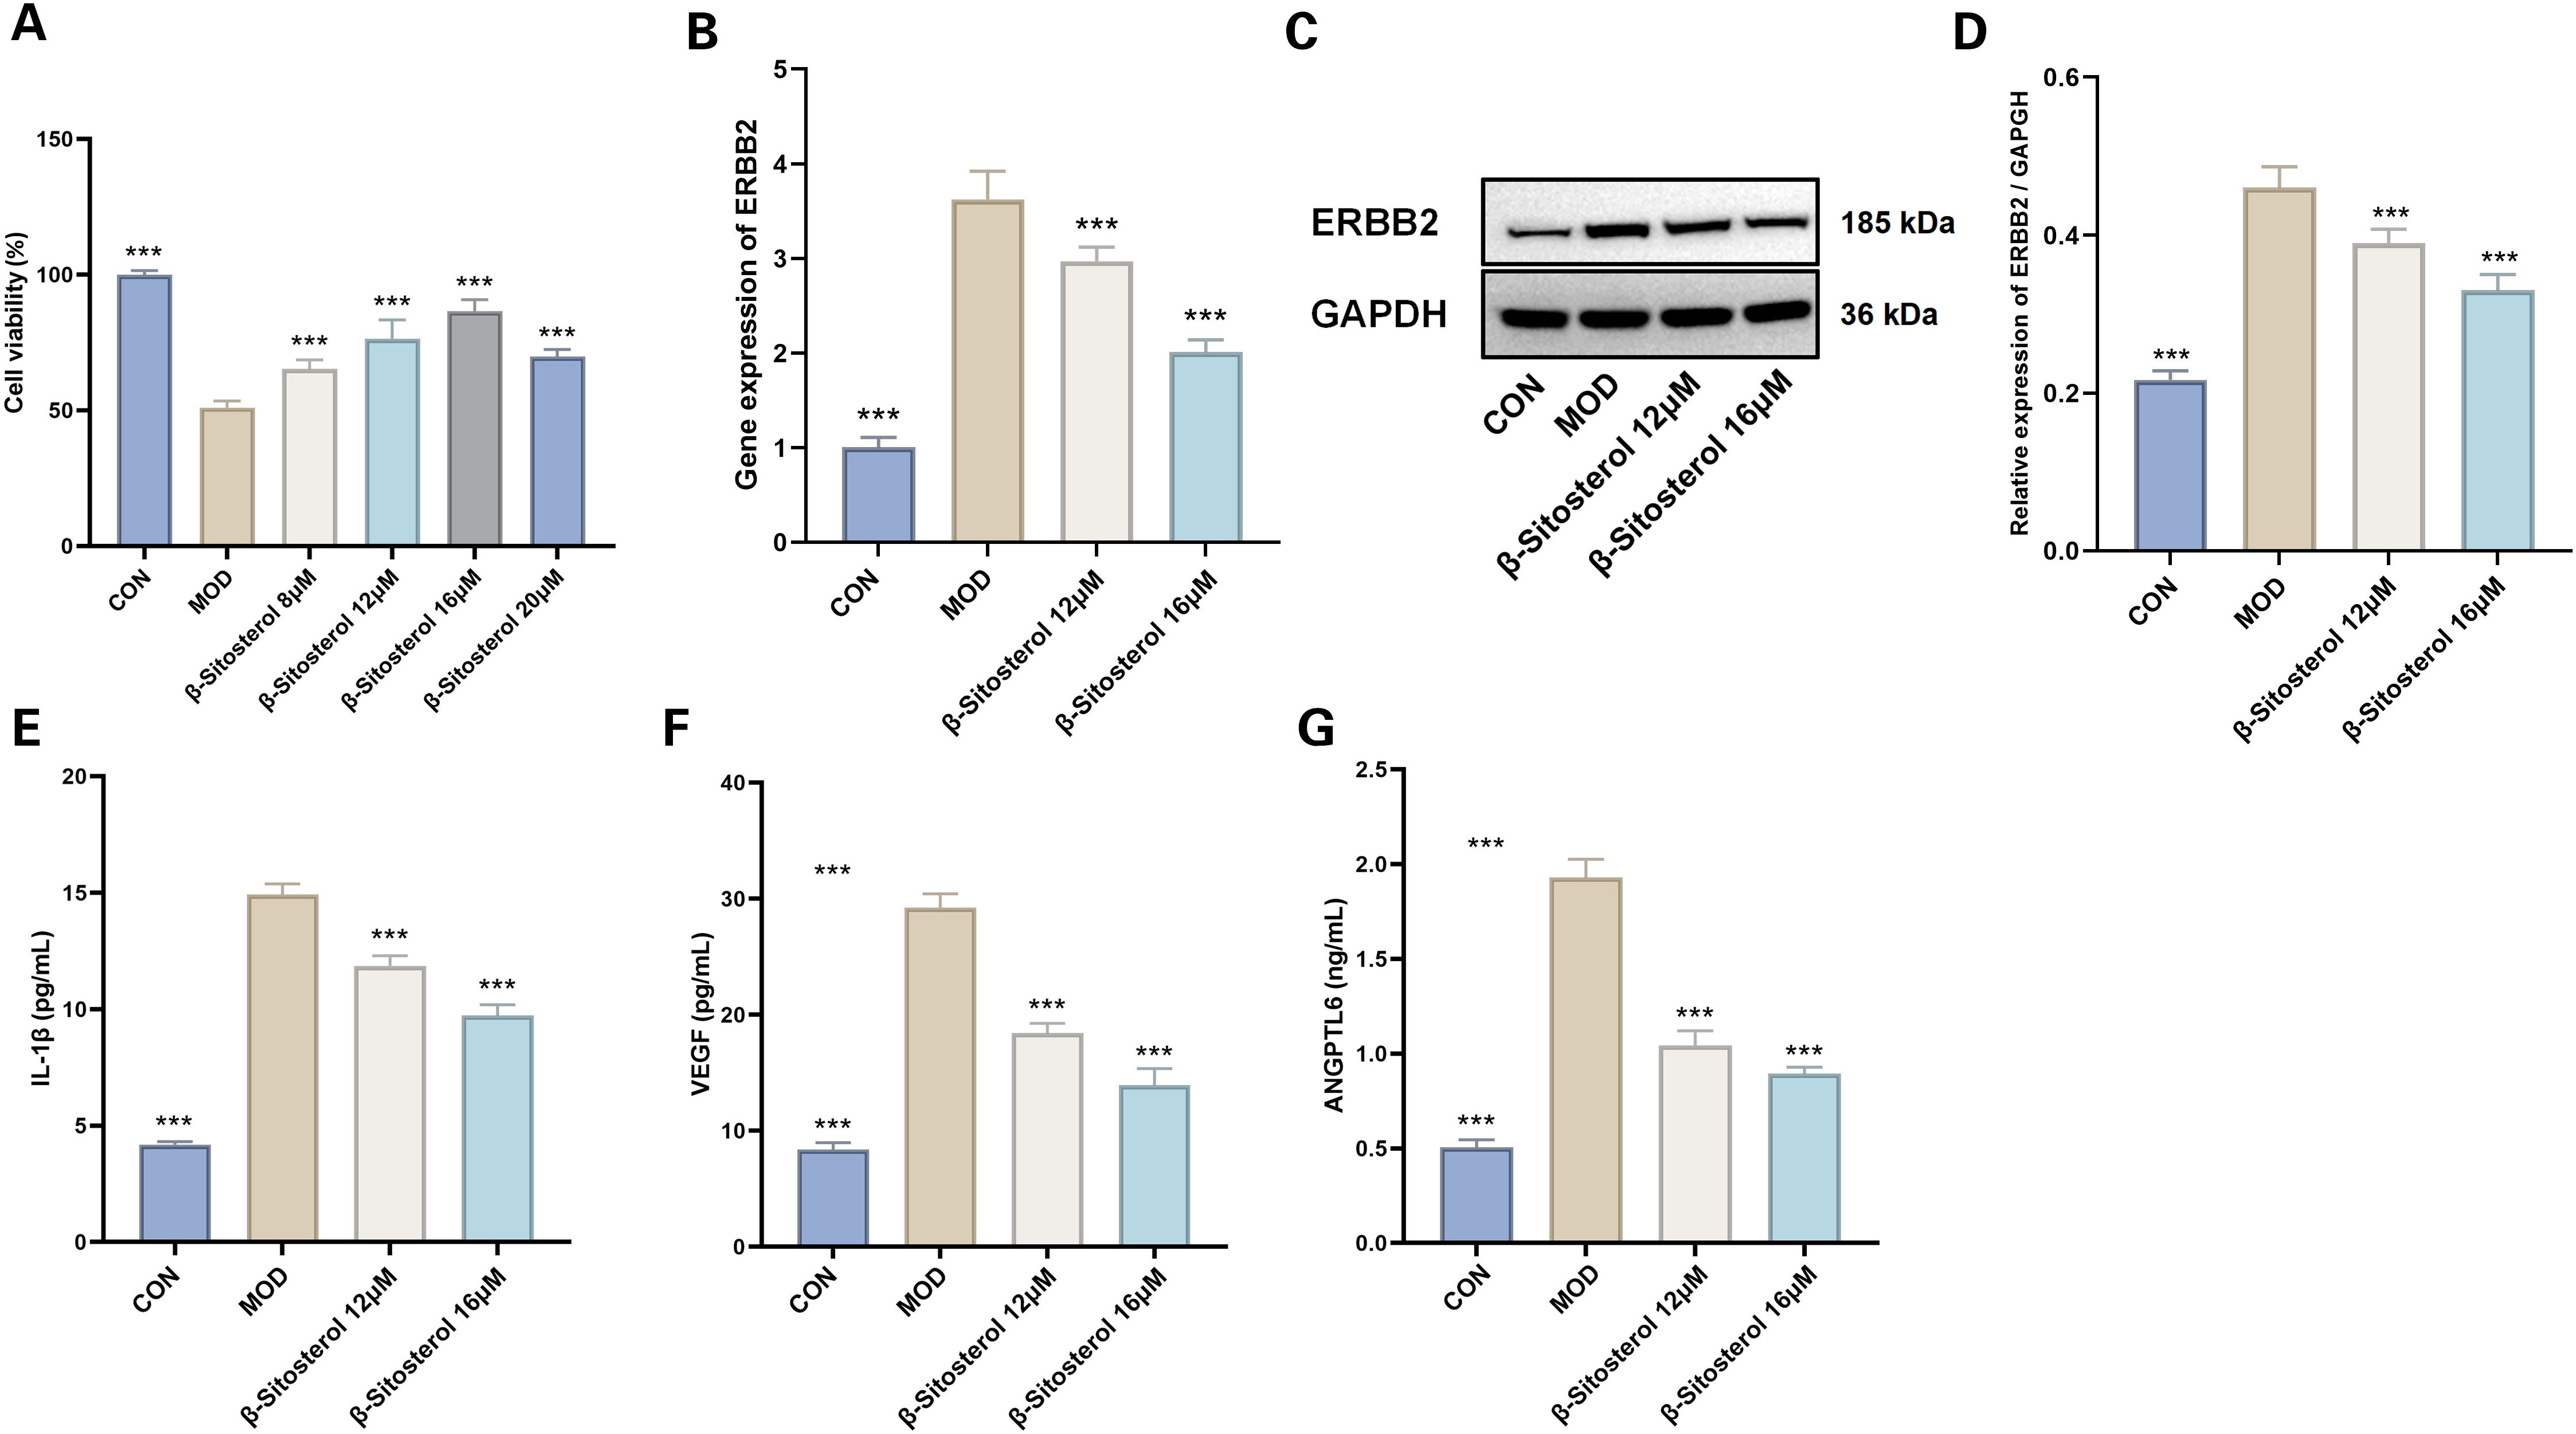
Figure 14. Effects of Beta-sitosterol on Hypoxia-Induced MMCs. (A) Cell viability (n=4). The data are presented as the mean ± SEM; ***P < 0.001 vs MOD group. (B) RTqPCR results for ERBB2 gene expression (n=6). The data are presented as the mean ± SEM; ***P < 0.001 vs MOD group. (C, D) Western blotting results of ERBB2 (n=3). The data are presented as the mean ± SEM; ***P < 0.001 vs MOD group. (E) IL-1β levels (n=6). (F) VEGF levels(n=6). (G) ANGPTL6 levels (n=6). Data presented as mean ± SEM. ***p < 0.001 vs MOD group. CON, Control group; MOD, Model group; β-sitosterol, Beta-sitosterol; VEGF, Vascular endothelial growth factor; ANGPTL6, aAngiopoietin-like protein 6; IL-1β, Interleukin-1 beta.
RT-qPCR analysis revealed a marked upregulation of ERBB2 mRNA expression in the model group compared to the control (P < 0.001). Treatment with beta-sitosterol at 12μM and 16μM significantly reversed this upregulation, resulting in a substantial downregulation of ERBB2 mRNA expression (P < 0.001 for all comparisons) (Figure 14B). Similarly, Western blot analysis showed a significant increase in ERBB2 protein expression in the model group relative to the control, while beta-sitosterol treatment at 12μM and 16μM significantly reduced ERBB2 protein levels (P < 0.001 for all comparisons) (Figures 14C, D).
ELISA analysis revealed that the hypoxia-induced model group showed a statistically significant elevation in IL-1β, VEGF, and ANGPTL6 levels compared to the control group (P < 0.001) (Figures 14E–G). Beta-sitosterol treatment at concentrations of 12μM and 16μM effectively mitigated these increases, with the suppressive effects being more pronounced at the higher concentration of 16μM (P < 0.001 for all comparisons) (Figures 14E–G).
3.16 In vitro experimental assessment of ERBB2 inhibition effects
Cell viability assays indicated a notable reduction in viability within the model group relative to the control group (P < 0.001). Conversely, siERBB2 treatment significantly enhanced cell viability compared to the model group (P < 0.001) (Figure 15A).
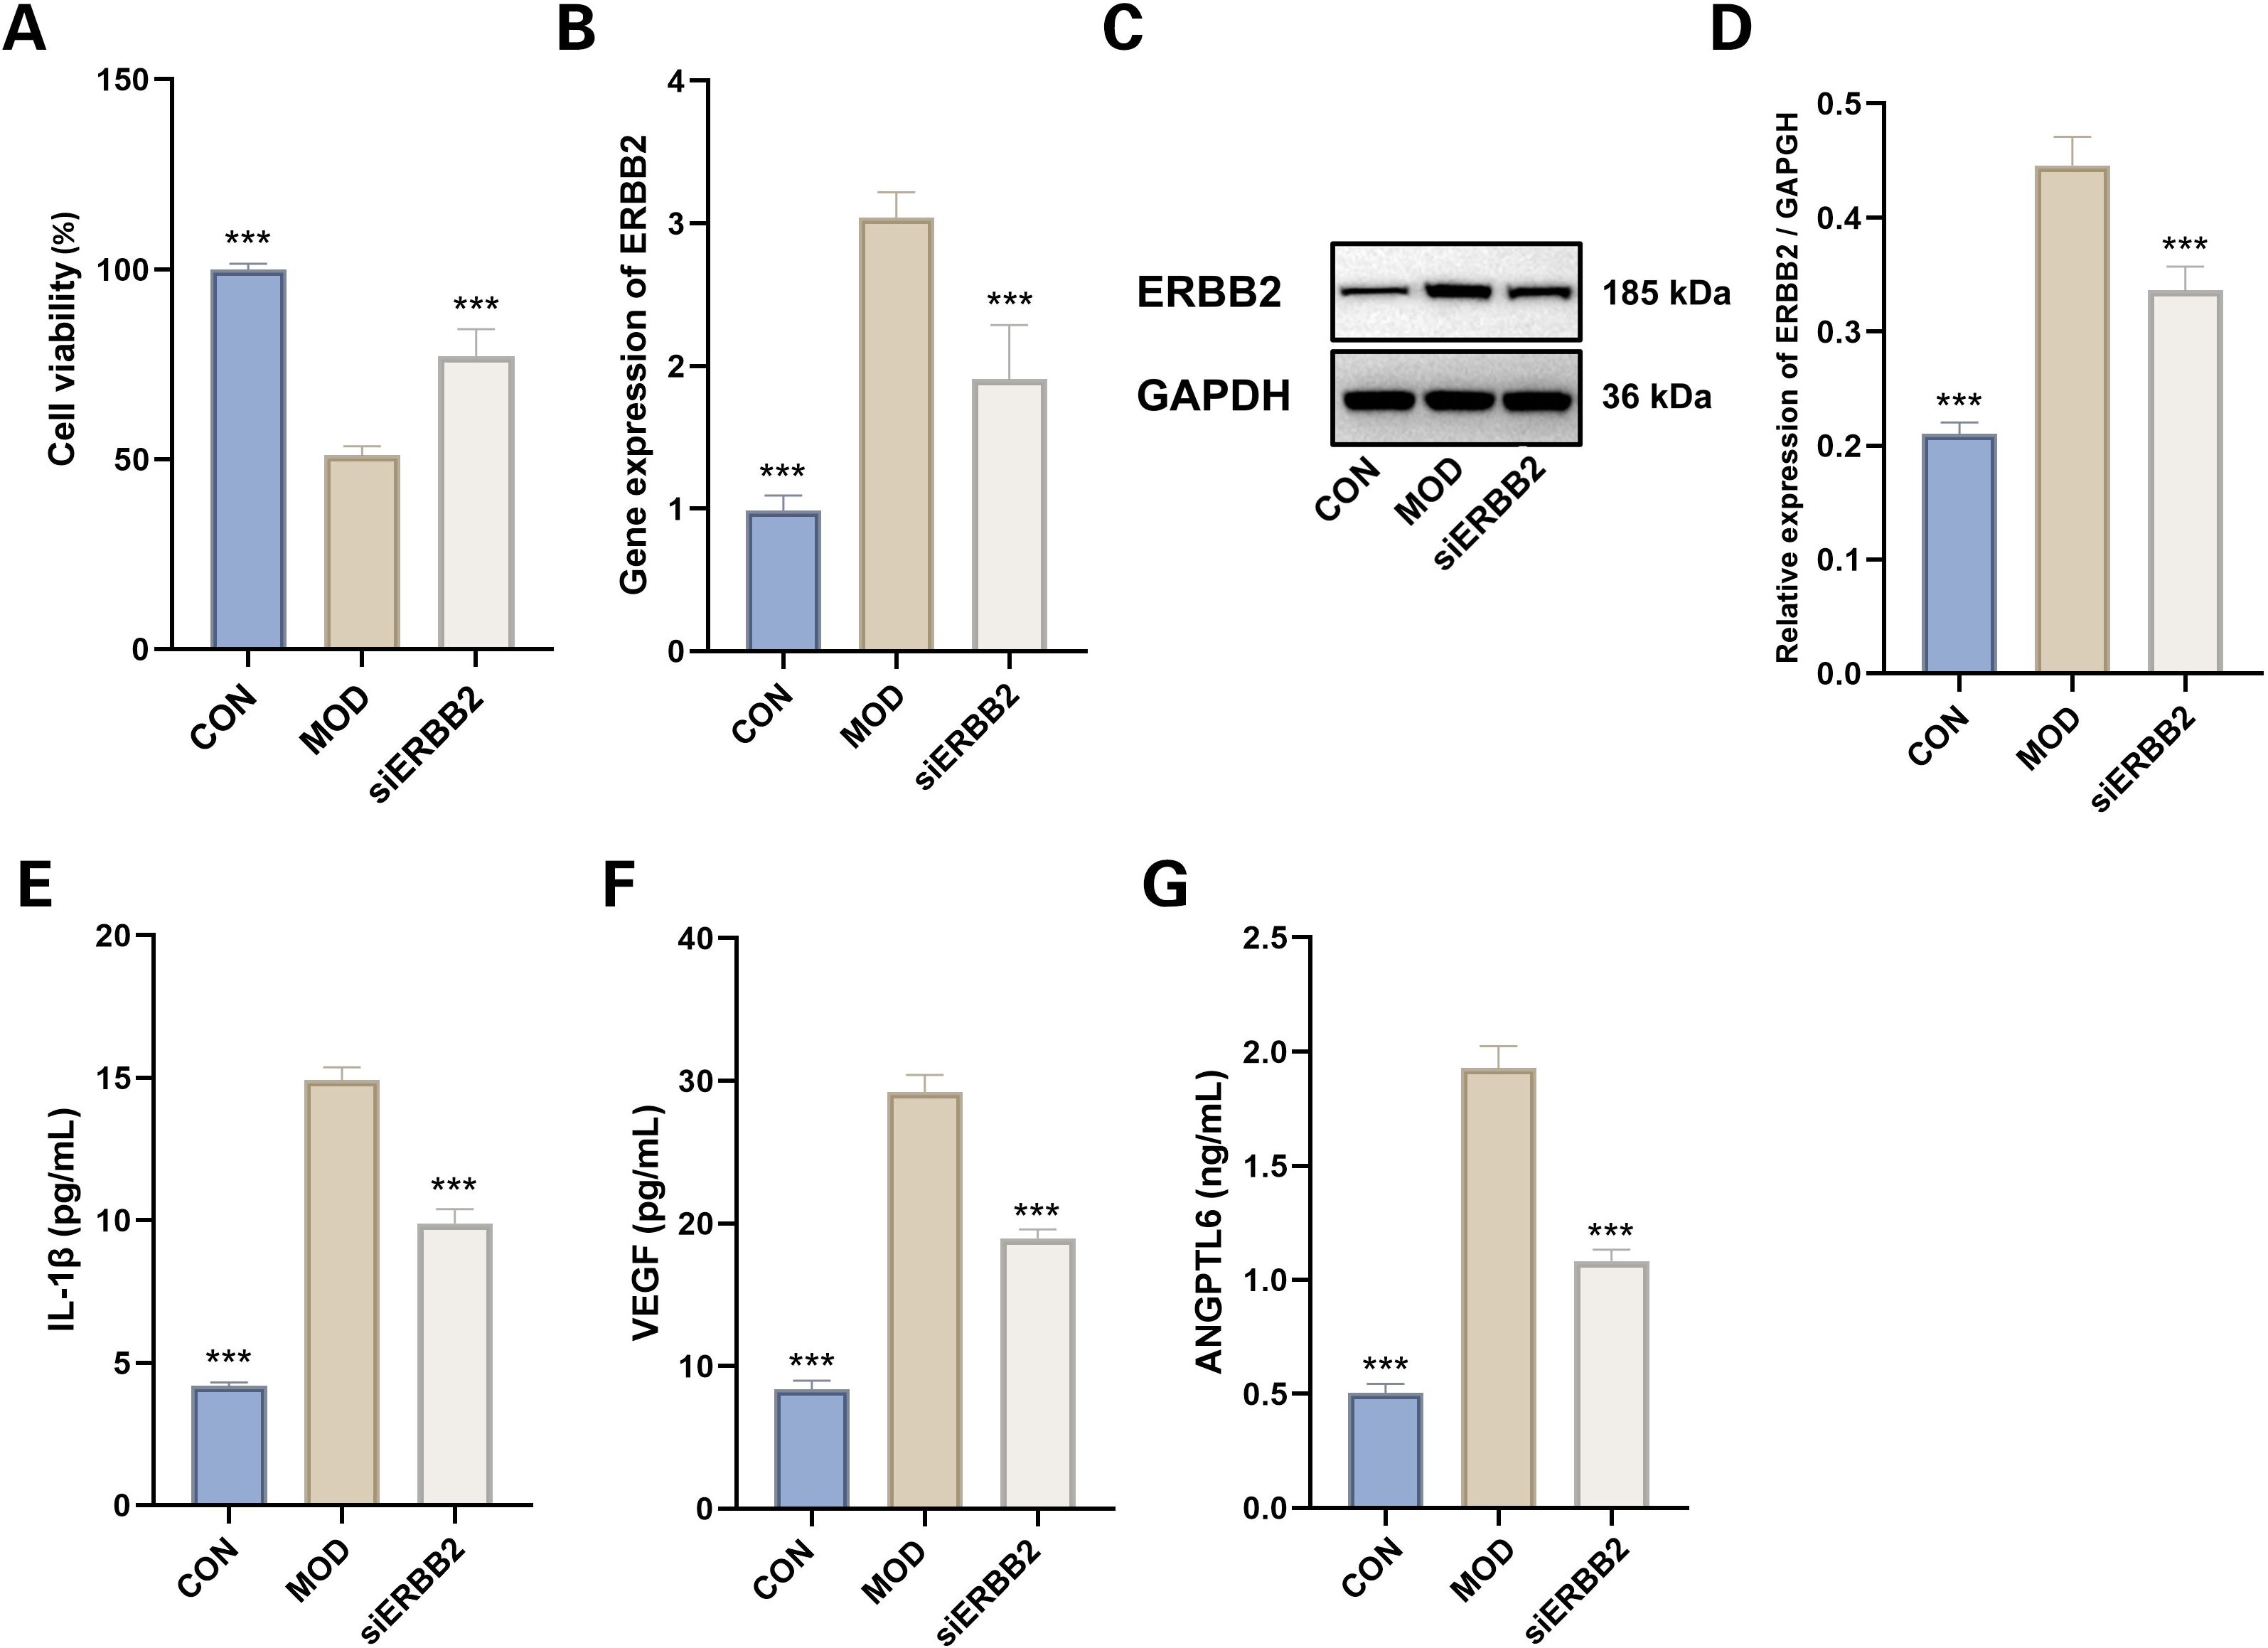
Figure 15. Evaluation of siERBB2 Effects on Hypoxia-Induced MMCs. (A) Cell viability (n=4). Data presented as mean ± SEM. ***p < 0.001 vs MOD group. (B) RTqPCR results of ERBB2 gene expression (n=6). Data presented as mean ± SEM. ***p < 0.001 vs MOD group. (C, D) Western blotting results of ERBB2 (n=3). Data presented as mean ± SEM. ***p < 0.001 vs MOD group. (E) IL-1β levels (n=6). (F) VEGF levels(n=6). (G) ANGPTL6 levels (n=6). Data presented as mean ± SEM. ***p < 0.001 vs MOD group. CON: Control group; MOD: Model group.
RT-qPCR analysis demonstrated that ERBB2 mRNA expression was substantially upregulated in the model group compared to the control (P < 0.001). This upregulation was effectively reversed in the siERBB2 treatment group, where ERBB2 mRNA expression was significantly downregulated compared to the model group (P < 0.001) (Figure 15B). Western blot analysis similarly confirmed that ERBB2 protein levels were markedly elevated in the model group versus the control group (P < 0.001). However, siERBB2 treatment significantly reduced ERBB2 protein expression compared to the model group (P < 0.001) (Figures 15C, D).
The ELISA results demonstrated a significant increase in IL-1β, VEGF, and ANGPTL6 levels in the hypoxia-induced model group compared to the control group (P < 0.001). Furthermore, ERBB2 inhibition notably reduced the elevated levels of IL-1β, VEGF, and ANGPTL6 in the model group, indicating its suppressive effect (P < 0.001 for both) (Figures 15E–G).
4 Discussion
This study identified quercetin, stigmasterol, beta-sitosterol, and kaempferol as the main active components of MDBD. Among the fourteen SDECGs involved in immune regulation, ERBB2 was confirmed as a key risk factor for DR through MR analysis. Beta-sitosterol showed strong binding affinity with multiple feature genes and effectively reduced ERBB2 expression in vitro, suppressing IL-1β, VEGF, and ANGPTL6 secretion. These findings highlight the therapeutic potential of MDBD in targeting DR pathogenesis. +Five feature genes (CCND1, ERBB2, INSR, TP53, SERPINE1).
4.1 MDBD for DR in TCM
DM, classified within the “Xiao Ke” category in TCM, is characterized by symptoms such as excessive thirst, hunger, urination, and weight loss. Its earliest documentation appears in the Yellow Emperor’s Inner Canon (36). In TCM, DR is referred to as “Xiao Ke Mu Bing,” an ocular complication of “Xiao Ke,” driven by internal heat resulting from yin deficiency. This imbalance disrupts qi and blood flow, leading to stasis and contributing to DR progression (37, 38). MDBD addresses these pathological mechanisms by enhancing qi, nourishing blood, and regulating meridians. Clinical studies have shown that combining MDBD with calcium hydroxybenzenesulfonate reduces inflammatory and angiogenic markers such as high-sensitivity C-reactive protein, tumor necrosis factor-alpha, VEGF, and endothelin-1, effectively ameliorating DR (39, 40).
4.2 Bioactive components of MDBD for DR
Through analysis of the “drug-component-target” network, the primary active compounds responsible for MDBD’s therapeutic effects on DR have been identified. Beta-sitosterol, a naturally occurring bioactive phytosterol can be found in Angelica sinensis and Panax notoginseng, is a key component of MDBD. Its chemical structure closely resembles cholesterol from mammalian cells (41), exhibiting antioxidant properties and anti-diabetic activity (42, 43). Beta-sitosterol exhibited high binding affinity with genes implicated in DR pathogenesis. In vitro experiments using a hypoxia-induced DR cell model demonstrated that beta-sitosterol significantly reduced IL-1β, VEGF, and ANGPTL6 secretion while improving cell viability, supporting its role in mitigating key pathological processes in DR. Moreover, a research on ADMET (absorption, distribution, metabolism, excretion, and toxicity) profiling on beta-sitosterol (44) verified that beta-sitosterol complies with Lipinski’s Rule of Five, showing high intestinal absorption and effective permeability across the blood-brain barrier. These pharmacokinetic attributes indicate that beta-sitosterol is well-suited for systemic distribution and may serve as a promising candidate for oral administration.
Additionally, compounds such as stigmasterol from Angelica sinensis and Panax notoginseng, quercetin from Astragalus membranaceus, Angelica sinensis and Panax notoginseng, along with jaranol, hederagenin, isorhamnetin, and bifendate from Astragalus membranaceus, collectively contribute to the therapeutic benefits of MDBD. Stigmasterol from displays various pharmacological properties, including anti-diabetic, anti-tumor, anti-inflammatory, and antioxidant effects, and has been shown to inhibit high glucose-induced proliferation and angiogenesis in retinal cells (45, 46). Quercetin reduces inflammation and enhances retinal layer thickness, offering therapeutic benefits in DR (47). Jaranol exhibits antitumor activity against breast and liver cancers and possesses anti-influenza properties (48, 49). Hederagenin demonstrates antitumor and anti-inflammatory effects, and has been shown to attenuate high glucose-induced fibrosis in renal cells (50–52). Isorhamnetin provides cardiovascular protection and boosts insulin secretion from pancreatic β-cells (53, 54). Bifendate is recognized for treating hepatitis, reducing hepatotoxicity, and showing antifibrotic effects (55, 56). Formononetin is reported to ameliorate type 2 diabetes progression and related complications by lowering hyperglycemia and insulin resistance in diabetic rats (57). Calycosin, a phytoestrogen, exhibits potent antioxidant and anti-tumor properties, mitigating kidney injury and cognitive impairments induced by diabetes in animal models (58–60). Kaempferol regulates angiogenesis, apoptosis, metastasis, and inflammation, enhancing diabetes management through modulation of endoplasmic reticulum stress (61, 62). Finally, Ginsenoside Rh2 shows anti-cancer properties against various cancers and improves immune function, effectively reducing elevated fasting blood glucose levels in type 1 diabetes mellitus rats (63, 64). These findings show MDBD’s multi-target therapeutic potential in DR, combining active compounds to address inflammation, oxidative stress, and angiogenesis, thereby providing a comprehensive approach to managing this complex condition.
4.3 Core genes targeted by MDBD for DR
The core targets were identified using the PPI network, followed by differential expression analysis to pinpoint SDECGs core genes, which were subsequently validated in human samples. Among the top five SDECGs, ERBB2 emerged as a significant target based on feature importance scores, demonstrating a strong association with increased risk for DR. Beta-sitosterol was found to bind to ERBB2, a receptor tyrosine kinase linked to elevated levels that significantly correlate with a higher incidence of diabetes mellitus. Individuals with high ERBB2 levels exhibit a markedly increased risk of diabetes compared to those with lower levels (65). To validate the relationship between ERBB2 and DR, in vitro experiments were conducted using a hypoxia-induced DR cell model. Results revealed significant upregulation of ERBB2 at both mRNA and protein levels. However, treatment with beta-sitosterol (12 μM and 16 μM) and ERBB2 inhibition effectively downregulated these elevated levels, affirming the interaction between ERBB2 and DR. These findings suggest that beta-sitosterol may target the MDBD-related gene ERBB2 to mitigate key pathological processes in DR. Additionally, significant alterations in inflammatory and angiogenic factors associated with DR were observed. The proinflammatory cytokine IL-1β, markedly elevated in the hypoxia-induced model group, was significantly reduced following beta-sitosterol treatment and ERBB2 inhibition, highlighting ERBB2’s role in modulating inflammation. Similarly, angiogenic factors VEGF and ANGPTL6, crucial for pathological neovascularization, were modulated. While their levels were initially increased in the hypoxia-induced model, further downregulation occurred under beta-sitosterol treatment and ERBB2 inhibition, indicating ERBB2’s involvement in angiogenesis regulation in DR.
Apart from ERBB2, the other top four SDECGs identified in our analysis include CCND1, SERPINE1, TP53, and INSR. Each of these genes plays a distinct role in the pathophysiology of DR. While ERBB2 is associated to DR risk and its strong binding affinity with beta-sitosterol, which supports the in vitro findings, the inclusion of these additional targets demonstrates their complementary roles in DR pathogenesis and reflects a more comprehensive approach to understanding the DR mechanisms. CCND1, a protein-coding gene activated by insulin, facilitates glycemic normalization via the CCND1-CDK4 pathway (66). SERPINE1 (also known as PAI-1), part of the serine protease inhibitor family, has shown elevated expression in vitreous biopsies and neovascular tissue from patients with PDR (67). TP53, a tumor suppressor protein, exhibited higher expression in blood samples from T2DM patients with DR compared to healthy individuals and T2DM patients without DR (68).
IINSR, an insulin receptor, was identified in a genome-wide association study as strongly correlated with DR in T2DM patients (69). Differential expression analysis in our study further revealed high INSR expression in the DR group, showing its significance in insulin signaling and metabolic regulation. The apparent contradiction in INSR expression across different studies warrants further investigation. Previous studies have indicated that impairments in INSR expression or functionality can lead to insulin resistance and DM (70, 71). To investigate this apparent contradiction, further analysis was conducted. Muscle tissues from DR patients and healthy individuals were analyzed, differing from detection materials in prior studies, such as skeletal muscle (71), peripheral blood lymphocytes (72), and various cell lines, including CEM T-lymphocytes and SW1990 pancreatic cells (73). Additionally, gene-by-environment interactions were found to play a critical role in complex gene regulation. Controlled environmental exposure in vitro across different cell types revealed diverse transcriptional responses (74). This variation in INSR expression across cell types may explain its complex regulation within different cellular environments.
By incorporating secondary targets alongside ERBB2, this study adopts a broader perspective on DR pathogenesis. These additional targets provide valuable context about the effect of MDBD, complementing the primary findings without detracting from the significance of ERBB2. Moving forward, a systematic and stepwise evaluation of these targets is essential. Such prioritization should integrate factors including network-level impact, confidence in target–ligand interactions, and functional assessments in retinal endothelial cells under high-glucose conditions.
4.4 Immune cell involvement in DR
The ssGSEA analysis revealed significant differences in immune cell expression between normal and DR groups. Positive correlations were observed between SDECGs and immune cells such as eosinophils, macrophages M0, and resting CD4 memory T cells, while negative correlations were found with naive B cells and plasma cells. Among these, macrophages M0 and resting dendritic cells exhibited statistically significant differences. Macrophages M0, precursors to polarized macrophages, can be induced by high glucose levels to polarize into the M1 subtype (75), playing a key role in DR progression (76). Similarly, dendritic cells, which enhance immune responses via antigen presentation, have been identified as a DR risk factor through HLA DR expression in genome-wide association studies (GWAS) (77). Further analysis revealed that macrophages M0 positively correlated with two SDECGs, TP53 and SERPINE1, while resting dendritic cells showed a positive correlation with INSR and a negative correlation with ERBB2. All these correlations demonstrated statistical significance between DR and normal samples. Resting mast cells, on the other hand, were negatively correlated with four SDECGs, TP53, SERPINE1, ERBB2, and CCND1, while positively correlated with INSR, all with statistical significance. However, no significant differences in resting mast cell levels were observed between DR and normal samples, which may be attributed to the distinct and complex regulatory mechanisms between resting mast cells and genetic samples, leading to varied outcomes.
The RF model was utilized to identify feature genes, including the top five for construction, to assess DR onset and the sensitivity and accuracy of MDBD treatment, which showed high sensitivity and accuracy. Enrichment analysis indicated that MDBD mechanisms in DR treatment are linked to immunity and inflammation, aligning with DR pathogenesis and development factors (78). In DR, elevated blood glucose levels lead to mitochondrial dysfunction, inflammation, and increased vascular endothelial growth factor secretion, causing vascular and neuronal apoptosis, and neovascularization (79). The activation of immune cells takes place earlier than neuronal dysfunction and intraretinal microvascular abnormalities (80). Immune cell activation contributes to neuronal dysfunction and intraretinal microvascular abnormalities (81, 82). Elevated inflammatory cytokines such as IFN-γ, TNF, and IL-2, secreted by lymphocytes, have been detected in DR patients (83) and in diabetic rat retinal tissue (84). Additionally, macrophages have been identified in the retinal tissue of Akimba mice, a recognized model of diabetic retinopathy, through single-cell RNA sequencing (85). These results reveal the complex relationship between immune cell activation, genetic factors, and inflammatory processes in the development of DR. The correlations identified between specific immune cells and SDECGs point to the significant role of immune regulation in disease progression. The ability of MDBD to influence these immune-related pathways suggests its therapeutic relevance for DR. Further investigation into the interaction between immune cells and genetic factors will be essential for advancing our understanding of DR and improving treatment strategies.
5 Conclusion
This study employed a multidimensional approach, integrating network pharmacology, molecular docking, GEO datasets, and Mendelian randomization analysis, to explore the mechanisms of MDBD in treating DR. Key genes, including INSR, CCND1, ERBB2, TP53, and SERPINE1, were identified as critical targets of MDBD, mediated by core components such as quercetin, stigmasterol, beta-sitosterol, and kaempferol. These interactions alleviate DR by modulating immunity- and inflammation-related pathways. Notably, the inhibition of ERBB2 and the application of beta-sitosterol demonstrated therapeutic efficacy, reducing ERBB2 protein and mRNA levels, as well as key inflammatory and angiogenic factors such as IL-1β, VEGF, and ANGPTL6. These findings provide valuable insights into the molecular mechanisms of MDBD and its potential for future clinical applications, though further experimental validation is required.
Data availability statement
The original contributions presented in the study are included in the article/Supplementary Material. Further inquiries can be directed to the corresponding authors.
Ethics statement
Ethical approval was not required for the study involving humans in accordance with the local legislation and institutional requirements. Written informed consent to participate in this study was not required from the participants or the participants’ legal guardians/next of kin in accordance with the national legislation and the institutional requirements. Ethical approval was not required for the studies on animals in accordance with the local legislation and institutional requirements because only commercially available established cell lines were used.
Author contributions
LYP: Methodology, Validation, Formal analysis, Investigation, Visualization, Writing – review & editing, Software, Writing – original draft, Data curation. LMH: Writing – review & editing, Software, Writing – original draft, Investigation, Data curation, Formal analysis, Visualization, Methodology, Validation. LKL: Methodology, Validation, Writing – review & editing, Investigation, Formal analysis, Visualization, Software, Writing – original draft, Data curation. XH: Formal analysis, Data curation, Validation, Software, Writing – review & editing. PLX: Visualization, Writing – review & editing, Formal analysis. QL: Formal analysis, Writing – review & editing. PCX: Writing – review & editing. SY: Conceptualization, Project administration, Supervision, Writing – review & editing.
Funding
The author(s) declare that no financial support was received for the research, and/or publication of this article.
Conflict of interest
The authors declare that the research was conducted in the absence of any commercial or financial relationships that could be construed as a potential conflict of interest.
Generative AI statement
The author(s) declare that no Generative AI was used in the creation of this manuscript.
Any alternative text (alt text) provided alongside figures in this article has been generated by Frontiers with the support of artificial intelligence and reasonable efforts have been made to ensure accuracy, including review by the authors wherever possible. If you identify any issues, please contact us.
Publisher’s note
All claims expressed in this article are solely those of the authors and do not necessarily represent those of their affiliated organizations, or those of the publisher, the editors and the reviewers. Any product that may be evaluated in this article, or claim that may be made by its manufacturer, is not guaranteed or endorsed by the publisher.
Supplementary material
The Supplementary Material for this article can be found online at: https://www.frontiersin.org/articles/10.3389/fendo.2025.1648831/full#supplementary-material
Abbreviations
Anti-VEGF, Anti-vascular endothelial growth factor; β-actin, Beta-actin; BP, Biological process; CC, Cellular component; DEGs, Differentially expressed genes; DL, Drug-likeness; DM, Diabetes mellitus; DR, Diabetic retinopathy; ERBB2, Erb-B2 receptor tyrosine kinase 2; GAPDH, Glyceraldehyde-3-phosphate dehydrogenase; GL, Generalized Linear; GO, Gene ontology; GSVA, Gene set variation analysis; GWAS, Genome-wide association study; IEU, Integrative epidemiology unit; IVs, Instrumental variables; IVW, Inverse variance weighted; KEGG, Kyoto encyclopedia of genes and genomes; MDBD, Modified Danggui Buxue Decoction; MF, Molecular function; MR, Mendelian randomization; NPDR, Non-proliferative DR; OB, Oral bioavailability; PCA, Principal component analysis; PDB, Protein data bank; PDR, Proliferative DR; RF, Random Forest; ROC, Receiver operating characteristic; SDECGs, Significantly differentially expressed core genes; ssGSEA, Single-sample gene set enrichment analysis; SVM, Support Vector Machine; T1DM, Type 1 diabetes mellitus; T2DM, Type 2 diabetes mellitus; TCM, Traditional Chinese medicine; TCMSP, Traditional Chinese Medicine Systems Pharmacology; XGB, Extreme gradient boosting.
References
1. Yang Z, Tan TE, Shao Y, Wong TY, and Li X. Classification of diabetic retinopathy: Past, present and future. Front Endocrinol. (2022) 13:1079217. doi: 10.3389/fendo.2022.1079217
2. Dorweiler TF, Singh A, Ganju A, Lydic TA, Glazer LC, Kolesnick RN, et al. Diabetic retinopathy is a ceramidopathy reversible by anti-ceramide immunotherapy. Cell Metab. (2024) 36:1521–33. doi: 10.1016/j.cmet.2024.04.013
3. Wang W and Lo A. Diabetic retinopathy: Pathophysiology and treatments. Int J Mol Sci. (2018) 19:1816. doi: 10.3390/ijms19061816
4. Yau JW, Rogers SL, Kawasaki R, Lamoureux EL, Kowalski JW, Bek T, et al. Global prevalence and major risk factors of diabetic retinopathy. Diabetes Care. (2012) 35:556–64. doi: 10.2337/dc11-1909
5. Ruta LM, Magliano DJ, LeMesurier R, Taylor HR, Zimmet PZ, and Shaw JE. Prevalence of diabetic retinopathy in type 2 diabetes in developing and developed countries. Diabetes Med. (2013) 30:387–98. doi: 10.1111/dme.12119
6. Holman N, Young B, and Gadsby R. Current prevalence of type 1 and type 2 diabetes in adults and children in the UK. Diabetes Med. (2015) 32:1119–20. doi: 10.1111/dme.12791
7. Ren C, Liu W, Li J, Cao Y, Xu J, and Lu P. Physical activity and risk of diabetic retinopathy: A systematic review and meta-analysis. Acta Diabetol. (2019) 56:823–37. doi: 10.1007/s00592-019-01319-4
8. Centers for Disease Control and Prevention. National Diabetes Statistics Report website (2024). Available online at: https://www.cdc.gov/diabetes/php/data-research/index.html (Accessed May 11, 2024).
9. Romero-Aroca P, Navarro-Gil R, Valls-Mateu A, Sagarra-Alamo R, Moreno-Ribas A, and Soler N. Differences in incidence of diabetic retinopathy between type 1 and type 2 diabetes mellitus: A nine-year follow-up study. Br J Ophthalmol. (2017) 101:1346–51. doi: 10.1136/bjophthalmol-2016-310063
10. Teo ZL, Tham YC, Yu M, Chee ML, Rim TH, Cheung N, et al. Global prevalence of diabetic retinopathy and projection of burden through 2045. Ophthalmology. (2021) 128:1580–91. doi: 10.1016/j.ophtha.2021.04.027
11. Kollias AN and Ulbig MW. Diabetic retinopathy. Dtsch Arztebl Int. (2010) 107:75–83. doi: 10.3238/arztebl.2010.0075
12. Stitt AW, Curtis TM, Chen M, Medina RJ, McKay GJ, Jenkins A, et al. The progress in understanding and treatment of diabetic retinopathy. Prog Retin Eye Res. (2015) 51:156–86. doi: 10.1016/j.preteyeres.2015.08.001
13. Ma P, Pan X, Liu R, Qu Y, Xie L, Xie J, et al. Ocular adverse events associated with anti-VEGF therapy: A pharmacovigilance study of the FDA adverse event reporting system (FAERS). Front Pharmacol. (2022) 13:1017889. doi: 10.3389/fphar.2022.1017889
14. Liu C, Wang X, and Cao X. Ophthalmic corticosteroids-related adverse events: the FDA adverse event reporting system (FAERS) database pharmacovigilance study. Front Pharmacol. (2024) 15:1502047. doi: 10.3389/fphar.2024.1502047
15. Li HD, Li MX, Zhang WH, Zhang SW, and Gong YB. Effectiveness and safety of traditional Chinese medicine for diabetic retinopathy: A systematic review and network meta-analysis of randomized clinical trials. World J Diabetes. (2023) 14:1422–49. doi: 10.4239/wjd.v14.i9.1422
16. Yu RC. Effects of the Danggui Buxue decoction on nonproliferative diabetic retinopathy and ICAM-1 and ET-1. Clin J Chin Med. (2020) 12:62. doi: 10.3969/j.issn.1674-7860.2020.17.021
17. Fu J, Wang Z, Huang L, Zheng S, Wang D, Chen S, et al. Review of the botanical characteristics, phytochemistry, and pharmacology of Astragalus membranaceus (Huangqi). Phytother Res. (2014) 28:1275–83. doi: 10.1002/ptr.5188
18. Li CX, Liu Y, Zhang YZ, Li JC, and Lai J. Astragalus polysaccharide: a review of its immunomodulatory effect. Arch Pharm Res. (2022) 45:367–89. doi: 10.1007/s12272-022-01393-3
19. Chen G, Jiang N, Zheng J, Hu H, Yang H, Lin A, et al. Structural characterization and anti-inflammatory activity of polysaccharides from Astragalus membranaceus. Int J Biol Macromol. (2023) 241:124386. doi: 10.1016/j.ijbiomac.2023.124386
20. Tang Z and Tian X. Astragalus membranaceus: A traditional chinese medicine with multifaceted impacts on breast cancer treatment. Biomolecules. (2024) 14:1339. doi: 10.3390/biom14101339
21. Wei WL, Zeng R, Gu CM, Qu Y, and Huang LF. Angelica sinensis in China-A review of botanical profile, ethnopharmacology, phytochemistry and chemical analysis. J Ethnopharmacol. (2016) 190:116–41. doi: 10.1016/j.jep.2016.05.023
22. Chen L, Li L, Wang F, Hu S, Ding T, Wang Y, et al. Targeted metabolomics study on the effect of vinegar processing on the chemical changes and antioxidant activity of angelica sinensis. Antioxidants (Basel). (2023) 12:2053. doi: 10.3390/antiox12122053
23. Liu W, Xiao K, Ren L, Sui Y, Chen J, Zhang T, et al. Leukemia cells apoptosis by a newly discovered heterogeneous polysaccharide from Angelica sinensis (Oliv.) Diels. Carbohydr Polym. (2020) 241:116279. doi: 10.1016/j.carbpol.2020.116279
24. Zou YF, Li CY, Fu YP, Jiang QX, Peng X, Li LX, et al. The comparison of preliminary structure and intestinal anti-inflammatory and anti-oxidative activities of polysaccharides from different root parts of Angelica sinensis (Oliv. ) Diels J Ethnopharmacol. (2022) 295:115446. doi: 10.1016/j.jep.2022.115446
25. Wang T, Guo R, Zhou G, Zhou X, Kou Z, Sui F, et al. Traditional uses, botany, phytochemistry, pharmacology and toxicology of Panax notoginseng (Burk. ) F.H Chen: A review J Ethnopharmacol. (2016) 188:234–58. doi: 10.1016/j.jep.2016.05.005
26. Gao B, Huang L, Liu H, Wu H, Zhang E, Yang L, et al. Platelet P2Y12 receptors are involved in the haemostatic effect of notoginsenoside Ft1, a saponin isolated from Panax notoginseng. Br J Pharmacol. (2014) 171:214–23. doi: 10.1111/bph.12435
27. Luo H, Vong CT, Tan D, Zhang J, Yu H, Yang L, et al. Panax notoginseng Saponins Modulate the Inflammatory Response and Improve IBD-Like Symptoms via TLR/NF-κB and MAPK Signaling Pathways. Am J Chin Med. (2021) 49:925–39. doi: 10.1142/S0192415X21500440
28. Kim B, Kim EY, Lee EJ, Han JH, Kwak CH, Jung YS, et al. Panax notoginseng Inhibits Tumor Growth through Activating Macrophage to M1 Polarization. Am J Chin Med. (2018) 46:1369–85. doi: 10.1142/S0192415X18500726
29. Zhang X, Wang J, Xiang S, Zhao L, Lv M, Duan Y, et al. Astragaloside I from astragalus attenuates diabetic kidney disease by regulating HDAC3/klotho/TGF-β1 loop. Am J Chin Med. (2024) 52:1795–817. doi: 10.1142/S0192415X24500708
30. Tang X, Yang L, Miao Y, Ha W, Li Z, and Mi D. Angelica polysaccharides relieve blood glucose levels in diabetic KKAy mice possibly by modulating gut microbiota: an integrated gut microbiota and metabolism analysis. BMC Microbiol. (2023) 23:281. doi: 10.1186/s12866-023-03029-y
31. He JY, Hong Q, Chen BX, Cui SY, Liu R, Cai GY, et al. Ginsenoside Rb1 alleviates diabetic kidney podocyte injury by inhibiting aldose reductase activity. Acta Pharmacol Sin. (2022) 43:342–53. doi: 10.1038/s41401-021-00788-0
32. Zhang Y. Clinical studies of Dangguibuxue decoction treatment on non-proliferative diabetic retinopathy. Fuzhou: Fujian University of Traditional Chinese Medicine (2016). Available online at: https://kns.cnki.net/KCMS/detail/detail.aspx?dbname=CMFD201601&filename=1015307748.nh.
33. Liu Y. Clinical studies of proportion optimization of Dangguibuxue decoction treatment on non-proliferative diabetic retinopathy. Fuzhou: Fujian University of Traditional Chinese Medicine (2016). Available online at: https://kns.cnki.net/KCMS/detail/detail.aspx?dbname=CMFD201701&filename=1016224341.nh.
34. Wu Y. Clinical survey of the Xi-shiyin in treatment of non-proliferative diabetic retinopathy. Fuzhou: Fujian University of Traditional Chinese Medicine (2013). Available online at: https://kns.cnki.net/KCMS/detail/detail.aspx?dbname=CMFD201302&filename=1013186202.nh.
35. Ge X, Huang C, Chen W, Yang C, Huang W, Li J, et al. Effect of Danggui Buxue decoction on hypoxia-induced injury of retinal Müller cells in vitro. Eur J Histochem. (2024) 68:4140. doi: 10.4081/ejh.2024.4140
36. Han FB. Discussion on the staging differentiation and efficacy evaluation method of traditional Chinese medicine for Xiao Ke. Diabetes New World. (2018) 21:47–8. doi: 10.16658/j.cnki.1672-4062.2018.02.047
37. Bian Y and Tian F. The regularity of TCM syndromes in non-proliferative diabetic retinopathy and their correlation with cytokines. Clin J Chin Med. (2023) 16):10–4. doi: 10.3969/j.issn.1674-7860.2023.16.002
38. Duan JG, Jin M, Jie CH, and Ye HJ. TCM diagnosis and treatment standards for diabetic retinopathy. World J Integr Tradit West Med. (2011) 07):632–7. doi: 10.13935/j.cnki.sjzx.2011.07.018
39. Deng C, Li J, and Tang XZ. The effect of modified Danggui Buxue Decoction on diabetic retinopathy and the effects of serum ICAM-1 and ET-1 levels. Inf Tradit Chin Med. (2018) 35:90–3. doi: 10.19656/j.cnki.1002-2406.180026
40. Sun XH, Qian KW, Zhou Y, and Gu HY. The effect of modified Danggui Buxue Decoction on diabetic retinopathy and the effects of serum ICAM-1 and ET-1 levels. Mod J Integr Tradit Chin West Med. (2019) 28:3152–3155, 3170. doi: 10.3969/j.issn.1008-8849.2019.28.019
41. Babu S and Jayaraman S. An update on β-sitosterol: A potential herbal nutraceutical for diabetic management. BioMed Pharmacother. (2020) 131:110702. doi: 10.1016/j.biopha.2020.110702
42. Gupta R, Sharma AK, Dobhal MP, Sharma MC, and Gupta RS. Antidiabetic and antioxidant potential of β-sitosterol in streptozotocin-induced experimental hyperglycemia. J Diabetes. (2010) 3:29–37. doi: 10.1111/j.1753-0407.2010.00107.x
43. Ivorra MD, D'Ocon MP, Paya M, and Villar A. Antihyperglycemic and insulin-releasing effects of beta-sitosterol 3-beta-D-glucoside and its aglycone, beta-sitosterol. Arch Int Pharmacodyn Ther. (1988) 296:224–31.
44. Saadh MJ, Ahmed HH, Kareem RA, Chandra M, Verma L, Prasad GVS, et al. The drug discovery candidate for targeting PARP1 with Onosma dichroantha compounds in triple-negative breast cancer: A virtual screening and molecular dynamic simulation. Comput Biol Chem. (2025) 118:108471. doi: 10.1016/j.compbiolchem.2025.108471
45. Zhang X, Wang J, Zhu L, Wang X, Meng F, Xia L, et al. Advances in Stigmasterol on its anti-tumor effect and mechanism of action. Front Oncol. (2022) 12:1101289. doi: 10.3389/fonc.2022.1101289
46. Sun J and Zhao Y. Stigmasterol inhibits high glucose induced proliferation and angiogenesis of retinal endothelial cells by regulating Mitogen-Activated Protein kinase signaling pathway. Curr Top Nutraceutical Res. (2022) 20:617–22. doi: 10.37290/ctnr2641-452x.20:617-622
47. Chen XL, Chai GR, Liu S, and Yang HW. Quercetin protects against diabetic retinopathy in rats by inducing heme oxygenase-1 expression. Neural Regener Res. (2020) 16:1344. doi: 10.4103/1673-5374.301027
48. Chen JY, Lan C, Liu Z, and Zhou G. Jaranol loaded in ferroferric oxide nanoparticles inhibits the activities of liver cancer cells through Mitogen-Activated Protein Kinase/Extracellular Signal-Regulated Kinase signaling pathway. J BioMed Nanotechnol. (2024) 20:1434–40. doi: 10.1166/jbn.2024.3908
49. Liu HX, Lian L, Hou LL, Liu CX, Ren JH, Qiao YB, et al. Herb pair of Huangqi-Danggui exerts anti-tumor immunity to breast cancer by upregulating PIK3R1. Anim Model Exp Med. (2024) 7:234–58. doi: 10.1002/ame2.12434
50. Rodríguez-Hernández D, Demuner AJ, Barbosa LCA, Heller L, and Csuk R. Novel hederagenin-triazolyl derivatives as potential anti-cancer agents. Eur J Med Chem. (2016) 115:257–67. doi: 10.1016/j.ejmech.2016.03.018
51. Lee CW, Park SM, Zhao R, Lee C, Chun W, Son Y, et al. Hederagenin, a major component of Clematis mandshurica Ruprecht root, attenuates inflammatory responses in RAW 264.7 cells and in mice. Int Immunopharmacol. (2015) 29:528–37. doi: 10.1016/j.intimp.2015.10.002
52. Yang G, Yang W, Jiang H, Yi Q, and Ma W. Hederagenin inhibits high glucose-induced fibrosis in human renal cells by suppression of NLRP3 inflammasome activation through reducing cathepsin B expression. Chem Biol Drug Des. (2023) 102:1409–20. doi: 10.1111/cbdd.14332
53. Gong G, Guan YY, Zhang ZL, Rahman K, Wang SJ, Zhou S, et al. Isorhamnetin: A review of pharmacological effects. BioMed Pharmacother. (2020) 128:110301. doi: 10.1016/j.biopha.2020.110301
54. Lee D, Park J, Lee S, and Kang K. In vitro studies to assess the α-glucosidase inhibitory activity and insulin secretion effect of isorhamnetin 3-O-glucoside and quercetin 3-O-glucoside isolated from Salicornia herbacea. Processes. (2021) 9:483. doi: 10.3390/pr9030483
55. Abdel-Hameid NAH. Protective role of dimethyl diphenyl bicarboxylate (DDB) against erythromycin-induced hepatotoxicity in male rats. Toxicol In Vitro. (2006) 21:618–25. doi: 10.1016/j.tiv.2006.12.006
56. Abdel-Salam OME, Sleem AA, and Morsy FA. Effects of biphenyldimethyl-dicarboxylate administration alone or combined with silymarin in the CCL4 model of liver fibrosis in rats. ScientificWorldJournal. (2007) 7:1242–55. doi: 10.1100/tsw.2007.193
57. Oza MJ and Kulkarni YA. Formononetin treatment in type 2 diabetic rats reduces insulin resistance and hyperglycemia. Front Pharmacol. (2018) 9:739. doi: 10.3389/fphar.2018.00739
58. Pan L, Zhang XF, Wei WS, Zhang J, and Li ZZ. The cardiovascular protective effect and mechanism of calycosin and its derivatives. Chin J Nat Med. (2020) 18:907–15. doi: 10.1016/s1875-5364(20)60034-6
59. Zhang YY, Tan RZ, Zhang XQ, Yu Y, and Yu C. Calycosin ameliorates diabetes-induced renal inflammation via the NF-κB pathway in vitro and in vivo. Med Sci Monit. (2019) 25:1671–8. doi: 10.12659/msm.915242
60. Wang X and Zhao L. Calycosin ameliorates diabetes-induced cognitive impairments in rats by reducing oxidative stress via the PI3K/Akt/GSK-3β signaling pathway. Biochem Biophys Res Commun. (2016) 473:428–34. doi: 10.1016/j.bbrc.2016.03.024
61. Chen AY and Chen YC. A review of the dietary flavonoid, kaempferol on human health and cancer chemoprevention. Food Chem. (2012) 138:2099–107. doi: 10.1016/j.foodchem.2012.11.139
62. Sajadimajd S, Deravi N, Forouhar K, Rahimi R, Kheirandish A, and Bahramsoltani R. Endoplasmic reticulum as a therapeutic target in type 2 diabetes: Role of phytochemicals. Int Immunopharmacol. (2022) 114:109508. doi: 10.1016/j.intimp.2022.109508
63. Guan W and Qi W. Ginsenoside Rh2: A shining and potential natural product in the treatment of human nonmalignant and Malignant diseases in the near future. Phytomedicine. (2023) 118:154938. doi: 10.1016/j.phymed.2023.154938
64. Lo SH, Hsu CT, Niu HS, Niu CS, Cheng JT, and Chen ZC. Ginsenoside Rh2 improves cardiac fibrosis via PPARδ–STAT3 signaling in type 1-like diabetic rats. Int J Mol Sci. (2017) 18:1364. doi: 10.3390/ijms18071364
65. Muhammad IF, Borné Y, Bao X, Melander O, Orho-Melander M, Nilsson PM, et al. Circulating HER2/ERBB2 levels are associated with increased incidence of diabetes: A population-based cohort study. Diabetes Care. (2019) 42:1582–8. doi: 10.2337/dc18-2556
66. Lee Y, Dominy JE, Choi YJ, Jurczak M, Tolliday N, Camporez JP, et al. Cyclin D1–Cdk4 controls glucose metabolism independently of cell cycle progression. Nature. (2014) 510:547–51. doi: 10.1038/nature13267
67. Qin Y, Zhang J, Babapoor-Farrokhran S, Applewhite B, Deshpande M, and Megarity H. PAI-1 is a vascular cell-specific HIF-2-dependent angiogenic factor that promotes retinal neovascularization in diabetic patients. Sci Adv. (2022) 8:eabm1896. doi: 10.1126/sciadv.abm1896
68. Sliwinska A, Kasznicki J, Kosmalski M, Mikolajczyk M, Rogalska A, Przybylowska K, et al. Tumour protein 53 is linked with type 2 diabetes mellitus. Indian J Med Res. (2017) 146:237–43. doi: 10.4103/ijmr.IJMR_1401_15
69. Cheung CY, Hui EY, Lee CH, Kwok KH, Gangwani RA, Li KK, et al. Impact of genetic loci identified in genome-wide association studies on diabetic retinopathy in Chinese patients with type 2 diabetes. Invest Ophthalmol Vis Sci. (2016) 57:5518. doi: 10.1167/iovs.16-20094
70. Petersen MC and Shulman GI. Mechanisms of insulin action and insulin resistance. Physiol Rev. (2018) 98:2133–223. doi: 10.1152/physrev.00063.2017
71. Jang HB, Go MJ, Park SI, Lee HJ, and Cho SB. Chronic heavy alcohol consumption influences the association between genetic variants of GCK or INSR and the development of diabetes in men: A 12-year follow-up study. Sci Rep. (2019) 9:20029. doi: 10.1038/s41598-019-56011-y
72. Bellaver P, Schaeffer AF, Dullius DP, Crispim D, Leitão CB, and Rech TH. Association between diabetes and stress-induced hyperglycemia with skeletal muscle gene expression of INSR in critically ill patients: A prospective cohort study. Diabetes Metab. (2023) 49:101485. doi: 10.1016/j.diabet.2023.101485
73. Zhang H, Wei J, Xue R, Wu JD, Zhao W, Wang ZZ, et al. Berberine lowers blood glucose in type 2 diabetes mellitus patients through increasing insulin receptor expression. Metabolism. (2009) 59:285–92. doi: 10.1016/j.metabol.2009.07.029
74. Moyerbrailean GA, Richards AL, Kurtz D, Kalita CA, Davis GO, Harvey CT, et al. High-throughput allele-specific expression across 250 environmental conditions. Genome Res. (2016) 26:1627–38. doi: 10.1101/gr.209759.116
75. Soldano S, Pizzorni C, Paolino S, Trombetta AC, Montagna P, Brizzolara R, et al. Alternatively activated (M2) macrophage phenotype is inducible by endothelin-1 in cultured human macrophages. PloS One. (2016) 11:e0166433. doi: 10.1371/journal.pone.0166433
76. Wang J, Han Y, Huang F, Tang L, Mu J, and Liang Y. Diabetic macrophage small extracellular vesicles-associated miR-503/IGF1R axis regulates endothelial cell function and affects wound healing. Front Immunol. (2023) 14:1104890. doi: 10.3389/fimmu.2023.1104890
77. Ye Y, Dai L, Gu H, Yang L, Xu Z, and Li Z. The causal relationship between immune cells and diabetic retinopathy: A Mendelian randomization study. Front Immunol. (2024) 15:1381002. doi: 10.3389/fimmu.2024.1381002
78. Li H, Liu X, Zhong H, Fang J, Li X, Shi R, et al. Research progress on the pathogenesis of diabetic retinopathy. BMC Ophthalmol. (2023) 23:372. doi: 10.1186/s12886-023-03118-6
79. Yue T, Shi Y, Luo S, Weng J, Wu Y, and Zheng X. The role of inflammation in immune system of diabetic retinopathy: Molecular mechanisms, pathogenetic role and therapeutic implications. Front Immunol. (2022) 13:1055087. doi: 10.3389/fimmu.2022.1055087
80. Xue M, Mao X, Chen M, Yin W, Yuan S, and Liu Q. The role of adaptive immunity in diabetic retinopathy. J Clin Med. (2022) 11:6499. doi: 10.3390/jcm11216499
81. Liu Y, Yang Z, Lai P, Huang Z, Sun X, Zhou T, et al. Bcl-6-directed follicular helper T cells promote vascular inflammatory injury in diabetic retinopathy. Theranostics. (2020) 10:4250–64. doi: 10.7150/thno.43731
82. Qiu J, Wu J, Chen W, Ruan Y, Mao J, Li S, et al. NOD1 deficiency ameliorates the progression of diabetic retinopathy by modulating bone marrow-retina crosstalk. Stem Cell Res Ther. (2024) 15:38. doi: 10.1186/s13287-024-03654-y
83. Vujosevic S, Micera A, Bini S, Berton M, Esposito G, and Midena E. Proteome analysis of retinal glia cells-related inflammatory cytokines in the aqueous humour of diabetic patients. Acta Ophthalmol. (2016) 94:56–64. doi: 10.1111/aos.12812
84. Johnsen-Soriano S, Sancho-Tello M, Arnal E, Navea A, Cervera E, Bosch-Morell F, et al. IL-2 and IFN-gamma in the retina of diabetic rats. Graefes Arch Clin Exp Ophthalmol. (2010) 248:985–90. doi: 10.1007/s00417-009-1289-x
Keywords: MDBD, beta-sitosterol, diabetic retinopathy, network pharmacology, molecular docking, Mendelian randomization, in vitro validation
Citation: Poon LY, Hsu LM, Lam LK, Huang X, Xu P, Liang Q, Xie P and Yang S (2025) Mechanistic insights into modified Danggui Buxue Decoction for diabetic retinopathy via integrative analysis. Front. Endocrinol. 16:1648831. doi: 10.3389/fendo.2025.1648831
Received: 17 June 2025; Accepted: 24 September 2025;
Published: 10 October 2025.
Edited by:
Prosper Obed Chukwuemeka, University of Pittsburgh, United StatesReviewed by:
Wei Cai, Hunan University of Medicine, ChinaDeliang Liu, Sun Yat-sen University, China
Saurabh Singh, Lovely Professional University, India
Sarah Oladejo, Carnegie Mellon University, United States
Copyright © 2025 Poon, Hsu, Lam, Huang, Xu, Liang, Xie and Yang. This is an open-access article distributed under the terms of the Creative Commons Attribution License (CC BY). The use, distribution or reproduction in other forums is permitted, provided the original author(s) and the copyright owner(s) are credited and that the original publication in this journal is cited, in accordance with accepted academic practice. No use, distribution or reproduction is permitted which does not comply with these terms.
*Correspondence: Shuyu Yang, eG15YW5nc2h1eXVAMTI2LmNvbQ==; Lai Kwan Lam, MTkyNjc4NjA1MUBxcS5jb20=
†These authors have contributed equally to this work and share first authorship