Abstract
Background:
Endometriosis (EM) is a common hormone-dependent and chronic inflammatory disease affecting women of reproductive age, characterized by pelvic pain, infertility, and reduced quality of life. Laparoscopic surgery is a primary treatment, yet the influence of preoperative factors on postoperative outcomes remains unclear. The white blood cell count to hemoglobin ratio (WHR), a novel marker of systemic inflammation and tissue hypoxia, has shown prognostic value in surgical oncology but its role in predicting postoperative quality of life in EM patients remains to be elucidated.
Objective:
To explore association of white blood cell count to hemoglobin ratio (WHR) with the life quality after laparoscopic surgery in patients with endometriosis (EM).
Methods:
Data on 271 EM patients were extracted from The First Affiliated Hospital of Ningbo University in December 2016 to October 2022. Multivariate linear regression analyses were utilized to investigate the associations of WHR levels with eight health concepts in the Short-Form 36 (SF-36) scale (3-month postoperative evaluation) and evaluated through β with 95% confidence intervals (CIs). Subgroup analyses of age, body mass index (BMI), clinical stage, pathological classification, pelvic pain and lysis of adhesion were also performed. Given <1% covariate missingness, analyses used complete cases; multiple imputation would be unlikely to change the conclusions.
Results:
Patients were divided into WHR tertiles (<0.04, 0.04-0.05, ≥0.05) for description; primary models treated WHR as continuous. Higher WHR was associated with lower SF-36 scores: PCS (β = -1.42, 95% CI -2.20 to -0.65), PF (-2.82, -4.06 to -1.58), RP (-2.21, -3.94 to -0.49), VT (-2.00, -3.59 to -0.41) and RE (-2.41, -4.23 to -0.59). Tertile contrasts showed similar patterns (raw P<0.05). After BH-FDR, the WHR-PCS association remained in age<40, BMI<24 kg/m², stage IV, ovary/peritoneal phenotype, no pelvic pain, and left/right adhesion + rectum-vaginal adhesion (q<0.05); other subgroups are exploratory.
Conclusion:
Higher pre-operative WHR was associated with lower PCS at 3 months post-surgery. FDR-adjusted analyses supported the association in selected subgroups, while other contrasts were exploratory. Pending external validation and clinically meaningful cut-offs, WHR may complement existing factors for postoperative risk stratification.
Background
Endometriosis (EM) is a chronic condition in women of childbearing age that affects about one tenth women and other individuals with a uterus worldwide, causing a huge burden of diseases (1). The most common symptoms of EM are pelvic pain and infertility, and it have significant effects on quality of life, fertility, and risk of malignancy (2). Laparoscopic surgery is the preferred first-line modality of diagnosis and treatment of EM that significantly influences multiple dimensions of quality of life in EM patients (3). However, evidence on the influence of preoperative related factors on the postoperative quality of life in EM patients is still limited (4).
Inflammation plays an important role in the development and pain of EM, and it is also a crucial factor affecting the prognosis of surgical patients (5, 6). In addition to inflammation, anemia is also an important factor affecting the prognosis of surgical patients and is closely related to inflammation (7, 8). Recently, white blood cell count to hemoglobin ratio (WHR) has been developed to characterize immune inflammatory states and anoxic microenvironments and has been found to be a prognostic factor for cancer patients underwent surgery (9–11). Nevertheless, no study has discussed the role of WHR in the quality of life among EM patients after laparoscopic surgery.
Herein, this study aims to investigate the association between WHR and the quality of life in different dimensions after laparoscopic surgery among EM patients, and to provide some information for clinical management and decision-making in this population.
Methods
Study design and participants
This single-center retrospective cohort study was conducted at The First Affiliated Hospital of Ningbo University in December 2016 to October 2022. Women aged ≥18 years with endometriosis (EM) diagnosed by laparoscopic surgery met the inclusion criteria. The exclusion criteria were (1) received open surgery or open surgery combined with laparoscopic surgery, (2) underwent hysterectomy or uterus with bilateral adnexectomy, (3) missing information on white blood cell count (WBC), hemoglobin (HB) or quality of life evaluation, (4)Active infection at the pre-operative assessment (any of: temperature ≥38.0 °C within 48 h, C-reactive protein >10 mg/L or procalcitonin ≥0.5 ng/mL, a new clinical focus consistent with infection, or systemic antibiotics initiated for an acute infection, including suspected pelvic inflammatory disease), (5) Pregnancy or ≤6 weeks postpartum/lactation. A total of 271 patients were included in the final analysis. The study complied with the Declaration of Helsinki; written informed consent was obtained and the protocol was approved by the institutional ethics committee.
To ensure a clear temporal sequence, the exposure (WHR) was measured within 24 hours before surgery, and the outcome (SF-36) was administered post-operatively (details below). Because WHR preceded the outcome assessment, the study is labelled a retrospective cohort; in a sensitivity analysis we treated any subset with non-pre-operative sampling as cross-sectional.
Definitions and outcomes
The white-blood-cell-to-hemoglobin ratio (WHR) was calculated as WBC (×109/L) divided by Hb (g/L). For descriptive balance and visualization—without imposing a disease-agnostic clinical threshold—WHR was secondarily grouped into tertiles: <0.04, 0.04-0.05, and ≥0.05. Note that WHR thresholds published in oncology often use a different computational convention—WBC (per mm³)/[10 × Hb (g/L)]—which is numerically ~100× our definition (WBC (×109/L)/Hb (g/L)). Consequently, published oncology cut-offs such as 2.855 and 4.604 correspond to approximately 0.0286 and 0.0460 in our units and are not directly transportable to endometriosis; therefore, tertiles in this study are used for description only (10) (12).
The primary outcome was the Short-Form 36 (SF-36) Health Survey for 3 months (follow-up duration was 3 months) after the laparoscopic surgery. The SF-36 questionnaire includes 36 items measuring eight health concepts: physical functioning, role-physical, bodily pain, general health, vitality, social functioning, role-emotional, and mental health. The score range of each of the eight dimensions is from 0 to 100, and the higher the score, the better the health condition. Additionally, the total Physical Health Score (PCS) and the total Mental Health Score (MCS) summarize the above eight dimensions into two parts:
Covariates
Baseline characteristics included age, body mass index (BMI), revised ASRM (rASRM) stage, pathological classification/phenotype, recurrence status, pelvic pain (yes/no), lysis of adhesion (yes/no), gynecologic disease history, parity/childbearing history, AST/ALT ratio, albumin (ALB), creatinine (Cr) and fibrinogen (FIB).
Laboratory assays
Venous blood was drawn within 24 hours before surgery. WBC and Hb were measured on [XN9000, Sysmex, Japan] under routine internal quality control; analytical precision was verified by daily internal QC and remained within manufacturer specifications; published evaluations report low CV% (generally ≤1% for routine blood parameters) on this platform.
Missing data
Overall missingness was very low (≤0.74%) and confined to secondary laboratory covariates (creatinine, albumin, AST/ALT; Supplementary Table S1); the exposure (WHR) and the outcomes (SF-36) were complete. We therefore prespecified complete-case analysis (CCA) as the primary approach to avoid unnecessary model-based assumptions (13). As a sensitivity analysis, we applied multiple imputation by chained equations (MICE; m=20) under a missing-at-random (MAR) assumption, including all covariates and outcomes in the imputation model; convergence diagnostics were satisfactory. Estimates pooled with Rubin’s rules were highly consistent with the CCA results (Supplementary Table S2), supporting the robustness of our inferences.
Statistical analysis
Continuous variables were summarized as mean ± SD if approximately normal or median (Q1, Q3) otherwise; categorical variables as n (%). Group differences across WHR tertiles were assessed using one-way ANOVA (or Kruskal–Wallis for non-normal distributions) and χ² tests (or Fisher’s exact test when expected counts were <5).
Associations between WHR and SF-36 outcomes (PCS, MCS and the eight domains) were evaluated using linear regression, reporting β coefficients with 95% confidence intervals (CIs) and two-sided P-values. Model 1 was unadjusted. Model 2 was adjusted a priori for age, BMI, rASRM stage, pathological classification/phenotype, recurrence, pelvic pain, lysis of adhesion, gynecologic history, parity, AST/ALT ratio, albumin, creatinine and fibrinogen. Primary inference was based on the cohort-level models with a significance threshold of P<0.05.
Subgroup analyses were pre-specified for age, BMI, rASRM stage, phenotype, pelvic pain and adhesiolysis. To mitigate false positives from multiple comparisons, we controlled the false discovery rate (FDR) using the Benjamini–Hochberg procedure within each subgroup family and report q-values alongside raw P-values in the subgroup tables; q<0.05 was considered statistically significant for subgroups (q <0.10 considered suggestive).
WHR tertiles were used for descriptive balance and presentation only; primary modelling treated WHR as a continuous exposure. All analyses were conducted in R, version 4.3.1 (R Foundation for Statistical Computing, Vienna, Austria).
Causal assumptions are detailed in Supplementary Methods and depicted in Supplementary Figure.
Results
Characteristics of patients with EM
Of 301 women assessed for eligibility, 30 were excluded (open or combined open + laparoscopic surgery, n=10; hysterectomy or uterus + bilateral adnexectomy, n=20), leaving 271 for analysis. Missingness was ≤0.74% and confined to secondary laboratory covariates. The primary analysis used complete cases; multiple imputation (MICE, m=20) yielded consistent estimates (Figure 1). Missingness was ≤0.74% for laboratory covariates; imputed and complete-case results were consistent (Supplementary Tables S1-S2).
Figure 1

Study flow.
Comparation on characteristics of eligible patients with different WBC/HGB levels was shown in Table 1. The average age of total patients was 36.49 years old. Among the three groups, patients with WHR level of ≥0.05 had the highest average BMI values (22.46 kg/m2), followed by those with WHR level of 0.04-0.05 (average BMI = 21.68 kg/m2). More than half of participants were at EM clinical stages of I/II/III (n=155, 57.20%), had pathological classification of ovary/peritoneal (n=182, 67.16%). EM patients with WHR level of ≥0.05 had the highest average levels of ALB (43.29 g/L), and the lowest levels of physical functioning (88.01), role-physical (89.89), PCS (53.85), vitality (88.15), social functioning (86.07) and role-emotional (91.75) scores.
Table 1
| Variables | Total (n=271) | WHR | Statistics | P | ||
|---|---|---|---|---|---|---|
| <0.04 (n=90) | 0.04-0.05 (n=92) | ≥0.05 (n=89) | ||||
| Age, years, Mean ± SD | 36.49 ± 7.47 | 36.30 ± 8.42 | 35.61 ± 6.91 | 37.61 ± 6.94 | F=1.671 | 0.190 |
| BMI, kg/m2, Mean ± SD | 21.77 ± 3.26 | 21.17 ± 3.23 | 21.68 ± 3.07 | 22.46 ± 3.39 | F=3.621 | 0.028 |
| BMI, kg/m2, n (%) | - | 0.050 | ||||
| <18.5 | 39 (14.39) | 20 (22.22) | 10 (10.87) | 9 (10.11) | ||
| [18.5, 24) | 177 (65.31) | 55 (61.11) | 68 (73.91) | 54 (60.67) | ||
| [24, 28) | 44 (16.24) | 11 (12.22) | 12 (13.04) | 21 (23.60) | ||
| ≥28 | 11 (4.06) | 4 (4.44) | 2 (2.17) | 5 (5.62) | ||
| Clinical stages, n (%) | χ2=0.388 | 0.824 | ||||
| I/II/III | 155 (57.20) | 50 (55.56) | 55 (59.78) | 50 (56.18) | ||
| IV | 116 (42.80) | 40 (44.44) | 37 (40.22) | 39 (43.82) | ||
| Pathological classification, n (%) | χ2=1.782 | 0.410 | ||||
| Ovary/peritoneal | 182 (67.16) | 62 (68.89) | 57 (61.96) | 63 (70.79) | ||
| Ovary/peritoneal combined with deep infiltration | 89 (32.84) | 28 (31.11) | 35 (38.04) | 26 (29.21) | ||
| Recurrence EM, n (%) | χ2=0.242 | 0.886 | ||||
| No | 250 (92.25) | 83 (92.22) | 84 (91.30) | 83 (93.26) | ||
| Yes | 21 (7.75) | 7 (7.78) | 8 (8.70) | 6 (6.74) | ||
| Pelvic pain, n (%) | χ2=0.773 | 0.679 | ||||
| No | 180 (66.42) | 62 (68.89) | 62 (67.39) | 56 (62.92) | ||
| Yes | 91 (33.58) | 28 (31.11) | 30 (32.61) | 33 (37.08) | ||
| Lysis of adhesion, n (%) | - | 0.509 | ||||
| No | 3 (1.11) | 1 (1.11) | 1 (1.09) | 1 (1.12) | ||
| Only left/right adhesion | 106 (39.11) | 37 (41.11) | 30 (32.61) | 39 (43.82) | ||
| Only rectum-vagina | 1 (0.37) | 1 (1.11) | 0 (0.00) | 0 (0.00) | ||
| Left/right adhesion combined with rectum-vagina | 161 (59.41) | 51 (56.67) | 61 (66.30) | 49 (55.06) | ||
| History of gynecological diseases, n (%) | χ2=11.846 | 0.296 | ||||
| No | 102 (37.64) | 39 (43.33) | 33 (35.87) | 30 (33.71) | ||
| Gynecological surgery | 64 (23.62) | 16 (17.78) | 25 (27.17) | 23 (25.84) | ||
| Myoma of uterus | 26 (9.59) | 8 (8.89) | 10 (10.87) | 8 (8.99) | ||
| Adenomyosis | 6 (2.21) | 0 (0.00) | 4 (4.35) | 2 (2.25) | ||
| Infertility | 21 (7.75) | 10 (11.11) | 5 (5.43) | 6 (6.74) | ||
| Multiple diseases | 52 (19.19) | 17 (18.89) | 15 (16.30) | 20 (22.47) | ||
| Childbearing history, n (%) | χ2=6.549 | 0.365 | ||||
| No | 75 (27.68) | 30 (33.33) | 22 (23.91) | 23 (25.84) | ||
| Full-term birth | 71 (26.20) | 23 (25.56) | 28 (30.43) | 20 (22.47) | ||
| Abortion | 16 (5.90) | 6 (6.67) | 7 (7.61) | 3 (3.37) | ||
| Multiple types | 109 (40.22) | 31 (34.44) | 35 (38.04) | 43 (48.31) | ||
| AST/ALT, M (Q1, Q3) | 1.60 (1.25, 2.00) | 1.53 (1.23, 1.88) | 1.59 (1.26, 2.05) | 1.64 (1.29, 1.92) | χ2=1.941# | 0.379 |
| ALB, g/L, Mean ± SD | 44.01 ± 3.45 | 44.65 ± 3.11 | 44.07 ± 3.78 | 43.29 ± 3.30 | F=3.552 | 0.030 |
| Cr, mg/L, Mean ± SD | 55.49 ± 7.91 | 55.00 ± 7.65 | 54.48 ± 7.24 | 57.04 ± 8.67 | F=2.647 | 0.073 |
| FIB, Mean ± SD | 2.31 ± 0.73 | 2.26 ± 0.71 | 2.23 ± 0.67 | 2.44 ± 0.79 | F=2.228 | 0.110 |
| WBC, K/uL, Mean ± SD | 5.70 ± 1.75 | 4.26 ± 0.59 | 5.47 ± 0.66 | 7.39 ± 1.89 | F=155.399 | <0.001 |
| HB, g/L, Mean ± SD | 124.24 ± 14.85 | 128.81 ± 11.77 | 124.89 ± 14.08 | 118.96 ± 16.78 | F=10.705 | <0.001 |
| Physical functioning, Mean ± SD | 91.14 ± 11.04 | 94.06 ± 6.70 | 91.30 ± 13.88 | 88.01 ± 10.53 | F=7.017 | 0.001 |
| Role-physical, Mean ± SD | 92.44 ± 14.69 | 95.83 ± 10.76 | 91.58 ± 16.69 | 89.89 ± 15.41 | F=3.992 | 0.020 |
| Bodily pain, Mean ± SD | 89.98 ± 14.43 | 92.98 ± 12.25 | 87.63 ± 17.11 | 89.37 ± 12.99 | F=3.298 | 0.038 |
| General health, Mean ± SD | 89.67 ± 13.43 | 92.06 ± 8.67 | 88.75 ± 17.33 | 88.20 ± 12.57 | F=2.185 | 0.114 |
| PCS, M (Q1, Q3) | 55.27 ± 6.96 | 56.97 ± 4.20 | 54.98 ± 8.98 | 53.85 ± 6.51 | F=4.743 | 0.009 |
| Vitality, Mean ± SD | 90.06 ± 13.63 | 93.11 ± 9.93 | 88.91 ± 15.93 | 88.15 ± 13.89 | F=3.525 | 0.031 |
| Social functioning, Mean ± SD | 88.08 ± 15.20 | 91.67 ± 10.41 | 86.52 ± 18.18 | 86.07 ± 15.42 | F=3.847 | 0.023 |
| Role-emotional, Mean ± SD | 93.84 ± 15.30 | 97.40 ± 11.44 | 92.38 ± 17.21 | 91.75 ± 16.14 | F=3.768 | 0.024 |
| Mental health, Mean ± SD | 90.58 ± 12.08 | 93.53 ± 6.06 | 88.87 ± 15.97 | 89.35 ± 11.56 | F=4.169 | 0.016 |
| MCS, M (Q1, Q3) | 59.45 ± 6.70 | 61.04 ± 4.65 | 58.49 ± 8.10 | 58.85 ± 6.63 | F=3.935 | 0.021 |
Characteristics of EM patients in different WHR level groups.
F: One-Way ANOVA, χ2: chi-square test.
EM, endometriosis; WHR, white blood cell to hemoglobin ratio; SD, standard deviation; BMI, body mass index, AST/ALT, glutamic oxaloacetic transaminase to serum glutamic pyruvic transaminase ratio; M; median; Q1, 1st quartile; Q3, 3rd quartile; ALB; albumin; Cr; creatinine; FIB; fibrinogen; WBC, white blood cell; PCS, Physical Health Score; MCS, Mental Health Score.
Associations of WHR with the quality of life after laparoscopic surgery
Figure 2 summarizes domain-specific differences by WHR tertile relative to WHR <0.04. On average, the WHR <0.04 group had the highest scores across domains. Both the 0.04-0.05 and ≥0.05 groups showed lower mean SF-36 scores across most domains, with the largest decrements observed in physical functioning, role-physical, vitality and role-emotional. These descriptive patterns were directionally consistent with the multivariable models (Table 2), in which higher (continuous) WHR was associated with lower PCS, PF, RP, VT and RE. Multiplicity-adjusted q-values are provided in Table 2 (and in Tables 3–8 for prespecified subgroups).
Figure 2
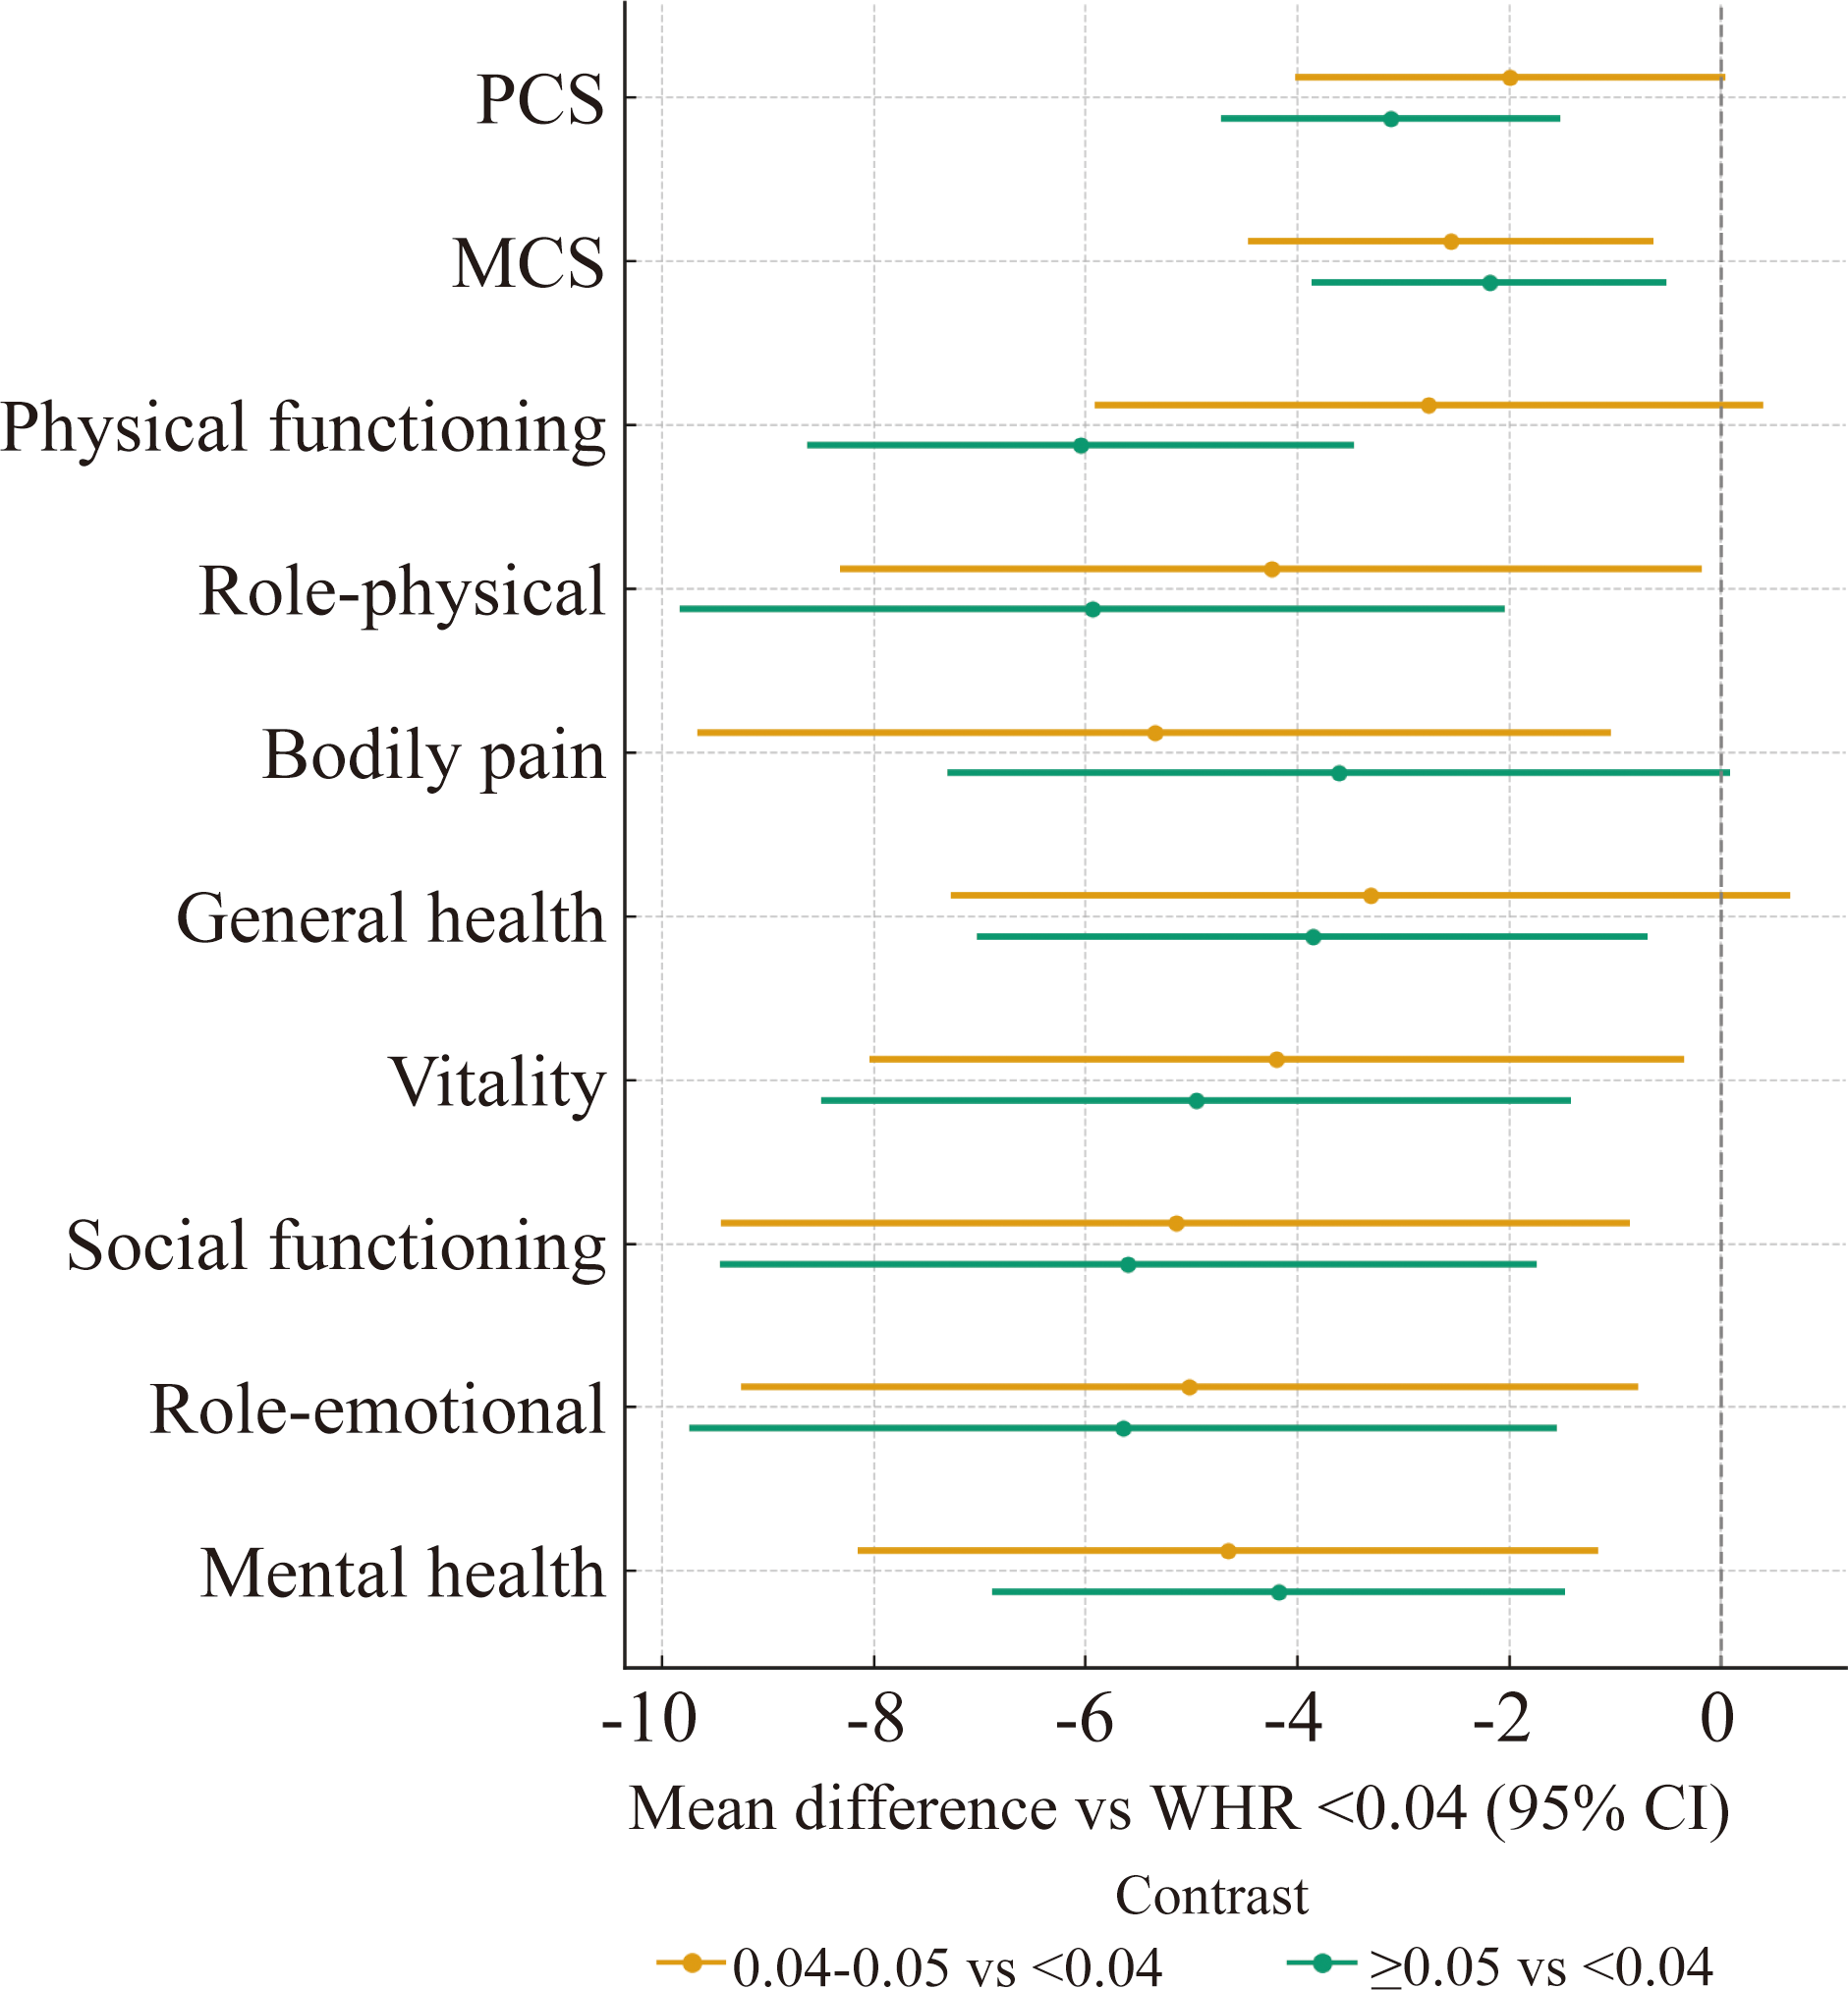
SF-36 domain scores by WHR tertile—forest plot of mean differences versus the reference group (WHR <0.04).
Table 2
| Variables | Model 1 | Model 2 | ||||
|---|---|---|---|---|---|---|
| β (95% CI) | P | q | β (95% CI) | P | q | |
| PCS | ||||||
| WHR | -1.65 (-2.46, -0.84) | <0.001 | 0.006 | -1.42 (-2.20, -0.65) | <0.001 | 0.01 |
| WHR levels | Ref | Ref | ||||
| <0.04 | -2.13 (-4.15, -0.12) | 0.039 | 0.045 | -2.34 (-4.20, -0.48) | 0.014 | 0.03 |
| 0.04-0.05 | -2.95 (-4.95, -0.95) | 0.004 | 0.02 | -2.68 (-4.52, -0.84) | 0.005 | 0.0214 |
| ≥0.05 | ||||||
| Physical functioning | ||||||
| WHR | -3.14 (-4.40, -1.87) | <0.001 | 0.006 | -2.82 (-4.06, -1.58) | <0.001 | 0.01 |
| WHR levels | ||||||
| <0.04 | Ref | Ref | ||||
| 0.04-0.05 | -2.93 (-6.10, 0.24) | 0.071 | 0.0761 | -3.38 (-6.38, -0.38) | 0.028 | 0.0494 |
| ≥0.05 | -5.76 (-8.91, -2.62) | <0.001 | 0.006 | -5.36 (-8.34, -2.39) | <0.001 | 0.01 |
| Role-physical | ||||||
| WHR | -2.90 (-4.62, -1.18) | 0.001 | 0.006 | -2.21 (-3.94, -0.49) | 0.012 | 0.03 |
| WHR levels | ||||||
| <0.04 | Ref | Ref | ||||
| 0.04-0.05 | -4.54 (-8.80, -0.28) | 0.038 | 0.045 | -5.01 (-9.11, -0.92) | 0.017 | 0.034 |
| ≥0.05 | -5.62 (-9.84, -1.39) | 0.010 | 0.0273 | -4.62 (-8.68, -0.56) | 0.027 | 0.0494 |
| Bodily pain | ||||||
| WHR | -2.14 (-3.84, -0.43) | 0.015 | 0.03 | -1.59 (-3.23, 0.05) | 0.059 | 0.0737 |
| WHR levels | ||||||
| <0.04 | Ref | Ref | ||||
| 0.04-0.05 | -5.46 (-9.65, -1.27) | 0.011 | 0.0275 | -5.26 (-9.14, -1.38) | 0.008 | 0.03 |
| ≥0.05 | -3.55 (-7.71, 0.60) | 0.095 | 0.095 | -2.83 (-6.68, 1.02) | 0.151 | 0.151 |
| General health | ||||||
| WHR | -1.82 (-3.41, -0.23) | 0.026 | 0.0355 | -1.35 (-2.92, 0.22) | 0.094 | 0.1044 |
| WHR levels | ||||||
| <0.04 | Ref | Ref | ||||
| 0.04-0.05 | -3.68 (-7.60, 0.23) | 0.066 | 0.0733 | -4.00 (-7.73, -0.28) | 0.036 | 0.054 |
| ≥0.05 | -3.47 (-7.36, 0.42) | 0.081 | 0.0838 | -3.13 (-6.82, 0.57) | 0.099 | 0.1061 |
| MCS | ||||||
| WHR | -0.93 (-1.72, -0.13) | 0.023 | 0.0343 | -0.61 (-1.41, 0.19) | 0.135 | 0.1397 |
| WHR levels | ||||||
| <0.04 | Ref | Ref | ||||
| 0.04-0.05 | -2.64 (-4.58, -0.70) | 0.008 | 0.0267 | -2.78 (-4.66, -0.90) | 0.004 | 0.0214 |
| ≥0.05 | -2.12 (-4.05, -0.20) | 0.032 | 0.04 | -1.81 (-3.67, 0.05) | 0.057 | 0.0737 |
| Vitality | ||||||
| WHR | -2.17 (-3.78, -0.56) | 0.009 | 0.027 | -2.00 (-3.59, -0.41) | 0.014 | 0.03 |
| WHR levels | ||||||
| <0.04 | Ref | Ref | ||||
| 0.04-0.05 | -4.40 (-8.36, -0.45) | 0.030 | 0.0391 | -5.01 (-8.78, -1.25) | 0.010 | 0.03 |
| ≥0.05 | -4.74 (-8.67, -0.82) | 0.019 | 0.0316 | -4.85 (-8.58, -1.11) | 0.012 | 0.03 |
| Social functioning | ||||||
| WHR | -2.52 (-4.31, -0.72) | 0.006 | 0.0257 | -1.67 (-3.43, 0.09) | 0.064 | 0.0768 |
| WHR levels | ||||||
| <0.04 | Ref | Ref | ||||
| 0.04-0.05 | -5.26 (-9.67, -0.85) | 0.020 | 0.0316 | -5.96 (-10.10, -1.82) | 0.005 | 0.0214 |
| ≥0.05 | -5.47 (-9.84, -1.10) | 0.015 | 0.03 | -4.52 (-8.63, -0.42) | 0.032 | 0.0505 |
| Role-emotional | ||||||
| WHR | -3.05 (-4.84, -1.26) | <0.001 | 0.006 | -2.41 (-4.23, -0.59) | 0.010 | 0.03 |
| WHR levels | ||||||
| <0.04 | Ref | Ref | ||||
| 0.04-0.05 | -5.28 (-9.72, -0.84) | 0.020 | 0.0316 | -4.80 (-9.14, -0.46) | 0.031 | 0.0505 |
| ≥0.05 | -5.39 (-9.79, -0.99) | 0.017 | 0.0316 | -4.34 (-8.64, -0.03) | 0.049 | 0.0668 |
| Mental health | ||||||
| WHR | -1.84 (-3.26, -0.41) | 0.012 | 0.0277 | -1.28 (-2.71, 0.15) | 0.080 | 0.0923 |
| WHR levels | ||||||
| <0.04 | Ref | Ref | ||||
| 0.04-0.05 | -4.86 (-8.36, -1.36) | 0.007 | 0.0262 | -5.06 (-8.42, -1.71) | 0.003 | 0.0214 |
| ≥0.05 | -4.01 (-7.48, -0.54) | 0.024 | 0.0343 | -3.54 (-6.87, -0.21) | 0.038 | 0.0543 |
Association between WHR and life quality after laparoscopic surgery in EM patients.
WHR, white blood cell to hemoglobin ratio; EM, endometriosis; CI, confidence interval; PCS, Physical Health Score; Ref, reference; MCS, Mental Health Score.
Model 1: unadjusted model,
Model 2: adjusted for age, BMI, clinical stage, pathological classification, recurrence, pelvic pain, lysis of adhesion, gynecological diseases history, childbearing history, AST/ALT, ALB, Cr and FIB.
Table 3
| Variables | Age: <40 | Age: ≥40 | ||||
|---|---|---|---|---|---|---|
| β (95% CI) | P | q | β (95% CI) | P | q | |
| PCS | ||||||
| WHR | -2.05 (-3.26, -0.84) | 0.001 | 0.015 | -1.21 (-2.19, -0.24) | 0.017 | 0.114 |
| WHR levels | ||||||
| <0.04 | Ref | Ref | ||||
| 0.04-0.05 | -3.49 (-5.96, -1.03) | 0.006 | 0.0343 | 0.14 (-2.68, 2.96) | 0.925 | 0.925 |
| ≥0.05 | -3.69 (-6.37, -1.00) | 0.008 | 0.0343 | -2.28 (-4.82, 0.26) | 0.083 | 0.195 |
| Physical functioning | ||||||
| WHR | -3.83 (-5.73, -1.93) | <0.001 | 0.015 | -2.19 (-3.96, -0.42) | 0.017 | 0.114 |
| WHR levels | ||||||
| <0.04 | Ref | Ref | ||||
| 0.04-0.05 | -5.36 (-9.27, -1.45) | 0.008 | 0.0343 | 0.99 (-4.07, 6.05) | 0.703 | 0.7272 |
| ≥0.05 | -6.73 (-10.99, -2.48) | 0.002 | 0.02 | -4.44 (-9.00, 0.11) | 0.060 | 0.18 |
| Role-physical | ||||||
| WHR | -3.64 (-6.23, -1.06) | 0.007 | 0.0343 | -1.76 (-4.22, 0.69) | 0.163 | 0.2965 |
| WHR levels | ||||||
| <0.04 | Ref | Ref | ||||
| 0.04-0.05 | -5.53 (-10.79, -0.26) | 0.042 | 0.09 | -4.64 (-11.67, 2.39) | 0.200 | 0.3333 |
| ≥0.05 | -7.17 (-12.91, -1.44) | 0.015 | 0.0562 | -3.60 (-9.92, 2.72) | 0.268 | 0.3655 |
| Bodily pain | ||||||
| WHR | -1.48 (-4.05, 1.09) | 0.261 | 0.27 | -2.29 (-4.35, -0.24) | 0.032 | 0.1414 |
| WHR levels | ||||||
| <0.04 | Ref | Ref | ||||
| 0.04-0.05 | -5.84 (-11.00, -0.68) | 0.028 | 0.084 | -3.66 (-9.63, 2.32) | 0.235 | 0.3443 |
| ≥0.05 | -3.12 (-8.74, 2.50) | 0.279 | 0.279 | -4.08 (-9.45, 1.30) | 0.141 | 0.282 |
| General health | ||||||
| WHR | -1.99 (-4.44, 0.46) | 0.114 | 0.1425 | -0.84 (-2.68, 0.99) | 0.371 | 0.4839 |
| WHR levels | ||||||
| <0.04 | Ref | Ref | ||||
| 0.04-0.05 | -5.60 (-10.69, -0.51) | 0.033 | 0.09 | -1.21 (-6.48, 4.06) | 0.653 | 0.6996 |
| ≥0.05 | -5.51 (-11.05, 0.04) | 0.053 | 0.0988 | -1.91 (-6.65, 2.83) | 0.433 | 0.5019 |
| MCS | ||||||
| WHR | -0.80 (-2.05, 0.45) | 0.211 | 0.2344 | -0.45 (-1.54, 0.65) | 0.429 | 0.5019 |
| WHR levels | ||||||
| <0.04 | Ref | Ref | ||||
| 0.04-0.05 | -2.17 (-4.69, 0.35) | 0.093 | 0.1268 | -4.29 (-7.29, -1.28) | 0.007 | 0.114 |
| ≥0.05 | -2.11 (-4.85, 0.64) | 0.134 | 0.1581 | -1.92 (-4.62, 0.78) | 0.168 | 0.2965 |
| Vitality | ||||||
| WHR | -2.83 (-5.44, -0.21) | 0.036 | 0.09 | -1.57 (-3.32, 0.19) | 0.085 | 0.195 |
| WHR levels | ||||||
| <0.04 | Ref | Ref | ||||
| 0.04-0.05 | -4.60 (-9.93, 0.73) | 0.093 | 0.1268 | -5.45 (-10.35, -0.55) | 0.033 | 0.1414 |
| ≥0.05 | -5.42 (-11.22, 0.38) | 0.069 | 0.1035 | -5.38 (-9.79, -0.97) | 0.019 | 0.114 |
| Social functioning | ||||||
| WHR | -2.58 (-5.22, 0.05) | 0.056 | 0.0988 | -0.78 (-3.45, 1.90) | 0.571 | 0.6344 |
| WHR levels | ||||||
| <0.04 | Ref | Ref | ||||
| 0.04-0.05 | -5.50 (-10.83, -0.17) | 0.045 | 0.09 | -7.57 (-15.05, -0.08) | 0.051 | 0.17 |
| ≥0.05 | -5.50 (-11.30, 0.30) | 0.065 | 0.1035 | -4.06 (-10.79, 2.67) | 0.241 | 0.3443 |
| Role-emotional | ||||||
| WHR | -2.78 (-5.42, -0.14) | 0.040 | 0.09 | -3.41 (-5.88, -0.93) | 0.009 | 0.114 |
| WHR levels | ||||||
| <0.04 | Ref | Ref | ||||
| 0.04-0.05 | -3.54 (-9.25, 2.17) | 0.226 | 0.2421 | -7.28 (-14.48, -0.09) | 0.051 | 0.17 |
| ≥0.05 | -4.74 (-10.96, 1.47) | 0.137 | 0.1581 | -5.67 (-12.14, 0.81) | 0.091 | 0.195 |
| Mental health | ||||||
| WHR | -1.83 (-4.09, 0.42) | 0.114 | 0.1425 | -0.73 (-2.55, 1.09) | 0.435 | 0.5019 |
| WHR levels | ||||||
| <0.04 | Ref | Ref | ||||
| 0.04-0.05 | -5.47 (-10.00, -0.94) | 0.019 | 0.0633 | -4.77 (-9.88, 0.35) | 0.072 | 0.195 |
| ≥0.05 | -4.66 (-9.60, 0.27) | 0.066 | 0.1035 | -2.89 (-7.48, 1.71) | 0.223 | 0.3443 |
Association between WHR and life quality in age subgroups.
WHR, white blood cell to hemoglobin ratio; CI, confidence interval; PCS, Physical Health Score; Ref; reference; MCS, Mental Health Score.
Table 4
| Variables | BMI: <24 | BMI: ≥24 | ||||
|---|---|---|---|---|---|---|
| β (95% CI) | P | q | β (95% CI) | P | q | |
| PCS | ||||||
| WHR | -1.46 (-2.33, -0.58) | 0.001 | 0.0075 | -2.09 (-3.79, -0.39) | 0.021 | 0.1575 |
| WHR levels | ||||||
| <0.04 | ||||||
| 0.04-0.05 | -2.53 (-4.45, -0.62) | 0.010 | 0.0429 | 3.69 (-1.70, 9.09) | 0.189 | 0.3142 |
| ≥0.05 | -2.74 (-4.73, -0.75) | 0.008 | 0.0429 | -2.16 (-6.28, 1.96) | 0.312 | 0.4255 |
| Physical functioning | ||||||
| WHR | -2.76 (-4.12, -1.41) | <0.001 | 0.0075 | -4.22 (-7.32, -1.12) | 0.011 | 0.1575 |
| WHR levels | ||||||
| <0.04 | Ref | Ref | ||||
| 0.04-0.05 | -3.78 (-6.75, -0.81) | 0.013 | 0.0487 | 5.44 (-4.30, 15.19) | 0.281 | 0.4129 |
| ≥0.05 | -5.25 (-8.34, -2.16) | 0.001 | 0.0075 | -6.37 (-13.81, 1.07) | 0.102 | 0.3027 |
| Role-physical | ||||||
| WHR | -2.10 (-4.08, -0.13) | 0.038 | 0.0814 | -5.59 (-9.32, -1.87) | 0.006 | 0.1575 |
| WHR levels | ||||||
| <0.04 | Ref | Ref | ||||
| 0.04-0.05 | -5.64 (-9.91, -1.37) | 0.010 | 0.0429 | 3.58 (-8.96, 16.12) | 0.579 | 0.6589 |
| ≥0.05 | -4.42 (-8.86, 0.02) | 0.052 | 0.0821 | -6.61 (-16.18, 2.96) | 0.185 | 0.3142 |
| Bodily pain | ||||||
| WHR | -1.96 (-3.89, -0.02) | 0.049 | 0.0821 | -0.17 (-3.71, 3.38) | 0.927 | 0.927 |
| WHR levels | ||||||
| <0.04 | Ref | Ref | ||||
| 0.04-0.05 | -4.92 (-9.12, -0.73) | 0.023 | 0.069 | 3.73 (-7.41, 14.88) | 0.516 | 0.6192 |
| ≥0.05 | -3.48 (-7.85, 0.89) | 0.120 | 0.144 | 3.54 (-4.97, 12.04) | 0.421 | 0.5262 |
| General health | ||||||
| WHR | -2.09 (-3.98, -0.19) | 0.032 | 0.0814 | -3.01 (-5.78, -0.24) | 0.040 | 0.24 |
| WHR levels | ||||||
| <0.04 | Ref | Ref | ||||
| 0.04-0.05 | -3.50 (-7.63, 0.63) | 0.099 | 0.1238 | 0.68 (-8.31, 9.67) | 0.883 | 0.9134 |
| ≥0.05 | -3.01 (-7.31, 1.29) | 0.171 | 0.178 | -4.80 (-11.66, 2.06) | 0.179 | 0.3142 |
| MCS | ||||||
| WHR | -0.65 (-1.58, 0.29) | 0.178 | 0.178 | -1.44 (-3.29, 0.42) | 0.139 | 0.3107 |
| WHR levels | ||||||
| <0.04 | Ref | Ref | ||||
| 0.04-0.05 | -2.07 (-4.09, -0.05) | 0.046 | 0.0821 | -5.10 (-10.89, 0.69) | 0.093 | 0.3027 |
| ≥0.05 | -1.57 (-3.67, 0.54) | 0.146 | 0.1685 | -3.69 (-8.11, 0.73) | 0.111 | 0.3027 |
| Vitality | ||||||
| WHR | -2.05 (-3.97, -0.13) | 0.038 | 0.0814 | -3.76 (-6.78, -0.75) | 0.020 | 0.1575 |
| WHR levels | ||||||
| <0.04 | Ref | Ref | ||||
| 0.04-0.05 | -4.21 (-8.38, -0.03) | 0.050 | 0.0821 | -5.44 (-15.34, 4.45) | 0.289 | 0.4129 |
| ≥0.05 | -4.66 (-9.01, -0.32) | 0.037 | 0.0814 | -6.98 (-14.54, 0.57) | 0.079 | 0.2963 |
| Social functioning | ||||||
| WHR | -1.40 (-3.39, 0.59) | 0.169 | 0.178 | -4.57 (-9.25, 0.12) | 0.064 | 0.2743 |
| WHR levels | ||||||
| <0.04 | Ref | Ref | ||||
| 0.04-0.05 | -3.93 (-8.24, 0.37) | 0.075 | 0.1023 | -11.59 (-26.32, 3.14) | 0.132 | 0.3107 |
| ≥0.05 | -3.09 (-7.57, 1.39) | 0.178 | 0.178 | -11.57 (-22.81, -0.33) | 0.052 | 0.26 |
| Role-emotional | ||||||
| WHR | -4.35 (-6.52, -2.19) | <0.001 | 0.0075 | -2.07 (-5.18, 1.03) | 0.199 | 0.3142 |
| WHR levels | ||||||
| <0.04 | Ref | Ref | ||||
| 0.04-0.05 | -4.66 (-9.47, 0.15) | 0.059 | 0.0885 | 1.04 (-8.98, 11.07) | 0.839 | 0.8989 |
| ≥0.05 | -5.10 (-10.10, -0.09) | 0.047 | 0.0821 | -2.11 (-9.75, 5.54) | 0.593 | 0.6589 |
| Mental health | ||||||
| WHR | -1.47 (-3.15, 0.20) | 0.086 | 0.1122 | -2.33 (-5.39, 0.74) | 0.145 | 0.3107 |
| WHR levels | ||||||
| <0.04 | Ref | Ref | ||||
| 0.04-0.05 | -4.50 (-8.11, -0.88) | 0.016 | 0.0533 | -4.24 (-14.04, 5.55) | 0.402 | 0.5243 |
| ≥0.05 | -3.46 (-7.22, 0.29) | 0.072 | 0.1023 | -5.08 (-12.55, 2.40) | 0.192 | 0.3142 |
Association between WHR and life quality in BMI subgroups.
WHR, white blood cell to hemoglobin ratio; BMI, body mass index; CI, confidence interval; PCS, Physical Health Score; Ref; reference; MCS, Mental Health Score.
Table 5
| Variables | Stage I/II/III | Stage IV | ||||
|---|---|---|---|---|---|---|
| β (95% CI) | P | q | β (95% CI) | P | q | |
| PCS | ||||||
| WHR | -1.18 (-2.23, -0.14) | 0.027 | 0.29 | -2.02 (-3.26, -0.78) | 0.002 | 0.02 |
| WHR levels | ||||||
| <0.04 | ||||||
| 0.04-0.05 | -1.27 (-3.87, 1.32) | 0.338 | 0.4225 | -2.05 (-5.02, 0.92) | 0.179 | 0.2148 |
| ≥0.05 | -2.31 (-4.81, 0.20) | 0.073 | 0.2937 | -2.88 (-5.76, 0.00) | 0.053 | 0.106 |
| Physical functioning | ||||||
| WHR | -2.28 (-4.01, -0.56) | 0.011 | 0.29 | -3.91 (-5.79, -2.02) | <0.001 | 0.02 |
| WHR levels | ||||||
| <0.04 | Ref | Ref | ||||
| 0.04-0.05 | -2.92 (-7.22, 1.38) | 0.185 | 0.2937 | -1.66 (-6.26, 2.94) | 0.481 | 0.481 |
| ≥0.05 | -4.69 (-8.84, -0.53) | 0.029 | 0.29 | -5.89 (-10.36, -1.42) | 0.011 | 0.066 |
| Role-physical | ||||||
| WHR | -2.13 (-4.57, 0.31) | 0.090 | 0.2937 | -2.68 (-5.24, -0.12) | 0.043 | 0.1038 |
| WHR levels | ||||||
| <0.04 | Ref | Ref | ||||
| 0.04-0.05 | -4.28 (-10.29, 1.74) | 0.166 | 0.2937 | -3.80 (-9.85, 2.26) | 0.222 | 0.2467 |
| ≥0.05 | -5.94 (-11.74, -0.13) | 0.047 | 0.2937 | -2.34 (-8.21, 3.53) | 0.437 | 0.4521 |
| Bodily pain | ||||||
| WHR | -0.94 (-3.16, 1.29) | 0.412 | 0.4811 | -2.99 (-5.59, -0.38) | 0.027 | 0.084 |
| WHR levels | ||||||
| <0.04 | Ref | Ref | ||||
| 0.04-0.05 | -2.14 (-7.66, 3.38) | 0.449 | 0.4811 | -7.16 (-13.21, -1.11) | 0.022 | 0.084 |
| ≥0.05 | -0.99 (-6.32, 4.34) | 0.716 | 0.716 | -4.95 (-10.81, 0.92) | 0.102 | 0.1457 |
| General health | ||||||
| WHR | -1.67 (-3.66, 0.31) | 0.101 | 0.2937 | -2.44 (-5.18, 0.31) | 0.085 | 0.132 |
| WHR levels | ||||||
| <0.04 | Ref | Ref | ||||
| 0.04-0.05 | -1.15 (-5.94, 3.63) | 0.638 | 0.66 | -4.34 (-10.77, 2.10) | 0.190 | 0.2192 |
| ≥0.05 | -3.15 (-7.77, 1.48) | 0.185 | 0.2937 | -3.35 (-9.60, 2.89) | 0.295 | 0.3161 |
| MCS | ||||||
| WHR | -0.45 (-1.53, 0.64) | 0.422 | 0.4811 | -1.37 (-2.56, -0.18) | 0.027 | 0.084 |
| WHR levels | ||||||
| <0.04 | Ref | Ref | ||||
| 0.04-0.05 | -2.06 (-4.72, 0.61) | 0.133 | 0.2937 | -2.92 (-5.70, -0.15) | 0.042 | 0.1038 |
| ≥0.05 | -1.75 (-4.33, 0.83) | 0.186 | 0.2937 | -2.37 (-5.06, 0.32) | 0.088 | 0.132 |
| Vitality | ||||||
| WHR | -1.53 (-3.65, 0.58) | 0.157 | 0.2937 | -3.57 (-6.13, -1.01) | 0.008 | 0.06 |
| WHR levels | ||||||
| <0.04 | Ref | Ref | ||||
| 0.04-0.05 | -2.03 (-7.25, 3.19) | 0.447 | 0.4811 | -6.03 (-12.06, 0.00) | 0.053 | 0.106 |
| ≥0.05 | -4.16 (-9.20, 0.88) | 0.108 | 0.2937 | -6.07 (-11.92, -0.22) | 0.045 | 0.1038 |
| Social functioning | ||||||
| WHR | -1.48 (-3.87, 0.91) | 0.229 | 0.3271 | -3.13 (-5.81, -0.45) | 0.024 | 0.084 |
| WHR levels | ||||||
| <0.04 | Ref | Ref | ||||
| 0.04-0.05 | -4.73 (-10.62, 1.15) | 0.118 | 0.2937 | -5.94 (-12.21, 0.33) | 0.066 | 0.1117 |
| ≥0.05 | -4.31 (-9.99, 1.38) | 0.140 | 0.2937 | -5.74 (-11.82, 0.34) | 0.067 | 0.1117 |
| Role-emotional | ||||||
| WHR | -2.15 (-4.68, 0.39) | 0.099 | 0.2937 | -4.40 (-7.07, -1.73) | 0.002 | 0.02 |
| WHR levels | ||||||
| <0.04 | Ref | Ref | ||||
| 0.04-0.05 | -4.05 (-10.42, 2.33) | 0.216 | 0.324 | -5.17 (-11.58, 1.24) | 0.117 | 0.1487 |
| ≥0.05 | -3.65 (-9.82, 2.51) | 0.247 | 0.3368 | -6.11 (-12.32, 0.11) | 0.057 | 0.1069 |
| Mental health | ||||||
| WHR | -0.97 (-2.91, 0.96) | 0.326 | 0.4225 | -2.48 (-4.65, -0.30) | 0.028 | 0.084 |
| WHR levels | ||||||
| <0.04 | Ref | Ref | ||||
| 0.04-0.05 | -3.96 (-8.73, 0.80) | 0.105 | 0.2937 | -4.10 (-9.21, 1.00) | 0.119 | 0.1487 |
| ≥0.05 | -3.33 (-7.93, 1.28) | 0.159 | 0.2937 | -4.11 (-9.06, 0.85) | 0.108 | 0.1473 |
Association between WHR and life quality in clinical stage subgroups.
WHR, white blood cell to hemoglobin ratio; CI, confidence interval; PCS, Physical Health Score; Ref; reference; MCS, Mental Health Score.
Table 6
| Variables | Ovary/peritoneal | Ovary/peritoneal combined with deep infiltration | ||||
|---|---|---|---|---|---|---|
| β (95% CI) | P | q | β (95% CI) | P | q | |
| PCS | ||||||
| WHR | -1.33 (-2.10, -0.55) | 0.001 | 0.015 | -1.29 (-3.20, 0.61) | 0.189 | 0.3568 |
| WHR levels | ||||||
| <0.04 | Ref | Ref | ||||
| 0.04-0.05 | -0.57 (-2.48, 1.35) | 0.563 | 0.6032 | -3.75 (-8.20, 0.69) | 0.103 | 0.315 |
| ≥0.05 | -2.24 (-4.06, -0.42) | 0.017 | 0.1275 | -2.03 (-6.61, 2.55) | 0.388 | 0.4752 |
| Physical functioning | ||||||
| WHR | -2.51 (-3.77, -1.26) | <0.001 | 0.015 | -2.83 (-5.83, 0.17) | 0.069 | 0.3 |
| WHR levels | ||||||
| <0.04 | Ref | Ref | ||||
| 0.04-0.05 | -1.58 (-4.68, 1.51) | 0.317 | 0.3962 | -4.43 (-11.54, 2.68) | 0.226 | 0.3568 |
| ≥0.05 | -4.78 (-7.71, -1.85) | 0.002 | 0.02 | -4.87 (-12.19, 2.44) | 0.196 | 0.3568 |
| Role-physical | ||||||
| WHR | -1.86 (-3.92, 0.21) | 0.080 | 0.244 | -2.17 (-5.62, 1.28) | 0.223 | 0.3568 |
| WHR levels | ||||||
| <0.04 | Ref | Ref | ||||
| 0.04-0.05 | -3.18 (-8.20, 1.84) | 0.216 | 0.324 | -6.30 (-14.36, 1.76) | 0.130 | 0.325 |
| ≥0.05 | -4.44 (-9.19, 0.31) | 0.069 | 0.244 | -1.79 (-10.08, 6.51) | 0.674 | 0.6972 |
| Bodily pain | ||||||
| WHR | -1.50 (-3.33, 0.33) | 0.111 | 0.244 | -1.69 (-5.45, 2.07) | 0.381 | 0.4752 |
| WHR levels | ||||||
| <0.04 | Ref | Ref | ||||
| 0.04-0.05 | -0.59 (-5.07, 3.89) | 0.796 | 0.806 | -11.15 (-19.58, -2.72) | 0.012 | 0.18 |
| ≥0.05 | -1.30 (-5.55, 2.95) | 0.550 | 0.6032 | -3.19 (-11.88, 5.49) | 0.474 | 0.5469 |
| General health | ||||||
| WHR | -1.49 (-3.00, 0.02) | 0.054 | 0.244 | -1.11 (-5.12, 2.90) | 0.589 | 0.6311 |
| WHR levels | ||||||
| <0.04 | Ref | Ref | ||||
| 0.04-0.05 | -0.48 (-4.29, 3.33) | 0.806 | 0.806 | -7.72 (-16.94, 1.49) | 0.105 | 0.315 |
| ≥0.05 | -2.87 (-6.47, 0.74) | 0.122 | 0.244 | -1.00 (-10.49, 8.50) | 0.838 | 0.838 |
| MCS | ||||||
| WHR | -0.36 (-1.23, 0.52) | 0.427 | 0.5124 | -1.20 (-3.10, 0.70) | 0.219 | 0.3568 |
| WHR levels | ||||||
| <0.04 | Ref | Ref | ||||
| 0.04-0.05 | -1.48 (-3.60, 0.63) | 0.172 | 0.2867 | -5.33 (-9.64, -1.01) | 0.018 | 0.18 |
| ≥0.05 | -1.48 (-3.49, 0.53) | 0.150 | 0.2812 | -1.94 (-6.38, 2.51) | 0.396 | 0.4752 |
| Vitality | ||||||
| WHR | -1.43 (-3.15, 0.29) | 0.105 | 0.244 | -3.13 (-6.86, 0.59) | 0.104 | 0.315 |
| WHR levels | ||||||
| <0.04 | Ref | Ref | ||||
| 0.04-0.05 | -1.57 (-5.75, 2.61) | 0.462 | 0.5331 | -9.92 (-18.52, -1.32) | 0.027 | 0.18 |
| ≥0.05 | -3.61 (-7.58, 0.35) | 0.076 | 0.244 | -5.92 (-14.77, 2.94) | 0.195 | 0.3568 |
| Social functioning | ||||||
| WHR | -1.03 (-2.91, 0.86) | 0.287 | 0.3743 | -3.02 (-7.22, 1.18) | 0.163 | 0.3568 |
| WHR levels | ||||||
| <0.04 | Ref | Ref | ||||
| 0.04-0.05 | -3.20 (-7.75, 1.35) | 0.170 | 0.2867 | -10.93 (-20.58, -1.29) | 0.030 | 0.18 |
| ≥0.05 | -3.77 (-8.08, 0.54) | 0.088 | 0.244 | -4.80 (-14.74, 5.13) | 0.347 | 0.4752 |
| Role-emotional | ||||||
| WHR | -2.50 (-4.61, -0.38) | 0.022 | 0.132 | -3.08 (-6.96, 0.80) | 0.124 | 0.325 |
| WHR levels | ||||||
| <0.04 | Ref | Ref | ||||
| 0.04-0.05 | -3.29 (-8.68, 2.11) | 0.234 | 0.33 | -8.48 (-17.53, 0.56) | 0.070 | 0.3 |
| ≥0.05 | -4.08 (-9.20, 1.03) | 0.119 | 0.244 | -4.38 (-13.70, 4.93) | 0.360 | 0.4752 |
| Mental health | ||||||
| WHR | -0.99 (-2.52, 0.54) | 0.208 | 0.324 | -1.64 (-5.15, 1.87) | 0.362 | 0.4752 |
| WHR levels | ||||||
| <0.04 | Ref | Ref | ||||
| 0.04-0.05 | -2.23 (-5.94, 1.49) | 0.242 | 0.33 | -9.05 (-17.03, -1.07) | 0.030 | 0.18 |
| ≥0.05 | -2.89 (-6.42, 0.63) | 0.109 | 0.244 | -2.76 (-10.99, 5.46) | 0.513 | 0.57 |
Association between WHR and life quality in pathological classification subgroups.
WHR, white blood cell to hemoglobin ratio; CI, confidence interval; PCS, Physical Health Score; Ref; reference; MCS, Mental Health Score.
Table 7
| Variables | Pelvic pain: No | Pelvic pain: Yes | ||||
|---|---|---|---|---|---|---|
| β (95% CI) | P | q | β (95% CI) | P | q | |
| PCS | ||||||
| WHR | -1.66 (-2.35, -0.98) | <0.001 | 0.015 | -0.81 (-2.85, 1.24) | 0.444 | 0.6343 |
| WHR levels | ||||||
| <0.04 | Ref | Ref | ||||
| 0.04-0.05 | -0.27 (-1.85, 1.31) | 0.739 | 0.739 | -7.54 (-12.60, -2.47) | 0.005 | 0.0375 |
| ≥0.05 | -2.24 (-3.82, -0.65) | 0.006 | 0.0257 | -3.14 (-8.20, 1.92) | 0.229 | 0.5057 |
| Physical functioning | ||||||
| WHR | -3.20 (-4.42, -1.97) | <0.001 | 0.015 | -1.90 (-5.01, 1.21) | 0.236 | 0.5057 |
| WHR levels | ||||||
| <0.04 | Ref | Ref | ||||
| 0.04-0.05 | 0.58 (-2.24, 3.40) | 0.686 | 0.7097 | -12.24 (-19.93, -4.56) | 0.003 | 0.03 |
| ≥0.05 | -4.35 (-7.18, -1.52) | 0.003 | 0.015 | -6.95 (-14.62, 0.72) | 0.080 | 0.24 |
| Role-physical | ||||||
| WHR | -2.95 (-4.75, -1.15) | 0.002 | 0.015 | -0.44 (-4.43, 3.55) | 0.830 | 0.8669 |
| WHR levels | ||||||
| <0.04 | Ref | Ref | ||||
| 0.04-0.05 | -2.35 (-6.41, 1.71) | 0.259 | 0.2988 | -11.03 (-21.08, -0.98) | 0.035 | 0.1167 |
| ≥0.05 | -4.59 (-8.66, -0.52) | 0.029 | 0.0725 | -1.77 (-11.80, 8.27) | 0.731 | 0.8669 |
| Bodily pain | ||||||
| WHR | -2.28 (-3.67, -0.89) | 0.002 | 0.015 | 0.66 (-3.67, 4.98) | 0.766 | 0.8669 |
| WHR levels | ||||||
| <0.04 | Ref | Ref | ||||
| 0.04-0.05 | -3.03 (-6.18, 0.11) | 0.061 | 0.1076 | -13.42 (-24.15, -2.69) | 0.017 | 0.0675 |
| ≥0.05 | -2.99 (-6.14, 0.16) | 0.065 | 0.1083 | -1.37 (-12.09, 9.35) | 0.803 | 0.8669 |
| General health | ||||||
| WHR | -0.98 (-2.19, 0.23) | 0.116 | 0.1657 | -2.06 (-6.33, 2.21) | 0.348 | 0.58 |
| WHR levels | ||||||
| <0.04 | Ref | Ref | ||||
| 0.04-0.05 | -0.68 (-3.58, 2.22) | 0.647 | 0.6932 | -13.87 (-24.61, -3.13) | 0.014 | 0.0675 |
| ≥0.05 | -2.11 (-5.02, 0.80) | 0.158 | 0.1975 | -5.78 (-16.51, 4.94) | 0.294 | 0.5188 |
| MCS | ||||||
| WHR | -0.57 (-1.30, 0.16) | 0.128 | 0.1735 | -0.51 (-2.55, 1.54) | 0.629 | 0.7863 |
| WHR levels | ||||||
| <0.04 | Ref | Ref | ||||
| 0.04-0.05 | -1.47 (-3.07, 0.14) | 0.075 | 0.1184 | -7.22 (-12.27, -2.17) | 0.007 | 0.042 |
| ≥0.05 | -1.69 (-3.30, -0.08) | 0.042 | 0.09 | -2.21 (-7.25, 2.84) | 0.394 | 0.591 |
| Vitality | ||||||
| WHR | -1.93 (-3.35, -0.50) | 0.009 | 0.03 | -1.90 (-6.07, 2.28) | 0.377 | 0.591 |
| WHR levels | ||||||
| <0.04 | Ref | Ref | ||||
| 0.04-0.05 | -2.43 (-5.58, 0.72) | 0.133 | 0.1735 | -13.09 (-23.62, -2.55) | 0.018 | 0.0675 |
| ≥0.05 | -4.40 (-7.55, -1.24) | 0.007 | 0.0262 | -5.93 (-16.45, 4.58) | 0.273 | 0.5188 |
| Social functioning | ||||||
| WHR | -1.87 (-3.45, -0.29) | 0.022 | 0.06 | -1.48 (-5.99, 3.03) | 0.523 | 0.7132 |
| WHR levels | ||||||
| <0.04 | Ref | Ref | ||||
| 0.04-0.05 | -2.06 (-5.58, 1.47) | 0.255 | 0.2988 | -18.61 (-29.56, -7.66) | 0.001 | 0.03 |
| ≥0.05 | -3.72 (-7.25, -0.19) | 0.041 | 0.09 | -7.70 (-18.64, 3.23) | 0.172 | 0.43 |
| Role-emotional | ||||||
| WHR | -2.13 (-3.51, -0.75) | 0.003 | 0.015 | -0.50 (-5.31, 4.30) | 0.838 | 0.8669 |
| WHR levels | ||||||
| <0.04 | Ref | Ref | ||||
| 0.04-0.05 | -3.06 (-6.51, 0.38) | 0.083 | 0.1245 | -9.81 (-22.09, 2.48) | 0.122 | 0.3327 |
| ≥0.05 | -4.42 (-7.87, -0.97) | 0.013 | 0.039 | -0.82 (-13.08, 11.45) | 0.896 | 0.896 |
| Mental health | ||||||
| WHR | -1.38 (-2.76, 0.00) | 0.051 | 0.0956 | -1.02 (-4.63, 2.59) | 0.581 | 0.7578 |
| WHR levels | ||||||
| <0.04 | Ref | Ref | ||||
| 0.04-0.05 | -1.64 (-4.70, 1.41) | 0.293 | 0.3256 | -14.66 (-23.41, -5.91) | 0.002 | 0.03 |
| ≥0.05 | -3.08 (-6.15, -0.02) | 0.050 | 0.0956 | -4.82 (-13.56, 3.91) | 0.283 | 0.5188 |
Association between WHR and life quality in pelvic pain subgroups.
WHR, white blood cell to hemoglobin ratio; CI, confidence interval; PCS, Physical Health Score; Ref; reference; MCS, Mental Health Score.
Bold values indicate statistical significance at the 2-sided P < 0.05.
Table 8
| Variables | Only left/right adhesion | Left/right adhesion combined with rectum-vagina | ||||
|---|---|---|---|---|---|---|
| β (95% CI) | P | q | β (95% CI) | P | q | |
| PCS | ||||||
| WHR | -1.35 (-2.53, -0.18) | 0.026 | 0.168 | -1.84 (-2.97, -0.71) | 0.002 | 0.02 |
| WHR levels | ||||||
| <0.04 | Ref | Ref | ||||
| 0.04-0.05 | -2.76 (-5.65, 0.12) | 0.064 | 0.2588 | -1.99 (-4.49, 0.50) | 0.120 | 0.1385 |
| ≥0.05 | -3.13 (-5.88, -0.38) | 0.028 | 0.168 | -2.84 (-5.39, -0.29) | 0.031 | 0.06 |
| Physical functioning | ||||||
| WHR | -2.69 (-4.61, -0.76) | 0.008 | 0.12 | -3.67 (-5.47, -1.86) | <0.001 | 0.02 |
| WHR levels | ||||||
| <0.04 | Ref | Ref | ||||
| 0.04-0.05 | -5.40 (-10.13, -0.68) | 0.028 | 0.168 | -2.09 (-6.10, 1.92) | 0.309 | 0.309 |
| ≥0.05 | -6.35 (-10.84, -1.85) | 0.007 | 0.12 | -5.78 (-9.88, -1.68) | 0.007 | 0.035 |
| Role-physical | ||||||
| WHR | -2.41 (-5.47, 0.65) | 0.126 | 0.3035 | -2.68 (-4.97, -0.38) | 0.024 | 0.0554 |
| WHR levels | ||||||
| <0.04 | Ref | Ref | ||||
| 0.04-0.05 | -6.10 (-13.58, 1.39) | 0.114 | 0.3035 | -4.09 (-9.11, 0.92) | 0.112 | 0.1344 |
| ≥0.05 | -6.70 (-13.82, 0.42) | 0.069 | 0.2588 | -3.47 (-8.60, 1.66) | 0.187 | 0.2004 |
| Bodily pain | ||||||
| WHR | -0.03 (-2.64, 2.58) | 0.981 | 0.981 | -2.97 (-5.27, -0.66) | 0.013 | 0.0382 |
| WHR levels | ||||||
| <0.04 | Ref | Ref | ||||
| 0.04-0.05 | -4.48 (-10.85, 1.89) | 0.172 | 0.3035 | -6.55 (-11.53, -1.57) | 0.011 | 0.0367 |
| ≥0.05 | -0.18 (-6.24, 5.88) | 0.953 | 0.981 | -5.45 (-10.53, -0.36) | 0.038 | 0.0671 |
| General health | ||||||
| WHR | -2.30 (-4.60, -0.01) | 0.052 | 0.2588 | -1.64 (-3.98, 0.70) | 0.171 | 0.19 |
| WHR levels | ||||||
| <0.04 | Ref | Ref | ||||
| 0.04-0.05 | -1.76 (-7.75, 4.22) | 0.565 | 0.6467 | -5.01 (-10.05, 0.02) | 0.053 | 0.0723 |
| ≥0.05 | -4.75 (-10.45, 0.95) | 0.106 | 0.3035 | -2.76 (-7.91, 2.39) | 0.296 | 0.3062 |
| MCS | ||||||
| WHR | -0.22 (-1.53, 1.10) | 0.749 | 0.8025 | -1.17 (-2.34, 0.00) | 0.052 | 0.0723 |
| WHR levels | ||||||
| <0.04 | Ref | Ref | ||||
| 0.04-0.05 | -1.54 (-4.78, 1.69) | 0.352 | 0.48 | -3.80 (-6.29, -1.32) | 0.003 | 0.0225 |
| ≥0.05 | -1.56 (-4.64, 1.51) | 0.322 | 0.46 | -2.48 (-5.03, 0.06) | 0.058 | 0.0757 |
| Vitality | ||||||
| WHR | -1.57 (-4.41, 1.28) | 0.283 | 0.4245 | -2.89 (-5.08, -0.71) | 0.010 | 0.0367 |
| WHR levels | ||||||
| <0.04 | Ref | Ref | ||||
| 0.04-0.05 | -1.98 (-8.97, 5.02) | 0.582 | 0.6467 | -6.40 (-11.12, -1.69) | 0.009 | 0.0367 |
| ≥0.05 | -4.72 (-11.38, 1.94) | 0.168 | 0.3035 | -5.38 (-10.20, -0.56) | 0.030 | 0.06 |
| Social functioning | ||||||
| WHR | -1.08 (-4.10, 1.95) | 0.488 | 0.61 | -2.76 (-5.26, -0.26) | 0.032 | 0.06 |
| WHR levels | ||||||
| <0.04 | Ref | Ref | ||||
| 0.04-0.05 | -4.59 (-11.99, 2.80) | 0.227 | 0.3584 | -7.69 (-13.04, -2.35) | 0.005 | 0.03 |
| ≥0.05 | -5.35 (-12.38, 1.69) | 0.140 | 0.3035 | -5.64 (-11.11, -0.17) | 0.045 | 0.0723 |
| Role-emotional | ||||||
| WHR | -2.07 (-4.97, 0.84) | 0.167 | 0.3035 | -4.14 (-6.67, -1.61) | 0.002 | 0.02 |
| WHR levels | ||||||
| <0.04 | Ref | Ref | ||||
| 0.04-0.05 | -5.34 (-12.85, 2.17) | 0.167 | 0.3035 | -5.71 (-11.27, -0.15) | 0.046 | 0.0723 |
| ≥0.05 | -2.36 (-9.50, 4.79) | 0.520 | 0.624 | -6.76 (-12.44, -1.07) | 0.021 | 0.0525 |
| Mental health | ||||||
| WHR | -0.79 (-2.90, 1.32) | 0.467 | 0.6091 | -2.21 (-4.42, 0.00) | 0.052 | 0.0723 |
| WHR levels | ||||||
| <0.04 | Ref | Ref | ||||
| 0.04-0.05 | -3.63 (-8.79, 1.53) | 0.171 | 0.3035 | -6.04 (-10.78, -1.30) | 0.014 | 0.0382 |
| ≥0.05 | -3.24 (-8.14, 1.67) | 0.200 | 0.3333 | -4.65 (-9.50, 0.20) | 0.062 | 0.0775 |
Association between WHR and life quality in lysis of adhesion subgroups.
WHR, white blood cell to hemoglobin ratio; CI, confidence interval; PCS, Physical Health Score; Ref; reference; MCS, Mental Health Score.
Note on multiplicity (applies to subgroup tables): P-values have been adjusted within each table using the Benjamini–Hochberg procedure to control the false discovery rate (FDR); adjusted values are shown as “q=” appended to P. Significance for subgroups was defined as q<0.05 (q<0.10 considered suggestive).
According to Table 2, an elevated WHR was associated with decreased scores of PCS (β=-1.42, 95%CI: -2.20, -0.65, P < 0.001), physical functioning (β=-2.82, 95%CI: -4.06, -1.58, P < 0.001), role-physical (β=-2.21, 95%CI: -3.94, -0.49, P = 0.012), vitality (β=-2.00, 95%CI: -3.59, -0.41, P = 0.014) and role-emotional (β=-2.41, 95%CI: -4.23, -0.59, P = 0.010) in SF-36 scale, after adjusting for all selected covariates. Compared to WHR level of <0.04, EM patients with WHR level of [0.04-0.05) or ≥0.05 had decreased scores of PCS, physical functioning, role-physical, vitality, social functioning, role-emotional and mental health (raw P < 0.05). Also, associations of WHR level of [0.04-0.05) with decreased scores of bodily pain (β=-5.26, 95%CI: -9.14, -1.38, P = 0.008), general health (β=-4.00, 95%CI: -7.73, -0.28, P = 0.036) and MCS (β=-2.78, 95%CI: -4.66, -0.90, P = 0.004) were significant, compared to WHR level of <0.04.
Association between WHR and the quality of life in different subgroups
Prespecified subgroup analyses (age, BMI, rASRM stage, phenotype, pelvic pain, adhesion type) showed directionally consistent associations. After Benjamini–Hochberg FDR control within each subgroup family, the inverse WHR–PCS association remained significant in age<40, BMI<24 kg/m², rASRM stage IV, ovary/peritoneal phenotype, pelvic pain: no, and left/right adhesion combined with rectum–vaginal adhesion (q<0.05), whereas other contrasts did not survive multiplicity adjustment and should be interpreted as exploratory (Tables 3-8). Domain-level patterns were similar but attenuated after FDR, with q<0.05 observed mainly in PF, BP, VT, RP and RE within selected strata.
Discussion
In this single-center cohort of women undergoing laparoscopic surgery for endometriosis (EM), higher pre-operative white-blood-cell-to-hemoglobin ratio (WHR)—a composite reflecting systemic inflammation (WBC) and anemia/oxygen-carrying capacity (Hb)—was associated with lower postoperative health-related quality of life (HRQoL) at 3 months, particularly the Physical Component Summary (PCS) and the domains of physical functioning, role-physical, vitality and role-emotional, after covariate adjustment. Tertile groupings were used only for description, whereas primary inference treated WHR as a continuous exposure, given the absence of disease-specific clinical cut-offs for EM and non-transportability of oncology thresholds with differing unit conventions.
Mechanistic considerations. The observed associations are biologically plausible and now supported by converging clinical and experimental evidence. First, EM features chronic low-grade inflammation with altered peritoneal immune milieu and cytokine signaling that track pain and symptom burden (5) (14, 15). Inflammation is also a robust prognostic signal for adverse surgical outcomes broadly (6). Second, anemia is common perioperatively and in EM (e.g., menorrhagia/iron loss), and is itself linked to worse recovery, fatigue and functional limitation (7, 8). Mechanistically, inflammation drives hepcidin-mediated iron sequestration (anemia of inflammation), reducing Hb and tissue oxygen delivery (16). Third, lower Hb and impaired oxygen transport correlate with poorer SF-36 functioning and pain in other chronic populations, supporting a pathway from anemia to reduced physical and social functioning (17). Fourth, inflammation and oxidative stress engage neuroimmune circuits (microglial activation, mitochondrial dysfunction, neurotransmitter alterations) that are implicated in fatigue, low vitality and depressive symptoms (18) (19) (20) (21). Together, these data outline a dual-axis model—inflammation (↑WBC) and anemia (↓Hb)—by which higher WHR could plausibly contribute to lower postoperative HRQoL in EM via impaired oxygen delivery, neuroinflammation, and sensitization of pain-affect networks. While our observational design precludes causal inference, these independent strands of clinical and mechanistic literature provide a coherent framework consistent with our findings.
Clinical applicability and subgroups. We envision WHR as a complementary risk indicator—not a stand-alone rule—to help flag patients at higher risk of poorer physical recovery at 3 months. In our prespecified subgroup analyses (age, BMI, rASRM stage, phenotype, pelvic pain, adhesion type), patterns were broadly consistent; after false-discovery-rate control, the inverse WHR-PCS association persisted in selected strata, supporting internal consistency of the signal, whereas other contrasts did not survive multiplicity adjustment and should be viewed as exploratory (see Tables 3-8 for raw P and q). In practice, WHR may be most informative when integrated with advanced stage, ovarian/peritoneal phenotype, or anemia risk (e.g., heavy bleeding/iron deficiency (8) (16)) and symptom profiles where pain is less dominant (consistent with peritoneal immune correlates of pain rather than lesion volume (14) (15)). Clinically actionable steps could include: (i) targeted pre-/post-operative anemia assessment and iron studies in high-WHR patients; (ii) optimization of anti-inflammatory and hormonal management per guidelines; and (iii) closer HRQoL follow-up and rehabilitation emphasis on fatigue and physical function domains. These proposals are hypothesis-generating and require prospective testing.
MCID and interpretation of effect sizes. To aid clinical interpretation, we considered distribution-based anchors (~0.5 SD) commonly used in HRQoL research to approximate the minimal clinically important difference (MCID) for SF-36 subscales (16) (22) (23) (24). Against this benchmark, the observed decrements in physical functioning and vitality with higher WHR may approach clinical importance in aggregate, even if mean differences are modest. Because MCIDs can vary by population, baseline severity and domain, we refrain from asserting a single numeric cut-off and instead present β estimates with 95% CIs alongside this anchor to facilitate transparent, context-specific interpretation.
Multiplicity, precision and residual confounding. Multiple subgroup contrasts increase the risk of false positives; we therefore controlled the false discovery rate (Benjamini–Hochberg) and emphasize effect sizes and precision over dichotomous significance. After adjustment, false negatives remain possible given limited subgroup sizes. Although we adjusted for key clinical factors, residual confounding (e.g., postoperative hormonal suppression, iron-deficiency status, baseline pain) cannot be excluded, and findings should be interpreted as associational.
Strengths, limitations and next steps. Strengths include a novel focus on EM HRQoL, a comprehensive validated instrument (SF-36) (16) (22) (23) (24), prespecified modelling, and minimal missingness with consistent complete-case and imputed results (Supplementary Tables S1-S2). Limitations include the retrospective single-center design and potential referral bias (higher proportion of advanced disease), which may constrain generalizability. Prospective, multicenter studies with repeated HRQoL measures, granular iron indices and inflammatory markers, and derivation/validation of EM-specific WHR thresholds are warranted to confirm clinical utility and define for whom WHR-guided pathways add the most value.
Statements
Data availability statement
The original contributions presented in the study are included in the article/Supplementary Material. Further inquiries can be directed to the corresponding authors.
Ethics statement
The studies involving humans were approved by the Ethics Committee of the First Affiliated Hospital of Ningbo University (No. XJS20191212). The studies were conducted in accordance with the local legislation and institutional requirements. The participants provided their written informed consent to participate in this study. Written informed consent was obtained from the individual(s) for the publication of any potentially identifiable images or data included in this article.
Author contributions
WS: Writing – original draft, Data curation. HC: Investigation, Data curation, Writing – original draft, Methodology, Formal analysis. XZ: Investigation, Writing – review & editing, Resources, Visualization. YC: Data curation, Formal analysis, Methodology, Conceptualization, Writing – review & editing, Investigation. JZh: Supervision, Conceptualization, Validation, Writing – review & editing. JZ: Conceptualization, Writing – review & editing, Validation, Supervision.
Funding
The author(s) declare financial support was received for the research and/or publication of this article. This work was supported by Zhejiang Province Major Health and Wellness Science and Technology Project Fund (Grant numbers: WKJ-ZJ-2447), Ningbo Clinical Medical Research Center for Gynecological Diseases (Grant numbers: 2024L002) and Ningbo Top Medical and Health Research Program (Grant numbers: 2024021020).
Conflict of interest
The authors declare that the research was conducted in the absence of any commercial or financial relationships that could be construed as a potential conflict of interest.
Generative AI statement
The author(s) declare that no Generative AI was used in the creation of this manuscript.
Any alternative text (alt text) provided alongside figures in this article has been generated by Frontiers with the support of artificial intelligence and reasonable efforts have been made to ensure accuracy, including review by the authors wherever possible. If you identify any issues, please contact us.
Publisher’s note
All claims expressed in this article are solely those of the authors and do not necessarily represent those of their affiliated organizations, or those of the publisher, the editors and the reviewers. Any product that may be evaluated in this article, or claim that may be made by its manufacturer, is not guaranteed or endorsed by the publisher.
Supplementary material
The Supplementary Material for this article can be found online at: https://www.frontiersin.org/articles/10.3389/fendo.2025.1655476/full#supplementary-material
References
1
Blanco LP Salmeri N Temkin SM Shanmugam VK Stratton P . Endometriosis and autoimmunity. Autoimmun Rev. (2025) 24:103752. doi: 10.1016/j.autrev.2025.103752
2
Nezhat FR Cathcart AM Nezhat CH Nezhat CR . Pathophysiology and clinical implications of ovarian endometriomas. Obstet Gynecol. (2024) 143:759–66. doi: 10.1097/AOG.0000000000005587
3
Van Niekerk L Pugh S Mikocka-Walus A Ng C O’Hara R Armour M et al . An evaluation of sexual function and health-related quality of life following laparoscopic surgery in individuals living with endometriosis. Hum Reprod. (2024) 39:992–1002. doi: 10.1093/humrep/deae063
4
Comptour A Pereira B Lambert C Chauvet P Gremeau AS Pouly JL et al . Identification of predictive factors in endometriosis for improvement in patient quality of life. J Minim Invasive Gynecol. (2020) 27:712–20. doi: 10.1016/j.jmig.2019.05.013
5
Orisaka M Mizutani T Miyazaki Y Shirafuji A Tamamura C Fujita M et al . Chronic low-grade inflammation and ovarian dysfunction in women with polycystic ovarian syndrome, endometriosis, and aging. Front Endocrinol (Lausanne). (2023) 14:1324429. doi: 10.3389/fendo.2023.1324429
6
Baskaran G Heo RH Wang MK Meyre PB Park L Blum S et al . Associations of inflammatory biomarkers with morbidity and mortality after noncardiac surgery: A systematic review and meta-analysis. J Clin Anesth. (2024) 97:111540. doi: 10.1016/j.jclinane.2024.111540
7
Warner MA Shore-Lesserson L Shander A Patel SY Perelman SI Guinn NR . Perioperative anemia: prevention, diagnosis, and management throughout the spectrum of perioperative care. Anesth Analg. (2020) 130:1364–80. doi: 10.1213/ANE.0000000000004727
8
Gete DG Doust J Mortlock S Montgomery G Mishra GD . Risk of iron deficiency in women with endometriosis: A population-based prospective cohort study. Womens Health Issues. (2024) 34:317–24. doi: 10.1016/j.whi.2024.03.004
9
Gao T Wang Y . Association between white blood cell count to hemoglobin ratio and risk of in-hospital mortality in patients with lung cancer. BMC Pulm Med. (2023) 23:305. doi: 10.1186/s12890-023-02600-7
10
Zheng HL Lu J Xie JW Wang JB Lin JX Chen QY et al . Huang ZN et al: Exploring the value of new preoperative inflammation prognostic score: white blood cell to hemoglobin for gastric adenocarcinoma patients. BMC Cancer. (2019) 19:1127. doi: 10.1186/s12885-019-6213-0
11
Shen X Wang W Niu X . Neutrophil lymphocyte ratio to albumin ratio and white blood cell to hemoglobin ratio as prognostic markers for hepatocellular carcinoma patients who underwent curative hepatectomy. Int J Gen Med. (2021) 14:5029–38. doi: 10.2147/IJGM.S329911
12
Li K Yan J Zhang H Lu C Wang W Guo M et al . Prognostic value of preoperative white blood cell to hemoglobin ratio and fibrinogen to albumin ratio in patients with colorectal cancer. Med (Baltimore). (2024) 103:e37031. doi: 10.1097/MD.0000000000037031
13
Sterne JA White IR Carlin JB Spratt M Royston P Kenward MG et al . Multiple imputation for missing data in epidemiological and clinical research: potential and pitfalls. Bmj. (2009) 338:b2393. doi: 10.1136/bmj.b2393
14
Zhou J Chern BSM Barton-Smith P Phoon JWL Tan TY Viardot-Foucault V et al . Peritoneal fluid cytokines reveal new insights of endometriosis subphenotypes. Int J Mol Sci. (2020) 21. doi: 10.3390/ijms21103515
15
Gibson DA Collins F De Leo B Horne AW Saunders PTK . Pelvic pain correlates with peritoneal macrophage abundance not endometriosis. Reprod Fertil. (2021) 2:47–57. doi: 10.1530/RAF-20-0072
16
Lanser L Fuchs D Kurz K Weiss G . Physiology and inflammation driven pathophysiology of iron homeostasis-mechanistic insights into anemia of inflammation and its treatment. Nutrients. (2021) 13. doi: 10.3390/nu13113732
17
Arogundade FA Zayed B Daba M Barsoum RS . Correlation between Karnofsky Performance Status Scale and Short-Form Health Survey in patients on maintenance hemodialysis. J Natl Med Assoc. (2004) 96:1661–7.
18
Correia AS Cardoso A Vale N . Oxidative stress in depression: the link with the stress response, neuroinflammation, serotonin, neurogenesis and synaptic plasticity. Antioxidants (Basel). (2023) 12. doi: 10.3390/antiox12020470
19
Ji N Lei M Chen Y Tian S Li C Zhang B . How oxidative stress induces depression? ASN Neuro. (2023) 15:17590914231181037. doi: 10.1177/17590914231181037
20
Mensah E Ali K Banya W Kirkham FA Mengozzi M Ghezzi P et al . FRailty and Arterial stiffness - the role of oXidative stress and Inflammation (FRAXI study). biomark Insights. (2022) 17:11772719221130719. doi: 10.1177/11772719221130719
21
Koller D Pathak GA Wendt FR Tylee DS Levey DF Overstreet C et al . Epidemiologic and genetic associations of endometriosis with depression, anxiety, and eating disorders. JAMA Netw Open. (2023) 6:e2251214. doi: 10.1001/jamanetworkopen.2022.51214
22
Moradi M Parker M Sneddon A Lopez V Ellwood D . Impact of endometriosis on women’s lives: a qualitative study. BMC Womens Health. (2014) 14:123. doi: 10.1186/1472-6874-14-123
23
Garry R Clayton R Hawe J . The effect of endometriosis and its radical laparoscopic excision on quality of life indicators. Bjog. (2000) 107:44–54. doi: 10.1111/j.1471-0528.2000.tb11578.x
24
Jones GL Kennedy SH Jenkinson C . Health-related quality of life measurement in women with common benign gynecologic conditions: a systematic review. Am J Obstet Gynecol. (2002) 187:501–11. doi: 10.1067/mob.2002.124940
Summary
Keywords
WHR, endometriosis, life quality, laparoscopic surgery, SF-36
Citation
Shen W, Chen H, Zhou X, Chen Y, Zhu J and Zhang J (2025) Association of white blood cell count to hemoglobin ratio with the life quality after laparoscopic surgery in patients with endometriosis. Front. Endocrinol. 16:1655476. doi: 10.3389/fendo.2025.1655476
Received
27 June 2025
Accepted
23 September 2025
Published
13 October 2025
Volume
16 - 2025
Edited by
Meng Mei, Wuhan Medical Center for Women and Children, China
Reviewed by
Fengyi Xiao, Fudan University, China
Cipta Pramana, Faculty of Medicine Universitas Islam Negeri Walisongo Semarang, Indonesia
Updates
Copyright
© 2025 Shen, Chen, Zhou, Chen, Zhu and Zhang.
This is an open-access article distributed under the terms of the Creative Commons Attribution License (CC BY). The use, distribution or reproduction in other forums is permitted, provided the original author(s) and the copyright owner(s) are credited and that the original publication in this journal is cited, in accordance with accepted academic practice. No use, distribution or reproduction is permitted which does not comply with these terms.
*Correspondence: Jue Zhu, feyyzhujue@nbu.edu.cn; Jing Zhang, zhangjyy1978@163.com
†These authors have contributed equally to this work and share first authorship
Disclaimer
All claims expressed in this article are solely those of the authors and do not necessarily represent those of their affiliated organizations, or those of the publisher, the editors and the reviewers. Any product that may be evaluated in this article or claim that may be made by its manufacturer is not guaranteed or endorsed by the publisher.